Patent application title: HIGH-RESOLUTION TRANSCRIPTOME OF HUMAN MACROPHAGES
Inventors:
Joachim Schultze (Konigswinter, DE)
Michael Mallmann (Bonn, DE)
Assignees:
BECTON, DICKINSON AND COMPANY
Rheinische Friedrich-Wilhelms-Universitat Bonn
IPC8 Class: AC12Q168FI
USPC Class:
506 2
Class name: Combinatorial chemistry technology: method, library, apparatus method specially adapted for identifying a library member
Publication date: 2015-02-26
Patent application number: 20150057161
Abstract:
The invention is based on the finding of specific surface markers for
M1-like (classically activated) and M2-like (alternatively activated)
macrophages and provides for a method for the identification,
characterization and isolation of M1-like and M2-like macrophages based
on the abundance of said surface markers and for means for performing
such method.Claims:
1. A method for identifying of, distinguishing between and isolating of
M1-like and M2-like macrophages which comprises characterizing the
macrophages based on the relative abundance of one or more of the
specific M1-associated cell surface markers CD120b, TLR2 and SLAMF7, or
of one or more of the specific M2-associated cell surface markers CD1a,
CD1b, CD93 and CD226, respectively.
2. The method of claim 1, wherein the relative abundance of the M1-associated cell surface markers is higher in M1-like macrophages than in M2-like macrophages and the relative abundance of the M2-associated cell surface markers is higher in M2-like macrophages than in M1-like macrophages.
3. The method of claim 1, wherein the identifying of and distinguishing between the M1-like and M2-like macrophages is performed by an amplification or by a targeted resequencing of one or more of the specific M1-associated cell surface marker nucleic acids CD120b, TLR2 and SLAMF7 (SEQ ID NOs: 1, 3 and 5), or of one or more of the specific M2-associated cell surface marker nucleic acids CD1a, CD1b, CD93 and CD226 (SEQ ID NOs: 7, 9, 11 and 13), respectively, of the macrophage, and a subsequent detection of the amplification/resequencing product.
4. The method of claim 3, wherein the amplification/resequencing employs one or more primers derived from each of the marker genes.
5. The method of claim 1, wherein the identifying of and distinguishing between the M1-like and M2-like macrophages comprises hybridizing one or more probes selective for one of the specific M1-associated cell surface marker nucleic acids CD120b, TLR2 and SLAMF7 (SEQ ID NOs: 1, 3 and 5), or for one of the specific M2-associated cell surface marker nucleic acids CD1a, CD1b, CD93 and CD226 (SEQ ID NOs: 7, 9, 11 and 13), respectively, of the macrophage.
6. The method of claim 5, which is performed on a hybridization array.
7. The method of claim 1, wherein the identifying of, distinguishing between and isolating of the M1-like and M2-like macrophages comprises contacting the macrophages with one or more binding molecules directed against the specific M1-associated cell surface marker protein CD120b, TLR2 and SLAMF7 (SEQ ID NOs: 2, 4 and 6), or with one or more binding molecules directed against the specific M2-associated cell surface marker nucleic acids CD1a, CD1b, CD93 and CD226 (SEQ ID NOs: 8, 10, 12 and 14), respectively.
8. The method of claim 7, wherein the binding molecules (i) are antibodies; and/or (ii) are labeled with maker molecules.
9. The method of claim 8, wherein the binding molecules are selected from FITC-labeled CD1b, CD93, CD226 and anti-TLR2; PE-labeled CD120b and anti-SLAMF7; PE-Cy5-labeled CD1a monoclonal antibodies.
10. The method according to claim 7, which is performed on a FACS sorter.
11. A kit for performing the method according to claim 1, which comprises at least one reagent for identifying of, distinguishing between and isolating of M1-like macrophages and at least one reagent for identifying of, distinguishing between and isolating of M2-like macrophages, said reagents being selected from (i) one or more primers derived from one or more of the specific M1-associated cell surface marker nucleic acids CD120b, TLR2 and SLAMF7 (SEQ ID NOs: 1, 3 and 5), or of one or more of the specific M2-associated cell surface marker nucleic acids CD1a, CD1b, CD93 and CD226 (SEQ ID NOs: 7, 9, 11 and 13), respectively, of the macrophage, (ii) one or more probes selective for one of the specific M1-associated cell surface marker nucleic acids CD120b, TLR2 and SLAMF7 (SEQ ID NOs: 1, 3 and 5), or for one of the specific M2-associated cell surface marker nucleic acids CD1a, CD1b, CD93 and CD226 (SEQ ID NOs: 7, 9, 11 and 13), respectively, of the macrophage, (iii) a hybridization array, or (iv) one or more binding molecules directed against the specific M1-associated cell surface marker protein CD120b, TLR2 and SLAMF7 (SEQ ID NOs: 2, 4 and 6), or directed against the specific M2-associated cell surface marker nucleic acids CD1a, CD1b, CD93 and CD226 (SEQ ID NOs: 8, 10, 12 and 14), respectively.
12. Method of using antibodies selected from CD120b, TLR2 and SLAMF7 antibodies for identifying, characterizing and isolating M1-like macrophages.
13. Method of using antibodies selected from CD1a, CD1b, CD93 and CD226 antibodies for identifying, characterizing and isolating M2-like macrophages.
14. A population of M1-like macrophages isolated by the method of claim 7.
15. A population of M2-like macrophages isolated by the method of claim 7.
Description:
[0001] The invention is based on the finding of specific surface markers
for M1-like and M2-like macrophages and provides for a method for the
identification, characterization and isolation of M1-like (classically
activated) and M2-like (alternatively activated) macrophages based on the
abundance of said surface markers and for means for performing such
method.
BACKGROUND OF THE INVENTION
[0002] Macrophages represent resident phagocytic cells in the tissue and are involved in tissue homeostasis and induction of inflammatory reaction towards pathogens by use of their broad range of pattern-recognition receptors (Geissmann F. et al., Science 327(5966):656-661 (2010)). In context of the respective immune response, macrophages are polarized to specific functional properties, often referred to as M1-like and M2-like phenotype. Classically polarized M1-like macrophages can be induced by IFN-γ alone or together with LPS or TNF-α using M-CSF or GM-CSF (Martinez F. O. et al., The Journal of Immunology 177(10):7303-7311 (2006)). M1-like macrophages are effector cells of classical inflammatory immune responses exerting an IL-12high, IL-23high and IL-10low phenotype with secretion of inflammatory cytokines IL-1β, IL-6 and TNF-α. They display a phenotype characterized by the expression of CD86, CD64, and CD16 (Biswas S. K., Mantovani A., Nat Immunol. 11(10):889-896 (2010); Mantovani A., Sica A., Curr Opin Immunol. 22(2):231-237 (2010)). In contrast, macrophages that are activated by other mechanisms than IFN-γ/LPS/TNF-α are grouped in the alternatively activated M2-like macrophage subset. Non-classically activated macrophages can be induced by cytokines including IL-4 and IL-13, but other stimuli have been described as well (Biswas S. K., Mantovani A., Nat Immunol. 11(10):889-896 (2010); Mantovani A., Sica A., Curr Opin Immunol. 22(2):231-237 (2010)). These cells share an IL-12low and IL-23low phenotype and express CD23. Over the last decade, phenotypic adaptations of macrophages to environmental stimuli have been linked to radical changes in transcriptional regulation mainly by applying microarray-based gene expression profiling (Martinez F. O. et al., The Journal of Immunology 177(10):7303-7311 (2006); Gustafsson C, Mjosberg J, Matussek A. et al., PLoS One. 3(4):e2078 (2008); Lehtonen A. et al., J Leukoc Biol. 82(3):710-720 (2007); Nau G. J. et al., Proc Natl Acad Sci USA 99(3):1503-1508 (2002)). In fact, a large amount of data covering transcriptional reprogramming of macrophages has been accumulated, albeit not always systematic (Martinez F. O. et al., The Journal of Immunology 177(10):7303-7311 (2006); Gustafsson C. et al., PLoS One. 3(4):e2078 (2008); Lehtonen A. et al., J Leukoc Biol. 82(3):710-720 (2007); Nau G. J. et al., Proc Natl Acad Sci USA 99(3):1503-1508 (2002); Heng T. S. et al., Nat Immunol. 9(10):1091-1094 (2008)). However, molecular mechanisms controlling transcriptional reprogramming in macrophages are far from understood and it has been suggested that integrative analyses of epigenomic and transcriptomic data will be required to better understand how macrophages integrate the information they receive from their respective microenvironment (Lawrence T., Natoli G., Nat Rev Immunol. 11(11):750-761 (2011)), enabling the identification of specific transcription factor combinations being responsible for cellular macrophage programs.
[0003] The introduction of RNA sequencing (RNA-seq) to interrogate whole transcriptomes has challenged previously established gene expression profiling studies (Ozsolak F., Milos P. M., Nature reviews Genetics 12(2):87-98 (2011); Wang Z, Gerstein M, Snyder M., Nature reviews Genetics 10(1):57-63 (2009); Marioni J. C. et al., Genome Res. 18(9):1509-1517 (2008)). Advantages assigned to RNA-seq over microarray analysis include increases in transcript quantity and quality, improved detection of alternative splicing events and gene fusion transcripts, and a larger dynamic range of detection (Ozsolak F., Milos P. M., Nature reviews Genetics 12(2):87-98 (2011); Wang Z. et al., Nature reviews Genetics 10(1):57-63 (2009); Marioni J. C. et al., Genome Res. 18(9):1509-1517 (2008)).
SHORT DESCRIPTION OF THE INVENTION
[0004] To better understand polarization and integration of environmental signals by macrophages and to identify more specific markers for different functional states, high-resolution transcriptome data have been asked for (Murray P. J., Wynn T. A., Nat Rev Immunol. 11(11):723-737 (2011)). Using M1 and M2 polarization as models we applied RNA-seq and compared the information content with data derived by microarray analysis. We provide new insights into human macrophage biology and determine several new markers associated with classical and alternative macrophage polarization in humans.
[0005] The invention thus provides
(1) a method for identifying of, distinguishing between and isolating of M1-like (classically activated) and M2-like (alternatively activated) macrophages which comprises characterizing the macrophages based on the relative abundance of one or more of the specific M1-associated cell surface markers CD120b, TLR2 and SLAMF7, or of one or more of the specific M2-associated cell surface markers CD1a, CD1b, CD93 and CD226, respectively; (2) a preferred embodiment of aspect (1) above, wherein the identifying of and distinguishing between the M1-like and M2-like macrophages is performed by an amplification or by a targeted resequencing of one or more of the specific M1-associated cell surface marker nucleic acids CD120b, TLR2 and SLAMF7 (SEQ ID NOs: 1, 3 and 5), or of one or more of the specific M2-associated cell surface marker nucleic acids CD1a, CD1b, CD93 and CD226 (SEQ ID NOs: 7, 9, 11 and 13), respectively, of the macrophage, notably by utilizing one or more primers derived from each of the marker genes, and a subsequent detection of the amplification/resequencing product; (3) a preferred embodiment of aspect (1) above, wherein the identifying of and distinguishing between the M1-like and M2-like macrophages comprises hybridizing one or more probes selective for one of the specific M1-associated cell surface marker nucleic acids CD120b, TLR2 and SLAMF7 (SEQ ID NOs: 1, 3 and 5), or for one of the specific M2-associated cell surface marker nucleic acids CD1a, CD1b, CD93 and CD226 (SEQ ID NOs: 7, 9, 11 and 13), respectively, of the macrophage; (4) a preferred embodiment of aspect (3) above, wherein the hybridization is performed on a hybridization array; (5) a preferred embodiment of aspect (1) above, wherein the identifying of, distinguishing between and isolating of the M1-like and M2-like macrophages comprises contacting the macrophages with one or more binding molecules directed against the specific M1-associated cell surface marker protein CD120b, TLR2 and SLAMF7 (SEQ ID NOs: 2, 4 and 6), or with one or more binding molecules directed the specific M2-associated cell surface marker nucleic acids CD1a, CD1b, CD93 and CD226 (SEQ ID NOs: 8, 10, 12 and 14), respectively; (6) a kit for performing the method according to (1) to (5) above, which comprises at least one reagent for identifying of, distinguishing between and isolating of M1-like macrophages and/or at least one reagent for identifying of, distinguishing between and isolating of M2-like macrophages, said reagents being selected from (i) one or more primers derived from the marker genes as defined in (2) above, (ii) one or more probes selective for the cell surface marker nucleic acids as defined in (3) above, (iii) a hybridization array as defined in (4) above, or (iv) one or more binding molecule as defined in (5) above; (7) the use of antibodies selected from CD120b, TLR2 and SLAMF7 antibodies for identifying, characterizing and isolating M1-like macrophages; (8) the use of antibodies selected from CD1a, CD1b, CD93 and CD226 antibodies for identifying, characterizing and isolating M2-like macrophages; (9) a population of M1-like macrophages isolated by the method of (5) above; and (10) a population of M2-like macrophages isolated by the method of (5) above.
SHORT DESCRIPTION OF THE FIGURES
[0006] FIG. 1: Phenotypic characterization of human M1- and M2-like macrophages derived from CD14+ peripheral blood monocytes. Expression of typical macrophage lineage markers was determined by flow cytometry (left) of M1- and M2-like macrophages generated in the presence of GM-CSF (upper panel) or M-CSF (lower panel) with quantification shown in the graph at the right. Expression of (a) CD11b, (b) CD14, (c) CD68, (d) HLA-DR, (e) CD64, (f) CD86, and (g) CD23, respectively. *P<0.05 (Student's t-test). Numbers in plots indicate mean fluorescence intensity. Data are representative of nine independent experiments (a,b,d,e,f,g; mean and s.e.m.) or eight independent experiments (c; mean and s.e.m.), each with cells derived from a different donor.
[0007] FIG. 2: Microarray-based RNA fingerprinting of human M1- and M2-like macrophages. (a) Principle component analysis of human unpolarized (M0) and polarized (M1, M2) macrophages. (b) Unsupervised hierarchical clustering of human M0, M1-, and M2-like macrophages. (c) Visualization of known markers for human M1- and M2-like macrophages as a heatmap. Data were z-score normalized. (d) Left: network of genes highly expressed in M1-like macrophages (fold-change >2.0) in comparison to M0 macrophages identified by microarray analysis. Right: data for the comparison of M2-like versus M0 macrophages were loaded into the M1-network. (e) Right: network of genes highly expressed in M2-like macrophages (fold-change >1.65) in comparison to M0 macrophages identified by microarray analysis. Left: data for the comparison of M1-like versus M0 macrophages were loaded into the M2-network. All networks were generated using EGAN.
[0008] FIG. 3: Comparison of RNA-seq and microarray analysis. (a) Number of genes expressed in human M1- (left) and M2-like macrophages (right) as detected using RNA-Seq (black) and microarray analysis (white). (b) Correlation (Spearman) of mean expression values of M1- (left) and M2-like macrophages (right) using RNA-Seq and microarray analysis. (c-d) Comparison of differentially expressed genes detected using RNA-seq or microarray analysis (p<0.05). Differentially expressed genes as assessed by RNA-seq (black) or microarray analysis (white) were divided into groups by their relative expression in (c) M1 versus M2 or (d) M2 versus M1. (e) Gene expression in M1- versus M2-like macrophages as fold change versus fold change plot comparing microarray analysis with RNA-seq using all Refseq genes differentially expressed in RNA-seq. (f) Venn-diagram of differentially expressed genes between M1- and M2-like macrophages in RNA-seq (blue) and microarray analysis (red), (FC>2 p-value <0.05, diff>100 for microarray data). Fold-change-rank plots of genes detected as differentially expressed between M1- and M2-like macrophages (g) by microarray analysis (red) with overlay of values obtained by RNA-seq (blue) or (h) by RNA-seq (blue) with overlay of values obtained by microarray analysis (red). (i) Visualization of known markers for human M1- and M2-like macrophages from FIG. 2c as a heatmap using RNA-seq. Data were z-score normalized.
[0009] FIG. 4: Correlation of RNA-seq, microarray, qPCR, and flow cytometric analysis. (a-d) CD68, (e-h) CD64, and (i-l) CD23 expression in human M1- and M2-like macrophages. (a, e, i) Left, representative images of sequencing reads across the genomic loci of genes expressed in human macrophages. Pictures taken from the Integrative Genomics Viewer (IGV). The height of bars represents the relative accumulated number of 100-bp reads spanning a particular sequence. Gene maps (bottom portion of each panel, oriented 5'-3' direction) are represented by thick (exons) and thin (introns) lines. Right, RPKM values by RNA-seq in M1- and M2-like macrophages. (b, f, j) Left, heatmaps presenting microarray results from M1- and M2-like macrophages from seven donors. Data were z-score normalized. Right, relative mRNA expression. (c, g, k) Relative mRNA expression by qPCR in M1- and M2-like macrophages. (d, h, l) Protein expression was determined by flow cytometry in human M1- and M2-like macrophages. Data are representative of three experiments (RNA-seq, mean and s.e.m.), seven experiments (microarray, mean and s.e.m.), at least seven experiments (qPCR; mean and s.e.m.), and nine experiments (flow cytometry), each with cells derived from a different donor. *P<0.05 (Student's t-test)
[0010] FIG. 5: Network analysis of RNA-seq data. (a) Network of genes highly expressed in M1-like macrophages (fold-change >4.0) identified by RNA-seq. (b) Data generated by microarray analysis were loaded into the M1-network established using RNA-seq. (c) Network of genes highly expressed in M2-like macrophages (fold-change >2.5) identified by RNA-seq. (d) Data generated by microarray analysis were loaded into the M2-network established using RNA-seq. All networks were generated using EGAN. (e) APOL1 and (f) LILRA1 expression in human M1- and M2-like macrophages. Left, representative images of sequencing reads across genes expressed in human macrophages as described in FIG. 4. Right, relative mRNA expression by qPCR in M1- and M2-like macrophages. Data are representative of three experiments (RNA-seq and qPCR; mean and s.e.m.) each with cells derived from a different donor. *P<0.05 (Student's t-test)
[0011] FIG. 6: Detection of alternative splicing in human macrophages. (a) Summarized expression of all PDLIM7 transcripts in human M1- and M2-like macrophages. Left, representative images of sequencing reads across genes expressed in human macrophages as described in FIG. 4. Right, RPKM values for PDLIM7 by RNA-seq in M1- and M2-like macrophages. (b) Expression of PDLIM7 as determined by microarray analysis using 3 different probes recognizing different parts of the PDLIM7 transcripts as depicted in (a). (c) Upper panel: representation of the 3 different mRNA transcripts from Refseq. Lower panel: abundance of the different transcripts as determined using Cuffdiff. (d) qPCR for the 3 different mRNA transcripts from Refseq in human M1- and M2-like macrophages. Data are representative of three experiments (RNA-seq), seven experiments (microarray analysis) or at least ten experiments (qPCR; mean and s.e.m.), each with cells derived from a different donor. *P<0.05 (Student's t-test)
[0012] FIG. 7: Identification of new macrophage polarization markers based on combined transcriptome analysis. Differentially expressed genes between M1- and M2-like macrophages of the human surfaceome were visualized as heatmaps for RNA-seq (left) and microarray analysis (right). Data were z-score normalized. (b-c) Expression of novel macrophage markers was determined by flow cytometry (left) of M1- and M2-like macrophages generated in the presence of GM-CSF with quantification shown in the graph at the right. Expression of (b) CD120b, TLR2, and SLAM7 as well as (c) CD1a, CD1b, CD93, and CD226. *P<0.05 (Student's t-test). Numbers in plots indicate mean fluorescence intensity. Data are representative of nine independent experiments (b,c; mean and s.e.m.) each with cells derived from a different donor.
[0013] FIG. 8: Phenotypic characterization of human M1-like macrophages derived from CD14+ peripheral blood monocytes. Expression of classical M1 markers after polarization of GM-CSF generated macrophages with IFN-γ, LPSu, TNF-α or IFN-γ and LPSu. Surface expression of lineage markers CD14 and CD11b as well as surface expression of the typical M1 markers CD86 and CD64 was assessed by flow cytometry.
[0014] FIG. 9: Comparison of RNA-seq and microarray analysis. Gene expression in M1- versus M2-like macrophages as fold change versus fold change plot comparing microarray analysis with RNA-seq using only Refseq genes differentially expressed in microarrays.
[0015] FIG. 10: Analysis of classical macrophage markers. (a) CD68, (b), CD64, and (c) CD23 expression in human M1- and M2-like macrophages. Representative images of sequencing reads across genes expressed in human macrophages for all three donors analyzed. Pictures taken from the Integrative Genomics Viewer (IGV). The height of bars represents the relative accumulated number of 100-bp reads spanning a particular sequence. Gene maps (bottom portion of each panel, oriented 5'-3' direction) are represented by thick (exons) and thin (introns) lines.
[0016] FIG. 11: Detection of classical macrophage genes by RNA-seq. (a) IL-10 and (b) IL-18 expression in human M1- and M2-like macrophages. Left, expression as determined by microarray analysis using; middle, representative images of sequencing reads across genes expressed in human macrophages. Pictures taken from the Integrative Genomics Viewer (IGV). The height of bars represents the relative accumulated number of 100-bp reads spanning a particular sequence. Gene maps (bottom portion of each panel, oriented 5'-3' direction) are represented by thick (exons) and thin (introns) lines. Right, relative mRNA expression by RNA-seq in M1- and M2-like macrophages. Data are representative of seven (microarrays, mean and s.d.) or three experiments (RNA-seq, mean and s.d.) each with cells derived from a different donor. *P<0.05 (Student's t-test), n.s.=not significant.
[0017] FIG. 12: Analysis of the apolipoprotein L family genes in M1- and M2-like macrophages. (a) APOL2, (b) APOL3, and (c) APOL6 expression in human M1- and M2-like macrophages. Left, relative expression as determined by RNA-seq; middle, representative images of sequencing reads across genes expressed in human macrophages. Pictures taken from the Integrative Genomics Viewer (IGV). The height of bars represents the relative accumulated number of 100-bp reads spanning a particular sequence. Gene maps (bottom portion of each panel, oriented 5'-3' direction) are represented by thick (exons) and thin (introns) lines. Right, relative mRNA expression by qPCR in M1- and M2-like macrophages. Data are representative of three experiments (RNA-seq, mean and s.d. and qPCR, mean and s.e.m.) each with cells derived from a different donor. *P<0.05 (Student's t-test).
[0018] FIG. 13: Analysis of the leukocyte immunoglobulin-like receptor family genes in M1- and M2-like macrophages. (a) LILRA2, (b) LILRA3, (c) LILRA5, (d) LILRB1, and (c) LILRB3 expression in human M1- and M2-like macrophages. Left, relative expression as determined by RNA-seq; middle, representative images of sequencing reads across genes expressed in human macrophages. Pictures taken from the Integrative Genomics Viewer (IGV). The height of bars represents the relative accumulated number of 100-bp reads spanning a particular sequence. Gene maps (bottom portion of each panel, oriented 5'-3' direction) are represented by thick (exons) and thin (introns) lines. Right, relative mRNA expression by qPCR in M1- and M2-like macrophages. Data are representative of three experiments (RNA-seq, mean and s.d. and qPCR, mean and s.e.m.) each with cells derived from a different donor. *P<0.05 (Student's t-test).
[0019] FIG. 14: Identification of new macrophage polarization markers based on combined transcriptome analysis. (a-b) Expression of novel M1- and M2-like macrophage markers on CD11b+CD14+ macrophages was determined by flow cytometry (left) of M1- and M2-like macrophages generated in the presence of M-CSF with quantification shown in the graph at the right. Expression of (a) CD120b, TLR2, and SLAM7 as well as (b) CD1a, CD1b, CD93, and CD226. *P<0.05 (Student's t-test). Numbers in plots indicate mean fluorescence intensity. Data are representative of nine independent experiments (b,c; mean and s.e.m.) each with cells derived from a different donor.
DETAILED DESCRIPTION OF THE INVENTION
[0020] Macrophages are dynamic cells integrating signals from their microenvironment to develop specific functional responses. Microarray-based transcriptional profiling has established transcriptional reprogramming as an important mechanism for signal integration and cell function of macrophages yet current knowledge on transcriptional regulation is far from complete. RNA sequencing (RNA-seq) is ideally suited to fill this need but also to discover novel marker genes, an area of great need particularly in human macrophage biology. Applying RNA-seq, a high-resolution transcriptome profile of human macrophages under classical (M1-like) and alternative (M2-like) polarization conditions is provided and shows a dynamic range exceeding observations obtained by previous technologies, resulting in a more comprehensive understanding of the transcriptome of human macrophages. In addition, differential promoter usage, alternative transcription start sites, and different coding sequences for 57 gene loci in human macrophages were detected. Moreover, this approach led to the identification of novel M1-associated (CD120b, TLR2, SLAMF7) as well as M2-associated (CD1a, CD1b, CD93, CD226) cell surface markers.
[0021] Because of the enormous plasticity of human macrophages, the classification of polarization states on the basis of few cell surface markers will remain a substantial challenge (Murray P. J., Wynn T. A., Nat Rev Immunol. 11(11):723-737 (2011)). Here, we addressed how RNA-seq based high-resolution transcriptome data can be utilized to better understand the biology of macrophage polarization. We observed a significant increase in dynamic range in RNA-seq data resulting in a significantly higher number of genes determined to be significantly differentially expressed. This was true despite the fact that we used seven biological replicates for array analysis but only three samples for RNA-seq. A priori information based network analysis further supported that the increased information content of RNA-seq data uncovered novel aspects of macrophage biology, which was illustrated by the recognition of differential expression of numerous family members of two gene families, namely the apolipoprotein L family and leukocyte immunoglobulin-like receptors. APOLs constitute a new class of apolipoproteins expressed by macrophages as they serve as lytic factors against invading pathogens, e.g. African trypanosomes inducing programmed cell death as well as inhibiting intracellular infection by Leishmania (Pays E., Vanhollebeke B., Curr Opin Immunol. 21(5):493-498 (2009); Samanovic M. et al., PLoS Pathog. 5(1):e1000276 (2009)). LILRs have been associated with balancing the effects of Toll-like receptor signaling, suggesting an important role of LILRs both in the initiation but also cessation of inflammatory responses mediated by macrophages (Brown D. et al., Tissue Antigens. 64(3):215-225 (2004)). Another aspect enhancing our knowledge about the polarization biology of macrophages was the identification of several genes with differential usage of alternative promoters and transcription start sites as well as differential splicing variants between M1- and M2-like macrophages. As visualized for PDLIM7, an intracellular scaffold protein that contains a PDZ domain and three LIM domains linked to mitogenic signaling through actin cytoskeleton organization (Nakagawa N. et al., Biochemical and biophysical research communications 272(2):505-512 (2000)), regulating Tbx5 transcriptional activity (Camarata T. et al., Developmental biology 337(2):233-245 (2010)), and suppressing p53 activity (Jung C. R. et al., The Journal of clinical investigation 120(12):4493-4506 (2010)), RNA-seq revealed significant differences in splice variant usage for M1- and M2-like macrophages potentially linking p53 regulation with macrophage polarization (Matas D. et al., Cell death and differentiation 11(4):458-467 (2004)). Usage of splice variant-specific qPCR reactions supported these findings while this differential regulation was not revealed by microarray analysis. Altogether we detected differential promoter usage, transcription start site usage and splice variant usage in over 50 gene loci, a number that was surprisingly low taking into account that such mechanisms of transcriptional regulation have been suggested for the majority of gene loci in mammalian genomes (Kapranov P. et al., Nature reviews Genetics 8(6):413-423 (2007)).
[0022] While studies in other cell systems suggested that RNA-seq data will further improve cell characterization (Ozsolak F., Milos P. M., Nature reviews Genetics 12(2):87-98 (2011); Wang Z. et al., Nature reviews Genetics 10(1):57-63 (2009); Marioni J. C. et al., Genome Res. 18(9):1509-1517 (2008)), the direct assessment of the new technology in macrophage polarization was necessary to estimate its potential information gain. Both, increased dynamic range and the identification of transcripts that were missed by microarray analysis were major reasons for the discovery of novel genes associated with either M1- or M2-polarization. Nevertheless, despite a lower number of informative transcripts in the microarray data, 73% of the major M1-network was still revealed--at least when using transcripts defined to be enriched in M1-like macrophages. However, this rate dropped to only 54% in the M2-network and major hubs like MYC and TP53 where only revealed by RNA-seq data in M2-like macrophages. Overall these findings point towards an advantage of RNA-seq data, when the endpoint of the analysis is the identification of novel biological mechanisms.
[0023] An important aspect of genomic characterization is the identification of novel marker genes in macrophage polarization (Murray P. J., Wynn T. A., Nat Rev Immunol. 11(11):723-737 (2011)). When focusing on genes being part of the human surfaceome in most cases RNA-seq data revealed larger differences between M1-like and M2-like cells when compared to microarray data. Nevertheless, some genes only reached significant differential expression in the array data clearly pointing toward the necessity to include a large enough number of biological replicates also when applying RNA-seq. On the other hand, a subset of genes showed the well-known background noise effect in the microarray data resulting in non-significant differences between the two cell types. Irrespective of these different shortcomings of the two technologies, the overall differences between the two techniques in this defined gene space were less obvious suggesting that both technologies are well suited for cell surface marker identification. Taken together, we introduced several new marker genes for which we established FACS assays that can be used to distinguish between M1 and M2 polarization of macrophages and that can be combined with the analysis of common macrophage markers.
[0024] In the method of aspect (1) of the invention, the relative abundance of the M1-associated cell surface markers is higher in M1-like macrophages than in M2-like macrophages and the relative abundance of the M2-associated cell surface markers is higher in M2-like macrophages than in M1-like macrophages. It is preferred that the abundance of the cell surface marker in the respective M1-like or M2-like macrophage is at least 30%, more preferably at least 50% and most preferably at least 70% higher than in the other macrophage type.
[0025] The one or more primers employed in the amplification/resequencing employed in the method of aspect (2) of the invention are derived from the respective marker gene. Preferably said primers have at least 12, more preferably at least 15, most preferably at least 19 contiguous nucleotides of the respective marker nucleic acid sequence.
[0026] Similarly, the one or more probes employed in the method of aspect (3) of the invention are derived from the respective marker gene. Preferably said probes have a length that allows for a selective hybridization to the marker nucleic acid. The probe may also be labeled with a suitable marker molecule (e.g. with a fluorescence marker) to allow the detection of the resulting probe-surface marker nucleic acid complex.
[0027] Such probes may also be utilized in a hybridization array of aspect (4) of the invention.
[0028] The binding molecules utilized in aspect (5) of the invention include antibodies, preferably monoclonal antibodies. Moreover said binding molecules may be labeled with maker molecules, preferably fluorescence markers. Particular preferred binding molecules include the FITC-labeled CD1b, CD93, CD226 and anti-TLR2, PE-labeled CD120b and anti-SLAMF7, and PE-Cy5-labeled CD1a monoclonal antibodies. Further it is preferred that the method of aspect (5), notably if it is utilized to isolate the M1-like macrophages or M2-like macrophages, is performed on a FACS sorter.
[0029] The identification of novel marker genes distinguishing human M1-like and M2-like macrophages opens new avenues towards understanding the biology of differentially polarized macrophages. One of the M1-marker identified in this study, namely CD120b (TNFR2) has been linked to cell survival, activation and even proliferation in other cell types such as T cells (Faustman D., Davis M., Nat Rev Drug Discov. 9(6):482-493 (2010)). In contrast to TNFR1, TNFR2 preferentially leads to NFκB activation. Whether this is true in myeloid cells as well requires further investigation. However, earlier studies already suggested that production of TNF-α in macrophages might be interpreted as a phenotype-stabilizing feed-forward loop (Popov A. et al., The Journal of clinical investigation. 116(12):3160-3170 (2006)) and TNFR2 might actually play an important role in such a process.
[0030] SLAMF7 was originally identified as a NK cell-associated surface molecule (Boles K. S. et al., Immunol Rev. 181:234-249 (2001)). Subsequently, it was shown to be expressed on lymphocytes and monocytes (Murphy J. J. et al., Biochem J. 361(Pt 3):431-436 (2002)). More recently, a reduced expression on monocytes and NK cells with a simultaneous increase of SLAMF7 on B cells was observed in patients with lupus erythematosus (Kim J. R. et al., Clin Exp Immunol. 160(3):348-358 (2010)). The strongest link to SLAMF7 as an M1 marker gene comes from observations in intestine allograft rejection, demonstrating that tissue macrophages derived from patients rejecting the graft showed elevated levels of SLAMF7 (Ashokkumar C. et al., Am J. Pathol. 179(4):1929-1938 (2011)). It would be interesting to see if macrophages in other settings of transplant rejection are also enriched for this novel M1 marker gene. Considering the identification of single specific marker genes for macrophage polarization our findings clearly point to the necessity for multi-parameter analysis instead. This can be exemplified by the differential expression of CD1a and CD1b, two cell surface molecules that are mainly studied in context of antigen presentation by dendritic cells (Porcelli S. A., Modlin R. L., Annu Rev Immunol. 17:297-329 (1999)). Previous reports suggested upregulation of CD1 proteins on human monocytes by GM-CSF (Kasinrerk W. et al., J Immunol. 150(2):579-584 (1993)). However, we clearly present evidence that expression is induced in both M-CSF and GM-CSF driven macrophages and polarization towards M2-like macrophages is significantly increasing expression of CD1a and CD1b suggesting that they might be up-regulated on tissue macrophages in an M2-driving environment. This is similarly true for CD93, which was originally identified to be expressed on early hematopoietic stem cells and B cells (Greenlee-Wacker M. C. et al., Curr Drug Targets. (2011)). CD93 is involved in biological processes such as adhesion, migration, and phagocytosis (McGreal E. P. et al., J Immunol. 168(10):5222-5232 (2002); Nepomuceno R. R. et al., J Immunol. 162(6):3583-3589 (1999)). CD93 expressed on myeloid cells can be shed from the cell surface and the soluble form seems to be involved in differentiation of monocytes towards a macrophage phenotype (Jeon J. W. et al., J Immunol. 185(8):4921-4927 (2010)). Since soluble CD93 has been implicated in inflammatory responses, it will be important to further elucidate how polarization-induced differential expression of CD93 contributes to specific inflammatory responses. Another surprising finding is the differential expression of CD226 between human M1- and M2-like macrophages, a molecule initially shown to be involved in cytolytic function of T cells (Shibuya A. et al., Immunity. 4(6):573-581 (1996)). Subsequently, it could be shown that CD226 has additional functions including the regulation of monocyte migration through endothelial junctions (Reymond N. et al., J Exp Med. 199(10):1331-1341 (2004)). Similar to the other M2-associated markers, so far little is known about CD226 on polarized macrophages. Since CD226 expression levels on lymphocytes have been implicated in autoimmune diseases (Sinha S. et al., PLoS One. 6(7):e21868 (2011)) further research is necessary to understand its role in the myeloid compartment during such processes.
[0031] Overall, by using RNA-seq we introduce a high-resolution transcriptome analysis of human macrophages unraveling novel insights into macrophage polarization. While previously established transcriptome datasets addressing macrophage biology are still very suitable to assess important biological and medical questions, a deeper understanding of transcriptional regulation during macrophage polarization will require higher resolution that is provided by current and future RNA-seq technologies. Moreover, the novel cell surface markers will help to better understand macrophage programs and functions in human disease.
[0032] The Invention is further described in the following non-limiting Examples.
EXAMPLES
Materials and Methods
Abbrevations
[0033] LPSu, ultrapure LPS; GEP, gene expression profiling; PCA, principle component analysis; RNA-seq, RNA sequencing technologies; MFI, mean fluorescence intensity; EGAN, exploratory gene association network; RPKM, Reads Per Kilobase of exon model per Million mapped reads; FC, fold change; TSS, transcription start sites; CDS, coding sequences.
Cell Isolation from Healthy Blood Donors:
[0034] Peripheral blood mononuclear cells (PBMC) were obtained by Pancoll (PAN-Biotech, Aidenbach, Germany) density centrifugation from buffy coats from healthy donors obtained following protocols accepted by the institutional review board at the University of Bonn (local ethics vote no. 045/09). Informed consent was provided for each specimen according to the Declaration of Helsinki. CD14+ monocytes were isolated from PBMC using CD14-specific MACS beads (Miltenyi Biotec) according to the manufacturers protocol (routinely >95% purity).
Generation of Macrophages:
[0035] CD14+ monocytes were cultured in 6-well plates in RPMI1640 medium containing 10% FCS and differentiated into immature macrophages using GM-CSF (500 U/ml) or M-CSF (100 U/ml) for 3 days. Growth-factor containing medium was exchanged on day 3 and cells were polarized for 3 days with the following stimuli: IFN-γ (200 U/ml), TNF-α (800 U/ml), ultrapure LPS (LPSu, 10 μg/ml), IL-4 (1,000 U/ml), IL-13 (100 U/ml), or combinations thereof (all from Immunotools, Friesoythe, Germany).
Monoclonal Antibodies and Flow Cytometry:
[0036] Cells were stained after FcR blockade incubating cells in PBS with 20% FCS for 10 minutes at 4° C. using the following monoclonal antibodies (all from Becton Dickinson (BD), BioLegend, or eBioscience): FITC-labeled CD1b, CD23, CD93, CD226, anti-HLA-DR, anti-TLR2; PE-labeled CD64, CD68, CD120b, anti-SLAMF7; PE-Cy5-labeled CD1a; PerCP-Cy5.5-labeled CD209; APC-labeled CD86; Pacific Blue-labeled CD11b; and APC-Cy7-labeled CD14 with matched isotype antibodies as controls. Intracellular staining of CD68 was performed using the BD Cytofix/Cytoperm kit (BD). Data were acquired on a LSR II (BD) and analyzed using FlowJo software (Tree Star).
RNA Isolation:
[0037] 5×10⁶-2×10⁷ macrophages were harvested, subsequently lysed in TRIZOL (Invitrogen) and total RNA was extracted according to the manufactures' protocol. The precipitated RNA was solved in RNAse free water. The quality of the RNA was assessed by measuring the ratio of absorbance at 260 nm and 280 nm using a Nanodrop 2000 Spectrometer (Thermo Scientific) as well as by visualization the integrity of the 28S and 18S band on an agarose gel.
Quantitative PCR Conditions and Primer Sequences:
[0038] 500 ng RNA was reverse transcribed using the Transcriptor First Strand cDNA Synthesis Kit (Roche Diagnostics). qPCR was performed using the LightCyclerTaqman master kit with GAPDH as reference on a LightCycler 480 II (Roche). qPCR primer sequences are summarized in Table 2.
[0039] Isoform specific PCR to identify alternative splicing events were performed using the Maxima SYBR Green/Fluorescein qPCR Master Mix (Fermentas). The relative enrichment of each isoform relative to GAPDH was calculated using the 2.sup.-ΔΔCT method. qPCR primer sequences are listed in Table 3.
Microarray-Based Transcriptional Profiling and Bioinformatic Analysis of Microarray Data:
[0040] Isolated RNA was further purified using the MinElute Reaction Cleanup Kit (Qiagen). Biotin labeled cRNA was generated using the TargetAmp Nano-g Biotin-aRNA Labeling Kit (Epicentre). Biotin labeled cRNA was hybridized to Human HT-12V3 Beadchips (Illumina) and scanned on an Illumina HiScanSQ system. Raw intensity data were exported with BeadStudio 3.1.1.0 (Illumina) and subsequently analysed using R (R Development Core Team. R: A Language and Environment for Statistical Computing (2011)). After quantile normalization non-informative genes (coefficient of variation <0.5) were excluded. From the resulting data sets we extracted a list of genes with a significant different expression in macrophage subtypes. Variable genes were plotted as heatmaps with hierarchical clustering using the correlation coefficient as a distance measure for the samples and the average of each cluster for cluster formation of the genes. Expression values are visualized with colors ranging from red (high expression) over white (intermediate expression) to blue (low expression). Principal component analysis (PCA) was performed using the "pcurve" package in R. Microarray data can be accessed under GSE35449.
RNA-Seq and Data Analysis:
[0041] Sequencing and analysis were performed individually on M1-like and M2-like macrophages from 3 independent donors. Total RNA was converted into libraries of double stranded cDNA molecules as a template for high throughput sequencing using the Illumina CBot station and HiScanSQ following the manufacturer's recommendations using the Illumina TruSeq RNA Sample Preparation Kit. Shortly, mRNA was purified from 5-10 μg of total RNA using poly-T oligo-attached magnetic beads. Fragmentation was carried out using divalent cations under elevated temperature in Illumina proprietary fragmentation buffer. First strand cDNA was synthesized using random oligonucleotides and SuperScript II. Second strand cDNA synthesis was subsequently performed using DNA Polymerase I and RNase H. Remaining overhangs were converted into blunt ends via exonuclease/polymerase activities and enzymes were removed. After adenylation of 3' ends of DNA fragments, Illumina PE adapter oligonucleotides were ligated to prepare for hybridization. In order to select cDNA fragments of preferentially 200 by in length the library fragments were separated on a 2% (w/v) agarose gel. The corresponding gel-fraction for each library was excised and purified using the QIAquick gel extraction kit (Qiagen). DNA fragments with ligated adapter molecules were selectively enriched using Illumina PCR primer PE1.0 and PE2.0 in a 15 cycle PCR reaction. Products were purified (QIAquick PCR purification kit) and quantified using the Agilent high sensitivity DNA assay on a Bioanalyzer 2100 system (Agilent). After cluster generation, 100 by paired-end reads were generated and analyzed using CASAVA 1.8. Alignment to the human reference genome hg19 from UCSC was performed stepwise. First, all reads passing the chastity filter were aligned to the reference genome. Next, reads were aligned to the RNA reference transcriptome. Based on these alignments the numbers of reads aligning to intragenic regions, or intergenic regions, respectively, were calculated. In addition the numbers of reads mapping to exonic and intronic regions as well as to splice sites were calculated based on the UCSC annotation file. Reads per kilobase of exon model per million mapped reads (RPKM) values for Refseq genes were established using CASAVA 1.8. In order to identify reads spanning altered splicing events or gene fusion breakpoints we also analyzed reads using TopHat and Bowtie. Results were further processed using Cufflinks and Cuffdiff (Trapnell C. et al., Nature biotechnology 28(5):511-515 (2010)).
A Priori Information-Based Network Analysis Using EGAN Software:
[0042] To visualize connectivity between genes in high-throughput datasets contextual network graphs were generated based on a priori knowledge stored in literature, pathway, interaction, or annotation term databases by EGAN (exploratory gene association network) Paquette J., Tokuyasu T., Bioinformatics 26(2):285-286 (2010). To visualize the transcriptional regulation of genes enriched in M1 respectively M2, array data were used and fold change differences calculated using unpolarized macrophages as comparison. Genes with a FC>2 for M1 and FC>1.65 for M2 were visualized; represented is the major network. Using the network topology established for M1-like macrophages the expression values for M2-like macrophages were plotted and vice versa. For comparison of network components and density between RNA-seq and array data, the network was first visualized for the RNA-seq data (FC>4 for M1 and FC>2.5 for M2). Keeping the network topology, genes were marked according to their fold change when visualizing the array-based network. Graphs for genes enriched in M1 respectively in M2 were generated independently.
Statistical Analysis:
[0043] Student's t-tests were performed with SPSS 19.0 software.
Example 1
[0044] Generation of human M1- and M2-like macrophages as a model system. To establish a high-resolution transcriptome of human macrophages as a result of specific polarization signals, we used classical (M1-like) and alternative (M2-like) polarization of human macrophages as a model system. Since both M-CSF and GM-CSF have been described to differentiate macrophages from blood-derived CD14+ monocytes, we first compared the two different stimuli in respect to macrophage polarization and used expression of well-known macrophage markers as the initial readout (Martinez F. O. et al., The Journal of Immunology 177(10):7303-7311 (2006); Hamilton J. A., Nat Rev Immunol. 8(7):533-544 (2008)). For classical polarization we primarily used IFN-γ as the model stimulus and IL-4 for alternative polarization. When assessing the macrophage surface marker CD11b, the total percentage of CD11b+ cells under M1 and M2 polarization conditions was similar while the MFI was slightly higher in M2-like macrophages independent of the usage of GM-CSF or M-CSF (FIG. 1a). Further, we observed high expression of CD14 on all cells under M1 and M2 polarizing conditions irrespective of GM-CSF or M-CSF differentiation with a higher CD14 expression in M1-like macrophages (FIG. 1b). For both classical macrophage markers CD68 and MHC class II molecules (FIG. 1c and 1d) we observed no differences in all four conditions tested. Of note, when the IL-4 signal was provided to monocytes from the beginning of the differentiation period, immature dendritic cells were generated with a typical loss of macrophage markers such as CD14 or CD68 (data not shown).
[0045] When assessing markers previously associated with M1 or M2 polarization (Mantovani A. et al., Trends Immunol. 23(11):549-555 (2002)), a selective induction of the M1 marker CD64 in M1-like macrophages was observed in cultures differentiated with both GM-CSF and M-CSF (FIG. 1e) while CD86 only showed an M1-specific expression in GM-CSF differentiated cells (FIG. 1f). Assessment of these markers following other M1-associated polarization signals, e.g. LPS, TNF-α or combinations thereof resulted in comparable results (FIG. 8). Inversely, strong induction of the M2-marker CD23 was observed in IL-4 polarized macrophages with significantly higher induction in GM-CSF polarized M2-like macrophages (FIG. 1g). For further experiments we therefore differentiated monocytes with GM-CSF for 3 days prior to polarization with either IFN-γ or IL-4 as the model signals.
Example 2
[0046] Characterization of M1- and M2-like macrophages by microarray-based gene expression profiling. Most recently it has been suggested that assessment of macrophage polarization in humans cannot solely rely on few cell surface markers but should be accommodated by gene expression profiling (Murray P. J., Wynn T. A., Nature reviews Immunology 11(11):723-737 (2011)). Using one of the most recent array generations, gene expression profiling was performed on unpolarized and polarized macrophages derived from seven healthy donors. To determine sample relationships, PCA (FIG. 2a) and hierarchical clustering (FIG. 2b) based on variable genes were performed and showed segregation of the samples by polarization state. Comparing our data with publically available datasets from M1- and M2-like macrophages generated with earlier array versions we observed concordant gene expression patterns (data not shown) (Martinez F. O. et al., The Journal of Immunology 177(10):7303-7311 (2006)). Heatmap visualization of known M1- and M2-like macrophage markers (FIG. 2c) further demonstrated that the genes encoding for the surface molecules FCGR1A and FCGR1B (both representing CD64) and CD86, the cytokine/chemokine genes CXCL10, CXCL9, IL-1B, IL-6, CXCL11, TNF, IL-23A, and the genes encoding for the intracellular protein GBP1 were increased in M1-like macrophages, results similar to what has been previously reported for M1 polarization (Martinez F. O. et al., The Journal of Immunology 177(10):7303-7311 (2006); Mantovani A. et al., Immunity 23(4):344-346 (2005); Mosser D. M., Edwards J. P., Nat Rev Immunol. 8(12):958-969 (2008)). Inversely, M2-associated genes encoding for the surface molecules FCER2 (CD23), IL27RA, and CLEC4A, the chemokine genes CCL22, CCL18, and CCL17, and the intracellular protein F13A1 were increased in the M2-like macrophages (Mantovani A. et al., Immunity 23(4):344-346 (2005); Mosser D. M., Edwards J. P., Nat Rev Immunol. 8(12):958-969 (2008); Wirnsberger G. et al., Eur J Immunol. 36(7):1882-1891 (2006)).
[0047] To further illustrate differential macrophage polarization, we generated a priori knowledge based M1-associated (FIG. 2d) and M2-associated (FIG. 2e) networks applying EGAN (Paquette J., Tokuyasu T., Bioinformatics 26(2):285-286 (2010)) using genes significantly upregulated in M1- (FC>2) respectively M2-polarized cells (FC>1.65). When applying expression values from the comparison of M2-like with M0 macrophages on the M1-associated network, the vast majority of genes showed either no change or even a reduction in expression, likely to represent an active repression of M1-associated genes in M2-like macrophages (FIG. 2d). Only few genes showed a simultaneous increase in expression, and these genes represented common cell cycle associated genes. Similarly, members of the M2-associated network were mostly not changed or even reduced in M1-like macrophages (FIG. 2e).
Example 3
[0048] Increase in overall transcriptome information by RNA-seq. Gene expression profiling using microarrays has recently been suggested to be inferior to newer sequencing based technologies in providing genome-wide transcriptome information (Wang Z. et al., Nature reviews Genetics 10(1):57-63 (2009)). To address the potential information increase for macrophages, RNA-seq was performed on in vitro generated M1- and M2-like macrophages. After quality filtering, we obtained 15.0±2.8 million and 20.4±9.2 million reads for the M1- and M2-like macrophage cDNA libraries (Table 1). Consistent with RNA-seq data obtained from other eukaryotic cells (Ramskold D. et al., PLoS computational biology 5(12):e1000598 (2009)) the majority of sequencing reads for M1- and M2-like macrophages mapped to annotated exons (Refseq transcripts). The remaining reads mapped to exon-intron boundaries, introns, or other uncharacterized intergenic regions (Table 1). RPKMs are measures of individual transcript abundance in RNA-seq datasets and have been shown to be highly accurate across multiple cell types (Mortazavi A. et al., Nature methods 5(7):621-628 (2008)). We used CASAVA to assign RPKMs. To compare RNA-seq and microarray data we cross-annotated RNA-seq and microarray data using HGNC symbols. In human M1- and M2-like macrophages, 11317 and 11466 Refseq genes were expressed applying a previously defined optimal threshold (0.3 RPKM) for gene expression (FIG. 3a) (Ramskold D. et al., PLoS computational biology 5(12):e1000598 (2009)). The present call rate for Refseq genes for M1-(n=10155) and M2-like macrophages (n=10418) was only slightly lower when using microarrays (FIG. 3a). Furthermore, when assessing the levels of mRNA expression on a global scale a high correlation between RNA-seq and microarray data--similar to other cells (Mortazavi A. et al., Nature methods. 5(7):621-628 (2008))--was observed for M1- and M2-like macrophages (FIG. 3b).
Example 4
[0049] RNA-seq reveals differential expression at significantly higher resolution. RNA-seq showed a significantly increased dynamic range over background mainly due to significantly lower background levels. This suggested that the assessment of differential expression using RNA-seq might lead to an improved resolution in comparison to array-based data. Applying standard filter criteria (FC 1.5, p<0.05, RPKM 0.3) revealed a total of 1736 genes elevated in M1- versus M2-like macrophages by RNA-seq, while 834 genes were recognized by array analysis (FIG. 3c). Similarly, 822 genes were identified as being elevated in M2- versus M1-like macrophages by RNA-seq, while 786 genes were detected by array analysis (FIG. 3d). More importantly, when categorizing differentially expressed genes according to their level of differential expression, RNA-seq data clearly revealed up to 4-fold more genes with FC>4 for M1- and M2-associated genes (FIGS. 3c and d), which was similarly true for M1-associated genes at lower levels (1.5<FC<4). To reveal potential reasons for this difference on the single-gene level we utilized FC-FC plotting, correlating RNA-seq and array-based data for individual genes (FIG. 3e). The majority of genes showed similar behavior in both RNA-seq and microarray experiments, albeit the relative differences were higher in RNA-seq data (FIG. 3e). Altogether, we observed a considerable increase in the dynamic range of fold-differences in RNA-seq data with differences spanning six orders of magnitude in contrast to only four orders of magnitude in the microarray data (FIGS. 3e and 9). In addition, there was a significant number of genes showing differential expression in RNA-seq data (e.g. DUOX1, DUOX2, TBX21, GBP7) but not in the array data suggesting that the array data are not informative for this class of genes. As anticipated, when using Venn diagrams with a defined cutoff (-2≧FC≧2, p<0.05, RPKM≧0.3) for data presentation (FIG. 3f), both RNA-seq and array data revealed 595 genes to be differentially expressed, but RNA-seq revealed 900 additional genes. Surprisingly, 308 genes were classified as being differentially expressed by array analysis alone (FIG. 3f). When further assessing these genes, it became apparent that these genes show a similar trend in the RNA-seq data but these differences did not yet reach statistical significance (FIG. 3g). In contrast, genes only identified by RNA-seq, clearly showed no differences when assessed by array analysis (FIG. 3h). Visualization of typical marker genes as depicted for array data in FIG. 2c demonstrated a comparable differentiation of M1- and M2-like macrophages when assessed by RNA-seq (FIG. 3i).
Example 5
[0050] Exon resolution transcriptome analysis of known macrophage markers. Another advantage of RNA-seq is to resolve gene expression on the exon level (FIG. 4). For the macrophage related genes CD68 (FIG. 4a-d), CD64 (FIG. 4e-h) and CD23 (FIG. 4i-l), RNA-seq data were visualized for the genomic loci of the respective genes and compared with array, qPCR, and FACS data. For CD68, RNA-seq data revealed similarly high expression for M1 and M2 macrophages for all exons with little variance in expression levels between donors (FIGS. 4a and 11). Slightly higher variance was observed for both microarray (FIG. 4b) and qPCR data (FIG. 4c) while protein levels showed equal expression in all samples analyzed (FIG. 4d). For CD64, RNA-seq revealed complete absence of expression for all exons in M2-like macrophages with high expression in M1-like macrophages (FIG. 4e), which was similarly observed by other technologies (FIG. 4f-h). For CD23, protein data suggest significantly elevated expression on M2-like macrophages with low level expression on M1-like macrophages (FIG. 4l), a result which was also observed for RNA-seq data (FIG. 4i) as well as array (FIG. 4j) and qPCR (FIG. 4k). Similar results were obtained for other marker genes (data not shown). Additionally, we were able to detect classical M1/M2-markers not accessible using microarrays (FIG. 11), suggesting that high-resolution RNA-seq data are predestined for exploration of genes not detectable using microarrays, novel marker genes, as well as biological principles of macrophage polarization.
Example 6
[0051] RNA-seq ameliorates network-based analysis in M1- and M2-like macrophages. To understand if RNA-seq would also enhance the understanding of biological principles of macrophage polarization we applied network analysis based on a priori information assessing the information content of RNA-seq data in comparison to array data. Genes expressed at elevated levels in M1 RNA-seq data (FC>4) were used for network generation (FIG. 5a). This primary RNA-seq based M1 network was subsequently used to visualize array-based gene expression (FIG. 5b). When genes at a lower level of differential expression (FC>2) were included 73% of the network was revealed in the array data and central hubs of the network were also categorized as being highly (FC>4) differentially expressed. However, only RNA-seq data revealed two gene clusters of immunomodulating proteins highly enriched in the M1 network, namely apolipoproteins L (APOL) (FIGS. 5a and 12) and the leukocyte immunoglobulin-like receptor (LILR) family (FIGS. 5a and 13) (Pays E., Vanhollebeke B., Curr Opin Immunol. 21(5):493-498 (2009); Samanovic M. et al., PLoS Pathog. 5(1):e1000276 (2009); Brown D. et al., Tissue Antigens. 64(3):215-225 (2004)). As exemplified for LILRA1 and APOL1 both genes were clearly identified by RNA-seq and qRT-PCR (FIGS. 5e and f) but not by microarray analysis (data not shown). Applying the RNA-seq data-based M2 network (FIG. 5c) to the array data (FIG. 5d) revealed only 54% elevated genes and major network hubs were not revealed at all. Taken together, RNA-seq data were clearly enriched for biological a priori information in both M1 and M2 polarization.
Example 7
[0052] Identification of splice variants and RNA chimaera in differentially stimulated human macrophages. It has recently been suggested that cell differentiation can result in usage of alternative gene transcripts or isoform switching (Trapnell C. et al., Nature biotechnology 28(5):511-515 (2010)). We applied Cufflinks and Cuffdiff to illuminate switches in dominant promoter usage, transcription start sites (TSS), and coding sequences (CDS) (Trapnell C. et al., Nature biotechnology 28(5):511-515 (2010)). This analysis revealed 9 genes with alternative promoters (Table 4), 28 genes using alternative TSS (Table 5), and 20 genes with different CDS in M1- and M2-like macrophages (Table 6). We analyzed one of these genes in greater detail. For the gene encoding PDZ and LIM domain 7 (enigma) (PDLIM7) we observed a slight but significant increase in M1-like macrophages for the complete locus in RNA-seq data (FIG. 6a) while the probes on the microarray revealed no significant changes (FIG. 6b). Previous screening projects suggested three different CDS for PDLIM7. Applying Cufflinks and Cuffdiff to M1 and M2 RNA-seq data clearly revealed differential expression of individual CDS (FIG. 6c). While PDLIM7 v1 was mainly expressed by M1-like macrophages, M2-like macrophages mainly expressed PDLIM7 v2, while no difference was observed for PDLIM7 v4. We validated the usage of these variants by version-specific qPCR (FIG. 6d). Taken together, these new findings might open new avenues towards the role of alternative splicing in macrophages potentially linking alternative transcript usage with macrophage polarization.
Example 8
[0053] New markers for M1- and M2-like macrophages identified by combined transcriptome analysis. In light of the still limited number of cell surface markers clearly distinguishing human M1- from M2-like macrophages, we interrogated the genes of the human surfaceome (da Cunha J. P. et al., Proceedings of the National Academy of Sciences of the United States of America 106(39):16752-16757 (2009)) for differential expression between M1- and M2-like macrophages. By this approach 475 surface molecules were found to be differentially expressed (FIG. 7a). As visualized in FIG. 7b, the cell surface molecules CD120b, TLR2, and SLAMF7 showed preferential expression in M1-like macrophages, which was true irrespective of differentiation of macrophages by GM-CSF or M-CSF (FIG. 14a). Several surface molecules, including CD1a, CD1b, CD93 and CD226 were significantly increased in expression in M2-like macrophages (FIGS. 7c and 14b). Taken together, screening higher-resolution transcriptome data established by RNA-seq allows for the identification of novel genes related to specific polarization programs in macrophages.
Tables
TABLE-US-00001
[0054] TABLE 1 RNA-Seq M1 M2 reads percentage reads percentage (×106) (%) (×106) (%) Total 15.0 ± 2.8 20.4 ± 9.2 Exons 11.8 ± 2.2 78.4 ± 1.1 16.1 ± 7.4 79.4 ± 2.0 Exon-Intron 0.4 ± 0.1 2.5 ± 0.1 0.5 ± 0.2 2.4 ± 0.2 boundaries Introns 2.1 ± 0.5 14.1 ± 1.0 2.7 ± 1.3 13.2 ± 1.6 Intergenic 0.8 ± 0.1 5.0 ± 0.2 1.0 ± 0.5 5.0 ± 0.3 regions
TABLE-US-00002 TABLE 2 qPCR oligonucleotides CD68 Forward 5'-GTCCACCTCGACCTGCTCT-3' (SEQ ID NO: 15) CD68 Reverse 5'-CACTGGGGCAGGAGAAACT-3' (SEQ ID NO: 16) CD64 Forward 5'-TGGGAAAGCATCGCTACAC-3' (SEQ ID NO: 17) CD64 Reverse 5'-GCACTGGAGCTGGAAATAGC-3' (SEQ ID NO: 18) CD23 Forward 5'-GGGAGAATCCAAGCAGGAC-3' (SEQ ID NO: 19) CD23 Reverse 5'-GGAAGCTCCTCGATCTCTGA-3' (SEQ ID NO: 20) LILRA1 Forward 5'-TCGCTGTTTCTACGGTAGCC-3' (SEQ ID NO: 21) LILRA1 Reverse 5'-GGGTGGGTTTGATGTAGGC-3' (SEQ ID NO: 22) LILRA2 Forward 5'-CAGCCACAATCACTCATCAGA-3' (SEQ ID NO: 23) LILRA2 Reverse 5'-AGGGTGGGTTTGCTGTAGG-3' (SEQ ID NO: 24) LILRA3 Forward 5'-GGAGCTCGTGGTCTCAGG-3' (SEQ ID NO: 25) LILRA3 Reverse 5'-CTTGGAGTCGGACTTGTTTTG-3' (SEQ ID NO: 26) LILRA5 Forward 5'-GCACCATGGTCTCATCCAT-3' (SEQ ID NO: 27) LILRA5 Reverse 5'-GTGGCTTTGGAGAGGTTCC-3' (SEQ ID NO: 28) LILRB1 Forward 5'-GGAGCTCGTGGTCTCAGG-3' (SEQ ID NO: 29) LILRB1 Reverse 5'-GGGTTTGATGTAGGCTCCTG-3' (SEQ ID NO: 30) LILRB3 Forward 5'-GGAGATACCGCTGCCACTAT-3' (SEQ ID NO: 31) LILRB3 Reverse 5'-GGTGGGTTTGCTGTAGGC-3' (SEQ ID NO: 32) APOL1 Forward 5'-TTCGAATTCCTCGGTATATCTTG-3' (SEQ ID NO: 33) APOL1 Reverse 5'-CACCTCCAGTTATGCGTCTG-3' (SEQ ID NO: 34) APOL2 Forward 5'-ATGATGAAGCCTGGAATGGA-3' (SEQ ID NO: 35) APOL2 Reverse 5'-TCAGAGCTTTACGGAGCTCAT-3' (SEQ ID NO: 36) APOL3 Forward 5'-GCCTGGAAGAGATTCGTGAC-3' (SEQ ID NO: 37) APOL3 Reverse 5'-CTTCAGAGCTTCGTAGAGAGCA-3' (SEQ ID NO: 38) APOL6 Forward 5'-AAGTGAGGCTGGTGTTGGTT-3' (SEQ ID NO: 39) APOL6 Reverse 5'-CGTCTTGTAGCTCCACGTCTT-3' (SEQ ID NO: 40) GAPDH Forward 5'-AGCCACATCGCTCAGACAC-3' (SEQ ID NO: 41) GAPDH Reverse 5'-GCCCAATACGACCAAATCC-3' (SEQ ID NO: 42)
TABLE-US-00003 TABLE 3 Isoform specific qPCR oligonucleotides PDLIM7 v1 Forward 5'-CCGCAGCAGAATGGACAG-3' (SEQ ID NO: 43) PDLIM7 v1 Reverse 5'-GCTCCTGGGGTGTAGATG-3' (SEQ ID NO: 44) PDLIM7 v2 Forward 5'-ACCGCAGAAGGTGCAGAC-3' (SEQ ID NO: 45) PDLIM7 v2 Reverse 5'-CTGGCTTGATTTCTTCAGGTG-3' (SEQ ID NO: 46) PDLIM7 v4 Forward 5'-CCGCAGCAGAATGGACAG-3' (SEQ ID NO: 47) PDLIM7 v4 Reverse 5'-GCAGGAGGAACAGAAAGAG-3' (SEQ ID NO: 48) GAPDH Forward 5'-AGCCACATCGCTCAGACAC-3' (SEQ ID NO: 49) GAPDH Reverse 5'-GCCCAATACGACCAAATCC-3' (SEQ ID NO: 50)
TABLE-US-00004 TABLE 4 Alternative promoter usage C8orf83 chr8: 93895757-93978372 EIF4ENIF1 chr22: 31835344-31885874 HRH1 chr3: 11178778-11304939 JDP2 chr14: 75894508-75939404 NCS1 chr9: 132934856-132999583 PDE2A chr11: 72287184-72385494 PUS7L chr12: 44122409-44152596 SMARCD3 chr7: 150936058-150974231 TSC22D1 chr13: 45007654-45154568
TABLE-US-00005 TABLE 5 Alternative TSS usage WFS1 chr4: 6271576-6304992 ARNT chr1: 150768686-150849186 ASRGL1 chr11: 62104773-62160887 OSBPL9 chr1: 52082546-52344609 GBA chr1: 155204238-155214653 HES6 chr2: 239146907-239148681 BAT5 chr6: 31654725-31671137 DCTN1 chr2: 74588280-74621008 RASGRP4 chr19: 38893774-38916945 SNX16 chr8: 82711817-82754521 NDUFC1 chr4: 140211070-140311935 CCDC17 chr1: 46085715-46089731 CD200R1 chr3: 112641531-112693937 FECH chr18: 55212072-55253969 NRGN chr11: 124609828-124617102 RB1CC1 chr8: 53535017-53627026 UBQLN1 chr9: 86274877-86323168 MTERFD3 chr12: 107371068-107380929 MBOAT7 chr19: 54677105-54693733 RANBP3 chr19: 5914192-5978320 RAP1GDS1 chr4: 99182526-99365012 TNNT1 chr19: 55644160-55660606 ABCC1 chr16: 16043433-16236931 CDCA7L chr7: 21582832-21985542 HYI chr1: 43888796-43919660 C8orf83 chr8: 93895757-93978372 CD36 chr7: 80231503-80308593 NT5C3 chr7: 33053741-33102409
TABLE-US-00006 TABLE 6 Alternative CDS usage ABCC1 chr16: 16043433-16236931 CCDC17 chr1: 46085715-46089731 CD200R1 chr3: 112641531-112693937 CDCA7L chr7: 21582832-21985542 FECH chr18: 55212072-55253969 HES6 chr2: 239146907-239148681 HYI chr1: 43888796-43919660 JDP2 chr14: 75894508-75939404 MYO1B chr2: 192110106-192290115 NCS1 chr9: 132934856-132999583 PDLIM7 chr5: 176910394-176924602 RANBP3 chr19: 5914192-5978320 RAP1GDS1 chr4: 99182526-99365012 RASGRP4 chr19: 38893774-38916945 RB1CC1 chr8: 53535017-53627026 RP6-213H19.1 chrX: 131157244-131209971 SLC25A45 chr11: 65142662-65150142 SNX16 chr8: 82711817-82754521 TNNT1 chr19: 55644160-55660606 UBQLN1 chr9: 86274877-86323168
Sequence Listing, Free Text
[0055] SEQ ID NO: Description
[0056] 1/2 tumor necrosis factor receptor superfamily, member 1B (CD120b)
[0057] 3/4 toll-like receptor 2 (TLR2)
[0058] 5/6 SLAM family member 7 (SLAMF7)
[0059] 7/8 CD1a
[0060] 9/10 CD1b
[0061] 11/12 CD93
[0062] 14/15 CD226
[0063] 16-50 primer
Sequence CWU
1
1
5013682DNAHomo sapiens 1gcgagcgcag cggagcctgg agagaaggcg ctgggctgcg
agggcgcgag ggcgcgaggg 60cagggggcaa ccggaccccg cccgcaccca tggcgcccgt
cgccgtctgg gccgcgctgg 120ccgtcggact ggagctctgg gctgcggcgc acgccttgcc
cgcccaggtg gcatttacac 180cctacgcccc ggagcccggg agcacatgcc ggctcagaga
atactatgac cagacagctc 240agatgtgctg cagcaaatgc tcgccgggcc aacatgcaaa
agtcttctgt accaagacct 300cggacaccgt gtgtgactcc tgtgaggaca gcacatacac
ccagctctgg aactgggttc 360ccgagtgctt gagctgtggc tcccgctgta gctctgacca
ggtggaaact caagcctgca 420ctcgggaaca gaaccgcatc tgcacctgca ggcccggctg
gtactgcgcg ctgagcaagc 480aggaggggtg ccggctgtgc gcgccgctgc gcaagtgccg
cccgggcttc ggcgtggcca 540gaccaggaac tgaaacatca gacgtggtgt gcaagccctg
tgccccgggg acgttctcca 600acacgacttc atccacggat atttgcaggc cccaccagat
ctgtaacgtg gtggccatcc 660ctgggaatgc aagcatggat gcagtctgca cgtccacgtc
ccccacccgg agtatggccc 720caggggcagt acacttaccc cagccagtgt ccacacgatc
ccaacacacg cagccaactc 780cagaacccag cactgctcca agcacctcct tcctgctccc
aatgggcccc agccccccag 840ctgaagggag cactggcgac ttcgctcttc cagttggact
gattgtgggt gtgacagcct 900tgggtctact aataatagga gtggtgaact gtgtcatcat
gacccaggtg aaaaagaagc 960ccttgtgcct gcagagagaa gccaaggtgc ctcacttgcc
tgccgataag gcccggggta 1020cacagggccc cgagcagcag cacctgctga tcacagcgcc
gagctccagc agcagctccc 1080tggagagctc ggccagtgcg ttggacagaa gggcgcccac
tcggaaccag ccacaggcac 1140caggcgtgga ggccagtggg gccggggagg cccgggccag
caccgggagc tcagattctt 1200cccctggtgg ccatgggacc caggtcaatg tcacctgcat
cgtgaacgtc tgtagcagct 1260ctgaccacag ctcacagtgc tcctcccaag ccagctccac
aatgggagac acagattcca 1320gcccctcgga gtccccgaag gacgagcagg tccccttctc
caaggaggaa tgtgcctttc 1380ggtcacagct ggagacgcca gagaccctgc tggggagcac
cgaagagaag cccctgcccc 1440ttggagtgcc tgatgctggg atgaagccca gttaaccagg
ccggtgtggg ctgtgtcgta 1500gccaaggtgg gctgagccct ggcaggatga ccctgcgaag
gggccctggt ccttccaggc 1560ccccaccact aggactctga ggctctttct gggccaagtt
cctctagtgc cctccacagc 1620cgcagcctcc ctctgacctg caggccaaga gcagaggcag
cgagttgtgg aaagcctctg 1680ctgccatggc gtgtccctct cggaaggctg gctgggcatg
gacgttcggg gcatgctggg 1740gcaagtccct gactctctgt gacctgcccc gcccagctgc
acctgccagc ctggcttctg 1800gagcccttgg gttttttgtt tgtttgtttg tttgtttgtt
tgtttctccc cctgggctct 1860gccccagctc tggcttccag aaaaccccag catccttttc
tgcagagggg ctttctggag 1920aggagggatg ctgcctgagt cacccatgaa gacaggacag
tgcttcagcc tgaggctgag 1980actgcgggat ggtcctgggg ctctgtgcag ggaggaggtg
gcagccctgt agggaacggg 2040gtccttcaag ttagctcagg aggcttggaa agcatcacct
caggccaggt gcagtggctc 2100acgcctatga tcccagcact ttgggaggct gaggcgggtg
gatcacctga ggttaggagt 2160tcgagaccag cctggccaac atggtaaaac cccatctcta
ctaaaaatac agaaattagc 2220cgggcgtggt ggcgggcacc tatagtccca gctactcaga
agcctgaggc tgggaaatcg 2280tttgaacccg ggaagcggag gttgcaggga gccgagatca
cgccactgca ctccagcctg 2340ggcgacagag cgagagtctg tctcaaaaga aaaaaaaaag
caccgcctcc aaatgccaac 2400ttgtcctttt gtaccatggt gtgaaagtca gatgcccaga
gggcccaggc aggccaccat 2460attcagtgct gtggcctggg caagataacg cacttctaac
tagaaatctg ccaatttttt 2520aaaaaagtaa gtaccactca ggccaacaag ccaacgacaa
agccaaactc tgccagccac 2580atccaacccc ccacctgcca tttgcaccct ccgccttcac
tccggtgtgc ctgcagcccc 2640gcgcctcctt ccttgctgtc ctaggccaca ccatctcctt
tcagggaatt tcaggaacta 2700gagatgactg agtcctcgta gccatctctc tactcctacc
tcagcctaga ccctcctcct 2760cccccagagg ggtgggttcc tcttccccac tccccacctt
caattcctgg gccccaaacg 2820ggctgccctg ccactttggt acatggccag tgtgatccca
agtgccagtc ttgtgtctgc 2880gtctgtgttg cgtgtcgtgg gtgtgtgtag ccaaggtcgg
taagttgaat ggcctgcctt 2940gaagccactg aagctgggat tcctccccat tagagtcagc
cttccccctc ccagggccag 3000ggccctgcag aggggaaacc agtgtagcct tgcccggatt
ctgggaggaa gcaggttgag 3060gggctcctgg aaaggctcag tctcaggagc atggggataa
aggagaaggc atgaaattgt 3120ctagcagagc aggggcaggg tgataaattg ttgataaatt
ccactggact tgagcttggc 3180agctgaacta ttggagggtg ggagagccca gccattacca
tggagacaag aagggttttc 3240caccctggaa tcaagatgtc agactggctg gctgcagtga
cgtgcacctg tactcaggag 3300gctgagggga ggatcactgg agcccaggag tttgaggctg
cagcgagcta tgatcgcgcc 3360actacactcc agcctgagca acagagtgag accctgtctc
ttaaagaaaa aaaaagtcag 3420actgctggga ctggccaggt ttctgcccac attggaccca
catgaggaca tgatggagcg 3480cacctgcccc ctggtggaca gtcctgggag aacctcaggc
ttccttggca tcacagggca 3540gagccgggaa gcgatgaatt tggagactct gtggggcctt
ggttcccttg tgtgtgtgtg 3600ttgatcccaa gacaatgaaa gtttgcactg tatgctggac
ggcattcctg cttatcaata 3660aacctgtttg ttttaaaaaa aa
36822461PRTHomo sapiens 2Met Ala Pro Val Ala Val
Trp Ala Ala Leu Ala Val Gly Leu Glu Leu 1 5
10 15 Trp Ala Ala Ala His Ala Leu Pro Ala Gln Val
Ala Phe Thr Pro Tyr 20 25
30 Ala Pro Glu Pro Gly Ser Thr Cys Arg Leu Arg Glu Tyr Tyr Asp
Gln 35 40 45 Thr
Ala Gln Met Cys Cys Ser Lys Cys Ser Pro Gly Gln His Ala Lys 50
55 60 Val Phe Cys Thr Lys Thr
Ser Asp Thr Val Cys Asp Ser Cys Glu Asp 65 70
75 80 Ser Thr Tyr Thr Gln Leu Trp Asn Trp Val Pro
Glu Cys Leu Ser Cys 85 90
95 Gly Ser Arg Cys Ser Ser Asp Gln Val Glu Thr Gln Ala Cys Thr Arg
100 105 110 Glu Gln
Asn Arg Ile Cys Thr Cys Arg Pro Gly Trp Tyr Cys Ala Leu 115
120 125 Ser Lys Gln Glu Gly Cys Arg
Leu Cys Ala Pro Leu Arg Lys Cys Arg 130 135
140 Pro Gly Phe Gly Val Ala Arg Pro Gly Thr Glu Thr
Ser Asp Val Val 145 150 155
160 Cys Lys Pro Cys Ala Pro Gly Thr Phe Ser Asn Thr Thr Ser Ser Thr
165 170 175 Asp Ile Cys
Arg Pro His Gln Ile Cys Asn Val Val Ala Ile Pro Gly 180
185 190 Asn Ala Ser Met Asp Ala Val Cys
Thr Ser Thr Ser Pro Thr Arg Ser 195 200
205 Met Ala Pro Gly Ala Val His Leu Pro Gln Pro Val Ser
Thr Arg Ser 210 215 220
Gln His Thr Gln Pro Thr Pro Glu Pro Ser Thr Ala Pro Ser Thr Ser 225
230 235 240 Phe Leu Leu Pro
Met Gly Pro Ser Pro Pro Ala Glu Gly Ser Thr Gly 245
250 255 Asp Phe Ala Leu Pro Val Gly Leu Ile
Val Gly Val Thr Ala Leu Gly 260 265
270 Leu Leu Ile Ile Gly Val Val Asn Cys Val Ile Met Thr Gln
Val Lys 275 280 285
Lys Lys Pro Leu Cys Leu Gln Arg Glu Ala Lys Val Pro His Leu Pro 290
295 300 Ala Asp Lys Ala Arg
Gly Thr Gln Gly Pro Glu Gln Gln His Leu Leu 305 310
315 320 Ile Thr Ala Pro Ser Ser Ser Ser Ser Ser
Leu Glu Ser Ser Ala Ser 325 330
335 Ala Leu Asp Arg Arg Ala Pro Thr Arg Asn Gln Pro Gln Ala Pro
Gly 340 345 350 Val
Glu Ala Ser Gly Ala Gly Glu Ala Arg Ala Ser Thr Gly Ser Ser 355
360 365 Asp Ser Ser Pro Gly Gly
His Gly Thr Gln Val Asn Val Thr Cys Ile 370 375
380 Val Asn Val Cys Ser Ser Ser Asp His Ser Ser
Gln Cys Ser Ser Gln 385 390 395
400 Ala Ser Ser Thr Met Gly Asp Thr Asp Ser Ser Pro Ser Glu Ser Pro
405 410 415 Lys Asp
Glu Gln Val Pro Phe Ser Lys Glu Glu Cys Ala Phe Arg Ser 420
425 430 Gln Leu Glu Thr Pro Glu Thr
Leu Leu Gly Ser Thr Glu Glu Lys Pro 435 440
445 Leu Pro Leu Gly Val Pro Asp Ala Gly Met Lys Pro
Ser 450 455 460 33417DNAHomo
sapiens 3cggaggcagc gagaaagcgc agccaggcgg ctgctcggcg ttctctcagg
tgactgctcg 60gagttctccc agtgtttggt gttgcaagca ggatccaaag gagacctata
gtgactccca 120ggagctctta gtgaccaagt gaaggtacct gtggggctca ttgtgcccat
tgctctttca 180ctgctttcaa ctggtagttg tgggttgaag cactggacaa tgccacatac
tttgtggatg 240gtgtgggtct tgggggtcat catcagcctc tccaaggaag aatcctccaa
tcaggcttct 300ctgtcttgtg accgcaatgg tatctgcaag ggcagctcag gatctttaaa
ctccattccc 360tcagggctca cagaagctgt aaaaagcctt gacctgtcca acaacaggat
cacctacatt 420agcaacagtg acctacagag gtgtgtgaac ctccaggctc tggtgctgac
atccaatgga 480attaacacaa tagaggaaga ttctttttct tccctgggca gtcttgaaca
tttagactta 540tcctataatt acttatctaa tttatcgtct tcctggttca agcccctttc
ttctttaaca 600ttcttaaact tactgggaaa tccttacaaa accctagggg aaacatctct
tttttctcat 660ctcacaaaat tgcaaatcct gagagtggga aatatggaca ccttcactaa
gattcaaaga 720aaagattttg ctggacttac cttccttgag gaacttgaga ttgatgcttc
agatctacag 780agctatgagc caaaaagttt gaagtcaatt cagaatgtaa gtcatctgat
ccttcatatg 840aagcagcata ttttactgct ggagattttt gtagatgtta caagttccgt
ggaatgtttg 900gaactgcgag atactgattt ggacactttc catttttcag aactatccac
tggtgaaaca 960aattcattga ttaaaaagtt tacatttaga aatgtgaaaa tcaccgatga
aagtttgttt 1020caggttatga aacttttgaa tcagatttct ggattgttag aattagagtt
tgatgactgt 1080acccttaatg gagttggtaa ttttagagca tctgataatg acagagttat
agatccaggt 1140aaagtggaaa cgttaacaat ccggaggctg catattccaa ggttttactt
attttatgat 1200ctgagcactt tatattcact tacagaaaga gttaaaagaa tcacagtaga
aaacagtaaa 1260gtttttctgg ttccttgttt actttcacaa catttaaaat cattagaata
cttggatctc 1320agtgaaaatt tgatggttga agaatacttg aaaaattcag cctgtgagga
tgcctggccc 1380tctctacaaa ctttaatttt aaggcaaaat catttggcat cattggaaaa
aaccggagag 1440actttgctca ctctgaaaaa cttgactaac attgatatca gtaagaatag
ttttcattct 1500atgcctgaaa cttgtcagtg gccagaaaag atgaaatatt tgaacttatc
cagcacacga 1560atacacagtg taacaggctg cattcccaag acactggaaa ttttagatgt
tagcaacaac 1620aatctcaatt tattttcttt gaatttgccg caactcaaag aactttatat
ttccagaaat 1680aagttgatga ctctaccaga tgcctccctc ttacccatgt tactagtatt
gaaaatcagt 1740aggaatgcaa taactacgtt ttctaaggag caacttgact catttcacac
actgaagact 1800ttggaagctg gtggcaataa cttcatttgc tcctgtgaat tcctctcctt
cactcaggag 1860cagcaagcac tggccaaagt cttgattgat tggccagcaa attacctgtg
tgactctcca 1920tcccatgtgc gtggccagca ggttcaggat gtccgcctct cggtgtcgga
atgtcacagg 1980acagcactgg tgtctggcat gtgctgtgct ctgttcctgc tgatcctgct
cacgggggtc 2040ctgtgccacc gtttccatgg cctgtggtat atgaaaatga tgtgggcctg
gctccaggcc 2100aaaaggaagc ccaggaaagc tcccagcagg aacatctgct atgatgcatt
tgtttcttac 2160agtgagcggg atgcctactg ggtggagaac cttatggtcc aggagctgga
gaacttcaat 2220ccccccttca agttgtgtct tcataagcgg gacttcattc ctggcaagtg
gatcattgac 2280aatatcattg actccattga aaagagccac aaaactgtct ttgtgctttc
tgaaaacttt 2340gtgaagagtg agtggtgcaa gtatgaactg gacttctccc atttccgtct
ttttgatgag 2400aacaatgatg ctgccattct cattcttctg gagcccattg agaaaaaagc
cattccccag 2460cgcttctgca agctgcggaa gataatgaac accaagacct acctggagtg
gcccatggac 2520gaggctcagc gggaaggatt ttgggtaaat ctgagagctg cgataaagtc
ctaggttccc 2580atatttaaga ccagtctttg tctagttggg atctttatgt cactagttat
agttaagttc 2640attcagacat aattatataa aaactacgtg gatgtaccgt catttgagga
cttgcttact 2700aaaactacaa aacttcaaat tttgtctggg gtgctgtttt ataaacatat
gccagattta 2760aaaattggtt tttggttttt cttttttcta tgagataacc atgatcataa
gtctattact 2820gatatctgaa tatagtccct tggtatccaa gggaattggt tgcaggatcc
tcgtggatat 2880caaaattcat agatgatcaa gtcccttata agagtggcat agtatttgca
tataacctgt 2940gtacattctc ctgtatactt taaatcatct ctagattact tatgataccc
aatacaatgt 3000aaatactatg taaatagttg tactgtcttt ttatttatat tattattgtt
attttttatt 3060ttcaaaattt ttaaaacata cttttgatcc acagttggtt gacttcatgg
atgcagaacc 3120catggatata gagggccaac tgtaatctgt agcaactggc ttagttcatt
aggaaacagc 3180acaaatgaac ttaagattct caatgactgt gtcattcttt cttcctgcta
agagactcct 3240ctgtggccac aaaaggcatt ctctgtccta cctagctgtc acttctctgt
gcagctgatc 3300tcaagagcaa caaggcaaag tatttggggc actccccaaa acttgttgct
attcctagaa 3360aaaagtgctg tgtatttcct attaaacttt acaggatgag aaaaaaaaaa
aaaaaaa 34174784PRTHomo sapiens 4Met Pro His Thr Leu Trp Met Val Trp
Val Leu Gly Val Ile Ile Ser 1 5 10
15 Leu Ser Lys Glu Glu Ser Ser Asn Gln Ala Ser Leu Ser Cys
Asp Arg 20 25 30
Asn Gly Ile Cys Lys Gly Ser Ser Gly Ser Leu Asn Ser Ile Pro Ser
35 40 45 Gly Leu Thr Glu
Ala Val Lys Ser Leu Asp Leu Ser Asn Asn Arg Ile 50
55 60 Thr Tyr Ile Ser Asn Ser Asp Leu
Gln Arg Cys Val Asn Leu Gln Ala 65 70
75 80 Leu Val Leu Thr Ser Asn Gly Ile Asn Thr Ile Glu
Glu Asp Ser Phe 85 90
95 Ser Ser Leu Gly Ser Leu Glu His Leu Asp Leu Ser Tyr Asn Tyr Leu
100 105 110 Ser Asn Leu
Ser Ser Ser Trp Phe Lys Pro Leu Ser Ser Leu Thr Phe 115
120 125 Leu Asn Leu Leu Gly Asn Pro Tyr
Lys Thr Leu Gly Glu Thr Ser Leu 130 135
140 Phe Ser His Leu Thr Lys Leu Gln Ile Leu Arg Val Gly
Asn Met Asp 145 150 155
160 Thr Phe Thr Lys Ile Gln Arg Lys Asp Phe Ala Gly Leu Thr Phe Leu
165 170 175 Glu Glu Leu Glu
Ile Asp Ala Ser Asp Leu Gln Ser Tyr Glu Pro Lys 180
185 190 Ser Leu Lys Ser Ile Gln Asn Val Ser
His Leu Ile Leu His Met Lys 195 200
205 Gln His Ile Leu Leu Leu Glu Ile Phe Val Asp Val Thr Ser
Ser Val 210 215 220
Glu Cys Leu Glu Leu Arg Asp Thr Asp Leu Asp Thr Phe His Phe Ser 225
230 235 240 Glu Leu Ser Thr Gly
Glu Thr Asn Ser Leu Ile Lys Lys Phe Thr Phe 245
250 255 Arg Asn Val Lys Ile Thr Asp Glu Ser Leu
Phe Gln Val Met Lys Leu 260 265
270 Leu Asn Gln Ile Ser Gly Leu Leu Glu Leu Glu Phe Asp Asp Cys
Thr 275 280 285 Leu
Asn Gly Val Gly Asn Phe Arg Ala Ser Asp Asn Asp Arg Val Ile 290
295 300 Asp Pro Gly Lys Val Glu
Thr Leu Thr Ile Arg Arg Leu His Ile Pro 305 310
315 320 Arg Phe Tyr Leu Phe Tyr Asp Leu Ser Thr Leu
Tyr Ser Leu Thr Glu 325 330
335 Arg Val Lys Arg Ile Thr Val Glu Asn Ser Lys Val Phe Leu Val Pro
340 345 350 Cys Leu
Leu Ser Gln His Leu Lys Ser Leu Glu Tyr Leu Asp Leu Ser 355
360 365 Glu Asn Leu Met Val Glu Glu
Tyr Leu Lys Asn Ser Ala Cys Glu Asp 370 375
380 Ala Trp Pro Ser Leu Gln Thr Leu Ile Leu Arg Gln
Asn His Leu Ala 385 390 395
400 Ser Leu Glu Lys Thr Gly Glu Thr Leu Leu Thr Leu Lys Asn Leu Thr
405 410 415 Asn Ile Asp
Ile Ser Lys Asn Ser Phe His Ser Met Pro Glu Thr Cys 420
425 430 Gln Trp Pro Glu Lys Met Lys Tyr
Leu Asn Leu Ser Ser Thr Arg Ile 435 440
445 His Ser Val Thr Gly Cys Ile Pro Lys Thr Leu Glu Ile
Leu Asp Val 450 455 460
Ser Asn Asn Asn Leu Asn Leu Phe Ser Leu Asn Leu Pro Gln Leu Lys 465
470 475 480 Glu Leu Tyr Ile
Ser Arg Asn Lys Leu Met Thr Leu Pro Asp Ala Ser 485
490 495 Leu Leu Pro Met Leu Leu Val Leu Lys
Ile Ser Arg Asn Ala Ile Thr 500 505
510 Thr Phe Ser Lys Glu Gln Leu Asp Ser Phe His Thr Leu Lys
Thr Leu 515 520 525
Glu Ala Gly Gly Asn Asn Phe Ile Cys Ser Cys Glu Phe Leu Ser Phe 530
535 540 Thr Gln Glu Gln Gln
Ala Leu Ala Lys Val Leu Ile Asp Trp Pro Ala 545 550
555 560 Asn Tyr Leu Cys Asp Ser Pro Ser His Val
Arg Gly Gln Gln Val Gln 565 570
575 Asp Val Arg Leu Ser Val Ser Glu Cys His Arg Thr Ala Leu Val
Ser 580 585 590 Gly
Met Cys Cys Ala Leu Phe Leu Leu Ile Leu Leu Thr Gly Val Leu 595
600 605 Cys His Arg Phe His Gly
Leu Trp Tyr Met Lys Met Met Trp Ala Trp 610 615
620 Leu Gln Ala Lys Arg Lys Pro Arg Lys Ala Pro
Ser Arg Asn Ile Cys 625 630 635
640 Tyr Asp Ala Phe Val Ser Tyr Ser Glu Arg Asp Ala Tyr Trp Val Glu
645 650 655 Asn Leu
Met Val Gln Glu Leu Glu Asn Phe Asn Pro Pro Phe Lys Leu 660
665 670 Cys Leu His Lys Arg Asp Phe
Ile Pro Gly Lys Trp Ile Ile Asp Asn 675 680
685 Ile Ile Asp Ser Ile Glu Lys Ser His Lys Thr Val
Phe Val Leu Ser 690 695 700
Glu Asn Phe Val Lys Ser Glu Trp Cys Lys Tyr Glu Leu Asp Phe Ser 705
710 715 720 His Phe Arg
Leu Phe Asp Glu Asn Asn Asp Ala Ala Ile Leu Ile Leu 725
730 735 Leu Glu Pro Ile Glu Lys Lys Ala
Ile Pro Gln Arg Phe Cys Lys Leu 740 745
750 Arg Lys Ile Met Asn Thr Lys Thr Tyr Leu Glu Trp Pro
Met Asp Glu 755 760 765
Ala Gln Arg Glu Gly Phe Trp Val Asn Leu Arg Ala Ala Ile Lys Ser 770
775 780 52672DNAHomo
sapiens 5cttccagaga gcaatatggc tggttcccca acatgcctca ccctcatcta
tatcctttgg 60cagctcacag ggtcagcagc ctctggaccc gtgaaagagc tggtcggttc
cgttggtggg 120gccgtgactt tccccctgaa gtccaaagta aagcaagttg actctattgt
ctggaccttc 180aacacaaccc ctcttgtcac catacagcca gaagggggca ctatcatagt
gacccaaaat 240cgtaataggg agagagtaga cttcccagat ggaggctact ccctgaagct
cagcaaactg 300aagaagaatg actcagggat ctactatgtg gggatataca gctcatcact
ccagcagccc 360tccacccagg agtacgtgct gcatgtctac gagcacctgt caaagcctaa
agtcaccatg 420ggtctgcaga gcaataagaa tggcacctgt gtgaccaatc tgacatgctg
catggaacat 480ggggaagagg atgtgattta tacctggaag gccctggggc aagcagccaa
tgagtcccat 540aatgggtcca tcctccccat ctcctggaga tggggagaaa gtgatatgac
cttcatctgc 600gttgccagga accctgtcag cagaaacttc tcaagcccca tccttgccag
gaagctctgt 660gaaggtgctg ctgatgaccc agattcctcc atggtcctcc tgtgtctcct
gttggtgccc 720ctcctgctca gtctctttgt actggggcta tttctttggt ttctgaagag
agagagacaa 780gaagagtaca ttgaagagaa gaagagagtg gacatttgtc gggaaactcc
taacatatgc 840ccccattctg gagagaacac agagtacgac acaatccctc acactaatag
aacaatccta 900aaggaagatc cagcaaatac ggtttactcc actgtggaaa taccgaaaaa
gatggaaaat 960ccccactcac tgctcacgat gccagacaca ccaaggctat ttgcctatga
gaatgttatc 1020tagacagcag tgcactcccc taagtctctg ctcaaaaaaa aaacaattct
cggcccaaag 1080aaaacaatca gaagaattca ctgatttgac tagaaacatc aaggaagaat
gaagaacgtt 1140gacttttttc caggataaat tatctctgat gcttctttag atttaagagt
tcataattcc 1200atccactgct gagaaatctc ctcaaaccca gaaggtttaa tcacttcatc
ccaaaaatgg 1260gattgtgaat gtcagcaaac cataaaaaaa gtgcttagaa gtattcctat
agaaatgtaa 1320atgcaaggtc acacatatta atgacagcct gttgtattaa tgatggctcc
aggtcagtgt 1380ctggagtttc attccatccc agggcttgga tgtaaggatt ataccaagag
tcttgctacc 1440aggagggcaa gaagaccaaa acagacagac aagtccagca gaagcagatg
cacctgacaa 1500aaatggatgt attaattggc tctataaact atgtgcccag cactatgctg
agcttacact 1560aattggtcag acgtgctgtc tgccctcatg aaattggctc caaatgaatg
aactactttc 1620atgagcagtt gtagcaggcc tgaccacaga ttcccagagg gccaggtgtg
gatccacagg 1680acttgaaggt caaagttcac aaagatgaag aatcagggta gctgaccatg
tttggcagat 1740actataatgg agacacagaa gtgtgcatgg cccaaggaca aggacctcca
gccaggcttc 1800atttatgcac ttgtgctgca aaagaaaagt ctaggtttta aggctgtgcc
agaacccatc 1860ccaataaaga gaccgagtct gaagtcacat tgtaaatcta gtgtaggaga
cttggagtca 1920ggcagtgaga ctggtggggc acggggggca gtgggtactt gtaaaccttt
aaagatggtt 1980aattcattca atagatattt attaagaacc tatgcggccc ggcatggtgg
ctcacacctg 2040taatcccagc actttgggag gccaaggtgg gtgggtcatc tgaggtcagg
agttcaagac 2100cagcctggcc aacatggtga aaccccatct ctactaaaga tacaaaaatt
tgctgagcgt 2160ggtggtgtgc acctgtaatc ccagctactc gagaggccaa ggcatgagaa
tcgcttgaac 2220ctgggaggtg gaggttgcag tgagctgaga tggcaccact gcactccggc
ctaggcaacg 2280agagcaaaac tccaatacaa acaaacaaac aaacacctgt gctaggtcag
tctggcacgt 2340aagatgaaca tccctaccaa cacagagctc accatctctt atacttaagt
gaaaaacatg 2400gggaagggga aaggggaatg gctgcttttg atatgttccc tgacacatat
cttgaatgga 2460gacctcccta ccaagtgatg aaagtgttga aaaacttaat aacaaatgct
tgttgggcaa 2520gaatgggatt gaggattatc ttctctcaga aaggcattgt gaaggaattg
agccagatct 2580ctctccctac tgcaaaaccc tattgtagta aaaaagtctt ctttactatc
ttaataaaac 2640agatattgtg agattcaaaa aaaaaaaaaa aa
26726335PRTHomo sapiens 6Met Ala Gly Ser Pro Thr Cys Leu Thr
Leu Ile Tyr Ile Leu Trp Gln 1 5 10
15 Leu Thr Gly Ser Ala Ala Ser Gly Pro Val Lys Glu Leu Val
Gly Ser 20 25 30
Val Gly Gly Ala Val Thr Phe Pro Leu Lys Ser Lys Val Lys Gln Val
35 40 45 Asp Ser Ile Val
Trp Thr Phe Asn Thr Thr Pro Leu Val Thr Ile Gln 50
55 60 Pro Glu Gly Gly Thr Ile Ile Val
Thr Gln Asn Arg Asn Arg Glu Arg 65 70
75 80 Val Asp Phe Pro Asp Gly Gly Tyr Ser Leu Lys Leu
Ser Lys Leu Lys 85 90
95 Lys Asn Asp Ser Gly Ile Tyr Tyr Val Gly Ile Tyr Ser Ser Ser Leu
100 105 110 Gln Gln Pro
Ser Thr Gln Glu Tyr Val Leu His Val Tyr Glu His Leu 115
120 125 Ser Lys Pro Lys Val Thr Met Gly
Leu Gln Ser Asn Lys Asn Gly Thr 130 135
140 Cys Val Thr Asn Leu Thr Cys Cys Met Glu His Gly Glu
Glu Asp Val 145 150 155
160 Ile Tyr Thr Trp Lys Ala Leu Gly Gln Ala Ala Asn Glu Ser His Asn
165 170 175 Gly Ser Ile Leu
Pro Ile Ser Trp Arg Trp Gly Glu Ser Asp Met Thr 180
185 190 Phe Ile Cys Val Ala Arg Asn Pro Val
Ser Arg Asn Phe Ser Ser Pro 195 200
205 Ile Leu Ala Arg Lys Leu Cys Glu Gly Ala Ala Asp Asp Pro
Asp Ser 210 215 220
Ser Met Val Leu Leu Cys Leu Leu Leu Val Pro Leu Leu Leu Ser Leu 225
230 235 240 Phe Val Leu Gly Leu
Phe Leu Trp Phe Leu Lys Arg Glu Arg Gln Glu 245
250 255 Glu Tyr Ile Glu Glu Lys Lys Arg Val Asp
Ile Cys Arg Glu Thr Pro 260 265
270 Asn Ile Cys Pro His Ser Gly Glu Asn Thr Glu Tyr Asp Thr Ile
Pro 275 280 285 His
Thr Asn Arg Thr Ile Leu Lys Glu Asp Pro Ala Asn Thr Val Tyr 290
295 300 Ser Thr Val Glu Ile Pro
Lys Lys Met Glu Asn Pro His Ser Leu Leu 305 310
315 320 Thr Met Pro Asp Thr Pro Arg Leu Phe Ala Tyr
Glu Asn Val Ile 325 330
335 72111DNAHomo sapiens 7gggcagtcgt aggagactct gaaaaagcaa ataaatcaat
gttaaatcag aaatgtgaat 60gtagtaaggg gctgaagaga caggggaaga gaatacatgg
gaaaatattg aaaaggacag 120agtgatcaaa aagagcaggg acatgggagc attgggcagc
acactgggag ccatttcact 180ttatgctctt attgtatgat tgagaaaaaa atgtccttag
tggttaagtg gcttttcaat 240gccacatcag acttgttcca tagcagttga attaggggaa
ggtgaataag ttggaggttg 300gtgacaagga gagaagctgg aacagagagg agagtcagaa
ccagagggaa atgagagact 360gagtaggcat ctcagggttt ttgaaggagt ggattttctt
tgttgcagtc aggggaggtt 420tgtctgttgg ctgcagaaag aagtcagaat agagatatcg
tggggtaggt ttgtttggaa 480cagaaatcaa agaccaattt ttctgagaga aggaaataac
atctgcaaat gatatgctgt 540ttttgctact tccattgtta gctgttctcc caggtgatgg
caatgcagac gggctcaagg 600agcctctctc cttccatgtc acctggatcg catcctttta
caaccattcc tggaaacaaa 660atctggtctc aggttggctg agtgatttgc agactcatac
ctgggacagc aattccagca 720ccatcgtttt cctgtgcccc tggtccaggg gaaacttcag
caatgaggag tggaaggaac 780tggaaacatt attccgtata cgcaccattc ggtcatttga
gggaattcgt agatacgccc 840atgaattgca gtttgaatat ccttttgaga tacaggtgac
aggaggctgt gagctgcact 900ctggaaaggt ctcaggaagc ttcttgcagt tagcttatca
aggatcagac tttgtgagct 960tccagaacaa ttcatggttg ccatatccag tggctgggaa
tatggccaag catttctgca 1020aagtgctcaa tcagaatcag catgaaaatg acataacaca
caatcttctc agtgacacct 1080gcccacgttt catcttgggt cttcttgatg caggaaaggc
acatctccag cggcaagtga 1140agcccgaggc ctggctgtcc catggcccca gtcctggccc
tggccatctg cagcttgtgt 1200gccatgtctc aggattctac ccaaagcccg tgtgggtgat
gtggatgcgg ggtgagcagg 1260agcagcaggg cactcagcga ggggacatct tgcccagtgc
tgatgggaca tggtatctcc 1320gcgcaaccct ggaggtggcc gctggggagg cagctgacct
gtcctgtcgg gtgaagcaca 1380gcagtctaga gggccaggac atcgtcctct actgggagca
tcacagttcc gtgggcttca 1440tcatcttggc ggtgatagtg cctttacttc ttctgatagg
tcttgcgctt tggttcagga 1500aacgctgttt ctgttaagac acaccatgag cctcctcgtc
acccttctcc ttttggggtg 1560agagaccagc agcccaaggg ctccagacac acctgaacac
atcgtgatga tgacgtcctc 1620tcaactctct ttgtaaaaat tttgttattt ttgcttgttt
ctgattaatg attgtttgtc 1680aatataagct caatttaatt ttgcaggatt tgttgttctg
acctgggttc tgggactttt 1740aaattcaaat tttatctcca gatggaatgg ggtcctagca
acctccacat gttcaactat 1800taatggatca tcaggcctgt tttagatatc ccttactcca
gagggccttc cctgacttac 1860aagtgggaag cagtctcttc ctggtctgaa ctcccgccac
attttagccg tactttgcta 1920actgtgctcc tcacttcctc ttcttcattg cagttattta
gatcccccct ttccttctaa 1980tttttcagct ccttcaatgc aaagtacatg tatttttaat
atatgcatcc ctggtgaagg 2040atcttgcctg catgaaacat gttctcaata aaactctgtg
ttgaatttat gccaaaaaaa 2100aaaaaaaaaa a
21118327PRTHomo sapiens 8Met Leu Phe Leu Leu Leu
Pro Leu Leu Ala Val Leu Pro Gly Asp Gly 1 5
10 15 Asn Ala Asp Gly Leu Lys Glu Pro Leu Ser Phe
His Val Thr Trp Ile 20 25
30 Ala Ser Phe Tyr Asn His Ser Trp Lys Gln Asn Leu Val Ser Gly
Trp 35 40 45 Leu
Ser Asp Leu Gln Thr His Thr Trp Asp Ser Asn Ser Ser Thr Ile 50
55 60 Val Phe Leu Cys Pro Trp
Ser Arg Gly Asn Phe Ser Asn Glu Glu Trp 65 70
75 80 Lys Glu Leu Glu Thr Leu Phe Arg Ile Arg Thr
Ile Arg Ser Phe Glu 85 90
95 Gly Ile Arg Arg Tyr Ala His Glu Leu Gln Phe Glu Tyr Pro Phe Glu
100 105 110 Ile Gln
Val Thr Gly Gly Cys Glu Leu His Ser Gly Lys Val Ser Gly 115
120 125 Ser Phe Leu Gln Leu Ala Tyr
Gln Gly Ser Asp Phe Val Ser Phe Gln 130 135
140 Asn Asn Ser Trp Leu Pro Tyr Pro Val Ala Gly Asn
Met Ala Lys His 145 150 155
160 Phe Cys Lys Val Leu Asn Gln Asn Gln His Glu Asn Asp Ile Thr His
165 170 175 Asn Leu Leu
Ser Asp Thr Cys Pro Arg Phe Ile Leu Gly Leu Leu Asp 180
185 190 Ala Gly Lys Ala His Leu Gln Arg
Gln Val Lys Pro Glu Ala Trp Leu 195 200
205 Ser His Gly Pro Ser Pro Gly Pro Gly His Leu Gln Leu
Val Cys His 210 215 220
Val Ser Gly Phe Tyr Pro Lys Pro Val Trp Val Met Trp Met Arg Gly 225
230 235 240 Glu Gln Glu Gln
Gln Gly Thr Gln Arg Gly Asp Ile Leu Pro Ser Ala 245
250 255 Asp Gly Thr Trp Tyr Leu Arg Ala Thr
Leu Glu Val Ala Ala Gly Glu 260 265
270 Ala Ala Asp Leu Ser Cys Arg Val Lys His Ser Ser Leu Glu
Gly Gln 275 280 285
Asp Ile Val Leu Tyr Trp Glu His His Ser Ser Val Gly Phe Ile Ile 290
295 300 Leu Ala Val Ile Val
Pro Leu Leu Leu Leu Ile Gly Leu Ala Leu Trp 305 310
315 320 Phe Arg Lys Arg Cys Phe Cys
325 91396DNAHomo sapiens 9ggcagttgga agagagaaga agtcactaca
gggtactgag gaaaagcttt gctgaaattg 60gagatcaaat accagctctg ccagtaagaa
gttgcatctc ccagtgaaat gctgctgctg 120ccatttcaac tgttagctgt tctctttcct
ggtggtaaca gtgaacatgc cttccagggg 180ccgacctcct ttcatgttat ccagacctcg
tcctttacca atagtacctg ggcacaaact 240caaggctcag gctggttgga tgatttgcag
attcatggct gggatagcga ctcaggcact 300gccatattcc tgaagccttg gtctaaaggt
aactttagtg ataaggaggt tgctgagtta 360gaggagatat tccgagtcta catctttgga
ttcgctcgag aagtacaaga ctttgccggt 420gatttccaga tgaaataccc ctttgagatc
cagggcatag caggctgtga gctacattct 480ggaggtgcca tagtaagctt cctgagggga
gctctaggag gattggattt cctgagtgtc 540aagaatgctt catgtgtgcc ttccccagaa
ggtggcagca gggcacagaa attctgtgca 600ctaatcatac aatatcaagg tatcatggaa
actgtgagaa ttctcctcta tgaaacctgc 660ccccgatatc tcttgggcgt cctcaatgca
ggaaaagcag atctgcaaag acaagtgaag 720cctgaggcct ggctgtccag tggccccagt
cctggacctg gccgtctgca gcttgtgtgc 780catgtctcag gattctaccc aaagcccgtg
tgggtgatgt ggatgcgggg tgagcaggag 840cagcagggca ctcagctagg ggacatcctg
cccaatgcta actggacatg gtatctccga 900gcaaccctgg atgtggcaga tggggaggcg
gctggcctgt cctgtcgggt gaagcacagc 960agtttagagg gccaggacat catcctctac
tggagaaacc ccacctccat tggctcaatt 1020gttttggcaa taatagtgcc ttccttgctc
cttttgctat gccttgcatt atggtatatg 1080aggcgccggt catatcagaa tatcccatga
gccatcatca tgtctcctct cccattcgca 1140ataagtacca agaagcccaa gatatcagcc
caaaagtcaa tcttatcata tttcaaatga 1200ttttcaaatt tgatgaaatc agagttttca
tgtattttaa aataaattat tatttaaaca 1260tcagcaaaaa agtacttaaa actgtaaatt
tattatgaga ctgtactaac agtgtgattc 1320accctgattt tacacacatt aaaatgttag
aaaaaatgtg tctcaaaata aatgaaatat 1380aatacatatg acttaa
139610333PRTHomo sapiens 10Met Leu Leu
Leu Pro Phe Gln Leu Leu Ala Val Leu Phe Pro Gly Gly 1 5
10 15 Asn Ser Glu His Ala Phe Gln Gly
Pro Thr Ser Phe His Val Ile Gln 20 25
30 Thr Ser Ser Phe Thr Asn Ser Thr Trp Ala Gln Thr Gln
Gly Ser Gly 35 40 45
Trp Leu Asp Asp Leu Gln Ile His Gly Trp Asp Ser Asp Ser Gly Thr 50
55 60 Ala Ile Phe Leu
Lys Pro Trp Ser Lys Gly Asn Phe Ser Asp Lys Glu 65 70
75 80 Val Ala Glu Leu Glu Glu Ile Phe Arg
Val Tyr Ile Phe Gly Phe Ala 85 90
95 Arg Glu Val Gln Asp Phe Ala Gly Asp Phe Gln Met Lys Tyr
Pro Phe 100 105 110
Glu Ile Gln Gly Ile Ala Gly Cys Glu Leu His Ser Gly Gly Ala Ile
115 120 125 Val Ser Phe Leu
Arg Gly Ala Leu Gly Gly Leu Asp Phe Leu Ser Val 130
135 140 Lys Asn Ala Ser Cys Val Pro Ser
Pro Glu Gly Gly Ser Arg Ala Gln 145 150
155 160 Lys Phe Cys Ala Leu Ile Ile Gln Tyr Gln Gly Ile
Met Glu Thr Val 165 170
175 Arg Ile Leu Leu Tyr Glu Thr Cys Pro Arg Tyr Leu Leu Gly Val Leu
180 185 190 Asn Ala Gly
Lys Ala Asp Leu Gln Arg Gln Val Lys Pro Glu Ala Trp 195
200 205 Leu Ser Ser Gly Pro Ser Pro Gly
Pro Gly Arg Leu Gln Leu Val Cys 210 215
220 His Val Ser Gly Phe Tyr Pro Lys Pro Val Trp Val Met
Trp Met Arg 225 230 235
240 Gly Glu Gln Glu Gln Gln Gly Thr Gln Leu Gly Asp Ile Leu Pro Asn
245 250 255 Ala Asn Trp Thr
Trp Tyr Leu Arg Ala Thr Leu Asp Val Ala Asp Gly 260
265 270 Glu Ala Ala Gly Leu Ser Cys Arg Val
Lys His Ser Ser Leu Glu Gly 275 280
285 Gln Asp Ile Ile Leu Tyr Trp Arg Asn Pro Thr Ser Ile Gly
Ser Ile 290 295 300
Val Leu Ala Ile Ile Val Pro Ser Leu Leu Leu Leu Leu Cys Leu Ala 305
310 315 320 Leu Trp Tyr Met Arg
Arg Arg Ser Tyr Gln Asn Ile Pro 325 330
116701DNAHomo sapiens 11aaagccctca gcctttgtgt ccttctctgc
gccggagtgg ctgcagctca cccctcagct 60ccccttgggg cccagctggg agccgagata
gaagctcctg tcgccgctgg gcttctcgcc 120tcccgcagag ggccacacag agaccgggat
ggccacctcc atgggcctgc tgctgctgct 180gctgctgctc ctgacccagc ccggggcggg
gacgggagct gacacggagg cggtggtctg 240cgtggggacc gcctgctaca cggcccactc
gggcaagctg agcgctgccg aggcccagaa 300ccactgcaac cagaacgggg gcaacctggc
cactgtgaag agcaaggagg aggcccagca 360cgtccagcga gtactggccc agctcctgag
gcgggaggca gccctgacgg cgaggatgag 420caagttctgg attgggctcc agcgagagaa
gggcaagtgc ctggacccta gtctgccgct 480gaagggcttc agctgggtgg gcggggggga
ggacacgcct tactctaact ggcacaagga 540gctccggaac tcgtgcatct ccaagcgctg
tgtgtctctg ctgctggacc tgtcccagcc 600gctccttccc agccgcctcc ccaagtggtc
tgagggcccc tgtgggagcc caggctcccc 660cggaagtaac attgagggct tcgtgtgcaa
gttcagcttc aaaggcatgt gccggcctct 720ggccctgggg ggcccaggtc aggtgaccta
caccaccccc ttccagacca ccagttcctc 780cttggaggct gtgccctttg cctctgcggc
caatgtagcc tgtggggaag gtgacaagga 840cgagactcag agtcattatt tcctgtgcaa
ggagaaggcc cccgatgtgt tcgactgggg 900cagctcgggc cccctctgtg tcagccccaa
gtatggctgc aacttcaaca atgggggctg 960ccaccaggac tgctttgaag ggggggatgg
ctccttcctc tgcggctgcc gaccaggatt 1020ccggctgctg gatgacctgg tgacctgtgc
ctctcgaaac ccttgcagct ccagcccatg 1080tcgtgggggg gccacgtgcg tcctgggacc
ccatgggaaa aactacacgt gccgctgccc 1140ccaagggtac cagctggact cgagtcagct
ggactgtgtg gacgtggatg aatgccagga 1200ctccccctgt gcccaggagt gtgtcaacac
ccctgggggc ttccgctgcg aatgctgggt 1260tggctatgag ccgggcggtc ctggagaggg
ggcctgtcag gatgtggatg agtgtgctct 1320gggtcgctcg ccttgcgccc agggctgcac
caacacagat ggctcatttc actgctcctg 1380tgaggagggc tacgtcctgg ccggggagga
cgggactcag tgccaggacg tggatgagtg 1440tgtgggcccg gggggccccc tctgcgacag
cttgtgcttc aacacacaag ggtccttcca 1500ctgtggctgc ctgccaggct gggtgctggc
cccaaatggg gtctcttgca ccatggggcc 1560tgtgtctctg ggaccaccat ctgggccccc
cgatgaggag gacaaaggag agaaagaagg 1620gagcaccgtg ccccgtgctg caacagccag
tcccacaagg ggccccgagg gcacccccaa 1680ggctacaccc accacaagta gaccttcgct
gtcatctgac gcccccatca catctgcccc 1740actcaagatg ctggccccca gtgggtcccc
aggcgtctgg agggagccca gcatccatca 1800cgccacagct gcctctggcc cccaggagcc
tgcaggtggg gactcctccg tggccacaca 1860aaacaacgat ggcactgacg ggcaaaagct
gcttttattc tacatcctag gcaccgtggt 1920ggccatccta ctcctgctgg ccctggctct
ggggctactg gtctatcgca agcggagagc 1980gaagagggag gagaagaagg agaagaagcc
ccagaatgcg gcagacagtt actcctgggt 2040tccagagcga gctgagagca gggccatgga
gaaccagtac agtccgacac ctgggacaga 2100ctgctgaaag tgaggtggcc ctagagacac
tagagtcacc agccaccatc ctcagagctt 2160tgaactcccc attccaaagg ggcacccaca
tttttttgaa agactggact ggaatcttag 2220caaacaattg taagtctcct ccttaaaggc
cccttggaac atgcaggtat tttctacggg 2280tgtttgatgt tcctgaagtg gaagctgtgt
gttggcgtgc cacggtgggg atttcgtgac 2340tctataatga ttgttactcc ccctcccttt
tcaaattcca atgtgaccaa ttccggatca 2400gggtgtgagg aggccggggc taaggggctc
ccctgaatat cttctctgct cacttccacc 2460atctaagagg aaaaggtgag ttgctcatgc
tgattaggat tgaaatgatt tgtttctctt 2520cctaggatga aaactaaatc aattaattat
tcaattaggt aagaagatct ggttttttgg 2580tcaaagggaa catgttcgga ctggaaacat
ttctttacat ttgcattcct ccatttcgcc 2640agcacaagtc ttgctaaatg tgatactgtt
gacatcctcc agaatggcca gaagtgcaat 2700taacctctta ggtggcaagg aggcaggaag
tgcctcttta gttcttacat ttctaatagc 2760cttgggttta tttgcaaagg aagcttgaaa
aatatgagaa aagttgcttg aagtgcatta 2820caggtgtttg tgaagtcaca taatctacgg
ggctagggcg agagaggcca gggatttgtt 2880cacagatact tgaattaatt catccaaatg
tactgaggtt accacacact tgactacgga 2940tgtgatcaac actaacaagg aaacaaattc
aaggacaacc tgtctttgag ccagggcagg 3000cctcagacac cctgcctgtg gccccgcctc
cacttcatcc tgcccggaat gccagtgctc 3060cgagctcaga cagaggaagc cctgcagaaa
gttccatcag gctgtttcct aaaggatgtg 3120tgaacgggag atgatgcact gtgttttgaa
agttgtcatt ttaaagcatt ttagcacagt 3180tcatagtcca cagttgatgc agcatcctga
gattttaaat cctgaagtgt gggtggcgca 3240cacaccaagt agggagctag tcaggcagtt
tgcttaagga acttttgttc tctgtctctt 3300ttccttaaaa ttgggggtaa ggagggaagg
aagagggaaa gagatgacta actaaaatca 3360tttttacagc aaaaactgct caaagccatt
taaattatat cctcatttta aaagttacat 3420ttgcaaatat ttctccctat gataatgtag
tcgatagtgt gcactctttc tctctctctc 3480tctctctcac acacacacac acacacacac
acacacacac agagacacgg caccattctg 3540cctggggcac tggaacacat tcctgggggt
caccgatggt cagagtcact agaagttacc 3600tgagtatctc tgggaggcct catgtctcct
gtgggctttt taccaccact gtgcaggaga 3660acagacagag gaaatgtgtc tccctccaag
gccccaaagc ctcagagaaa gggtgtttct 3720ggttttgcct tagcaatgca tcggtctctg
aggtgacact ctggagtggt tgaagggcca 3780caaggtgcag ggttaatact cttgccagtt
ttgaaatata gatgctatgg ttcagattgt 3840ttttaataga aaactaaagg ggcaggggaa
gtgaaaggaa agatggaggt tttgtgcggc 3900tcgatggggc atttggaact tctttttaaa
gtcatctcat ggtctccagt tttcagttgg 3960aactctggtg tttaacactt aagggagaca
aaggctgtgt ccatttggca aaacttcctt 4020ggccacgaga ctctaggtga tgtgtgaagc
tgggcagtct gtggtgtgga gagcagccat 4080ctgtctggcc attcagagga ttctaaagac
atggctggat gcgctgctga ccaacatcag 4140cacttaaata aatgcaaatg caacatttct
ccctctgggc cttgaaaatc cttgccctta 4200tcatttgggg tgaaggagac atttctgtcc
ttggcttccc acagccccaa cgcagtctgt 4260gtatgattcc tgggatccaa cgagccctcc
tattttcaca gtgttctgat tgctctcaca 4320gcccaggccc atcgtctgtt ctctgaatgc
agccctgttc tcaacaacag ggaggtcatg 4380gaacccctct gtggaaccca caaggggaga
aatgggtgat aaagaatcca gttcctcaaa 4440accttccctg gcaggctggg tccctctcct
gctgggtggt gctttctctt gcacaccact 4500cccaccacgg ggggagagcc agcaacccaa
ccagacagct caggttgtgc atctgatgga 4560aaccactggg ctcaaacacg tgctttattc
tcctgtttat ttttgctgtt actttgaagc 4620atggaaattc ttgtttgggg gatcttgggg
ctacagtagt gggtaaacaa atgcccaccg 4680gccaagaggc cattaacaaa tcgtccttgt
cctgaggggc cccagcttgc tcgggcgtgg 4740cacagtgggg aatccaaggg tcacagtatg
gggagaggtg caccctgcca cctgctaact 4800tctcgctaga cacagtgttt ctgcccaggt
gacctgttca gcagcagaac aagccagggc 4860catggggacg ggggaagttt tcacttggag
atggacacca agacaatgaa gatttgttgt 4920ccaaataggt caataattct gggagactct
tggaaaaaac tgaatatatt caggaccaac 4980tctctccctc ccctcatccc acatctcaaa
gcagacaatg taaagagaga acatctcaca 5040cacccagctc gccatgccta ctcattcctg
aatttcaggt gccatcactg ctctttcttt 5100cttctttgtc atttgagaaa ggatgcagga
ggacaattcc cacagataat ctgaggaatg 5160cagaaaaacc agggcaggac agttatcgac
aatgcattag aacttggtga gcatcctctg 5220tagagggact ccacccctgc tcaacagctt
ggcttccagg caagaccaac cacatctggt 5280ctctgccttc ggtggcccac acacctaagc
gtcatcgtca ttgccatagc atcatgatgc 5340aacacatcta cgtgtagcac tacgacgtta
tgtttgggta atgtggggat gaactgcatg 5400aggctctgat taaggatgtg gggaagtggg
ctgcggtcac tgtcggcctt gcaaggccac 5460ctggaggcct gtctgttagc cagtggtgga
ggagcaaggc ttcaggaagg gccagccaca 5520tgccatcttc cctgcgatca ggcaaaaaag
tggaattaaa aagtcaaacc tttatatgca 5580tgtgttatgt ccattttgca ggatgaactg
agtttaaaag aatttttttt tctcttcaag 5640ttgctttgtc ttttccatcc tcatcacaag
cccttgtttg agtgtcttat ccctgagcaa 5700tctttcgatg gatggagatg atcattaggt
acttttgttt caacctttat tcctgtaaat 5760atttctgtga aaactaggag aacagagatg
agatttgaca aaaaaaaatt gaattaaaaa 5820taacacagtc tttttaaaac taacatagga
aagcctttcc tattatttct cttcttagct 5880tctccattgt ctaaatcagg aaaacaggaa
aacacagctt tctagcagct gcaaaatggt 5940ttaatgcccc ctacatattt ccatcacctt
gaacaatagc tttagcttgg gaatctgaga 6000tatgatccca gaaaacatct gtctctactt
cggctgcaaa acccatggtt taaatctata 6060tggtttgtgc attttctcaa ctaaaaatag
agatgataat ccgaattctc catatattca 6120ctaatcaaag acactatttt catactagat
tcctgagaca aatactcact gaagggcttg 6180tttaaaaata aattgtgttt tggtctgttc
ttgtagataa tgcccttcta ttttaggtag 6240aagctctgga atccctttat tgtgctgttg
ctcttatctg caaggtggca agcagttctt 6300ttcagcagat tttgcccact attcctctga
gctgaagttc tttgcataga tttggcttaa 6360gcttgaatta gatccctgca aaggcttgct
ctgtgatgtc agatgtaatt gtaaatgtca 6420gtaatcactt catgaatgct aaatgagaat
gtaagtattt ttaaatgtgt gtatttcaaa 6480tttgtttgac taattctgga attacaagat
ttctatgcag gatttacctt catcctgtgc 6540atgtttccca aactgtgagg agggaaggct
cagagatcga gcttctcctc tgagttctaa 6600caaaatggtg ctttgagggt cagcctttag
gaaggtgcag ctttgttgtc ctttgagctt 6660tctgttatgt gcctatccta ataaactctt
aaacacattg a 670112652PRTHomo sapiens 12Met Ala Thr
Ser Met Gly Leu Leu Leu Leu Leu Leu Leu Leu Leu Thr 1 5
10 15 Gln Pro Gly Ala Gly Thr Gly Ala
Asp Thr Glu Ala Val Val Cys Val 20 25
30 Gly Thr Ala Cys Tyr Thr Ala His Ser Gly Lys Leu Ser
Ala Ala Glu 35 40 45
Ala Gln Asn His Cys Asn Gln Asn Gly Gly Asn Leu Ala Thr Val Lys 50
55 60 Ser Lys Glu Glu
Ala Gln His Val Gln Arg Val Leu Ala Gln Leu Leu 65 70
75 80 Arg Arg Glu Ala Ala Leu Thr Ala Arg
Met Ser Lys Phe Trp Ile Gly 85 90
95 Leu Gln Arg Glu Lys Gly Lys Cys Leu Asp Pro Ser Leu Pro
Leu Lys 100 105 110
Gly Phe Ser Trp Val Gly Gly Gly Glu Asp Thr Pro Tyr Ser Asn Trp
115 120 125 His Lys Glu Leu
Arg Asn Ser Cys Ile Ser Lys Arg Cys Val Ser Leu 130
135 140 Leu Leu Asp Leu Ser Gln Pro Leu
Leu Pro Ser Arg Leu Pro Lys Trp 145 150
155 160 Ser Glu Gly Pro Cys Gly Ser Pro Gly Ser Pro Gly
Ser Asn Ile Glu 165 170
175 Gly Phe Val Cys Lys Phe Ser Phe Lys Gly Met Cys Arg Pro Leu Ala
180 185 190 Leu Gly Gly
Pro Gly Gln Val Thr Tyr Thr Thr Pro Phe Gln Thr Thr 195
200 205 Ser Ser Ser Leu Glu Ala Val Pro
Phe Ala Ser Ala Ala Asn Val Ala 210 215
220 Cys Gly Glu Gly Asp Lys Asp Glu Thr Gln Ser His Tyr
Phe Leu Cys 225 230 235
240 Lys Glu Lys Ala Pro Asp Val Phe Asp Trp Gly Ser Ser Gly Pro Leu
245 250 255 Cys Val Ser Pro
Lys Tyr Gly Cys Asn Phe Asn Asn Gly Gly Cys His 260
265 270 Gln Asp Cys Phe Glu Gly Gly Asp Gly
Ser Phe Leu Cys Gly Cys Arg 275 280
285 Pro Gly Phe Arg Leu Leu Asp Asp Leu Val Thr Cys Ala Ser
Arg Asn 290 295 300
Pro Cys Ser Ser Ser Pro Cys Arg Gly Gly Ala Thr Cys Val Leu Gly 305
310 315 320 Pro His Gly Lys Asn
Tyr Thr Cys Arg Cys Pro Gln Gly Tyr Gln Leu 325
330 335 Asp Ser Ser Gln Leu Asp Cys Val Asp Val
Asp Glu Cys Gln Asp Ser 340 345
350 Pro Cys Ala Gln Glu Cys Val Asn Thr Pro Gly Gly Phe Arg Cys
Glu 355 360 365 Cys
Trp Val Gly Tyr Glu Pro Gly Gly Pro Gly Glu Gly Ala Cys Gln 370
375 380 Asp Val Asp Glu Cys Ala
Leu Gly Arg Ser Pro Cys Ala Gln Gly Cys 385 390
395 400 Thr Asn Thr Asp Gly Ser Phe His Cys Ser Cys
Glu Glu Gly Tyr Val 405 410
415 Leu Ala Gly Glu Asp Gly Thr Gln Cys Gln Asp Val Asp Glu Cys Val
420 425 430 Gly Pro
Gly Gly Pro Leu Cys Asp Ser Leu Cys Phe Asn Thr Gln Gly 435
440 445 Ser Phe His Cys Gly Cys Leu
Pro Gly Trp Val Leu Ala Pro Asn Gly 450 455
460 Val Ser Cys Thr Met Gly Pro Val Ser Leu Gly Pro
Pro Ser Gly Pro 465 470 475
480 Pro Asp Glu Glu Asp Lys Gly Glu Lys Glu Gly Ser Thr Val Pro Arg
485 490 495 Ala Ala Thr
Ala Ser Pro Thr Arg Gly Pro Glu Gly Thr Pro Lys Ala 500
505 510 Thr Pro Thr Thr Ser Arg Pro Ser
Leu Ser Ser Asp Ala Pro Ile Thr 515 520
525 Ser Ala Pro Leu Lys Met Leu Ala Pro Ser Gly Ser Pro
Gly Val Trp 530 535 540
Arg Glu Pro Ser Ile His His Ala Thr Ala Ala Ser Gly Pro Gln Glu 545
550 555 560 Pro Ala Gly Gly
Asp Ser Ser Val Ala Thr Gln Asn Asn Asp Gly Thr 565
570 575 Asp Gly Gln Lys Leu Leu Leu Phe Tyr
Ile Leu Gly Thr Val Val Ala 580 585
590 Ile Leu Leu Leu Leu Ala Leu Ala Leu Gly Leu Leu Val Tyr
Arg Lys 595 600 605
Arg Arg Ala Lys Arg Glu Glu Lys Lys Glu Lys Lys Pro Gln Asn Ala 610
615 620 Ala Asp Ser Tyr Ser
Trp Val Pro Glu Arg Ala Glu Ser Arg Ala Met 625 630
635 640 Glu Asn Gln Tyr Ser Pro Thr Pro Gly Thr
Asp Cys 645 650 132664DNAHomo
sapiens 13gctatctgag gaagttctgg tagagagaag agctcaagag catgggcaga
gtcagctcct 60gagtgggctg aacgctcccc tcagctcctg cagtgctaat taagggaggg
agcagcgggg 120agcttgcagt gaccaagagg gtgttgaggc taggaggcca cgataaacag
gatacgataa 180aagtccttaa ccaagacgca gatgggaaga agcgttagag cgagcagcac
tcacatctca 240agaaccagcc tttcaaacag tttccagaga tggattatcc tactttactt
ttggctcttc 300ttcatgtata cagagctcta tgtgaagagg tgctttggca tacatcagtt
ccctttgccg 360agaacatgtc tctagaatgt gtgtatccat caatgggcat cttaacacag
gtggagtggt 420tcaagatcgg gacccagcag gattccatag ccattttcag ccctactcat
ggcatggtca 480taaggaagcc ctatgctgag agggtttact ttttgaattc aacgatggct
tccaataaca 540tgactctttt ctttcggaat gcctctgaag atgatgttgg ctactattcc
tgctctcttt 600acacttaccc acagggaact tggcagaagg tgatacaggt ggttcagtca
gatagttttg 660aggcagctgt gccatcaaat agccacattg tttcggaacc tggaaagaat
gtcacactca 720cttgtcagcc tcagatgacg tggcctgtgc aggcagtgag gtgggaaaag
atccagcccc 780gtcagatcga cctcttaact tactgcaact tggtccatgg cagaaatttc
acctccaagt 840tcccaagaca aatagtgagc aactgcagcc acggaaggtg gagcgtcatc
gtcatccccg 900atgtcacagt ctcagactcg gggctttacc gctgctactt gcaggccagc
gcaggagaaa 960acgaaacctt cgtgatgaga ttgactgtag ccgagggtaa aaccgataac
caatataccc 1020tctttgtggc tggagggaca gttttattgt tgttgtttgt tatctcaatt
accaccatca 1080ttgtcatttt ccttaacaga aggagaagga gagagagaag agatctattt
acagagtcct 1140gggatacaca gaaggcaccc aataactata gaagtcccat ctctaccagt
caacctacca 1200atcaatccat ggatgataca agagaggata tttatgtcaa ctatccaacc
ttctctcgca 1260gaccaaagac tagagtttaa gcttattctt gacatgagtg cattagtaat
gactcttatg 1320tactcatgca tggatcttta tgcaattttt ttccactacc caaggtctac
cttagatact 1380agttgtctga attgagttac tttgatagga aaaatacttc attacctaaa
atcatttttc 1440atagaactgt ttcagaaaac ctgactctaa ctggtttata tacaaaagaa
aacttactgt 1500atcatataac agaatgatcc aggggagatt aagctttggg caagggctat
ttaccagggc 1560ttaaatgttg tgtctagaat taagtatggg cataaactgg cttctgaatc
cctttccaga 1620gtgttggatc catttccctg gtcttggcct cactctcatg caggctttcc
tcttgtgttg 1680gcaagatggc tgccaactct tggcaattca tacatccttg tttctgtctg
gtagagagtt 1740tgcttctcaa atggagcaaa caaatttgat tattttttca ttgttaaata
ggcaacatga 1800ccagaaagga tggaatggct taagtaaact aagggttcac ttctagagct
gagaagcagg 1860gtcaaagcac aatactgggc aattcagagc atggttagaa gaggaaaggg
gagtctcaaa 1920gctggagagt ttaccaacaa atattgactg cagtgattaa ccaagacatt
tttgttaact 1980aaaaagtgaa atatgggatg gattctagaa atggggtatc tctgtccata
cttctagaat 2040ccactctatc agcatagtcc agaagaatac ctggcagtag aagaaatgaa
tattcaagag 2100gaagataaat gcgagagggc aatcctttac tattctcata tttatttatc
tctcattctg 2160tatagaattc ttgccgccat cccaggtcta gccttaggag caaatgtagt
agatagtcga 2220ataataaata acttaatgtt ttggacatat tttgtctact tttgagaatt
atttttaata 2280tgtaaattct ctcaaaaggg tcaggcacct agttattatt ttttaatgat
tatgtgaaag 2340ttgaatataa tataccacta aaagtgacag ttgaaagtgg tggcatagga
tggtagggta 2400gaaatttggg agggaaaaaa gaaattggga gggtacaggc aacaggagaa
aggaatcaaa 2460ccacagaaaa atacaaaggg aaacttctgc ttcactattc agacaaagac
agccctaatg 2520acatcaccaa cagtcaaagc aattagagac catacctaat attgtttaaa
ttctagatgt 2580aggctaacaa tgaaaagtat ttgccaaact gaataaaact gtcatggtta
ccttgaaaaa 2640aaaaaaaaaa aaaaaaaaaa aaaa
266414336PRTHomo sapiens 14Met Asp Tyr Pro Thr Leu Leu Leu Ala
Leu Leu His Val Tyr Arg Ala 1 5 10
15 Leu Cys Glu Glu Val Leu Trp His Thr Ser Val Pro Phe Ala
Glu Asn 20 25 30
Met Ser Leu Glu Cys Val Tyr Pro Ser Met Gly Ile Leu Thr Gln Val
35 40 45 Glu Trp Phe Lys
Ile Gly Thr Gln Gln Asp Ser Ile Ala Ile Phe Ser 50
55 60 Pro Thr His Gly Met Val Ile Arg
Lys Pro Tyr Ala Glu Arg Val Tyr 65 70
75 80 Phe Leu Asn Ser Thr Met Ala Ser Asn Asn Met Thr
Leu Phe Phe Arg 85 90
95 Asn Ala Ser Glu Asp Asp Val Gly Tyr Tyr Ser Cys Ser Leu Tyr Thr
100 105 110 Tyr Pro Gln
Gly Thr Trp Gln Lys Val Ile Gln Val Val Gln Ser Asp 115
120 125 Ser Phe Glu Ala Ala Val Pro Ser
Asn Ser His Ile Val Ser Glu Pro 130 135
140 Gly Lys Asn Val Thr Leu Thr Cys Gln Pro Gln Met Thr
Trp Pro Val 145 150 155
160 Gln Ala Val Arg Trp Glu Lys Ile Gln Pro Arg Gln Ile Asp Leu Leu
165 170 175 Thr Tyr Cys Asn
Leu Val His Gly Arg Asn Phe Thr Ser Lys Phe Pro 180
185 190 Arg Gln Ile Val Ser Asn Cys Ser His
Gly Arg Trp Ser Val Ile Val 195 200
205 Ile Pro Asp Val Thr Val Ser Asp Ser Gly Leu Tyr Arg Cys
Tyr Leu 210 215 220
Gln Ala Ser Ala Gly Glu Asn Glu Thr Phe Val Met Arg Leu Thr Val 225
230 235 240 Ala Glu Gly Lys Thr
Asp Asn Gln Tyr Thr Leu Phe Val Ala Gly Gly 245
250 255 Thr Val Leu Leu Leu Leu Phe Val Ile Ser
Ile Thr Thr Ile Ile Val 260 265
270 Ile Phe Leu Asn Arg Arg Arg Arg Arg Glu Arg Arg Asp Leu Phe
Thr 275 280 285 Glu
Ser Trp Asp Thr Gln Lys Ala Pro Asn Asn Tyr Arg Ser Pro Ile 290
295 300 Ser Thr Ser Gln Pro Thr
Asn Gln Ser Met Asp Asp Thr Arg Glu Asp 305 310
315 320 Ile Tyr Val Asn Tyr Pro Thr Phe Ser Arg Arg
Pro Lys Thr Arg Val 325 330
335 1519DNAArtificialprimer 15gtccacctcg acctgctct
191619DNAArtificialprimer 16cactggggca
ggagaaact
191719DNAArtificialprimer 17tgggaaagca tcgctacac
191820DNAArtificialprimer 18gcactggagc tggaaatagc
201919DNAArtificialprimer
19gggagaatcc aagcaggac
192020DNAArtificialprimer 20ggaagctcct cgatctctga
202120DNAArtificialprimer 21tcgctgtttc tacggtagcc
202219DNAArtificialprimer
22gggtgggttt gatgtaggc
192321DNAArtificialprimer 23cagccacaat cactcatcag a
212419DNAArtificialprimer 24agggtgggtt tgctgtagg
192518DNAArtificialprimer
25ggagctcgtg gtctcagg
182621DNAArtificialprimer 26cttggagtcg gacttgtttt g
212719DNAArtificialprimer 27gcaccatggt ctcatccat
192819DNAArtificialprimer
28gtggctttgg agaggttcc
192918DNAArtificialprimer 29ggagctcgtg gtctcagg
183020DNAArtificialprimer 30gggtttgatg taggctcctg
203120DNAArtificialprimer
31ggagataccg ctgccactat
203218DNAArtificialprimer 32ggtgggtttg ctgtaggc
183323DNAArtificialprimer 33ttcgaattcc tcggtatatc
ttg 233420DNAArtificialprimer
34cacctccagt tatgcgtctg
203520DNAArtificialprimer 35atgatgaagc ctggaatgga
203621DNAArtificialprimer 36tcagagcttt acggagctca
t 213720DNAArtificialprimer
37gcctggaaga gattcgtgac
203822DNAArtificialprimer 38cttcagagct tcgtagagag ca
223920DNAArtificialprimer 39aagtgaggct ggtgttggtt
204021DNAArtificialprimer
40cgtcttgtag ctccacgtct t
214119DNAArtificialprimer 41agccacatcg ctcagacac
194219DNAArtificialprimer 42gcccaatacg accaaatcc
194318DNAArtificialprimer
43ccgcagcaga atggacag
184418DNAArtificialprimer 44gctcctgggg tgtagatg
184518DNAArtificialprimer 45accgcagaag gtgcagac
184621DNAArtificialprimer
46ctggcttgat ttcttcaggt g
214718DNAArtificialprimer 47ccgcagcaga atggacag
184819DNAArtificialprimer 48gcaggaggaa cagaaagag
194919DNAArtificialprimer
49agccacatcg ctcagacac
195019DNAArtificialprimer 50gcccaatacg accaaatcc
19
User Contributions:
Comment about this patent or add new information about this topic:
 |  |
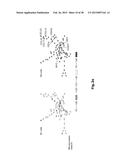 | 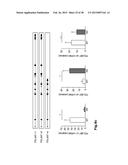 |
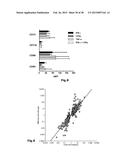 |  |
 | 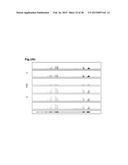 |
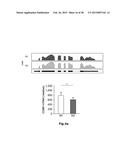 |  |
 | 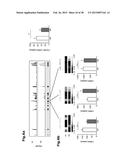 |
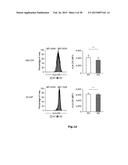 |  |
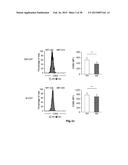 | 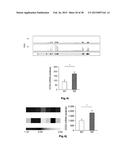 |
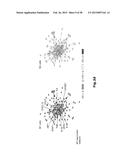 |  |
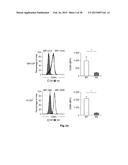 |  |
 | 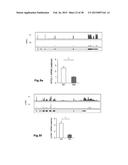 |
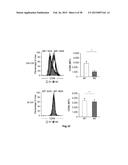 | 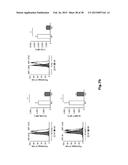 |
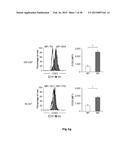 | 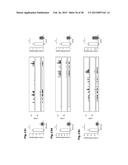 |
 |  |
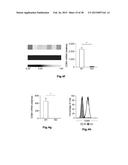 | 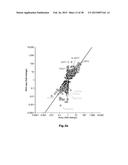 |
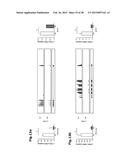 |  |
 |  |
 |  |
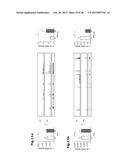 | 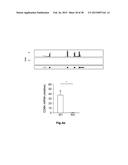 |
 | 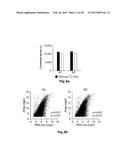 |
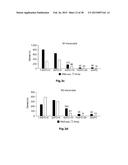 | 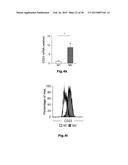 |
 | 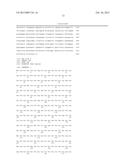 |
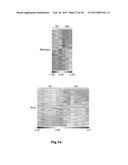 |  |
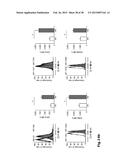 |  |
 | 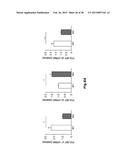 |
 |  |
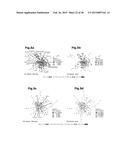 |  |
 |  |
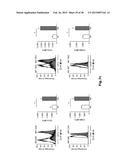 | 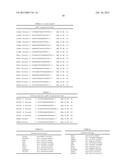 |
 | 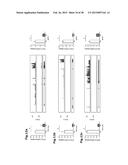 |
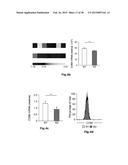 |  |
 | 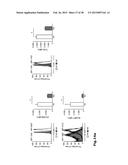 |
 | 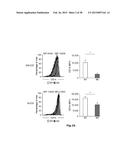 |
| Similar patent applications: | |
| Date | Title |
|---|---|
| 2015-04-02 | Modulation of line-1 reverse transcriptase |
| 2010-08-19 | Light transmitted assay beads |
| 2011-06-23 | Light transmitted assay beads |
| 2014-09-18 | Super resolution imaging |
| 2014-09-18 | Super resolution imaging |
| New patent applications in this class: | |
| Date | Title |
|---|---|
| 2019-05-16 | Methods for genome assembly and haplotype phasing |
| 2019-05-16 | Molecular tag attachment and transfer |
| 2018-01-25 | Monitoring health and disease status using clonotype profiles |
| 2018-01-25 | Sequence based genotyping based on oligonucleotide ligation assays |
| 2018-01-25 | Systems and methods for epigenetic sequencing |
| Top Inventors for class "Combinatorial chemistry technology: method, library, apparatus" | |
| Rank | Inventor's name |
|---|---|
| 1 | Mehdi Azimi |
| 2 | Kia Silverbrook |
| 3 | Geoffrey Richard Facer |
| 4 | Alireza Moini |
| 5 | William Marshall |