Patent application title: METHYLATION PROFILING OF DNA SAMPLES
Inventors:
Adam Wasserstrom (Nes-Ziona, IL)
Dan Frumkin (Tel-Aviv, IL)
Assignees:
Nucleix
IPC8 Class: AC12Q168FI
USPC Class:
435 611
Class name: Measuring or testing process involving enzymes or micro-organisms; composition or test strip therefore; processes of forming such composition or test strip involving nucleic acid nucleic acid based assay involving a hybridization step with a nucleic acid probe, involving a single nucleotide polymorphism (snp), involving pharmacogenetics, involving genotyping, involving haplotyping, or involving detection of dna methylation gene expression
Publication date: 2013-04-04
Patent application number: 20130084571
Abstract:
The present disclosure relates to methodology for fast and cost-effective
identification of the source of DNA samples. DNA samples obtained from
unknown or unrecognized tissues or cell types are analyzed according to
the methodology described herein, yielding an identification of the
tissue and/or cell type source. Identification is based on sequential
biochemical procedures including methylation sensitive/dependent
restriction and polymerase chain reaction, followed by analysis of the
data. All biochemical steps are performed in a single test tube. The
disclosure has immediate applications in forensic science for
identification of the tissue source of DNA obtained from biological
stains. The disclosure also has immediate applications in cancer
diagnosis for identification.Claims:
1. A method for identifying the source of a DNA sample, comprising: (a)
digesting the DNA sample with a methylation-sensitive and/or
methylation-dependent restriction endonuclease; (b) amplifying the
digested DNA with at least a first and a second restriction locus,
thereby generating an amplification product for each restriction locus;
(c) determining the intensity of the signal of each amplification
product; (d) calculating at least one methylation ratio between the
intensity of the signals corresponding to the two restriction loci; (e)
comparing the methylation ratio calculated in step (d) to a set of
reference methylation ratios obtained from DNA of known tissues and/or
cell types; and (f) identifying the source of the DNA sample based on
determining the likelihood of each tissue and/or cell type being the
source of the DNA, wherein the tissue/cell type with the largest
likelihood is determined to be the source of the DNA sample.
2. The method of claim 1, wherein said source is a tissue or cell type.
3. The method of claim 1, wherein DNA digestion and amplification are performed in a single biochemical reaction in a single test tube.
4. The method of claim 3, wherein said single test tube comprises DNA template, digestion and amplification enzymes, buffers, primers, and accessory ingredients.
5. The method of claim 4, wherein said single test tube is closed and placed in a thermal cycler, where the single reaction takes place.
6. The method of claim 1, wherein said methylation-sensitive restriction endonuclease is unable to cut or digest DNA if its recognition sequence is methylated.
7. The method of claim 1, wherein said methylation-sensitive restriction endonuclease is selected from the group consisting of AatII, Acc65I, AccI, AciI, AClI, AfeI, AgeI, ApaI, ApaLI, AscI, AsiSI, AvaI, AvaI, BaeI, BanI, BbeI, BceAI, BcgI, BfuCI, BglI, BmgBI, BsaAI, BsaBI, BsaHI, BsaI, BseYI, BsiEI, BsiWI, BslI, BsmAI, BsmBI, BsmFI, BspDI, BsrBI, BsrFI, BssHII, BssKI, BstAPI, BstBI, BstUI, BstZ17I, Cac8I, ClaI, DpnI, DrdI, EaeI, EagI, Eagl-HF, EciI, EcoRI, EcoRI-HF, FauI, Fnu4HI, FseI, FspI, HaeII, HgaI, HhaI, HincII, HincII, HinfI, HinP1I, HpaI, HpaII, Hpy166ii, Hpy188iii, Hpy99I, HpyCH4IV, KasI, MluI, MmeI, MspA1I, MwoI, NaeI, NarI, NgoNIV, Nhe-HFI, NheI, NlaIV, NotI, NotI-HF, NruI, Nt.BbvCI, Nt.BsmAI, Nt.CviPII, PaeR7I, PleI, PmeI, Pm1I, PshAI, PspOMI, PvuI, RsaI, RsrII, SacII, SalI, SalI-HF, Sau3AI, Sau96I, ScrFI, SfiI, SfoI, SgrAI, SmaI, SnaBI, TfiI, TscI, TseI, TspMI, and ZraI.
8. The method of claim 7, wherein said methylation-sensitive restriction endonuclease is HhaI.
9. The method of claim 1, wherein said methylation dependent restriction endonuclease digests only methylated DNA.
10. The method of claim 9, wherein said methylation dependent restriction endonuclease is McrBC, McrA, or MrrA.
11. The method of claim 1, wherein said likelihood is determined by matching the methylation ratio of step (d) with reference ratio(s) of the same loci amplified from known tissues/cell types.
12. The method of claim 1, wherein said tissue and/or cell type is blood, saliva, semen, or epidermis.
13. The method of claim 1, wherein the restriction loci are chosen such that they produce distinct methylation ratios for specific tissues and/or cell types.
14. The method of claim 1, wherein said DNA sample is mammalian DNA.
15. The method of claim 14, wherein said mammalian DNA is DNA from a mammal selected from the group consisting of human, ape, monkey, rat, mouse, rabbit, cow, pig, sheep, and horse
16. The method of claim 14, wherein said mammalian DNA is human DNA.
17. The method of claim 16, wherein the human DNA is from a male.
18. The method of claim 16, wherein the human DNA is from a female.
19. The method of claim 1, wherein said amplifying is performed using fluorescently labeled primers.
20. The method of claim 1, wherein signal intensity is determined by separating said amplification products by capillary electrophoresis and then quantifying fluorescence signals.
21. The method of claim 1, wherein amplification and determination of signal intensity are performed by real-time PCR.
22. The method of claim 1, wherein said source is a specific physiological/pathological condition.
23. The method of claim 1, wherein said source is a specific age, or range of ages.
24. The method of claim 1, wherein said source is male.
25. The method of claim 1, wherein said source is female.
26. A method for distinguishing between DNA samples obtained from blood, saliva, semen, and skin epidermis, comprising: (a) digesting the DNA sample with HhaI; (b) amplifying the digested DNA with forward and reverse primers for six loci set forth in SEQ ID NOs: 26-31, thereby generating an amplification product for each restriction locus; (c) determining the intensity of the signal of each amplification product; (d) calculating methylation ratios for all loci pair combinations; (e) comparing the methylation ratios calculated in step (d) to a set of reference methylation ratios obtained from DNA from blood, saliva, semen, and skin epidermis; and (f) calculating the likelihood of each of blood, saliva, semen, and skin epidermis being the source of the DNA, wherein the tissue/cell type with the largest likelihood is determined to be the source of the DNA sample.
27. The method of claim 26, wherein the reference methylation ratio for locus pair SEQ ID NO: 29/SEQ ID NO: 30 in blood is about 0.29.
28. The method of claim 26, wherein the reference methylation ratio for locus pair SEQ ID NO: 29/SEQ ID NO: 30 in semen is about 2.8.
29. The method of claim 26, wherein the reference methylation ratio for locus pair SEQ ID NO: 29/SEQ ID NO: 30 in epidermis is about 0.78.
30. A kit for determining the source of a DNA sample, wherein said kit comprises (a) a single test tube for DNA digestion and amplification using primers for specific genomic loci; and (b) instructions for calculating at least one methylation ratio and comparing it to reference methylation ratios.
31. The kit of claim 30, wherein the primers comprise forward and reverse primers for the genetic loci set forth in SEQ ID NOs: 26-31.
32. A method for determining whether a DNA sample is from blood, comprising (a) digesting the DNA sample with a methylation-sensitive and/or methylation-dependent restriction endonuclease; (b) amplifying the digested DNA with at least a first and a second restriction locus, thereby generating an amplification product for each restriction locus; (c) determining the intensity of the signal of each amplification product; (d) calculating at least one methylation ratio between the intensity of the signals corresponding to the two restriction loci; (e) comparing the methylation ratio calculated in step (d) to a set of reference methylation ratios obtained from DNA of known tissues and/or cell types; and determining whether the DNA sample derives from blood based on likelihood score of blood compared with other tissue and/or cell type likelihood scores.
33. A method for determining whether a DNA sample derives from semen, comprising (a) digesting the DNA sample with a methylation-sensitive and/or methylation-dependent restriction endonuclease; (b) amplifying the digested DNA with at least a first and a second restriction locus, thereby generating an amplification product for each restriction locus; (c) determining the intensity of the signal of each amplification product; (d) calculating at least one methylation ratio between the intensity of the signals corresponding to the two restriction loci; (e) comparing the methylation ratio calculated in step (d) to a set of reference methylation ratios obtained from DNA of known tissues and/or cell types; and (f) determining whether the DNA sample derives from semen based on likelihood score of semen compared with other tissue and/or cell type likelihood scores.
34. A method for determining whether a DNA sample derives from skin epidermis, comprising (a) digesting the DNA sample with a methylation-sensitive and/or methylation-dependent restriction endonuclease; (b) amplifying the digested DNA with at least a first and a second restriction locus, thereby generating an amplification product for each restriction locus; (c) determining the intensity of the signal of each amplification product; (d) calculating at least one methylation ratio between the intensity of the signals corresponding to the two restriction loci; (e) comparing the methylation ratio calculated in step (d) to a set of reference methylation ratios obtained from DNA of known tissues and/or cell types; and (f) determining whether the DNA sample derives from skin epidermis based on likelihood score of skin epidermis compared with other tissue and/or cell type likelihood scores.
35. A method for determining whether a DNA sample derives from saliva, comprising (a) digesting the DNA sample with a methylation-sensitive and/or methylation-dependent restriction endonuclease; (b) amplifying the digested DNA with at least a first and a second restriction locus, thereby generating an amplification product for each restriction locus; (c) determining the intensity of the signal of each amplification product; (d) calculating at least one methylation ratio between the intensity of the signals corresponding to the two restriction loci; (e) comparing the methylation ratio calculated in step (d) to a set of reference methylation ratios obtained from DNA of known tissues and/or cell types; and (f) determining whether the DNA sample derives from saliva based on likelihood score of saliva compared with other tissue and/or cell type likelihood scores.
36. A method for determining whether a DNA sample derives from urine, comprising (a) digesting the DNA sample with a methylation-sensitive and/or methylation-dependent restriction endonuclease; (b) amplifying the digested DNA with at least a first and a second restriction locus, thereby generating an amplification product for each restriction locus; (c) determining the intensity of the signal of each amplification product; (d) calculating at least one methylation ratio between the intensity of the signals corresponding to the two restriction loci; (e) comparing the methylation ratio calculated in step (d) to a set of reference methylation ratios obtained from DNA of known tissues and/or cell types; and determining whether the DNA sample derives from urine based on likelihood score of saliva compared with other tissue and/or cell type likelihood scores.
37. A method for determining whether a DNA sample derives from menstrual blood, comprising (a) digesting the DNA sample with a methylation-sensitive and/or methylation-dependent restriction endonuclease; (b) amplifying the digested DNA with at least a first and a second restriction locus, thereby generating an amplification product for each restriction locus; (c) determining the intensity of the signal of each amplification product; (d) calculating at least one methylation ratio between the intensity of the signals corresponding to the two restriction loci; (e) comparing the methylation ratio calculated in step (d) to a set of reference methylation ratios obtained from DNA of known tissues and/or cell types; and (f) determining whether the DNA sample derives from menstrual blood based on likelihood score of saliva compared with other tissue and/or cell type likelihood scores.
38. A method for determining whether a DNA sample derives from vaginal tissue, comprising (a) digesting the DNA sample with a methylation-sensitive and/or methylation-dependent restriction endonuclease; (b) amplifying the digested DNA with at least a first and a second restriction locus, thereby generating an amplification product for each restriction locus; (c) determining the intensity of the signal of each amplification product; (d) calculating at least one methylation ratio between the intensity of the signals corresponding to the two restriction loci; (e) comparing the methylation ratio calculated in step (d) to a set of reference methylation ratios obtained from DNA of known tissues and/or cell types; and (f) determining whether the DNA sample derives from vaginal tissue based on likelihood score of saliva compared with other tissue and/or cell type likelihood scores.
39. A method for identifying the composition of multiple sources of a DNA sample, comprising: (a) digesting the DNA sample with a methylation-sensitive and/or methylation-dependent restriction endonuclease; (b) amplifying the digested DNA with at least a first and a second restriction locus, thereby generating an amplification product for each restriction locus; (c) determining the intensity of the signal of each amplification product; (d) calculating at least one methylation ratio between the intensity of the signals corresponding to the two restriction loci; (e) comparing the methylation ratio calculated in step (d) to a set of reference methylation ratios obtained from DNA of known tissues and/or cell types; (f) determining the likelihood of each tissue and/or cell type contributing to the source of DNA; and (g) determining the composition of the source DNA based on the likelihoods obtained in step (f).
40. The method of claim 39, wherein said DNA sample comprises a mixture of DNA from more than one of blood, semen, saliva, skin epidermis, urine, menstrual blood, vaginal tissue.
41. A method for creating a methylation profile of a cell sample, comprising (a) isolating DNA from a cell sample and digesting it with a methylation-sensitive and/or methylation-dependent restriction endonuclease; (b) amplifying the digested DNA with at least a first and a second restriction locus, thereby generating an amplification product for each restriction locus; (c) determining the intensity of the signal of each amplification product; (d) calculating at least one methylation ratio between the intensity of the signals corresponding to the two restriction loci; wherein the calculated methylation ratio(s) comprise the methylation profile of the cell sample.
42. The method of claim 40, comprising comparing the methylation profile of the cell sample with the known methylation profile of at least one cellular reference and determining whether the similarities or differences in the profiles indicates the identity or contamination status of the cell sample.
Description:
FIELD OF THE DISCLOSURE
[0001] The present disclosure embraces methodology for fast and cost-effective methylation profiling of DNA samples. Methylation profiles from DNA samples are obtained according to the methodology described herein, yielding information on the DNA sample, such as identity, physiological, and pathological characteristics.
INTRODUCTION
[0002] Cell cultures and cell lines are important tools for conducting research in cell, tissue and organ development, studying disease, and identifying therapeutic agents. The ATCC, for instance, holds over 3,400 cell lines from over 80 species, including 950 cancer cell lines, 1,000 hybridomas, and several special collections of cells, like stem cell lines. The DSMZ-German Collection of Microorganisms and Cell Cultures also holds numerous human and animal cell lines, especially those to do with leukemia and lymphoma.
[0003] The presently described profiling methods, such as those which utilize methylation profiling, are useful for creating cell-type and cell line-specific authenticity profiles that tell a user, among other things, the functional quality and origin of cells and cell lines, and whether cells and cell lines are cross-contaminated, contaminated by microorganisms, or misidentified.
SUMMARY
[0004] In one aspect, there is provided a method for methylation profiling of a DNA sample obtained from a cell or cell line, comprising: (a) digesting the DNA sample with a methylation-sensitive and/or methylation-dependent restriction endonuclease; (b) amplifying the digested DNA with at least a first and a second restriction locus, thereby generating an amplification product for each restriction locus; (c) determining the intensity of the signal of each amplification product; (d) calculating at least one methylation ratio between the intensity of the signals corresponding to the two restriction loci; wherein the calculated methylation ratio(s) comprise the methylation profile of the DNA sample.
[0005] In another aspect, there is provided a method for identifying the source of a DNA sample, comprising: (a) digesting the DNA sample with a methylation-sensitive and/or methylation-dependent restriction endonuclease; (b) amplifying the digested DNA with at least a first and a second restriction locus, thereby generating an amplification product for each restriction locus; (c) determining the intensity of the signal of each amplification product; (d) calculating at least one methylation ratio between the intensity of the signals corresponding to the two restriction loci; (e) comparing the methylation ratio calculated in step (d) to a set of reference methylation ratios obtained from DNA of known tissues and/or cell types; and (f) identifying the source of the DNA sample based on determining the likelihood of each tissue and/or cell type being the source of the DNA, wherein the tissue/cell type with the largest likelihood is determined to be the source of the DNA sample.
[0006] In one embodiment, the source is a tissue or cell type. In another embodiment, the source is a specific physiological/pathological condition. In another embodiment, the source is a specific age, or range of ages. In another embodiment, the source is male. In another embodiment, the source is female.
[0007] In another embodiment, the DNA digestion and amplification are performed in a single biochemical reaction in a single test tube. In a further embodiment, the single test tube comprises DNA template, digestion and amplification enzymes, buffers, primers, and accessory ingredients. In another further embodiment, the single test tube is closed and placed in a thermal cycler, where the single reaction takes place.
[0008] In another embodiment, the methylation-sensitive restriction endonuclease is unable to cut or digest DNA if its recognition sequence is methylated. In another embodiment, the methylation-sensitive restriction endonuclease is selected from the group consisting of AatII, Acc65I, AccI, AciI, AC1I, AfeI, AgeI, ApaI, ApaLI, AscI, AsiSI, AvaI, AvaII, BaeI, BanI, BbeI, BceAI, BcgI, BfuCI, BglI, BmgBI, BsaAI, BsaBI, BsaHI, BsaI, BseYI, BsiEI, BsiWI, BslI, BsmAI, BsmBI, BsmFI, BspDI, BsrBI, BsrFI, BssHII, BssKI, BstAPI, BstBI, BstUI, BstZ17I, Cac8I, ClaI, DpnI, DrdI, EaeI, EagI, Eagl-HF, EciI, EcoRI, EcoRI-HF, FauI, Fnu4HI, FseI, FspI, HaeII, HgaI, HhaI, HincII, HincII, HinfI, HinP1I, HpaI, HpaII, Hpy166ii, Hpy188iii, Hpy99I, HpyCH4IV, KasI, MluI, MmeI, MspA1I, MwoI, NaeI, NarI, NgoNIV, Nhe-HFI, NheI, NlaIV, NotI, NotI-HF, NruI, Nt.BbvCI, Nt.BsmAI, Nt.CviPII, PaeR7I, PleI, PmeI, Pm1I, PshAI, PspOMI, PvuI, RsaI, RsrII, SacII, SalI, SalI-HF, Sau3AI, Sau96I, ScrFI, SfiI, SfoI, SgrAI, SmaI, SnaBI, TfiI, TscI, TseI, TspMI, and ZraI. In a further embodiment, the methylation-sensitive restriction endonuclease is HhaI.
[0009] In another embodiment, the methylation dependent restriction endonuclease digests only methylated DNA. In a further embodiment, the methylation dependent restriction endonuclease is McrBC, McrA, or MrrA.
[0010] In another embodiment, the likelihood is determined by matching the methylation ratio of step (d) with reference ratio(s) of the same loci amplified from known tissues/cell types.
[0011] In another embodiment, the tissue and/or cell type is blood, saliva, semen, or epidermis.
[0012] In another embodiment, the restriction loci are chosen such that they produce distinct methylation ratios for specific tissues and/or cell types.
[0013] In another embodiment, the DNA sample is mammalian DNA. In a further embodiment, the mammalian DNA is DNA from a mammal selected from human, ape, monkey, rat, mouse, rabbit, cow, pig, sheep, and horse. In another further embodiment, the mammalian DNA is human DNA. In a yet further embodiment, the human DNA is from a male. In another yet further embodiment, the human DNA is from a female.
[0014] In another embodiment, the amplifying is performed using fluorescently labeled primers. In another embodiment, the signal intensity is determined by separating said amplification products by capillary electrophoresis and then quantifying fluorescence signals. In another embodiment, the amplification and determination of signal intensity are performed by real-time PCR.
[0015] There is provided a method for distinguishing between DNA samples obtained from blood, saliva, semen, and skin epidermis, comprising: (a) digesting the DNA sample with HhaI; (b) amplifying the digested DNA with forward and reverse primers for six loci set forth in SEQ ID NOs: 26-31, thereby generating an amplification product for each restriction locus; (c) determining the intensity of the signal of each amplification product; (d) calculating methylation ratios for all loci pair combinations; (e) comparing the methylation ratios calculated in step (d) to a set of reference methylation ratios obtained from DNA from blood, saliva, semen, and skin epidermis; and (f) calculating the likelihood of each of blood, saliva, semen, and skin epidermis being the source of the DNA, wherein the tissue/cell type with the largest likelihood is determined to be the source of the DNA sample.
[0016] In one embodiment, the reference methylation ratio for locus pair SEQ ID NO: 29/SEQ ID NO: 30 in blood is about 0.29. In another embodiment, the reference methylation ratio for locus pair SEQ ID NO: 29/SEQ ID NO: 30 in semen is about 2.8. In another embodiment, the reference methylation ratio for locus pair SEQ ID NO: 29/SEQ ID NO: 30 in epidermis is about 0.78.
[0017] In another aspect, there is provided a kit for determining the source of a DNA sample, wherein said kit comprises (a) a single test tube for DNA digestion and amplification using primers for specific genomic loci; and (b) instructions for calculating at least one methylation ratio and comparing it to reference methylation ratios. In one embodiment, the primers comprise forward and reverse primers for the genetic loci set forth in SEQ ID NOs: 26-31.
[0018] In another aspect, there is provided a method for determining whether a DNA sample is from blood, comprising (a) digesting the DNA sample with a methylation-sensitive and/or methylation-dependent restriction endonuclease; (b) amplifying the digested DNA with at least a first and a second restriction locus, thereby generating an amplification product for each restriction locus; (c) determining the intensity of the signal of each amplification product; (d) calculating at least one methylation ratio between the intensity of the signals corresponding to the two restriction loci; (e) comparing the methylation ratio calculated in step (d) to a set of reference methylation ratios obtained from DNA of known tissues and/or cell types; and (f) determining whether the DNA sample derives from blood based on likelihood score of blood compared with other tissue and/or cell type likelihood scores.
[0019] In another aspect, there is provided a method for determining whether a DNA sample derives from semen, comprising (a) digesting the DNA sample with a methylation-sensitive and/or methylation-dependent restriction endonuclease; (b) amplifying the digested DNA with at least a first and a second restriction locus, thereby generating an amplification product for each restriction locus; (c) determining the intensity of the signal of each amplification product; (d) calculating at least one methylation ratio between the intensity of the signals corresponding to the two restriction loci; (e) comparing the methylation ratio calculated in step (d) to a set of reference methylation ratios obtained from DNA of known tissues and/or cell types; and (f) determining whether the DNA sample derives from semen based on likelihood score of semen compared with other tissue and/or cell type likelihood scores.
[0020] In another aspect, there is provided a method for determining whether a DNA sample derives from skin epidermis, comprising (a) digesting the DNA sample with a methylation-sensitive and/or methylation-dependent restriction endonuclease; (b) amplifying the digested DNA with at least a first and a second restriction locus, thereby generating an amplification product for each restriction locus; (c) determining the intensity of the signal of each amplification product; (d) calculating at least one methylation ratio between the intensity of the signals corresponding to the two restriction loci; (e) comparing the methylation ratio calculated in step (d) to a set of reference methylation ratios obtained from DNA of known tissues and/or cell types; and (f) determining whether the DNA sample derives from skin epidermis based on likelihood score of skin epidermis compared with other tissue and/or cell type likelihood scores.
[0021] In another aspect, there is provided a A method for determining whether a DNA sample derives from saliva, comprising (a) digesting the DNA sample with a methylation-sensitive and/or methylation-dependent restriction endonuclease; (b) amplifying the digested DNA with at least a first and a second restriction locus, thereby generating an amplification product for each restriction locus; (c) determining the intensity of the signal of each amplification product; (d) calculating at least one methylation ratio between the intensity of the signals corresponding to the two restriction loci; (e) comparing the methylation ratio calculated in step (d) to a set of reference methylation ratios obtained from DNA of known tissues and/or cell types; and (f) determining whether the DNA sample derives from saliva based on likelihood score of saliva compared with other tissue and/or cell type likelihood scores.
[0022] In another aspect, there is provided a method for determining whether a DNA sample derives from urine, comprising (a) digesting the DNA sample with a methylation-sensitive and/or methylation-dependent restriction endonuclease; (b) amplifying the digested DNA with at least a first and a second restriction locus, thereby generating an amplification product for each restriction locus; (c) determining the intensity of the signal of each amplification product; (d) calculating at least one methylation ratio between the intensity of the signals corresponding to the two restriction loci; (e) comparing the methylation ratio calculated in step (d) to a set of reference methylation ratios obtained from DNA of known tissues and/or cell types; and (f) determining whether the DNA sample derives from urine based on likelihood score of saliva compared with other tissue and/or cell type likelihood scores.
[0023] In another aspect, there is provided a method for determining whether a DNA sample derives from menstrual blood, comprising (a) digesting the DNA sample with a methylation-sensitive and/or methylation-dependent restriction endonuclease; (b) amplifying the digested DNA with at least a first and a second restriction locus, thereby generating an amplification product for each restriction locus; (c) determining the intensity of the signal of each amplification product; (d) calculating at least one methylation ratio between the intensity of the signals corresponding to the two restriction loci; (e) comparing the methylation ratio calculated in step (d) to a set of reference methylation ratios obtained from DNA of known tissues and/or cell types; and (f) determining whether the DNA sample derives from menstrual blood based on likelihood score of saliva compared with other tissue and/or cell type likelihood scores.
[0024] In another aspect, there is provided a method for determining whether a DNA sample derives from vaginal tissue, comprising (a) digesting the DNA sample with a methylation-sensitive and/or methylation-dependent restriction endonuclease; (b) amplifying the digested DNA with at least a first and a second restriction locus, thereby generating an amplification product for each restriction locus; (c) determining the intensity of the signal of each amplification product; (d) calculating at least one methylation ratio between the intensity of the signals corresponding to the two restriction loci; (e) comparing the methylation ratio calculated in step (d) to a set of reference methylation ratios obtained from DNA of known tissues and/or cell types; and (f) determining whether the DNA sample derives from vaginal tissue based on likelihood score of saliva compared with other tissue and/or cell type likelihood scores.
[0025] In another aspect, there is provided a method for identifying the composition of multiple sources of a DNA sample, comprising (a) digesting the DNA sample with a methylation-sensitive and/or methylation-dependent restriction endonuclease; (b) amplifying the digested DNA with at least a first and a second restriction locus, thereby generating an amplification product for each restriction locus; (c) determining the intensity of the signal of each amplification product; (d) calculating at least one methylation ratio between the intensity of the signals corresponding to the two restriction loci; (e) comparing the methylation ratio calculated in step (d) to a set of reference methylation ratios obtained from DNA of known tissues and/or cell types; (f) determining the likelihood of each tissue and/or cell type contributing to the source of DNA; and (g) determining the composition of the source DNA based on the likelihoods obtained in step (f). In one embodiment, the DNA sample comprises a mixture of DNA from more than one of blood, semen, saliva, skin epidermis, urine, menstrual blood, vaginal tissue.
BRIEF DESCRIPTION OF THE DRAWINGS
[0026] FIG. 1: schematic overview for determining a single methylation ratio. The source of the DNA to be digested as indicated can be isolated from a cell or cell line whose identity, functionality, authenticity, origin, or contamination status, for instance, is being evaluated.
[0027] FIG. 2: schematic details for determining a single methylation ratio. The source of the DNA to be digested as indicated can be isolated from a cell or cell line whose identity, authenticity, origin, or contamination status, for instance, is being evaluated.
[0028] FIG. 3: Methylation ratios in semen and blood DNA samples in a specific pair of loci. In semen, the methylation ratio is about 2.5, while in blood the methylation ratio is about 0.25. Numbers next to each peak are the relative fluorescence units (rfu) level of that peak. Notice that the methylation ratio is independent of the absolute rfu levels.
[0029] FIG. 4: Normalization of methylation ratios. The top and bottom panels represent two channels of a single electropherogram. Signals in the lower channel were used for obtaining a linear fit (grey line). For the two loci in the top panel, a non-normalized methylation ratio (MR) was calculated by dividing the respective rfus. A normalized methylation ratio was also calculated for the loci in the top panel by multiplying the non-normalized methylation ratio by the reciprocal of a corresponding ratio obtained from the loci's projections on the linear fit.
[0030] FIG. 5: Combined tissue identification and DNA profiling of a DNA sample from skin epidermis. Peaks corresponding to loci used for tissue identification are found in the range of <110 bps (top and middle panels), while other peaks correspond to loci used for DNA profiling.
[0031] FIG. 6: Electropherograms of capillary electrophoresis of nine DNA samples extracted from semen, blood, and epidermis from three individuals. Differential methylation in semen, blood, and epidermis is evidenced by the different intensities of the analyzed loci.
[0032] FIG. 7: Electropherograms of capillary electrophoresis of eleven DNA samples extracted from blood, saliva, skin, semen, menstrual blood, vaginal tissue, and urine. Differential methylation in blood, saliva, skin, semen, menstrual blood, vaginal tissue, and urine is evidenced by the different intensities of the analyzed loci.
DETAILED DESCRIPTION
[0033] The present disclosure relates to methylation profiling methods useful for creating cell-type and cell line-specific "functionality" profiles that tell a user, among other things, whether the functional aspects of the cell are the same or different than another cell of the same type. This particular use of the inventive methylation profiling technique is helpful because it provides information about a particular cell sample that cannot otherwise be obtained or inferred from existing and conventional cell profiling techniques.
[0034] This methylation profiling technique makes use of another inventive aspect of the technology which is the identification of loci throughout genomic regions that are methylated, unmethylated, and partially methylated. This collection of loci, whose individual methylated locus status is now known, is useful for investigating and profiling the methylation status of any cell sample. By creating corresponding methylation profiles of a cell sample, as described herein, one can determine whether cells from the sample are functioning the same way as normal, healthy cells, i.e., they exhibit a normal methylation profile, or they exhibit a different, perhaps abnormal methylation profile, compared to a known sample of the same kind of cell or cell type. Likewise, one can determine whether cells from the sample are functioning the same way as normal, healthy cells from a particular organ or tissue, i.e., they exhibit an organ- or tissue-specific methylation profile. Thus, the inventive methylation profiling techniques lend themselves to the determination of the pathogenic or physiological status of a particular cell sample.
[0035] Specifically, the inventive methylation ratios described herein are calculated from comparative analysis of the methylation status of any number of genomic loci and are useful for creating cellular methylation profiles for determining cellular origin, functional identity, age-identification, physiological profiling, and pathological status of a cell sample. Furthermore, in each instance, the methylation profiling technique can also be used to ascertain whether the obtained methylation profile reflects the presence of contaminating cells, either from, for instance, another cell line, or microbial growth, and whether a particular cell sample has been misidentified.
[0036] A methylation profiling of a cell or cell line can be readily obtained by the present invention, for example, by (a) isolating DNA from a cell sample and digesting it with a methylation-sensitive and/or methylation-dependent restriction endonuclease; (b) amplifying the digested cellular DNA with at least a first and a second restriction locus, thereby generating an amplification product for each restriction locus; (c) determining the intensity of the signal of each amplification product; and then (d) calculating at least one methylation ratio between the intensity of the signals corresponding to the two restriction loci. The calculated methylation ratio(s) is an example of the methylation profile of the DNA sample obtained from that cell sample.
[0037] By comparing the profile to a known cell of the same origin and species, or from an uncontaminated corresponding cell line, it is possible to determine the identity of the cell sample and whether or not it is, for instance, functionally similar or identical to the known cell based on its methylation profile. Accordingly, one may either commercially purchase, or create, or modify a human liver cell line and then use the present cellular methylation profiling techniques described herein to determine the functional characteristics of the cell line, in comparison to a known liver cell reference profile.
[0038] In this respect, the inventive cellular methylation profiling methods have several advantages over existing cell identification techniques, as described below. Methylation in the human genome occurs in the form of 5-methyl cytosine and is confined to cytosine residues that are part of the sequence CG (cytosine residues that are part of other sequences are not methylated). Some CG dinucleotides in the human genome are methylated, and others are not. Methylation is cell and tissue specific, such that a specific CG dinucleotide can be methylated in a certain cell and, at the same time, unmethylated in a different cell, or methylated in a certain tissue and, at the same time, unmethylated in different tissues. Since methylation at a specific locus can vary from cell to cell, when analyzing the methylation status of DNA extracted from a plurality of cells, e.g. from a forensic sample, the signal can be mixed, showing both the methylated and unmethylated signals in varying ratios. Various data sources are available for retrieving or storing DNA methylation data and making these data readily available to the public, for example "DNA Methylation Database" (MetDB) (www.methdb.net).
[0039] The inventive cellular methylation profiling methods are advantagous over existing cell profiling techniques because they minimize and effectively eliminate problems inherent with conventional profiling regimes. First, as mentioned above, the methylation profiling technique does not rely on determining levels of methylated loci but rather utilizes the inventive concept of creating methylation ratios between two genomic loci. Accordingly, unlike the prior art methods, the cellular methylation profile described herein is not limited by sample size or subject to differences in amounts or quantities of samples analyzed.
[0040] Thus, secondly, the methylation profile can be compared to the methylation profiles of reference cells to help verify the originating identity of the cell or cell line. For example, if two cell lines are obtained from the same individual, conventional DNA profiling cannot distinguish between them. But the cellular methylation profiling technique of the present invention can differentiate between the two cell types if they are obtained from different tissues or at different time points from that individual.
[0041] Thirdly, the inventive cellular methylation profiling techniques can be used to establish the functional identity of a cell line. Thus, it can be used, for example, to determine whether a certain candidate cell line is appropriate for use as a model cell line for liver because the techniques make it possible to determine whether the cellular methylation profile of the candidate cell line is consistent with the cellular methylation profile of liver.
[0042] Fourth, the cellular methylation profile is useful for determining the age of a DNA sample, because the cellular methylation profile changes with age.
[0043] Fifth, the cellular methylation profile is useful for determining the physiological state of the cell or cell line. For example, the methylation profile can indicate at what stage of the menstrual cycle cells and DNA samples were obtained from an individual.
[0044] Sixth, and as described herein, the cellular methylation profile can be used in pathological analyses, for instance to identify cellular and tissue changes that occur when a tissue is subjected to various stress factors such as inflammation, and also when inflicted by diseases such as cancer.
[0045] Thus, the uses to which the inventive methylation ratios calculated from comparisons of the methylation status of any number of genomic loci can be put are numerous, as exemplified above, such as, but not limited to, the use of a cellular methylation profile to determine cellular origin, functional identity, age-identification, physiological profiling, and pathological status. The methylation profiling technique can also be used to ascertain whether the obtained methylation profile reflects the presence of contaminating cells, either from, for instance, another cell line, or because of undesirable microbial growth.
[0046] An added advantage of the present methylation profiling methods is that, in contrast to conventional methylation analysis methods, which determine the actual methylation levels at specific genomic loci, the methodology described herein does not rely on such determination of levels which are often highly variable between different individuals. Instead, the inventive assays make it possible to use methylation ratios as indicators of the functional attributes of a cell type or cell line, and to also help identify the source, quality, and contamination status of the cell sample, even though the cells' actual methylation levels between genomic loci are variable.
[0047] An underlying aspect of the present cellular methylation profiling assay therefore is the comparison of signals from at least two loci amplified from a digested sample of DNA obtained from a cell, which ultimately yields a numerical ratio. This ratio can then be compared to reference ratio values of a pure and uncontaminated cell of the same type and species as the tested cell.
[0048] Thus, the present technology contemplates, in one embodiment, (1) obtaining DNA from one or more cells from a cell culture or cell line, (2) digesting the cellular DNA with a methylation-sensitive and/or methylation-dependent enzyme, (3) PCR amplifying the digested DNA with locus-specific primers, and (4) measuring the intensity of the signals from locus-specific amplification products; and determination of a methylation ratio. If the numerical ratio between the two amplification products matches or approximates that of a reference ratio of the same loci amplified from a known reference cell, then a conclusion can be drawn about the functional authenticity of the cell sample or, for instance, whether the sample of cells or the cell line is contaminated by some other cellular source that alters the methylation profile of the sample.
[0049] The technique may further comprise comparing the methylation profile of a cell sample with the known methylation profile of at least one cellular reference and determining whether the similarities or differences in the profiles indicates the functional, physiological, or pathological identity of the cell sample. By cellular reference is meant either the methylation profile of a known and equivalent cell type, e.g., liver, brain, lung, ovary, against which the cell sample's methylation profile can be directly compared; or a cellular reference may comprise a library of known methylation profiles from a range of different species, organs, or pathological disease states, such as cancer, and subsequently identifying to which methylation profile the cell sample most closely resembles. Thus, if a cell line is obtained and purported to be a human liver cell line, for instance, then the present technique makes it possible to compare the methylation profile of that human liver cell line against a known human liver cell line to confirm or verify the identity, or functional identity, of the obtained human liver cell line. Alternatively, one or more methylation profiles of a cell sample of unknown source can be obtained and compared against a library of known methylation profiles from different species, organs, or pathological disease states to determine its origin.
[0050] As used herein, any type of cell, such as, but not limited to, a cell from a mammal, fish, reptile, bird, bacteria, microorganism, amphibian, insect, fungi, virus, plant, of crop, can be analyzed according to the present inventive technology. The present cellular profiling techniques are therefore useful for authenticating the functional identity of, for instance, human cells, rat cells, mouse cells, monkey cells, primate cells, zebrafish cells, dog cells, cat cells, cattle cells, rabbit cells, hamster cells. The cellular profiling techniques also are useful for confirming or verifying the authenticity organ specific cell types, such as, but not limited to, the functional authenticity of liver cells, kidney cells, pancreatic cells, lung cells, cardiac cells, ovary cells, bone marrow, brain cells, breast cells, tongue cells, retinal cells, colon cells, cervical cells, embryo cells, and skin cells. The cellular profiling techniques also are useful for confirming the disease or cancer identity of particular cells, such as, but not limited to, melanoma cells, glioblastoma cells, leukemia cells, B lymphoma cells, head and neck carcinoma cells, neuroblastoma cells, adenocarcinoma cells, metastatic lymph node cells, hepatoma cells, T-cell leukemia cells, lymphoblastoid cells, breast cancer cells, cervical cancer cells, and other types of cancer cells and cell lines.
[0051] In this regard, the use of the words cell, cell culture, and cell line are interchangeable with respect to the descriptions of various profiling methods described herein. Cells that are cultured directly from an individual are primary cells, which typically stop dividing after passage of a certain number of population doublings. An established or immortalized cell line is one that can proliferate indefinitely. The inventive cellular methylation profiling techniques can be used to confirm the functional identity, physiological or pathogenic status, authenticity, tissue origin, and contamination status of any of such isolated cells and cell lines. Accordingly, it should be understood that reference in this disclosure to a cell or to a cell line is not limiting and is not meant to exclude the use of the described technique on other cells or cell lines.
[0052] Examples of common cell lines include but are not limited to human DU145 (Prostate cancer), human Lncap (Prostate cancer), human MCF-7 (breast cancer), human MDA-MB-438 (breast cancer), human PC3 (Prostate cancer), human T47D (breast cancer), human THP-1 (acute myeloid leukemia), human U87 (glioblastoma), human SHSY5Y Human neuroblastoma cells, human Saos-2 cells (bone cancer); primate Vero (African green monkey Chlorocebus kidney epithelial cell line initiated 1962); rat tumor cell lines, such as GH3 (pituitary tumor) and PC12 (pheochromocytoma); mouse cell lines, such as MC3T3 (embryonic calvarial); plant cell lines, such as Tobacco BY-2 cells; and other cells, such as zebrafish ZF4 and AB9 cells, Madin-Darby Canine Kidney (MDCK) epithelial cell line, and Xenopus A6 kidney epithelial cells. Examples of the types of tumor cell lines that can be profiled according to the present methylation profiling techniques can be found, for instance, at the ATCC's website at atcc.org/Portals/1/TumorLines.pdf, the DSMZ website at dsmz.de/human_and_animal_cell_lines/cell_line_index.php, and at the EMBL-ESTDAB database at ebi.ac.uk/ipd/estdab/directory.html.
[0053] Another problem with these, and other, cell lines is that they can become contaminated, such as by the growth of unrelated cells, cross-contaminated by other cell lines, or contaminated by microbes. See Drexler et al., Leukemia, 13, pp. 1601-1607 (1999), Drexler et al., Blood, 98(12), pp. 3495-3496 (2001), and Cabrera et al., Cytotechnology, 51(2), pp. 45-50 (2006). Furthermore, another problem is that sometimes cell lines can be falsely or incorrectly identified, which can lead to issues in interpreting results from experiments and data. The present methylation profiling methods can be used, as described herein, also to ascertain the contamination status of a cell sample.
[0054] The assays described herein are therefore powerful, multiplex, accurate, and inexpensive techniques applicable in any setting that calls for the identification and functional characterization of cells and cell lines, as well the verification of a source of a cellular or DNA sample. Thus, the assays can be used for a large number of purposes, including but not limited to the police in a forensics capacity; the health care industry for diagnostic and therapeutic purposes; in the insurance industry to verify claims pursuant to anti-discrimination genetic laws, such as the Genetic Information Nondiscrimination Act (H.R. 493); by prosecutors and defense counsel for evidentiary purposes in criminal trials and civil proceedings and appeals; and the food and agriculture industry to verify the integrity of meats, crops, and plants such as grapevines and sources of coffee. The present technology is not limited to these non-exclusive, but representative, applications.
[0055] A significant aspect of the present disclosure is that it can readily complement and expand the usefulness of existing commercial DNA profiling kits to do more than profile a particular subject's DNA. The combination of the assays disclosed herein, such as the methylation ratio assay described in detail below, with Promega Corporation's PowerPlex® 16 kit, for example, enables one to not only profile an individual's DNA composition but also to determine the source of that individual's DNA. For example, and in no way limiting, the present technology enables one to determine if a DNA sample derives from a particular tissue and/or cell type, such as blood, saliva, or semen.
[0056] Specific compositions, methods, and/or embodiments discussed herein are merely illustrative of the present technology. Variations on these compositions, methods, or embodiments are readily apparent to a person of ordinary skill in the art, based upon the teachings of this specification, and are therefore included as part of the disclosure.
[0057] The present technology uses many conventional techniques in molecular biology and recombinant DNA. These techniques are explained in, e.g., Current Protocols in Molecular Biology, Vols. I-III, Ausubel, Ed. (1997); Sambrook et al., Molecular Cloning: A Laboratory Manual, Second Ed. (Cold Spring Harbor Laboratory Press, Cold Spring Harbor, N.Y., 1989); DNA Cloning: A Practical Approach, Vols. I and II, Glover, Ed. (1985); Oligonucleotide Synthesis, Gait, Ed. (1984); Nucleic Acid Hybridization, Hames & Higgins, Eds. (1985); Transcription and Translation, Hames & Higgins, Eds. (1984); Perbal, A Practical Guide to Molecular Cloning; the series, Meth. Enzymol., (Academic Press, Inc., 1984); Gene Transfer Vectors for Mammalian Cells, Miller & Calos, Eds. (Cold Spring Harbor Laboratory, NY, 1987); and Meth. Enzymol., Vols. 154 and 155, Wu & Grossman, and Wu, Eds., respectively.
Definitions
[0058] In describing the present technology, numerous technical terms are used. Unless defined otherwise, all technical and scientific terms used herein generally have the same meaning as commonly understood by one of ordinary skill in the art to which this technology belongs. As used herein, unless otherwise stated, the singular forms "a," "an," and "the" include plural reference. Thus, for example, a reference to "a nucleic acid" is a reference to one or more nucleic acids.
[0059] As used herein, the term "allele" is intended to be a genetic variation associated with a segment of DNA, i.e., one of two or more alternate forms of a DNA sequence occupying the same locus.
[0060] The term "biological sample" or "test sample" as used herein, refers to, but is not limited to, any biological sample derived from a subject. The sample suitably contains nucleic acids. In some embodiments, samples are not directly retrieved from the subject, but are collected from the environment, e.g. a crime scene or a rape victim. Examples of such samples include fluids, tissues, cell samples, organs, biopsies, etc. Suitable samples are blood, plasma, saliva, urine, sperm, hair, etc. The biological sample can also be blood drops, dried blood stains, dried saliva stains, dried underwear stains (e.g. stains on underwear, pads, tampons, diapers), clothing, dental floss, ear wax, electric razor clippings, gum, hair, licked envelope, nails, paraffin embedded tissue, post mortem tissue, razors, teeth, toothbrush, toothpick, dried umbilical cord. Genomic DNA can be extracted from such samples according to methods known in the art.
[0061] The terms "capillary electrophoresis histogram" or "electropherogram" as used herein refer to a histogram obtained from capillary electrophoresis of PCR products wherein the products were amplified from genomic loci with fluorescent primers.
[0062] The term "methylated" as used herein means methylated at a level of at least 80% (i.e. at least 80% of the DNA molecules methylated) in DNA of cells of tissues including blood, saliva, semen, epidermis, nasal discharge, buccal cells, hair, nail clippings, menstrual excretion, vaginal cells, urine, and feces.
[0063] The term "partially-methylated" as used herein means methylated at a level between 20-80% (i.e. between 20-80% of the DNA molecules methylated) in DNA of cells of tissues including blood, saliva, semen, epidermis, nasal discharge, buccal cells, hair, nail clippings, menstrual excretion, vaginal cells, urine, and feces.
[0064] The term "unmethylated" as used herein means methylated at a level less than 20% (i.e. less than 20% of the DNA molecules methylated) in DNA of cells of tissues including blood, saliva, semen, epidermis, nasal discharge, buccal cells, hair, nail clippings, menstrual excretion, vaginal cells, urine, bone, and feces. The methods provided herein have been demonstrated to distinguish methylated and unmethylated forms of nucleic acid loci in various tissues and cell types including blood, saliva, semen, epidermis, nasal discharge, buccal cells, hair, nail clippings, menstrual excretion, vaginal cells, urine, bone, and feces.
[0065] The terms "determining," "measuring," "assessing," "assaying", and "evaluating" are used interchangeably to refer to any form of quantitative or qualitative measurement, and include determining if a characteristic, trait, or feature is present or not. Assessing may be relative or absolute. "Assessing the presence of" includes determining the amount of something present, as well as determining whether it is present or absent.
[0066] The term "forensics" or "forensic science" as used herein refers to the application of a broad spectrum of methods aimed to answer questions of identity being of interest to the legal system. For example, the identification of potential suspects whose DNA may match evidence left at crime scenes, the exoneration of persons wrongly accused of crimes, identification of crime and catastrophe victims, or establishment of paternity and other family relationships.
[0067] The term "locus" (plural--loci) refers to a position on a chromosome of a gene or other genetic element. Locus may also mean the DNA at that position. A variant of the DNA sequence at a given locus is called an allele. Alleles of a locus are located at identical sites on homologous chromosomes. A control locus is a locus that is not part of the profile. A control locus can simultaneously be a restriction locus as can the profile locus. A restriction locus is a locus that comprises the restriction enzyme recognition sequence that is amplified and subsequently part of the locus amplicon. The term "natural DNA" or "natural nucleic acid" as used herein refers to, but is not limited to, nucleic acid which originates directly from the cells of a subject without modification or amplification.
[0068] The term "nucleic acid" as used herein refers to, but is not limited to, genomic DNA, cDNA, hnRNA, mRNA, rRNA, tRNA, fragmented nucleic acid, and nucleic acid obtained from subcellular organelles such as mitochondria. In addition, nucleic acids include, but are not limited to, synthetic nucleic acids or in vitro transcription products.
[0069] The term "nucleic-acid based analysis procedures" as used herein refers to any identification procedure which is based on the analysis of nucleic acids, e.g. DNA profiling.
[0070] The term "STR primers" as used herein refers to any commercially available or made-in-the-lab nucleotide primers that can be used to amplify a target nucleic acid sequence from a biological sample by PCR. There are approximately 1.5 million non-CODIS STR loci. Non-limiting examples of the above are presented in the following website www.cstl.nist.gov/biotech/strbase/str_ref.htm that currently contains 3156 references for STRs employed in science, forensics and beyond. In addition to published primer sequences, STR primers may be obtained from commercial kits for amplification of hundreds of STR loci (for example, ABI Prism Linkage Mapping Set-MD10 -Applied Biosystems), and for amplification of thousands of SNP loci (for example, Illumina BeadArray linkage mapping panel). The term "CODIS STR primers" as used herein refers to STR primers that are designed to amplify any of the thirteen core STR loci designated by the FBI's "Combined DNA Index System", specifically, the repeated sequences of TH01, TPDX, CSF1PO, VWA, FGA, D3S1358, D5S818, D7S820, D13S317, D16S539, D8S1179, D18S51, and D21S11, and the Amelogenin locus.
[0071] "Intensity of signal" refers to the intensity and/or amount of signal corresponding to amplification products of a genomic locus. For example, in capillary electrophoresis the intensity of signal of a specific locus is the number of relative fluorescence units (rfus) of its corresponding peak.
[0072] Methylation Ratio (also called "Observed Methylation Ratio") refers to relative signal intensities between a pair of loci. A methylation ratio is calculated by dividing the intensity of signal of the first locus in the locus pair by the intensity of signal of the second locus in the pair. In case that the intensity of signal of the second locus in the pair is zero, it is assigned an arbitrary small intensity signal (in order to avoid division by zero). Unless indicated otherwise, methylation ratios are calculated from DNA samples of unknown origin.
[0073] Reference Methylation Ratios (also called "Empirical Methylation Ratios") are methylation ratios obtained from samples of DNA of known sources, also called reference DNAs. Similar to methylation ratios, reference methylation ratios can be determined, for example, by dividing the intensity of signal of the first locus in the locus pair by the intensity of signal of the second locus in the pair. Because reference methylation ratios are determined from DNA of known source, one can create a library of known ratios between various pairs of genomic loci.
[0074] Probability Scores are calculated by comparing observed methylation ratios to reference methylation ratios. The probability score of a certain DNA sample at a certain methylation ratio and for a certain category (e.g. blood), provide a measure of the likelihood that the DNA sample originated from that category, based on the relative position of the observed methylation ratio to the distribution of reference methylation ratios of that category.
[0075] Combined Probability Scores (CPS) of each tissue/cell type can be calculated from the single probability scores, for example by calculating the nth root of the product of the single probability scores (where n is the number of methylation ratios).
[0076] Likelihood: For each tissue/cell type, a Likelihood Score (LS) represents the likelihood that the DNA sample originated from that tissue/cell type. Likelihood scores for each tissue/cell type can be calculated for example as follows:
LS(tissue)=CPS(tissue)/[sum of CPSs of all tissues].
[0077] A. Selection and Isolation of DNA Sample
[0078] In one aspect, the present disclosure provides methodology for determining the tissue/cell type source of a DNA sample. For example, a DNA sample of unknown origin undergoes a procedure including one or more biochemical steps followed by signal detection. Following signal detection, the signal is analyzed to determine the source of the DNA sample. These methods are employed on any DNA sample in question, including but not limited to DNA from a body fluid stain found at a crime scene, or DNA from cancerous lesions of unknown origin.
[0079] The isolation of nucleic acids (e.g. DNA) from a biological sample may be achieved by various methods known in the art (e.g. see Sambrook et al, (1989) Molecular Cloning: A Laboratory Manual, 2nd ed. Cold Spring Harbor, N.Y.). Determining the source of the DNA sample may be accomplished using various strategies, including those described in the following sections.
[0080] The present inventors discovered that methylation ratio profiles can be used to determine the source of a DNA sample.
[0081] B. Methodology for Determining Methylation Levels of Genomic Loci
[0082] There are several different methods for determining the methylation level of genomic loci. Examples of methods that are commonly used are bisulfite sequencing, methylation-specific PCR, and methylation-sensitive endonuclease digestion.
[0083] Bisulfite sequencing. Bisulfite sequencing is the sequencing of bisulfite treated-DNA to determine its pattern of methylation. The method is based on the fact that treatment of DNA with sodium bisulfite results in conversion of non-methylated cytosine residues to uracil, while leaving the methylated cytosine residues unaffected. Following conversion by sodium bisulfite, specific regions of the DNA are amplified by PCR, and the PCR products are sequenced. Since in the polymerase chain reaction uracil residues are amplified as if they were thymine residues, unmethylated cytosine residues in the original DNA appear as thymine residues in the sequenced PCR product, whereas methylated cytosine residues in the original DNA appear as cytosine residues in the sequenced PCR product.
[0084] Methylation-specific PCR: Methylation specific PCR is a method of methylation analysis that, like bisulfite sequencing, is also performed on bisulfite-treated DNA, but avoids the need to sequence the genomic region of interest. Instead, the selected region in the bisulfite-treated DNA is amplified by PCR using two sets of primers that are designed to anneal to the same genomic targets. The primer pairs are designed to be "methylated-specific" by including sequences complementing only unconverted 5-methylcytosines, or conversely "unmethylated-specific", complementing thymines converted from unmethylated cytosines. Methylation is determined by the relative efficiency of the different primer pairs in achieving amplification.
[0085] It should be understood in the context of the present disclosure that methylation-specific PCR determines the methylation level of CG dinucleotides in the primer sequences only, and not in the entire genomic region that is amplified by PCR. Therefore, CG dinucleotides that are found in the amplified sequence but are not in the primer sequences are not included in the CG locus.
[0086] Methylation-sensitive endonuclease digestion: Digestion of DNA with methylation-sensitive endonucleases represents a method for methylation analysis that can be applied directly to genomic DNA without the need to perform bisulfite conversion. The method is based on the fact that methylation-sensitive endonucleases digest only unmethylated DNA, while leaving methylated DNA intact. Following digestion, the DNA can be analyzed for methylation level by a variety of methods, including gel electrophoresis, and PCR amplification of specific loci.
[0087] In methylation-sensitive endonuclease digestion, each CG locus is comprised of one or more CG dinucleotides that are part of recognition sequence(s) of the methylation-sensitive restriction endonuclease(s) that are used in the procedure. CG dinucleotides that are found in the amplified genomic region, but are not in the recognition sequence(s) of the endonuclease(s) are not included in the CG locus.
[0088] In one embodiment, the one or more CG loci that are detected are partially methylated in natural DNA, but would be unmethylated in artificial DNA. Partial methylation would be expected to result in a mixture of T and C at the position being interrogated. Hybridization would be observed to both the T specific probes/primers and the C specific probes/primers, similar to detection of a heterozygous SNP. Relative amounts of hybridization may be used to determine the relative amount of methylation. Alternatively, both C and T would be observed upon bisulfite sequencing. Alternatively, fluorescent signals corresponding to amplification products of methylated or partially methylated CG loci can be detected.
[0089] C. Methylation Ratio Assay
[0090] As mentioned above, one particular assay of the present disclosure involves the quantitative comparison of intensity of the signals from a pair of locus-specific amplification products produced by performing a Polymerase Chain Reaction on restriction-digested DNA. See, e.g., FIGS. 1 and 2. The numerical ratio of intensities allows one to identify the tissue/cell type source of the DNA sample. For example, in one embodiment, locus 1 and locus 2 can be amplified using fluorescently labeled primers, separated by electrophoresis, and the intensity of the signals is the relative fluorescence units (rfu) of peaks corresponding to the loci. See, e.g., FIG. 3. The intensity of the signals will correspond to the successfulness of amplification of locus 1 and locus 2 from the source DNA template. By comparing rfu between the two amplification products one can calculate a ratio that reflects whether there is more or less of one amplification product than another.
[0091] In addition, however, one aspect of this assay includes the predetermination of the expected methylation ratios from various types of tissues/cell types. Thus, the template DNA that is subject to analysis is first digested with a methylation-sensitive restriction endonuclease before it is cycled through the PCR amplification protocol. It is not necessary for both primer pairs to have a similar amplification efficiency, nor is it necessary to have knowledge of the absolute methylation levels. In order to be able to correlate an observed methylation ratio with a specific tissue/cell type, one of ordinary skill in the art may compare the observed ratio with ratios obtained empirically from DNA samples of known origin.
[0092] With this premise, the present assays comprise digesting a DNA sample with a methylation-sensitive and/or methylation-dependent enzyme, performing a PCR amplification reaction on the digested DNA, and determining the intensity of the signals from locus-specific amplification products. As mentioned, the intensity of signals can be quantified or measured by using fluorescent PCR. If the numerical ratio between the two amplification products matches or approximates that of the reference ratio of the same loci amplified from a known tissue/cell type, then the test DNA sample is determined to be of that tissue/cell type.
[0093] This particular methylation ratio assay does not depend upon identifying or obtaining measurements of the absolute methylation fraction or level of selected loci. In addition, this particular methylation ratio assay does not depend upon the efficiencies of the primer pairs used, does not necessitate that both primer pairs have similar efficiencies, is not reliant upon amount of input template DNA, is not reliant upon specific thermocycler machine and reaction conditions. Rather, the assay determines the ratio between two signals which correspond to the ratio of methylation levels in the different loci. By this manner, the quantity or concentration of starting DNA material in the sample is irrelevant to the analysis and does not skew the output results. That is, the ratio of signal levels between a first locus and a second locus will remain constant regardless of how much DNA is used as a template for PCR and regardless of the number of amplification cycles that are run on the PCR thermocycler. For example, a methylation ratio of 10 between loci 1 and 2 will remain the same whether the input DNA represents methylation levels of 0.9 and 0.09 (90% methylation in locus 1 and 9% in 2), or 0.5 and 0.05 (50% methylation in locus 1 and 5% in 2), etc.
[0094] The methylation ratio assay of the present disclosure has several advantages over other approaches for analyzing methylation. For instance, this assay is insensitive to various "noise" factors inherent when relying on the absolute quantification of methylation level, since such quantification is sensitive to noise and fluctuates as a consequence of changes in template DNA concentration, thermocycler manufacturer, PCR conditions, and presence of inhibitors. Instead, the presently-calculated methylation ratios are insensitive to such factors, since the analyzed loci are co-amplified in the same reaction and are therefore subject to the effects of such disparities. Thus, the present methodology does not require absolute quantification of genomic targets or amplicons; and the assay is a single stand-alone reaction with no need for a standard curve or any external controls.
[0095] The methylation ratio assay can be performed on very small quantities of DNA in a single biochemical reaction and is therefore an inexpensive, rapid, and powerful method for establishing, for example, the tissue/cell type source of a DNA sample. An important feature of the design of the present methods is that it can be combined with other PCR-based procedures, such as DNA profiling, in a single biochemical reaction.
[0096] In addition, the assay can detect useful biological information and can perform the task of identifying the source of DNA when simple determination of actual methylation levels fails. The assay relies on methylation ratios between samples, which are relatively constant between different individuals, and does not rely on actual methylation levels of any specific locus, which vary very significantly between different individuals.
[0097] This assay therefore provides a useful biochemical marker in the form of, in one example, a numerical ratio, that can be used to differentiate between different sources of DNA. More particular details of this exemplary assay follow.
[0098] (1). Primers For Locus-Specific Amplification
[0099] Accordingly, an aspect of the present disclosure concerns obtaining a "methylation ratio" (MR) in which the intensities of signals of amplification products of DNA loci produced from fluorescent PCR are compared to one another in order to calculate ratios between pairs of loci, e.g., Loci #1 vs. Loci #2; Loci #1 vs. Loci #3; Loci #1 vs. Loci #4; Loci #2 vs. Loci #3, Loci #2 vs. Loci #4, and so on. When this technique is used to determine the source of a DNA sample, the primers that are used in the methylation ratio amplification reactions are chosen so as to amplify a pair of loci that are differentially methylated in various tissues/cell types.
[0100] One consideration for selecting which two pairs of primers (a first pair and a second pair) to use to amplify two loci (1) and (2) is the degree to which the two loci are differentially methylated in various tissues/cell types. Thus, for example, a pair of loci whose methylation ratio is greater than 1 in one tissue/cell type, and less than 1 is all other tissues/cell types can be used to design primers for the methylation ratio amplification assay.
[0101] (2) Selection of Loci For Amplification
[0102] The only requirements for a pair of genomic loci to be used in the present methodology are that each should contain at least one recognition sequence for the methylation sensitive/dependent enzyme (e.g. GCGC in the case of HhaI), and that the methylation ratio should not be uniform across all tissues/cell types.
[0103] There are no other requirements for the loci. Specifically, loci do not need to be positioned on any specific chromosome or genomic position, they do not need to be of any specific length, do not necessarily need to be single-copy in the genome, etc.
[0104] In order to find recognition sequences for specific endonucleases, a person ordinarily skilled in the art can download any desired genome, and find the locations of any specific endonuclease, which are the locations of the substring of the recognition sequence (e.g. GCGC for HhaI) in the entire string of the genome.
[0105] In order to identify candidate pairs of genomic loci whose methylation ratios is not expected to be uniform in different tissues/cell types, and therefore "informative", a person ordinarily skilled in the art can randomly choose genomic loci and empirically test their usefulness for the assay, or search published data regarding differential methylation of specific genomic regions in different tissues/cell types. See Eckhardt et al, "DNA methylation profiling of human chromosomes 6, 20 and 22" (2006), Nature Genetics 38, 1378-1385 and Straussman et el., "Developmental programming of CpG island methylation profiles in the human genome" (2009), Nature Structural and Molecular Biology 16, 564-571.
[0106] There is published data regarding methylation levels in various genomic regions. However, methylation levels per se are meaningless in the context of the assay described here, and there is no published data regarding methylation ratios. Methylation ratios can theoretically be deduced from data regarding methylation levels, however, in reality, in the context of the present assay, this is not feasible because: (1) published methylation levels are in qualitative rather than quantitative (i.e. methylated vs. unmethylated), and for purposes of ratios a numerical value is required; (2) methylation levels between tissues relates to methylation of regions (containing several CGs) rather than specific CGs. For example, in
[0107] Straussman et el., island #2, which contains many CGs, is reported to be more methylated in blood than in semen. However this does not mean that any specific CG within that island is more methylated in blood vs. semen, and therefore for any specific CG, the methylation ratio must be checked empirically. (3) existing data is either on a small set of samples or from pooled DNA, and in either case this is insufficient for drawing statistical conclusions on the entire human population. Methylation ratios should be obtained from a number of individuals large enough for reaching statistical significance.
[0108] Although the chosen genomic loci can be of any length, it may be advantageous to use relatively short amplicons (less than ˜100bp), since shorter amplicons are more likely to be intact in degraded DNA. In addition, if the assay is intended for use together with DNA profiling, such short amplicons can be useful since their size does not overlap with the size of the fragments commonly used for DNA profiling.
[0109] (3) Methylation-Sensitive Restriction Endonucleases
[0110] A second consideration of the present methodology is the selection of loci that are or are not cut or digested by a methylation-sensitive and/or methylation-dependent restriction endonuclease. The endonuclease is selected if, for instance, it is unable to cut the DNA strand if its recognition sequence in that locus is methylated. Thus, in the context of locus (1), which is methylated, and locus (2), which is not methylated, an endonuclease like HhaI or HpaII will not digest locus (1) but will digest locus (2). Accordingly, the selection of loci for amplification in the methylation ratio assay may also take into account the presence of methylation-sensitive restriction endonuclease recognition sequences within each locus.
[0111] In light of the foregoing, therefore, exemplary characteristics of a suitable pair of loci includes (A) their comparative methylation ratios in different tissue/cell types, and (B) that both loci contain at least one recognition sequence recognized by the same methylation-sensitive restriction endonuclease. In another embodiment, each locus further comprises a short tandem repeat sequence (STR).
[0112] Forward and reverse primers can then be designed to anneal to a region of DNA that flanks the recognition sequence of the loci.
[0113] Accordingly, in the case of a methylation-sensitive enzyme, if a locus is methylated it will (A) not be digested but (B) it will be amplified. Conversely, if a locus is unmethylated, it will (A) be digested but (B) not amplified. In the case of a methylation-dependent enzyme, the situation is vice versa.
[0114] (4) Creation of Reference Distributions
[0115] Reference distributions are distributions of methylation ratios obtained from samples of DNA of known sources. For example, a reference distribution for saliva for SEQ26/SEQ31 may consist of 50 methylation ratios of SEQ26/SEQ31 observed and calculated from saliva samples obtained from 50 different individuals.
[0116] Thus, to devise reference ratios for different tissues/cell types, the person of ordinary skill in the art can, for example, (1) identify a pair of loci that each contain a recognition sequence for the endonuclease (either methylation-sensitive or methylation-dependent) and which are known to be non-uniform methylation ratios across the different tissues/cell types; (2) digest a sample of DNA from a known tissue/cell type; (3) perform a PCR amplification reaction with PCR primers that are designed to amplify the first and second loci; and (4) determine the intensity of the amplification signals.
[0117] The methylation ratio is then calculated by dividing the intensity of the first locus amplification product by the second locus amplification product, or vice versa. If the amplification is performed by fluorescence PCR, then the intensity signal of each amplification product can be readily measured and reported in terms of its relative fluorescent units (rfu). In such a case, the methylation ratio can be obtained by dividing the numerical value of the rfu of the first locus amplification product by the rfu of the second locus amplification product to yield a single number that reflects the methylation ratio between the two known and selected loci from the reference DNA sample. The measurement of fluorescence signals can be performed automatically and the calculation of intensity signal ratios performed by computer software. In order to avoid the problem of division by 0, in case the signal of the denominator is 0, it may arbitrarily be assigned a small positive value.
[0118] The foregoing is an example of how the person of skill in the art may systematically determine methylation ratios between two loci selected from DNA of a known tissue/cell type. In so doing, the ordinarily skilled person can create a library of known ratios between various known pairs of genomic loci.
[0119] (5) Determining the Tissue/Cell Type Source of DNA
[0120] The ordinarily skilled person can determine the most likely source tissue/cell type from the list of methylation ratios, for example, as follows:
[0121] 1. For each observed methylation ratio, calculate probability scores (between 0-1), one for each tissue/cell type. One way to calculate the probability score for a specific tissue is as follows: one minus two times the absolute difference between 0.5 and the value of the cumulative distribution function of the corresponding reference distribution (of that tissue/cell type) at the observed methylation ratio. This measures how close the observed methylation ratio is to the mean of the specific reference distribution.
[0122] 2. For each tissue/cell type, calculate a Combined Probability Score (CPS) based on all probability scores of that tissue/cell type as follows: CPS=n-th root of the product of all probability scores, where n is the number of probability scores
[0123] 3. For each tissue/cell type, calculate a Likelihood Score (LS) as follows:
[0123] LS(tissue)=CPS(tissue)/[sum of CPSs of all tissues]
[0124] 4. The most likely tissue is the tissue with the highest likelihood score.
[0125] (6) Capillary Electrophoresis
[0126] The rapidity of the analysis is evident in consideration of the use of, for instance, capillary electrophoresis to separate numerous amplification products produced from the amplification of multiple pairs of target loci. As described above the present methylation ratio assay can be performed on multiple loci, and in each case a methylation ratio is calculated for each pair of loci separately. For example, if four loci (A,B,C,D) are co-amplified in the reaction, six different methylation ratios can be calculated, i.e.: A/B, A/C, A/D, B/C, B/D, C/D.
[0127] Accordingly, if "n" loci are co-amplified, then (n2-n)/2 different ratios can be calculated. Therefore, the amount of information that is provided by the present methylation assay rises exponentially with the number of analyzed loci. Capillary electrophoresis, as opposed to real-time PCR amplification methods, can distinguish between a large number of loci in a single run. For example, for DNA profiling, 17 genomic loci are routinely co-amplified from a particular DNA sample, and analyzed together. As a consequence, the performance of the present methylation ratio assay on all 17 loci yields 136 independent methylation ratios. Real-time PCR cannot simultaneously distinguish in a single reaction those numbers of discrete amplification products necessary to produce 136 ratios. About four loci can by distinguished by real time PCR, which corresponds to the calculation of only six ratios.
[0128] By contrast, capillary electrophoresis can readily separate out amplification products from all paired permutations of 17 loci and can therefore readily produce data to simultaneously calculate all 136 methylation ratios in a single reaction. Theoretically, hundreds of loci can be run together and separated in a single capillary electrophoresis run.
[0129] (7) Loci, Primers, and Commercially Available Profiling Kits
[0130] Any pair of loci can be used according to the present disclosure to calculate methylation ratios. As discussed elsewhere herein exemplary characteristics of a suitable pair of loci includes (A) they exhibit non uniform methylation ratios in different tissues, (B) that both loci contain at least one recognition sequence recognized by the same methylation-sensitive and/or methylation dependent restriction endonuclease, and, optionally, that (C) each locus contains a short tandem repeat (STR) sequence.
[0131] One collection of loci that is used for DNA profiling and which can be used in the present methods, is the U.S. Federal Bureau of Investigation's (FBI) Combined DNA Index System (CODIS). See www.fbi.gov/hq/lab/html/codis1.htm, which is incorporated herein by reference. The CODIS is a collection of thirteen loci identified from the human genome that contain short (or simple) tandem repeat (STR) core sequences. An STR may comprise dimeric, trimeric, tetrameric, pentameric and hexameric tandem repeats of nucleotides. See U.S. Pat. No. 5,843,647 (Simple Tandem Repeats).
[0132] The CODIS loci are known as D16S539 (SEQ ID NO. 1), D7S820 (SEQ ID NO. 2), D13S317 (SEQ ID NO. 3), D5S818 (SEQ ID NO. 4), CSF1PO (SEQ ID NO. 5), TPOX (SEQ ID NO. 6), TH01 (SEQ ID NO. 7), vWA (SEQ ID NO. 8), FGA (SEQ ID NO. 9), D21S11 (SEQ ID NO. 10), D8S1179 (SEQ ID NO. 11), D18S51 (SEQ ID NO. 12), and D3S1358 (SEQ ID NO. 13). SEQ ID NOs 1-13 are provided herein.
[0133] Other loci that are not included in the CODIS collection but which can be used according to the present disclosure include but are not limited to Penta D (SEQ ID NO. 14), Penta E (SEQ ID NO. 15), and Amelogenin (SEQ ID NOs. 16 and 17); and D2S1338 (SEQ ID NO. 18), D19S433 (SEQ ID NO. 19), ACTBP2SE33 (SEQ ID NO. 20), D10S1248 (SEQ ID NO. 21), D1S1656 (SEQ ID NO. 22), D22S1045 (SEQ ID NO. 23), D2S441 (SEQ ID NO. 24), and D12S391 (SEQ ID NO. 25).
[0134] Commercially available kits that are sold for DNA profiling analyses provide PCR amplification primers that are designed to amplify all CODIS and some non-CODIS loci. Promega Corporation's PowerPlex® 16 DNA profiling series is an example of a commercially available collection of primers for amplifying sixteen loci identified as Penta E, D18S51, D21S11, TH01, D3S1358, FGA, TPOX, D8S1179, vWA, Amelogenin, Penta D, CSF1PO, D16S539, D7S820, D13S317 and D5S818. See www.promega.com/applications/hmnid/productprofiles/pp16/ which is incorporated herein by reference. The PowerPlex® 16 kit is particularly useful because it has been approved for forensic DNA profiling use by the European police network, INTERPOL, the European Network of Forensic Science Institutes (ENFSI), GITAD (Grupo Iberoamericano de Trabajo en Analisis de DNA) and the United States Federal Bureau of Investigation (FBI).
[0135] As explained in more detail below, the present disclosure encompasses the use of a kit, such as the PowerPlex® 16 profiling kit, in conjunction with one or more primers for amplifying additional loci that are not contained within the kit. As a non-limiting example, these additional locus may be selected because they are known to be differentially methylated in various tissues/cell types. Examples of such additional loci include but are not limited to SEQ ID NOs. 26-31. Thus, in accordance with the methylation ratio assay described herein, the ordinarily skilled person will expect a methylation-sensitive enzyme, such as HhaI, to properly bind and cut the unmethylated HhaI restriction site in these loci.
[0136] In another aspect of the present disclosure, prior knowledge of the sequence or methylation characteristics of a particular locus or pair of loci is not a prerequisite to performing an assay described herein. That is, an assay of the present disclosure encompasses the random selection of loci and the subsequent comparison of paired random loci amplified from a restriction-digested DNA sample to yield ratios that can be compared against control or threshold ratio values indicative of, for instance, the tissue/cell type source of the DNA sample.
[0137] D. Combination of CODIS, Kits, and Methylation Assay
[0138] Accordingly, the combination of a CODIS or PowerPlex® 16 kit and the additional loci enables to simultaneously profile a DNA sample and determine the tissue/cell type source of the sample. For instance, the present methodology contemplates digesting a DNA sample with HhaI, and amplifying the DNA with the PowerPlex® 16's kit, to which primers for loci from SEQ ID NOs: 26-31 are added.
[0139] Analysis of loci SEQ ID NOs: 26-31, as described above, will yield the determination of the tissue/cell type source of the DNA sample, whereas the analysis of the profiling loci (e.g. PowerPlex16 loci) will yield the determination of the DNA profile.
[0140] Thus, a powerful aspect of the present inventive technology is its ability to transform and expand the usefulness of existing commercial DNA profiling kits to do more than profile a particular subject's DNA. The combination of the inventive assays disclosed herein, such as the methylation ratio assay, with, for instance, the PowerPlex® 16 kit, enables the user to test the profiled DNA and determine the tissue/cell types source of the DNA.
[0141] (1) DNA Profiling Kits
[0142] Other examples of DNA profiling kits whose usefulness can be enhanced to determine also the tissue/cell type source of the DNA sample include but are not limited to SGM, SGM+, AmpFlSTR Identifiler, AmpFlSTR Profiler, AmpFlSTR ProfilerPlus, AmpFlSTR ProfilerPlusID, AmpFlSTR SEfiler, AmpFlSTR SEfiler Plus, AmpFlSTR Cofiler, AmpFlSTR Identifiler Direct, AmpFlSTR Identifiler Plus, AmpFlSTR NGM, AmpFlSTR Y-filer, AmpFlSTR Minifiler, PowerPlex1.1, PowerPlex2.1, PowerPlex16, PowerPlexES, PowerPlexESX16, PowerPlexESI16, PowerPlexESX17, and PowerPlexESI17.
[0143] (2) Sequences
[0144] The sequences provided herein for the various CODIS, PowerPlex® 16, and other loci commonly used for profiling, i.e., SEQ ID NOs. 1-25, have been analyzed herein to determine (1) the position of every cytosine-guanine (CG) dinucleotide, (2) the methylation-sensitive and methylation-dependent restriction enzyme profile for that particular locus. The sequence listing included within the text of this application therefore provides guidance to the ordinarily skilled person in the identification of particular methylation-sensitive and methylation-dependent restriction endonucleases that can be used in accordance with ratio-generating assay methods.
[0145] The sequence information provided herein also permits the ordinarily skilled artisan to design forward and reverse amplification primers that anneal to regions of a selected locus that flank the CG and restriction site. Thus, the present disclosure is not limited to the amplification of, for instance, CODIS loci, using only those commercially available primers, although the use and availability of commercially available primers can be a more convenient and cost-effective option for performing the present authentication assays.
[0146] (3) Correction for "Ski-Slope" Effect
[0147] A common problem with some electropherogram trace outputs is an artifact known as a "ski slope." A "ski slope" is the name given to an artifact that is sometimes observed in electropherograms and which manifests in an inverse relationship between amplicon size and signal intensity. In such electropherograms, the signals resemble a "ski-slope" tail, the trace of which runs down and to the right. This artifact can be caused by several factors, for example by sample overload (too much DNA template in PCR) or from degraded DNA.
[0148] The present assays correct for this artifact in the calculation of methylation ratios by performing a normalization step. Typically, the normalization process entails (1) obtaining a linear fit for the sample from a subset of loci; (2) normalizing all peak values to the linear fit obtained in (1); and (3) calculating methylation ratios based on normalized peak values. Specific loci used for calculation of linear fit in PowerPlex® 16 were determined herein as D3S1358, TH01, D21S11, Penta_E.
[0149] A criterion for deciding which subset of loci are useful for calculating the linear fit is whether the loci are uninformative in relation with the tested character. Specifically, they should not contain the recognition sequence of the restriction enzyme used in the assay, or else should have similar methylation ratios in all relevant tissues. For example, for the PowerPlex16 kit it was found herein that this subset consists of the loci D3S1358, TH01, D21S11, Penta_E. Once the subset of loci is determined, the linear fit can be calculated, for example, by performing the least squares method on the relative fluorescent unit (rfu) signals of this particular subset of loci. Subsequent normalizing of a peak value can be achieved, for example, by dividing the rfu of the peak by the value of the linear fit at the same X-axis coordinate (size in bp). See, e.g., FIG. 4.
[0150] (4) Algorithm and Software
[0151] In one embodiment, calculation of methylation ratios is performed based on analysis of the intensities of signals of amplification products of fluorescent PCR that are run on a capillary electrophoresis machine. The output of the capillary electrophoresis machine is a binary computer file (for example, an FSA file in the case of capillary electrophoresis machines of Applied Biosystems). This file includes information regarding the capillary electrophoresis run, including the channel data, which is the relative fluorescent units (rfus) of each fluorophore as a function of each sampling time point (called datapoint).
[0152] The present disclosure also describes a software program that accepts as input a file that is the output a capillary electrophoresis machine run, and calculates the fluorescence intensities of a set of loci whose amplification products were run on the capillary electrophoresis machine. Based on these intensities, the software calculates methylation ratios, based on a set of predefined pairs of loci for which the ratios are defined to be calculated. Finally, the software outputs the tissues/cell type that is most likely the source of the DNA sample
[0153] Following is a scheme of this analysis performed by the software program:
[0154] 1. Read the channel data of each fluorophore. This requires knowledge of the specific format in which the channel data is encoded in the capillary electrophoresis output file. In the case of FSA files, the format is explained in detail in a document written by Applied Biosystems (which is available online at www.appliedbiosystems.com/support/software_community/ABIF_File_Format.pdf- ), enabling a person skilled in the art to write a computer program to obtain the channel data (and other information regarding the run) from this file.
[0155] 2. Perform baseline reduction for the channel data of each fluorophore. Each fluorophore has a basal fluorescent intensity level, meaning that even when no amplification products labeled by that fluorophore are detected at a certain datapoint, the rfu level of that fluorophore will be non-zero at that datapoint. In order to perform correct analysis, the baseline level of each fluorophore needs to be removed by reducing the baseline level from the rfu level at all time-points. The baseline level of each fluorophore can be obtained, for example, by averaging the rfu level of that fluorophore in parts of the run in which there were no amplification products for that fluorophore. Because normally most of the capillary electrophoresis run is devoid of amplification products, finding such regions is not a difficult task for a person skilled in the art.
[0156] 3. Remove spectral overlap between fluorophores. The fluorescent dyes used in capillary electrophoresis have distinct maximum emission lengths, but nevertheless they have overlapping emission spectra. This means that certain dyes "pull-up" other dyes, creating artifact rfu levels in the other dyes. In order to perform correct analysis, these pull-ups need to be removed. This can be performed by knowing the n*n matrix of pull-ups (where n is the number of dyes), in which the (i,j) element is the fraction by which dye i pulls-up dye j. This matrix can be obtained by running on the dye set the spectral calibration procedure on the capillary electrophoresis machine
[0157] 4. Detect peaks. Certain parts of the channel data are peaks signals, each corresponding to a specific amplification product. An amplification product can correspond for example to an allele of a profiling locus, a control locus, or a peak in the standard curve. Peaks in capillary electrophoresis data have distinct patterns that enable to detect them, and a person skilled in the art knows this distinct pattern. Based on this, an algorithm for peak detection can be designed. One example for such a peak detection algorithm is as follows: detect all local maxima (i.e. datapoints at which the rfu level is greater than the rfu level of both two neighboring datapoints) and define each such local maxima as peaks with a height equal to the rfu level at the local maxima point. Because not all local maxima correspond to peaks, excessive peaks need to be removed. One way to remove excessive peaks is, for example, based on the idea that a peak must have the highest rfu level in its close vicinity (within its X neighboring datapoints). Based on this, excessive peaks are removed by going over all peaks, and removing any peak that is close (within X datapoints, where X is some pre-defined parameter) to another higher peak.
[0158] 5. Assign sizes in basepairs to peaks. Channel data for each fluorophore is obtained as a set of rfu levels as a function of datapoints. Datapoints correlate to basepairs, but the exact function correlating between the two needs to be determined. For this purpose, a standard curve--a set of amplification products with known lengths in basepairs--is run together with the sample amplification products (whose lengths are unknown). Based on the standard curve peaks, a fit correlating datapoints and basepairs is obtained. This fit can be obtained using one of several methods known in the art, for example using the Least Squares method. Once a fit is obtained, all detect peaks are assigned their sizes in basepairs.
[0159] 6. Obtain the signal intensities of the loci used for analysis. The expected size of each analyzed locus is known a priori. Loci can be polymorphic (e.g. as used for profiling), and in this case their expected size is within a certain range based on the set of possible alleles of that locus. Other loci are non-polymorphic (e.g. control loci), in which case their expected size is within a smaller range. The signal intensity of each locus is the sum of rfus of non-artifact peaks within the range of the locus (e.g. the two peaks corresponding to the two alleles of a profiling locus).
[0160] 7. Obtain the methylation ratios. Once signal intensities are calculated for all loci, a methylation ratio between a pair of loci is the division of the signal intensity of the first locus in the pair by the signal intensity of the second locus in the pair.
[0161] 8. Calculate probability and combined probability scores. Probability scores can be calculated based by comparing methylation ratios to reference distributions of methylation ratios obtained from different tissues/cell types. Combined Probability Scores (CPS) of each tissue/cell type can then be calculated from the single probability scores, for example by calculating the n-th root of the product of the single probability scores (where n is the number of methylation ratios).
[0162] 9. Calculate likelihood scores. For each tissue/cell type, calculate a Likelihood Score (LS), that represents the likelihood that the DNA sample originated from that tissue/cell type. Likelihood scores for each tissue/cell type can be calculated for example as follows:
LS(tissue)=CPS(tissue)/[sum of CPSs of all tissues]
[0163] 10. Output the tissue/cell type with the highest LS.
(5) Determining the Source of a Mixed DNA Sample
[0164] In some cases, the DNA sample is not of pure source, but rather is a mixture of two or more source (e.g. 50% blood and 50% semen). The present invention can also determine the makeup of source of such a sample by performing the following analysis:
[0165] (a) digesting the DNA sample with a methylation-sensitive and/or methylation-dependent restriction endonuclease;
[0166] (b) amplifying the digested DNA with at least a first and a second restriction locus, thereby generating an amplification product for each restriction locus;
[0167] (c) determining the intensity of the signal of each amplification product;
[0168] (d) calculating at least one methylation ratio between the intensity of the signals corresponding to the two restriction loci;
[0169] (e) comparing the methylation ratio calculated in step (d) to a set of reference methylation ratios obtained from DNA of known tissues and/or cell types;
[0170] (f) determining the likelihood of each tissue and/or cell type contributing to the source of DNA; and (g) determining the composition of the source DNA based on the likelihoods obtained in step (f)
EXAMPLES
Example 1
Tissue Identifier Assay Based on Genomic Loci
[0171] In this example a tissue identifier assay was developed that is capable of distinguishing between DNA samples obtained from blood, semen, and skin epidermis. The assay is based on the analysis of six specific genomic loci, each set forth in SEQ ID NOs:. 26-31. Each locus is a fragment sized 70-105 bp containing a HhaI restriction site (GCGC). The enzyme HhaI cleaves its recognition sequence only if it is unmethylated, therefore the assay is based on differences in methylation in the recognition sequences only. The six genomic loci each contain additional CGs whose methylation status is of no consequence to the assay--only the methylation of the recognition sequence is relevant. The sequences of the six genomic loci are:
TABLE-US-00001 SEQ ID NO: 26 (Chr. 3): ##STR00001## SEQ ID NO: 27 (Chr. 10): ##STR00002## SEQ ID NO: 28 (Chr. 1): ##STR00003## SEQ ID NO: 29 (Chr. 5): ##STR00004## SEQ ID NO: 30 (Chr. 3): ##STR00005## SEQ ID NO: 31 (Chr. 22): ##STR00006## Primer sequences are underlined and shaded, HhaI recognition sequences are bolded.
[0172] The assay was performed on DNA samples extracted from semen, epidermis and blood of three different individuals (total of nine samples). One nanogram of each DNA sample was mixed with HhaI, Taq Polymerase, forward (fluorescently-labeled) and reverse primers for the six loci SEQ ID NOs: 26-31, dNTPs, and reaction buffer in a single microcentrifuge tube. The tube was then placed in a thermocycler and subject to a single program that contains an initial digestion step (37° C.), followed by PCR amplification of digestion products. Following the restriction-amplification reaction, an aliquot of the products was run on a capillary electrophoresis machine. FIG. 6 shows the electropherograms of capillary electrophoresis of the nine samples. In each electropherograms, there are six peaks, each corresponding to one locus. The data from the electropherograms of the nine samples was then analyzed as follows: for each sample, the intensity of the signal (rfu) in each locus was quantified, and methylation ratios (e.g. rfu of locus 1 divided by rfu of locus 2) were calculated for all 15 loci pair combinations (e.g. SEQ ID NO: 26/SEQ ID NO: 28).
[0173] Table 1 shows values of two of the fifteen such methylation ratios (SEQ ID NO: 29/SEQ ID NO: 30 and SEQ ID NO: 28/SEQ ID NO: 26) for all samples. For each sample, each methylation ratio was compared to the cumulative distribution functions of its reference distributions in blood, semen and epidermis (obtained empirically from a large set of DNA samples from blood, semen, and epidermis)
TABLE-US-00002 TABLE 1 Methylation ratios for two pairs of loci in the nine analyzed samples. SEQ29/SEQ30 SEQ28/SEQ26 Semen individual #1 4.01 0.04 Semen individual #2 1.27 0.02 Semen individual #3 2.54 0 Epidermis individual #1 0.76 6.68 Epidermis individual #2 0.81 5.38 Epidermis individual #3 0.76 6.41 Blood individual #1 0.21 0.18 Blood individual #2 0.30 0.25 Blood individual #3 0.33 0.42
[0174] Table 2 shows means and standard deviations of reference distributions for two methylation ratios (obtained empirically from a large set of DNA samples from blood, semen, and epidermis).
TABLE-US-00003 TABLE 2 Reference methylation ratio values for two pairs of loci (mean ± std) SEQ29/SEQ30 SEQ28/SEQ26 Semen 2.8 ± 1.1 0.02 ± 0.04 Epidermis 0.78 ± 0.06 6.21 ± 0.7 Blood 0.29 ± 0.04 0.28 ± 0.08
[0175] For each tissue/cell type, each comparison between the observed methylation ratio and its corresponding value in the cumulative distribution function yielded a Probability Score, calculated as follows:
[0176] PS(Blood, SEQ26/28)=1-[2*abs(f(OMR)-0.5)], where f is the cumulative distribution function of the reference distribution of SEQ26/28 in blood, and OMR is the observed methylation ratio of SEQ26/28 in the sample.
[0177] PS(Semen, SEQ26/28) and PS(Epidermis, SEQ26/28) were calculated in a similar manner.
[0178] Next, Combined Probability Scores (CPS) were calculated for each tissue type based on all methylation ratios as follows:
[0179] CPS(Blood)=nth root of [LS(Blood, methylation ratio #1)*LS(Blood, methylation ratio #2) * . . . * LS(Blood, methylation ratio #n)], where n is the number of methylation ratios
[0180] CPS(Semen) and CPS(Epidermis) were calculated in a similar manner.
[0181] Finally, Likelihood Scores (LS) were calculated from the combined probability scores as follows:
LS(Blood)=CPS(Blood)/[CPS(Blood)+CPS(Semen)+CPS(Epidermis)]
[0182] LS(Semen) and LS(Epidermis) were calculated in a similar manner.
[0183] The likelihood score of each tissue/cell type represents the likelihood that the DNA sample originated from that specific tissue/cell type.
[0184] Table 3 shows likelihood scores for the three tissues based on all methylation ratios for all 9 DNA samples.
TABLE-US-00004 TABLE 3 Likelihood scores based on all methylation ratios Combined likelihood scores based on all pairs of loci Semen Epidermis Blood Semen individual #1 >0.9999 <0.0001 <0.0001 Semen individual #2 >0.9998 <0.0001 <0.0001 Semen individual #3 >0.9999 <0.0001 <0.0001 Epidermis individual #1 <0.0001 >0.9999 <0.0001 Epidermis individual #2 <0.0001 >0.9998 <0.0001 Epidermis individual #3 <0.0001 >0.9998 <0.0001 Blood individual #1 <0.0001 <0.0001 >0.9999 Blood individual #2 <0.0001 <0.0001 >0.9999 Blood individual #3 <0.0001 <0.0001 >0.9999
[0185] Similarly, and as shown in FIG. 7, a tissue identification assay was performed using a 10-loci multiplex on 11 different DNA samples from blood, saliva, skin, semen, menstrual blood, vaginal swab, and urine. Analysis was based on 45 methylation ratios (e.g. locus1/locus 2, locus1/ locus 3, etc.). Differential methylation across blood, saliva, skin, semen, menstrual blood, vaginal tissue, and urine is evidenced by the different intensities of the analyzed loci. The assay correctly identified the source tissue of all samples. For example, and as shown in FIG. 7, DNA derived from menstrual blood can be differentiated from DNA derived from saliva.
TABLE-US-00005 SEQUENCES, METHYLATION PROFILE, CG SITES, & RESTRICTION SITES Sequence 1: D16S539 Amplicon length = 889 bps 1 CTCTTCTCAT TCCACAAGCT CTCCCCAAAA GACCCCATTC CTCCCCACCT TCAACCATCT 61 CTGGCAGGGA GGAGGGGGAA CTGAGAGGCT ACTTTCTGAC CCAGGACCCT AAGCCTGTGT 121 ACGGAGAGAG CATGAGCTGG GTGAGCTGCT TGCCAAGGAG TGGCATCTGC CCTCATCAGT 181 GGACACAAAA AGCCCCAGGG GTTAAGTGGC CATGGCTGCC CTCATGGCTG CACCGGGAGG 241 ATGACTGTGT TCCCACTCTC AGTCCTGCCG AGGTGCCTGA CAGCCCTGCA CCCAGGAGCT 301 GGGGGGTCTA AGAGCTTGTA AAAAGTGTAC AAGTGCCAGA TGCTCGTTGT GCACAAATCT 361 AAATGCAGAA AAGCACTGAA AGAAGAATCC AGAAAACCAC AGTTCCCATT TTTATATGGG 421 AGCAAACAAA GGCAGATCCC AAGCTCTTCC TCTTCCCTAG ATCAATACAG ACAGACAGAC 481 AGGTGGATAG ATAGATAGAT AGATAGATAG ATAGATAGAT AGATAGATAT CATTGAAAGA 541 CAAAACAGAG ATGGATGATA GATACATGCT TACAGATGCA CACACAAACG CTAAATGGTA 601 TAAAAATGGA ATCACTCTGT AGGCTGTTTT ACCACCTACT TTACTAAATT AATGAGTTAT 661 TGAGTATAAT TTAATTTTAT ATACTAATTT GAAACTGTGT CATTAGGTTT TTAAGTCTAT 721 GGCATCACTT TCGCTTGTAT TTTTCTATTG ATTTCTTTTC TTTTCTTTTC TTTTTTGAGA 781 CAGAGTCTCA CTCTCACCCA GGCTGGAGTA CCGTGGCACG ATCTTGGCTC ATTGCAACCA 841 CCACCTCCCG GGCTCAAGTG ATTATCCTGC CTCAGCCTCC CAAATAGCT CG locations, methylation status and restricting enzymes: 122: BslI Hpy166ii RsaI McrBC (half site) 234: BssKI HpaII Nt.CviPII ScrFI 269: Nt.CviPII 345: MwoI 589: McrBC (half site) 732: 812: Nt.CviPII 819: McrBC (half site) 849: AvaI BslI BssKI HpaII Nt.CviPII ScrFI SmaI TspMI --------------------------------------------------------------------------- --------- Sequence 2: D7S820 Amplicon length = 843 bps 1 ATATGCTAAC TGGATGTGAA CAATTGTGTT CTAATGAGCT TAATATGAGT TTCATAATTT 61 GTGCATTTTG CTGTTAAAAA GCCAGAAAAC AAAACAAAAC AAAATACTGA AACCAGTGTG 121 AACAAGAGTT ACACGATGGA AGGCATCAGT TTTCACACCA GAAGGAATAA AAACAGGCAA 181 AAATACCATA AGTTGATCCT CAAAATATGA TTGATTTTAA GCCTTATGAG ATAATTGTGA 241 GGTCTTAAAA TCTGAGGTAT CAAAAACTCA GAGGGAATAT ATATTCTTAA GAATTATAAC 301 GATTCCACAT TTATCCTCAT TGACAGAATT GCACCAAATA TTGGTAATTA AATGTTTACT 361 ATAGACTATT TAGTGAGATT AAAAAAAACT ATCAATCTGT CTATCTATCT ATCTATCTAT 421 CTATCTATCT ATCTATCTAT CTATCTATCT ATCGTTAGTT CGTTCTAAAC TATGACAAGT 481 GTTCTATCAT ACCCTTTATA TATATTAACC TTAAAATAAC TCCATAGTCA GCCTGACCAA 541 CATGGTGAAA CCCCGTCTCT AAAAAAAATA CAAAAATTAG CTGGATGCAG TAGCACATGC 601 CTGTAGTCCC AGCTACTCAG GAGGCTGGGG CAGGAGAACC ACTTGACCCA AGAAGCGGAG 661 GTTGCAGTGA GCCGAGATCG CACCACTGCA CTCCAGCCTG GGTGACAGAG TGAGACTCCA 721 TCTCAAGATA AAGAAATAAA TAAAAACAAA CAAACAAAAA AATTCCATAG GGGGTCAGGT 781 GCGGTGGCTC ATGCCTGTAA TCCCAGCACT TTGGGAGGCC GAAGCAGGTG GATCACTTGA 841 GGT CG locations, methylation status and restricting enzymes: 134: McrBC (half site) 300: McrBC (half site) 453: 461: 554: BsmBI Nt.CviPII 656: BslI MwoI McrBC (half site) 673: MwoI Nt.CviPII 679: BfuCI DpnI MwoI Sau3AI 782: McrBC (half site) 820: Nt.CviPII --------------------------------------------------------------------------- --------- Sequence 3: D135317 Amplicon length = 792 bps 1 AATATGAATT CAATGTATAC AGAGAGAGAG AGAGAGAGAG AGAGAGAGAG AGACTTCTAC 61 AGAGCTCTAA GCATAATTGT GTAACTCCAA GCTCACAGTG CCTAAGACCA GTACCAGGCT 121 GACTCATTGG AAAGCTGCCA TAGTAAGACT CTTCTGTTCA CTGCATTATT TATTGATGTA 181 TTGCAAGCAC TTAGTTACAT TTCTAGCATA TAACACATGA TCAATAAATA TTTTGACATG 241 AACAAATGGT AATTCTGCCT ACAGCCAATG TGAATATTGG GATGGGTTGC TGGACATGGT 301 ATCACAGAAG TCTGGGATGT GGAGGAGAGT TCATTTCTTT AGTGGGCATC CGTGACTCTC 361 TGGACTCTGA CCCATCTAAC GCCTATCTGT ATTTACAAAT ACATTATCTA TCTATCTATC 421 TATCTATCTA TCTATCTATC TATCTATCAA TCAATCATCT ATCTATCTTT CTGTCTGTCT 481 TTTTGGGCTG CCTATGGCTC AACCCAAGTT GAAGGAGGAG ATTTGACCAA CAATTCAAGC 541 TCTCTGAATA TGTTTTGAAA ATAATGTATA TTAATGAATG TACAAATTTC CCCACTTGTA 601 CTTTCAGACT GTTATCTGTG AGTTAAAACT CCTCCACTCT TTTTCCTACC CAAATAATAG 661 CATACTTTTT TCTGAGTATA TTTTGGGAAG AAGAGTTATT CAGTTATTGT TATATTTTAA 721 AAAATTCCTT ATACCAAACT CTACTTGATC TAAGGCTATT CATTGAAACT TTCAGCATGC 781 TTAATAGCAG TC CG locations, methylation status and restricting enzymes: 351: Nt.CviPII 380: McrBC (half site) --------------------------------------------------------------------------- --------- Sequence 4: D5S818 Amplicon length = 735 bps 1 CCCTCTGTGT AGCCTGGCTA TGTGCCACAT TGTGAGGTTC TCTCCCTCTA GCTACTTCTT 61 CCAGTTTCCT CTTTCAGGAT CCCAATTCCT TTCTCAAAGC ACTGGTGAAT AACTCCAAAT 121 ACTCCATCAT TTCATTATAC AGAGTAATAT AAGTCTTCTT TTTCTAAACC TCTCCCATCT 181 GGATAGTGGA CCTCATATTT CAGATGCTAA TAGGCTGTTG AGGTAGTTTC CTAAGCAAAA 241 AAGTAATTGT CTCTCTCAGA GGAATGCTTT AGTGCTTTTT AGCCAAGTGA TTCCAATCAT 301 AGCCACAGTT TACAACATTT GTATCTTTAT CTGTATCCTT ATTTATACCT CTATCTATCT 361 ATCTATCTAT CTATCTATCT ATCTATCTAT CTATCTTCAA AATATTACAT AAGGATACCA 421 AAGAGGAAAA TCACCCTTGT CACATACTTG CTATTAAAAT ATACTTTTAT TAGTACAGAT 481 TATCTGGGAC ACCACTTTAA TTAGAAGCTT TAAAAGCATA TGCATGTCTC AGTATTTAAT 541 TTTAAAATTA TTACATAATT ATATACTCCT TTGAATTAGA AAATTACAAA TGTGGCTATG 601 TATTATTTTC TCCCATGTAT TTTCAAAATG AGGGGGTAAG CCAGACCCTC TCCCTCTCCC 661 ATGCCTAATA GCTCAAAGTT AAAGGTAAAG AAACAAGAAA ATATGGTGAA AGTTAACCAG 721 CTTCACTTCA GAGGA CG locations, methylation status and restricting enzymes: --------------------------------------------------------------------------- --------- Sequence 5: CSF1PO Amplicon length = 949 bps 1 ATTCAACACA TGAGGCACGG CCAGACCTAA ATGTCTCAGA GCCTGCTCCC ACTCCGATGA 61 GCTGCTGCCT TGCTTCAGGG TCTGAGTCCA GTGACTGCCA CTGCCTGCAC CCAATCACCA 121 TAGCCAGAGA CCTGGAGGTC ATCCTTATCT CCTTTCTCTT CCTCATCCCT GCATCTCAGA 181 CTCTTCCACA CACCACTGGC CATCTTCAGC CCATTCTCCA GCCTCCAGGT TCCCACCCAA 241 CCCACATGGT GCCAGACTGA GCCTTCTCAG ATACTATCTC CTGGTGCACA CTTGGACAGC 301 ATTTCCTGTG TCAGACCCTG TTCTAAGTAC TTCCTATCTA TCTATCTATC TATCTATCTA 361 TCTATCTATC TATCTATCTA TCTATCTAAT CTATCTATCT TCTATCTATG AAGGCAGTTA 421 CTGTTAATAT CTTCATTTTA CAGGTAGGAA AACTGAGACA CAGGGTGGTT AGCAACCTGC 481 TAGTCCTTGG CAGACTCAGG TTGGAACACT GCCCTGGAGT GTGTGCTCCT GACCACCACG 541 AAGTGCCTCC TCTGTACAAT CTGACCCCAT CACTCTCCTC TTTACAATGA CCTCCCAATA 601 GGTTAAGATG CAGTTATTCT TTCTCACTTT AAGACACCTT TACCTCCGGC TTCTGCCACC 661 TCCTCTGCTC CCCTGTGGCC ACTCCTCACA CCACTCCACA TCCCAGCTGT TGTCAAGTTC 721 TTTCAGTGTT CCAAATGATC TATGTTCTCT TTGCCTTTGA GCCTTGCATA TGTTCCTCCC 781 TCTGCCAGAA GCGCTGTTCC CCTTCCTTTC CCACCCTTCT GCCCGGCCAA CTCACCTTCA 841 TTCTTCCCAT CCCAGTTTAG AGGCCACCTT CTCGAAGCCT GGGTTGGGGG GACTCTTCAG 901 TGTTCCCAGG ACACCTTGTG CTTCCCCCAT AATCACTGGG TGATCATTG CG locations, methylation status and restricting enzymes: 18: BceAI EaeI McrBC (half site) 55: Nt.CviPII 539: McrBC (half site) 647: HpaII Nt.CviPII 792: AfeI HaeII HhaI HinPlI MwoI McrBC (half site) 824: BssKI EaeI HpaII Nt.CviPII ScrFI 873: Hpy188iii --------------------------------------------------------------------------- --------- Sequence 6: TPOX Amplicon length = 832 bps 1 CCCAGCACAC ACCTTGCCTC TGGCTGGGAC CCCCTTTGCT GCTGGCCCTG CTCAGGCCCC 61 ACAGCTTGAT CTCCTCATGT TCCCACTGCT GACTTCCCCA AGCTAACTGT GCCACAGAGT 121 GGGGGACCCC CTCCCGGCTC TCACAACCCC CACCTTCCTC TGCTTCACTT TTCACCAACT 181 GAAATATGGC CAAAGGCAAA AACCCATGTT CCCACTGGCC TGTGGGTCCC CCCATAGATC 241 GTAAGCCCAG GAGGAAGGGC TGTGTTTCAG GGCTGTGATC ACTAGCACCC AGAACCGTCG 301 ACTGGCACAG AACAGGCACT TAGGGAACCC TCACTGAATG AATGAATGAA TGAATGAATG 361 AATGAATGTT TGGGCAAATA AACGCTGACA AGGACAGAAG GGCCTAGCGG GAAGGGAACA 421 GGAGTAAGAC CAGCGCACAG CCCGACTTGT GTTCAGAAGA CCTGGGATTG GACCTGAGGA 481 GTTCAATTTT GGATGAATCT CTTAATTAAC CTGTGGGGTT CCCAGTTCCT CCCCTGAGCG 541 CCCAGGACAG TAGAGTCAAC CTCACGTTTG AGCGTTGGGG ACGCAAACAC GAGAGTGCTT 601 GGTGTGAGCA CACAGGAGGA GTCACGACAG AGCAGTGTAA GAGCCGCCAC GTGGGTCCCA 661 CACAGGGGGA GTCACGACAC AGCAGTGTAA GAGCCGCCAC GAGGGTCCCA CACAGGGGGA 721 GTCGCGACAC AGCAGTGTAA GAGCCGCCAC GAGGGTCCCA CACAGGGGGA GTCACGACAC 781 AGCAGTGTAA GAGCCGCCAC GAGGGTCCCA CACAGGGGGA GTCACGACAC AG CG locations, methylation status and restricting enzymes: 135: BslI BssKI HpaII Nt.CviPII ScrFI 240: BfuCI DpnI Sau3AI 296: BslI Hpy99I Nt.CviPII 299: AccI BslI HincII HincII Hpy166ii Hpy99I SalI SalI-HF 383: McrBC (half site) 408: McrBC (half site) 434: HhaI HinPlI McrBC (half site) 443: Nt.CviPII 539: HaeII HhaI HinPlI McrBC (half site) 565: HpyCH4IV TscI McrBC (half site)
573: McrBC (half site) 582: BsmFI HgaI McrBC (half site) 590: McrBC (half site) 625: Hpy188iii McrBC (half site) 645: AciI BslI Fnu4HI Nt.CviPII 650: BsaAI BslI HpyCH4IV PmlI TscI McrBC (half site) 675: Hpy188iii McrBC (half site) 695: AciI BslI Fnu4HI Nt.CviPII 700: BslI McrBC (half site) 723: BstUI HinfI Hpy188iii NruI PleI 725: BstUI Hpy188iii NruI McrBC (half site) 745: AciI BslI Fnu4HI Nt.CviPII 750: BslI McrBC (half site) 775: Hpy188iii McrBC (half site) 795: AciI BslI Fnu4HI Nt.CviPII 800: BslI McrBC (half site) 825: Hpy188iii McrBC (half site) --------------------------------------------------------------------------- --------- Sequence 7: TH01 Amplicon length = 766 bps 1 TTACCCTTGG GGTGGGGGTG TAGGATGCAG CTGGGGCTGC AGTTCCAGGC CACGGAGAGC 61 CTGTGAGGCT GGGCCCCGGG GCGCCCTGGG GAGGGGATGC CTGATGGGGA GCCTGGTGGG 121 GGAGGGTAGG GGAGGGCGGG GGAGGACGGG GGAGGGCGCC CTGTGTCCCT GAGAAGGTAC 181 CTGGAAATGA CACTGCTACA ACTCACACCA CATTTCAATC AAGGTCCATA AATAAAAACC 241 CATTTTAAAT GTGCCAGGGA GCCCAAGGTT CTGAGTGCCC AAGGAGGCAC CGAAGACCCC 301 TCCTGTGGGC TGAAAAGCTC CCGATTATCC AGCCTGGCCC ACACAGTCCC CTGTACACAG 361 GGCTTCCGAG TGCAGGTCAC AGGGAACACA GACTCCATGG TGAATGAATG AATGAATGAA 421 TGAATGAATG AGGGAAATAA GGGAGGAACA GGCCAATGGG AATCACCCCA GAGCCCAGAT 481 ACCCTTTGAA TTTTGCCCCC TATTTGCCCA GGACCCCCCA CCATGAGCTG CTGCTAGAGC 541 CTGGGAAGGG CCTTGGGGCT GCCTCCCCAA GCAGGCAGGC TGGTTGGGGT GCTGACTAGG 601 GCAGCTGGGG CAGAGGGAGG CAGGGGCAGG TGGGAGTAGG GTGGGGGCTG GGTGCAGCAG 661 CCGGGGACCT CTGGCCATCT TGGATTTTTT GGATGGATTT GTTTCCACAT TCCGATCGTT 721 AAGATTCAAG ATGAAACAAG ACACAGAGAC CCACACGACC CCCGAG CG locations, methylation status and restricting enzymes: 53: BslI McrBC (half site) 77: AvaI BssKI HpaII Nt.CviPII ScrFI SmaI TspMI 82: BanI BbeI BsaHI HaeII HhaI HinPlI KasI NarI NlaIV SfoI McrBC (half site) 137: McrBC (half site) 147: McrBC (half site) 157: BanI BbeI BsaHI HaeII HhaI HinPlI KasI NarI NlaIV SfoI McrBC (half site) 291: BanI NlaIV Nt.CviPII 322: Hpy188iii Nt.CviPII 367: BslI Nt.CviPII 662: BssKI HpaII Nt.CviPII ScrFI 713: BsiEI Nt.CviPII PvuI 717: BfuCI BsiEI DpnI PvuI Sau3AI 756: McrBC (half site) 763: AvaI Nt.CviPII --------------------------------------------------------------------------- --------- Sequence 8: vWA Amplicon length = 751 bps 1 AGATGATAGA TACATATGTT AGACAGAGAT AGGATAGATGATAGATACAT AGGTTAGATA 61 GAGATAGGAT AGATTATAAA TAGATACACA GGTTAGATAGATTAGACAGA CAGATAGATA 121 CATACATAGA TATAGGATAG ATAACTAGAT ACAATAGAGATAGATAGATA GATAGATAGA 181 TGATAGAGGA TAGATGATAA ATAGATATAT AGCTTAGATAGAGATAGGAT AGATGATAGA 241 TACATAGGAT AGATAGAGAC AGGATAGATG ATAAATAGATACATAGGTTA GATAGAGATA 301 GGACAGATGA TAAATACATA GGATGGATGG ATAGATGGATAGATAGATAG ATAGATAGAT 361 AGATAGATAG ATAGATAGAT AGACAGACAG ACAGACAGACAGATAGATCA ATCCAAGTCA 421 CATACTGATT ATTCTTATCA TCCACTAGGG CTTTCACATCTCAGCCAAGT CAACTTGGAT 481 CCTCTAGACC TGTTTCTTCT TCTGGAAGGT GGGAACTCTACCTTATAGGA TCAGTCTGAG 541 GAGTTCACAA AATAATAAGG GCAAAGTGCC CGGCACATTGTAGGAGACTA GTAATGTCTA 601 TAAAATGAGG GGCTTGAAGT AAATGATCCC TCTAGTTCTCTCTACTGCTA ACATTCTAAG 661 ACCTCCTTTA CATTAATTGT TCTCAAGCCA CATCTCCCTCCCCTACAGGA CTTCTATTTA 721 TTTCTGATCA ATTTCATGAG TACAAATAAG T CG locations, methylation status and restricting enzymes: 571: BssKI HpaII Nt.CviPII ScrFI --------------------------------------------------------------------------- --------- Sequence 9: FGA Amplicon length = 945 bps 1 ACTGAACATT TGCTTTTGAA ATTTACTATC TATGTACCGT TGGAAAATTT ACTTAATATC 61 TCTGAATTTT TTTTCTTCAA CTGTGGAGTG AGGAAAATAA TACCTACTTT TAGGTAGATG 121 ATGGATATAA CACTTTTCTC TGCATATAGT AGACACTCAG TGCATAACTA TCGCCTTCCT 181 TTTCCCTCTA CTCAGAAACA AGGACATCTG GGACCACAGC CACATACTTA CCTCCAGTCG 241 TTTCATATCA ACCAACTGAG CTCTAACATT TTTCTGCAGA AGCTGGATAT GCTGTACTTT 301 TTCTATGACT TTGCGCTTCA GGACTTCAAT TCTGCTTCTC AGATCCTCTG ACACTCGGTT 361 GTAGGTATTA TCACGGTCTG AAATCGAAAA TATGGTTATT GAAGTAGCTG CTGAGTGATT 421 TGTCTGTAAT TGCCAGCAAA AAAGAAAGGA AGAAAGGAAG GAAGGAGAAA GAAAGAAAGA 481 AAGAAAGAAA GAAAGAAAGA AAGAAAGAAA GAAAGAAAGA AAGAGAAAAA AGAAAGAAAG 541 AAACTAGCTT GTAAATATGC CTAATTTTAT TTTGGTTACA GTTTAATCTG TGAGTTCAAA 601 ACCTATGGGG CATTTGACTT TTGGATAATG TTATGCCCTG CAGCCTTCCA TGAATGCCAG 661 TTAAGATGTC CTAATAGCAA TTAGTAATCC CAAAGAAATA TAGAAGAAGA ACTTTCTTTG 721 GAATTTTAAA GGTGTAATTT GGAGTTAAAA TAGTTGGTTT GATTGCATTT CAATTATTTT 781 ATAACATCCT TAATCAAGGG ACTTGAACAT ATTGGATTTT CTTACTGATG AGCTTTTCTT 841 TTTAATCTAT AGATTTGAAA TGGTTCCTAA GCTGTTTTGG GTCAACAGGA TCACTCACTT 901 GCCAGCTAGT GTTGCATCAC TGATTTTAAA TGTCAAGTGT TTGTG CG locations, methylation status and restricting enzymes: 38: Nt.CviPII 172: 239: 314: HhaI HinPlI McrBC (half site) 356: 374: McrBC (half site) 385: --------------------------------------------------------------------------- --------- Sequence 10: D21S11 Amplicon length = 823 bps 1 GTTGGCTGGG GCTCAGAGAG AACAAAAAGG CAGAGGAAAA ACAAATTTCC CCTCTCACTT 61 CTGGAGATGG AACACTTTTC TTCTGCTTTT GGACATCAGA AATCCAAGTT CTCTGGCCTT 121 TGGACTTTGG GACTTGTGCC AGCACCCTCC TGGGTTCCCT GGCCTTTGGC CTCAAACTGA 181 AGGTTACACT ATCAGCTTCC GTTGTTCTAA GGGCTTCAGA CTTGGACAGC CACACTGCCA 241 GCTTCCCTGA TTCTTCAGCT TGTAGATGGT CTGTTATGGG ACTTTTCTCA GTCTCCATAA 301 ATATGTGAGT CAATTCCCCA AGTGAATTGC CTTCTATCTA TCTATCTATC TGTCTGTCTG 361 TCTGTCTGTC TGTCTATCTA TCTATATCTA TCTATCTATC ATCTATCTAT CCATATCTAT 421 CTATCTATCT ATCTATCTAT CTATCTATCT ATCTATCTAT CGTCTATCTA TCCAGTCTAT 481 CTACCTCCTA TTAGTCTGTC TCTGGAGAAC ATTGACTAAT ACAACATCTT TAATATATCA 541 CAGTTTAATT TCAAGTTATA TCATACCACT TCATACATTA TATAAAACCT TACAGTGTTT 601 CTCCCTTCTC AGTGTTTATG GCTAGTAATT TTTTACTGGG TGCCAGACAC TAATTTTTAT 661 TTTGCTAAGT GGTGAATATT TTTTATATCC TTAAAAATAT TTTTGAGTGT TGATCTGGGT 721 AAAGTTAAGT TCAATATTGG AAAAATATTG ATTCTTTTGA GGATAGTTAT CTTCTAATTA 781 GTCTACCTGT TGCCCCATAA ATGGCATGAT TTTCCACTCT GTG CG locations, methylation status and restricting enzymes: 200: Nt.CviPII 461: --------------------------------------------------------------------------- --------- Sequence 11: D8S1179 Amplicon length = 824 bps 1 TACTACAGCA AGAGCGCTTG AACCAGATGT AGGGGAGATA GCAGCTGGAG AGCATAACAG 61 AGGCACTGAC ATGTGAGCAG CTAACGAGGC CTTTTACAAG ACATCTGTGA CCACACGGCC 121 AAGTAGAAGA AAGCCGTTAA AAGCATCAAG GTAGTTAGGT AAAGCTGAGT CTGAAGTAAG 181 TAAAACATTG TTACAGGATC CTTGGGGTGT CGCTTTTCTG GCCAGAAACC TCTGTAGCCA 241 GTGGCGCCTT TGCCTGAGTT TTGCTCAGGC CCACTGGGCT CTTTCTGCCC ACACGGCCTG 301 GCAACTTATA TGTATTTTTG TATTTCATGT GTACATTCGT ATCTATCTGT CTATCTATCT 361 ATCTATCTAT CTATCTATCT ATCTATCTAT CTATTCCCCA CAGTGAAAAT AATCTACAGG 421 ATAGGTAAAT AAATTAAGGC ATATTCACGC AATGGGATAC GATACAGTGA TGAAAATGAA 481 CTAATTATAG CTACGTGAAA CTATACTCAT GAACACAATT TGGTAAAAGA AACTGGAAAC 541 AAGAATACAT ACGGTTTTTG ACAGCTGTAC TATTTTACAT TCCCAACAAC AATGCACAGG 601 GTTTCAGTTT CTCCACATCC TTGTCAACAT TTGTTATTTT CTGGGTTTTT GATAATAGCT 661 GTGAAAGGAA AATAAAAACT TGGGCCGGGC GCGGTGGCTC ACGCCTGTAA TCCCAGCACT 721 TTGGGAGGCC AAGGCGGGCA GATCTCAAGG TCGGGAGATT GAGACCATCC TGGCTAACAT 781 GGTGAAAACC CATCTCTACT AAAAATACAA AAACAAAAAA TTAG CG locations, methylation status and restricting enzymes: 15: AfeI HaeII HhaI HinPlI McrBC (half site) 85: MwoI McrBC (half site) 116: BceAI EaeI McrBC (half site) 135: Nt.CviPII 211: 245: BanI BbeI BsaHI HaeII HhaI HinPlI KasI MwoI MarI NlaIV SfoI McrBC (half site) 294: BceAI BglI MwoI McrBC (half site) 338: BaeI 448: McrBC (half site) 460: McrBC (half site) 494: BsaAI HpyCH4IV TscI McrBC (half site) 552: McrBC (half site) 686: BssKI HpaII Nt.CviPII Sau96I ScrFI 690: BstUI HhaI HinPlI McrBC (half site) 692: BstUI HhaI HinPlI 702: McrBC (half site) 735: Cac8I McrBC (half site) 752: Hpy188iii --------------------------------------------------------------------------- --------- Sequence 12: D18S51 Amplicon length = 927 bps 1 CATGCCACTA AGCTGTACAC TGAAAAACGG TTAACATGAT AAATTTTATG TTACATACAT 61 TTTACCACAA TTTAAAAAAA TTATTAAAAA ATACTAACAA TAGGCCAAGC GTGATGGCTC 121 ACACCTGTAA TCCCAGCACT TTGGGAGGCT GAGACAGGTG GATCAATTGA GCTCAGGAGT 181 TTGAGACCAG CCTGGGTAAC ACAGTGAGAC CCCTGTCTCT ACAAAAAAAT ACAAAAATTA 241 GTTGGGCATG GTGGCACGTG CCTGTAGTCT CAGCTACTTG CAGGGCTGAG GCAGGAGGAG 301 TTCTTGAGCC CAGAAGGTTA AGGCTGCAGT GAGCCATGTT CATGCCACTG CACTTCACTC 361 TGAGTGACAA ATTGAGACCT TGTCTCAGAA AGAAAGAAAG AAAGAAAGAA AGAAAGAAAG 421 AAAGAAAGAA AGAAAGAAAG AAAGAAAGAA AGAAAGAAAA AGAGAGAGGA AAGAAAGAGA 481 AAAAGAAAAG AAATAGTAGC AACTGTTATT GTAAGACATC TCCACACACC AGAGAAGTTA 541 ATTTTAATTT TAACATGTTA AGAACAGAGA GAAGCCAACA TGTCCACCTT AGGCTGACGG 601 TTTGTTTATT TGTGTTGTTG CTGGTAGTCG GGTTTGTTAT TTTTAAAGTA GCTTATCCAA 661 TACTTCATTA ACAATTTCAG TAAGTTATTT CATCTTTCAA CATAAATACG CACAAGGATT 721 TCTTCTGGTC AAGACCAAAC TAATATTAGT CCATAGTAGG AGCTAATACT ATCACATTTA
781 CTAAGTATTC TATTTGCAAT TTGACTGTAG CCCATAGCCT TTTGTCGGCT AAAGTGAGCT 841 TAATGCTGAT CAGGTAAATT AAAAATTATA GTTAATTAAA AGGGCATAAA TGTTACCTGA 901 CTCAATAAGT CATTTCAATT AGGTCTG CG locations, methylation status and restricting enzymes: 28: McrBC (half site) 110: McrBC (half site) 257: BsaAI HpyCH4IV PmlI TscI McrBC (half site) 598: McrBC (half site) 629: 709: McrBC (half site) 826: BslI --------------------------------------------------------------------------- --------- Sequence 13: D3S1358 Amplicon length = 731 bps 1 CTGGTTTTGG TGGAATTGAC TCCCTCTGTC ACAAACTCAG CTTCAGCCCA TACCCTGAGC 61 CATAGACCTA TCCCTCTAAT GCATTGTACT AGTCTCAGGG CTAATAACAA GGGAGAGGTG 121 TCAAAGGGCC AGTTCCACCT CCACCACCAG TGGAAAAGCT ATTCCCAGGT GAGGACTGCA 181 GCTGCCAGGG CACTGCTCCA GAATGGGCAT GCTGGCCATA TTCACTTGCC CACTTCTGCC 241 CAGGGATCTA TTTTTCTGTG GTGTGTATTC CCTGTGCCTT TGGGGGCATC TCTTATACTC 301 ATGAAATCAA CAGAGGCTTG CATGTATCTA TCTGTCTATC TATCTATCTA TCTATCTATC 361 TATCTATCTA TCTATCTATC TATCTATCTA TGAGACAGGG TCTTGCTCTG TCACCCAGAT 421 TGGACTGCAG TGGGGGAATC ATAGCTCACT ACAGCCTCAA ACTCCTGGGC TCAAGCAGTC 481 CTCCTGCCTC AGCCTCCCAA GTACCTGGGA TTATAGGCAT GAGCCACCAT GTCCGGCTAA 541 TTTTTTTTTT TAAGAGATGG GGTCTCGCTG TGTTCCCCAG CCTTGTCTTA AACTCCTGGC 601 CTCAAGTGAT CCTCCCATCT CAGCCTTCCA AAGTGCTGAG ATTACAGCAG AGGCTTTTAA 661 GTCAAAGCTT TCCCTGCTAG GACAAGCCCT AGTTAAAGTC CTGGAGCACT GGCCACTGCA 721 GCTGCACTTG G CG locations, methylation status and restricting enzymes: 534: HpaII Nt.CviPII 566: BsaI BsmAI Nt.BsmAI --------------------------------------------------------------------------- --------- Sequence 14: Penta D Amplicon length = 1026 bps 1 CCTACTCGGG AGGCTGAGGC AGGAGAATCG CTTGAACCCA GGAGGGGGCG ACTGCAGTGA 61 GCCGAGATCG TGCCACTGCA CTCCAGCCTG GGTGACAGAG CGAGACTCCA TCTCAAAAAA 121 AAAAAAAAAA AAACAGAATC ATAGGCCAGG CACAGTGGCT AATTGTACCT TGGGAGGCTG 181 AGACGGGAGG ATCGAGACCA TCCTGGGCAC CATAGTGAGA CCCCATCTCT ACAAAAAAAA 241 AAAAAAATTT TTTTTAAATA GCCAGGCATG GTGAGGCTGA AGTAGGATCA CTTGAGCCTG 301 GAAGGTCGAA GCTGAAGTGA GCCATGATCA CACCACTACA CTCCAGCCTA GGTGACAGAG 361 CAAGACACCA TCTCAAGAAA GAAAAAAAAG AAAGAAAAGA AAAGAAAAGA AAAGAAAAGA 421 AAAGAAAAGA AAAGAAAAGA AAAGAAAAGA AAAGAAAAAA CGAAGGGGAA AAAAAGAGAA 481 TCATAAACAT AAATGTAAAA TTTCTCAAAA AAATCGTTAT GACCATAGGT TAGGCAAATA 541 TTTCTTAGAT ATCACAAAAT CATGACCTAT TAAAAAATAA TAATAAAGTA AGTTTCATCA 601 AAACTTAAAA GTTCTACTCT TCAAAAGATA CCTTATAAAG AAAGTAAAAA GACACGCCAC 661 AGGCTAAGAG AAAGTACTTC TAATCACATA TCTAAAAAAG GACTTGTGTC CAGATTAAAG 721 AATTCTTACA CATCAATAAG ACAACCCAAT TAAAAATGGG CAAAAGATTT GAAGAGATAT 781 TTAACCAAAG AAAACATATA AATGTGTCCG GGCGCGATGG TAATCCCAGC ACTTTGAGAG 841 GCCGAGGCAG GCGGATCACT TGAGGTCAGG AGTTTAGGAC CAGTCTGGCC AACATGGTGA 901 AACCCTGTCT CTAATAAAAA TACAAAAATT AGCTGGGTGT GGTGGCGTAA GCCTGTAATC 961 CCAGCTGCTC AGGAGGCTGA GGCAGAAGAA TTGCTTGAAC CTGGGAGGTG GAGGCTGCAG 1021 TAAGCG CG locations, methylation status and restricting enzymes: 7: AvaI Hpy188iii 29: HinfI TfiI 49: McrBC (half site) 63: Nt.CviPII 69: BfuCI DpnI Sau3AI 101: McrBC (half site) 184: McrBC (half site) 193: BfuCI DpnI Hpy188iii Sau3AI 307: 461: McrBC (half site) 515: 655: McrBC (half site) 809: BssKI HpaII Nt.CviPII ScrFI 813: BstUI HhaI HinPlI McrBC (half site) 815: BstUI HhaI HinPlI 843: Nt.CviPII 852: Cac8I EciI McrBC (half site) 946: McrBC (half site) 1025: McrBC (half site) --------------------------------------------------------------------------- --------- Sequence 15: Penta E Amplicon length = 977 bps 1 CACATGTGGA CATTTCTTAT TTTCTCATAT TGGTGGTATG GCTCATTTAT GAAGTTAATA 61 CTGGACATTG TGGGGAGGCT GTGTAAGAAG TGTTAAAGGG GATCAGGGAT ACATTCACTT 121 CTCTTTTCCT TTGCTAGTTC TGTGGTCTTA AGCAAAGTAG CCTCAAACAT CAGTTTCCTC 181 TTTTATAAAA TGAGGAAAAT AATACTCATT ACCTTGCATG CATGATATAA TGATTACATA 241 ACATACATGT GTGTAAAGTG CTTAGTATCA TGATTGATAC ATGGAAAGAA TTCTCTTATT 301 TGGGTTATTA ATTGAGAAAA CTCCTTACAA TTTTCTTTTC TTTTCTTTTC TTTTCTTTGA 361 GACTGAGTCT TGCTCAGTCG CCCAGGCTGG AGTGCAATGG CGTGATCTCG GCTCACTTCA 421 ATCTCCACCT CCTGGGTTCA AGTGATTCTC CTGTTTCAGC CTCCAGAGTA GCTGGGATTA 481 CAGGTGCCTA CCACCACACC CAGCTAATTT TTTGTATTTT AGTAGAGACG GGGTTTCACC 541 ATGTTGCCCA GGCTGGTCTT GATCTCCTGA GCTCAGGTAA TACACCTGCA TCGGCCTCCC 601 AAAGTGCTAG GATTGCAGGC GTGAATCACC GCACCTGTCC ACAATTTTCT TGTTATTGGT 661 ACCCTTTCAT GTTGGTAAAA TGTATTTTAT TTTCTCTTAT CAAATAATTT TCAATGCAAT 721 GAGACGTCAA CTTTAAGCCC AAAGTAGACC AGTAGTAAAA CTAAGGCTGA AACCATTGAT 781 TGATTATTAC CATATATTGT CCTAAAATAT TCGGCTTTTA AAACATTTGG TTTCATTTTT 841 CATGATAAAA ATATGTAGCA TTTTTGCACT TTTAATTCAC TTTGTAGAGT TCTCAATCAT 901 TTCTAACACA TGCTTGGCAA TGACAAGCCA TTTGTGAAAG AGTTTTGCTG GCTTTAAAAT 961 ATATGCAAAT GTAATAT CG locations, methylation status and restricting enzymes: 379: 401: McrBC (half site) 409: 529: McrBC (half site) 592: 620: Cac8I McrBC (half site) 630: AciI Nt.CviPII 725: AatII BsaHI HpyCH4IV TscI ZraI McrBC (half site) 812: --------------------------------------------------------------------------- --------- Sequence 16: AMEL X Amplicon length = 706 bps 1 AGGTCTCCTC TTCTATACAG CACATTTGTT CAAACTAAAA ACAGACCTCA AGTATATTCT 61 GCACTATATA GATTTTTTTA AAGTAGCTTC AGTCTCCTTT AATGTGAACA ATTGCATACT 121 GACTTAATCT CTTCCTCTCT CTTCTCTTCC TTCACTCTCT CCCTTCCTCT CTCTTTCTAT 181 TCTCCTCCCC TCCTCCCTGT AAAAGCTACC ACCTCATCCT GGGCACCCTG GTTATATCAA 241 CTTCAGCTAT GAGGTAATTT TTCTCTTTAC TAATTTTGAC CATTGTTTGC GTTAACAATG 301 CCCTGGGCTC TGTAAAGAAT AGTGTGTTGA TTCTTTATCC CAGATGTTTC TCAAGTGGTC 361 CTGATTTTAC AGTTCCTACC ACCAGCTTCC CAGTTTAAGC TCTGATGGTT GGCCTCAAGC 421 CTGTGTCGTC CCAGCAGCCT CCCGCCTGGC CACTCTGACT CAGTCTGTCC TCCTAAATAT 481 GGCCGTAAGC TTACCCATCA TGAACCACTA CTCAGGGAGG CTCCATGATA GGGCAAAAAG 541 TAAACTCTGA CCAGCTTGGT TCTAACCCAG CTAGTAAAAT GTAAGGATTA GGTAAGATGT 601 TATTTAAAAC TCTTTCCAGC TCAAAAAACT CCTGATTCTA AGATAGTCAC ACTCTATGTG 661 TGTCTCTTGC TTGCCTCTGC TGAAATATTA GTGACTAAGT GGTATA CG locations, methylation status and restricting enzymes: 290: McrBC (half site) 427: 443: AciI FauI Nt.CviPII 484: EaeI Nt.CviPII --------------------------------------------------------------------------- --------- Sequence 17: AMEL Y Amplicon length = 712 bps 1 TTATTCTCCA ATATTTTGAA ATGTGAATAT TACAGTAATT TCCCTTGTCC AAATGAGAAA 61 ACCAGGGTTC CAAAGAGAGG AAATTATTTG CCCAAAGTTA GTAATTTTAC CTAATCTTTA 121 CATTTTACCG GATGGGATAG AACCAAGCTG GTCAGTCAGA GTTGACTTTT TGCCCTTTCA 181 TGGAACCTTC CTGAGCAGTG GTTCATGAAT GAATAAACTT ACAGCCATAT TTAGGAGGAA 241 AGAGTCAATC CGAATGGTCA GGCAGGAGGG TGCTGGAGCA ACACAGGCTT GAGGCCAACC 301 ATCAGAGCTT AAACTGGGAA GCTGATGGTA GGAACTGTAA AATTGGGACC ACTTGAGAAA 361 CCACTTTATT TGGGATGAAG AATCCACCCA CTATTCTTTA CAGAGCCCAG GGGACTGCTA 421 ATGCAAACAG TGATCAAAAT TAGTAAAGAG AAAAATTACC TCATAGCTGA AGTTGATATA 481 ACCAGGGTGC CCAGGATGAG GTGGTAGCTT TTATAGGGAG GAGGGGAGGA GAAGAGAAAG 541 AGAGAGGAAG GGAGAGTGTG AAGGAAGGGA AGAGAGAGTA AGAGATTAAG TCAATATGCA 601 ATTGTTAACA TTAAGAGAGA CTAAAATTAC TTTTAAAAAA TCTATATAGT ACAGAATATA 661 TTTGAGGTCT GTTTTTCGTT AAAACAAGTG TGCTATGTAG GAGAGGAGAC TT CG locations, methylation status and restricting enzymes: 129: HpaII Nt.CviPII 251: Nt.CviPII 677: --------------------------------------------------------------------------- --------- Sequence 18: D2S1338 Amplicon length = 840 bps 1 ACAAGGCACG GAACTCACAC CCAGCCTCTC TCCATACAAC AGAATATGGG TTCTTGCGGA 61 GCTGGACTCT GCAGGAGTCT ATCTAATATG GACTCTGTGT CAATGACTCC TGGGCCTCCT 121 CTGATCACCC CATTAAAGTC CTTCGATTGC TTTGAGCCTC AAATCTATGT GACATCAATA 181 CGTTCATTTC TTCCTAGCAC TTAGAACTGT TTCTTGTTGA TACATTTGCT GGCTTCTTCC 241 CTGTCTCACC CCTTTTCCTA CCAGAATGCC AGTCCCAGAG GCCCTTGTCA GTGTTCATGC 301 CTACATCCCT AGTACCTAGC ATGGTACCTG CAGGTGGCCC ATAATCATGA GTTATTCAGT 361 AAGTTAAAGG ATTGCAGGAG GGAAGGAAGG ACGGAAGGAA GGAAGGAAGG AAGGAAGGAA 421 GGAAGGAAGG AAGGAAGGAA GGAAGGCAGG CAGGCAGGCA GGCAGGCAGG CAAGGCCAAG 481 CCATTTCTGT TTCCAAATCC ACTGGCTCCC TCCCACAGCT GGATTATGGG CCAGTAGGAA 541 TTGCCATTTT CAGGGTTTTG CTGTCACTGT AGTCAGGACC ATGAAGTCTT TAGGCACCTC 601 CACTCCACAC ACCCCCTGGT GAGAGCTCCC ATCTCCCTGT TCTGAAACAG CTCCCCAATA
661 TAGTACTGAT TCCGGTTAAA CTTGAACCCC TGCCCCTGCC CCTGCCCCTG ATTTACATGA 721 GGACACTGAG GCCCAGAGGG GTAAAGTGAC TGCCAGGGGT CACACAGCTA GAAAGTGGCG 781 GTGCCAGAAC TGGAAGGAGG CCCTCATTCC TGAGTCACGG CTTTTCCATA GCACAGCCTT CG locations, methylation status and restricting enzymes: 9: McrBC (half site) 57: McrBC (half site) 144: 181: HpyCH4IV TscI McrBC (half site) 392: McrBC (half site) 673: HpaII Nt.CviPII 779: McrBC (half site) 818: BceAI McrBC (half site) --------------------------------------------------------------------------- --------- Sequence 19: D19S433 Amplicon length = 780 bps 1 ATGAAACTGG ACACAGAAAC CAGACCCCAG AGCACATACC GTATGAGTCC ATTGGTATGA 61 AGTTTAAAAA CAGATGGCAC TAGTCCAAAG GATTGGAAGT TGGAATAGTG GTTACCAGGA 121 CTGGGGGGAG GAAGGGATGG TGGATGGTGA ACAAAAGGAC CTTGGAGGGC TCCTGGGGTT 181 CTAGGAATCA ATCTTCCTTC TTTCCTTCCT TCCTTCCTTC CTCTTTCTCT CTTTCTTTCT 241 GTTTTTATTT CAATAGGTTT TTAAGGAACA GGTGGTGTTG GTTACATGAA TAAGTTCTTT 301 AGCAGTGATT TCTGATATTT TGGTGCACCC ATTACCCGAA TAAAAATCTT CTCTCTTTCT 361 TCCTCTCTCC TTCCTTCCTT CCTTCCTTCC TTCCTTCCTT CCTTCCTTCC TTCCTTCCTA 421 CCTTCTTTCC TTCAACAGAA TCTTATTCTG TTGCCCAGGC TGGAGTGCAG TGGTACAATT 481 ATAGCTTTTT GCAGCCTCAA CCTCCTGGGC TCAAGTGATC TTCCTGCCCC AGCCTCCTGA 541 GTAGCCAGGA CTACAGGAAT GTGCCAACAT GCCTGGCTAA TTTTAAAAAA TTTTTTATAG 601 AGAAGAGGTC TCACTATGTT GCCCAGACTA GACTTGAACT CCTTCCCTCA AGTGATCTTT 661 CTGCATCAGT CTTCCAAAGT GCTGGGATTG CAGGCATGAG CCACCTCACC CAGCCTTAGA 721 AATGTTCTGT TTCTTGACCT GAGAGCTGGA TATACAGGAT TGCTCACTTT GTGAAAATTC CG locations, methylation status and restricting enzymes: 40: Nt.CviPII 337: Nt.CviPII --------------------------------------------------------------------------- --------- Sequence 20: ACTBP2SE33 Amplicon length = 887 bps 1 GTACTTCAGA GTCAGGATGC CTCTCTTGCT CTGGGCCTCC TTGCCCACAT AGGAGTCCTT 61 CTGACCCATG CCCACCATCA CTCCCTGGTG CCTAGGGTGC CCCACAATGG AGGGGAAGAC 121 GGCCTGGGGA GCCTTGCGCA TGCTGGAGCA GTTGTCGACG ACGACGAGCG CGGTGATAGC 181 ATCATCCATG GTGAGCTGGC GGCGGGTGCG GACGCAAGGC GCAGCGGCAA GGACAAGGTT 241 CTGTGCTCGC TGGGCTGACG CGGTCTCCGC GGTGTAAGGA GGTTTATATA TATTTCTACA 301 ACATCTCCCC TACCGCTATA GTAACTTGCT CTTTCTTTCC TTCCTTTCTT TCTTTCTTTC 361 TTTCTTTCTT TCTTTCTTTC TTTCTTTCTT TCTTTCTTTC TTTCTTTTTC TTTCTTTCTT 421 TCTTTCTTTC TTTCTTTCTT TCTTTCTCTT TCTTTCTTTC TCTTTCTTTC TTTTTCTTTC 481 TTTTTCTTCC TTCCTTCCTT TCTCTCTCTC TCTCTTTCTT TCTTTCTAAC TCTCTTTGTC 541 TCTTTCTTTC TTTCTTTTGA CGGAGTTTCA CTCTTGTCGC CCAGATTGGA GTGCAATGGC 601 ATGACCTCGG CTCACTGTAG CCTCCACCTC CCAGGTTCAA GCGATTATCC TGCCTCAGCC 661 TCCCTAGGAG CTGGAATTAC AGACGTGCAC CACCAAGCCT GGCTAATTTT TGTATTATTA 721 GTAGAGACGG GGTTTCACCT TGTTGGCCAG GCTGGTCTCG AACTCCTGAC CTCAGGTGAC 781 CCACCTGCCT TAGGCTCCCA AAGTCCTGGG ATTATAGGCA TGAGCCACAG TGCCCAGCCT 841 TCTTTTCATT TAATACTATA GTAGTGTGAT CCTCTCTACC TATTACA CG locations, methylation status and restricting enzymes: 120: BceAI McrBC (half site) 137: FspI HhaI HinPlI McrBC (half site) 156: AccI HincII HincII Hpy166ii Hpy99I SalI SalI-HF 159: AccI HincII Hincli Hpy166ii Hpy99I SalI SalI-HF McrBC(halfsite) 162: Hpy99I McrBC (half site) 165: Hpy99I McrBC (half site) 169: BstUI HhaI HinPlI McrBC (half site) 171: BstUI HhaI HinPlI MwoI 200: Cac8I Fnu4HI MwoI McrBC (half site) 203: Fnu4HI MwoI McrEC (half site) 209: MwoI McrBC (half site) 213: HgaI McrBC (half site) 220: HhaI HinPlI McrBC (half site) 225: Fnu4HI MspAlI TseI McrBC (half site) 248: Cac8I MwoI 259: BstUI HgaI McrBC (half site) 261: BstUI HgaI MwoI 268: AciI BstUI MspAlI MwoI Nt.BsmAI Nt.CviPII SacII 270: AciI BstUI MspAlI MwoI SacII McrBC (half site) 314: AciI Nt.CviPII 561: McrBC (half site) 578: 608: 642: BcgI McrBC (half site) 684: HpyCH4IV TscI McrBC (half site) 728: McrBC (half site) 759: BsaI BsmAI Hpy188iii Nt.BsmAI --------------------------------------------------------------------------- --------- Sequence 21: D10S1248 Amplicon length = 720 bps 1 TTCTGTTTTG CGGTGGTTCC TAGTATGGTA CCTGGCCAAG GGCACACTAG ATCTTTGTCA 61 AGGTAATGAC TACTTTTTAT TAAATGCTTT CCATGTATCA AGTTCTGTGC CAAGCACTTG 121 ACATATATCA TTTTATTTTA TCCCGTGAAG TAGTTATTGG TATCTTCATT TACAAATAAA 181 AAAACAAGCT TAGTACTTAA CTCACTGCCT TGAACATAAT TATTGCTTTA AAGGTAGCTA 241 GGATTCTTAA TAGCTATTAT TACCAAAGCA TGAACAATCA GTAAAAAGCA AACCTGAGCA 301 TTAGCCCCAG GACCAATCTG GTCACAAACA TATTAATGAA TTGAACAAAT GAGTGAGTGG 361 AAGGAAGGAA GGAAGGAAGG AAGGAAGGAA GGAAGGAAGG AAGGAAGGAA ATGAAGACAA 421 TACAACCAGA GTTGTTCCTT TAATAACAAG ACAAGGGAAA AAGAGAACTG TCAGAATAAG 481 TGTTAATTAT AATATCCAGG GGTGGGATAC AGAGGTTTTA GCATCTGCTC TTTGCCAAGC 541 ACTGCACTTA TTCCTGAGGA ATACCTGAGG GAAAAAGTAT GGTTTCTCAC AGGATCTAGT 601 TGGACTGGAA ATATGACATT CATATTGGAA TCCAGTGTCT TTTTCTGAAA AAGAGAGTTC 661 GTTCCAAGCT TAGCTCACAT GCAAGCTAAG ACAACCACTA GAAATTACTC TCCCCAGGGC CG locations, methylation status and restricting enzymes: 11: McrBC (half site) 144: Nt.CviPII 660: --------------------------------------------------------------------------- --------- Sequence 22: D1S1656 Amplicon length = 780 bps 1 GTCATGCCTA CAGTGTAACG GGAATTGACC AGGTAGGCGA CTTGAACTCC AACTGCAGGC 61 TATGGGGAGA CATGTGACAA TGCTAATCCC TTAGGCATTT ATTCAGTGCA TTGCAGTTTA 121 AATGTCTGCC TTTCAGGCAT TTCAGAGATT ATGTCACCTA AAGAGGCAGG CTGGAATTCA 181 AAACGGCAAG CCAGGAAAGA GAGAAACCAT GTGATTCCAC CGCAGCACAA AACTCGTTTA 241 GCAGCTGTAA GCGCCTGGTC TTTGTTTATT TTTAATTTCC TTTCTTTCCC AATTCTCCTT 301 CAGTCCTGTG TTAGTCAGGA TTCTTCAGAG AAATAGAATC ACTAGGGAAC CAAATATATA 361 TACATACAAT TAAACACACA CACACCTATC TATCTATCTA TCTATCTATC TATCTATCTA 421 TCTATCTATC TATCTATCTA TCTATCTATC TACATCACAC AGTTGACCCT TGAGCAACAC 481 AGGCTTGAAC TTATATGGGG ATTTTCTTCC ATCTCTACCA CCCCTGAGAC AGCAAGACCA 541 ACTCCTCCTC CTCCTTCTCA GCCTACTCAA CATGAAGATA ATAAGGATGA AGACCTTTAC 601 AATGACCCAG TTCCACTTAA TAAATAGTAA ATGTATTTCC TCTTCCCTAT GATTTTCTTG 661 ATAACATTTC TTTTCTCTGG CTTATTTATT GTAAGAATAC AGTATATAAT ATAAATAATT 721 ATAAAACATG TTAATTGGTT CTTTACGTTA TCGATAAGAC TTCTGGTCAA TGGTAGGCTA CG locations, methylation status and restricting enzymes: 19: McrBC (half site) 38: McrBC (half site) 184: BceAI McrBC (half site) 221: AciI Nt.CviPII 235: 252: HaeII HhaI HinPlI MwoI McrBC- (half site) 746: HpyCH4IV TscI McrBC (half site) 752: BspDI ClaI --------------------------------------------------------------------------- --------- Sequence 23: D22S1045 Amplicon length = 780 bps 1 GAGCCCAAGT TTAAACCCAG GCCCTCTGTG TCCCCCTACA GGGTGACTGC ATCTCCGAGT 61 CCTGGCTTGT CATGCCTGAC AGAGGGCTGC CGAGTGAGCA GCTTAAGGCA TCCTGCCACT 121 GTGCAGCTGC CAACCCTACA GCCCGGCAGC CCTGCGGGAG GAAGCTCTAG TGCAGGCCTC 181 TTAGGATCTG GGGTCCAGGA TGCTGATTTC AGGGCCGGGA CCTTGGGCAC CGTCCCTCTG 241 GTCTGCATAA GACCCACTAT GGGCAAACCT TAAACCTGAT CGTTGGAATT CCCCAAACTG 301 GCCAGTTCCT CTCCACCCTA TAGACCCTGT CCTAGCCTTC TTATAGCTGC TATGGGGGCT 361 AGATTTTCCC CGATGATAGT AGTCTCATTA TTATTATTAT TATTATTATT ATTATTATTA 421 TTATTATTAC TATTATTGTT ATAAAAATAT TGCCAATCAT ACATTCGCGT GATCACTCAC 481 ACTGTGCCGG GCACTCTTGA GAGCACTTTA CATATATTGT CTCATTTAAT TCTCTCAACT 541 TGGGCACAGG CACTGTCACT ATTTCCATTC TACAGCTGAG GAGACTGAAG CACAGAGAGC 601 CTTAGGGACT TGCCTGAGGT CACACAGCTA AGAAATGGTG GAGCCAGGAT CAGAAACCAG 661 GCCACCTACA GAGCTCCCTG CAAGGGGAAC AGCATCCGGT TCCAGAGGCT GTGATTTTAT 721 CAGCTACACT GTGTGACTCC ATCTTCACAC TCTCCTGCCC CTCAAGAAGA CATATAACCT CG locations, methylation status and restricting enzymes: 56: BslI Nt.CviPII 91: MwoI Nt.CviPII 144: BssKI HpaII Nt.CviPII ScrFI 155: BslI McrBC (half site) 216: BssKI HpaII Nt.CviPII Sau96I ScrFI 231: BanI NlaIV Nt.CviPII 281: BfuCI DpnI Sau3AI 371: Nt.CviPII 466: BstUI 468: BstUI McrBC (half site) 488: BssKI HpaII Nt.CviPII ScrFI 697: HpaII Nt.CviPII --------------------------------------------------------------------------- --------- Sequence 24: D2S441 Amplicon length = 780 bps 1 ATGAAGAGAT GGTCAGGCGA GGTATGGGGG AAGGGGCGTG GAGCTTCCAT GTCCTCCCTG 61 GGCGCCACCC TCCAGGAACC TCCACGTGTT CAGCTATACA GAAGCTTCCT GAACCCAGTC 121 CTCTTGGGGT TTGAGGGAAG CTTCATGACA TCAGCATTCC TTCCTCCAGG GTATTAATGG 181 GACCCTCTCT GAAGAGATTC TTAAGACCCA CGGCCAGAAA GTTGGGTAAA GACTAGAGTC 241 CTGCCTTGGG GCAGGTGAAA GGAGTGCAAG AGAAGGTAAG AGAGATTCTG TTCCTGAGCC 301 CTAATGCACC CAACATTCTA ACAAAAGGCT GTAACAAGGG CTACAGGAAT CATGAGCCAG
361 GAACTGTGGC TCATCTATGA AAACTTCTAT CTATCTATCT ATCTATCTAT CTATCTATCT 421 ATCTATCTAT CTATATCATA ACACCACAGC CACTTAGCTC CAATTTAAAA GATTAATCAT 481 AAACATTTGG GAAGGAGAGT GAAGATTTTT GTGATGTTAA ATAAGAATGA TTATACTAAA 541 AACCAAAATA ATATGTTATT TATGGCTGGG TGTGGTGGCT TAAGCCTGTA ATCCCAGAAC 601 TTTGGGAGGC CAAGGCTTGT GGATCACTTG AGCCCAGAAG TTCAAGACCA GCCTGGGCAA 661 CATAGGGAGA CCCTGTCTCT ACAAAAAATT TTAAAATTAG CTGGACATGA TGGCACGCAC 721 CCGTAGTCTC AGCTACTCAG GAGGCTCACG CCACTGCATT CCAGTCTGGG TAACGCACAC CG locations, methylation status and restricting enzymes: 18: McrBC (half site) 37: McrBC (half site) 63: BanI BbeI BsaHI HaeII HhaI HinPlI KasI NarI NlaIV SfoI McrBC (half site) 85: BsaAI HpyCH4IV PmlI TscI McrBC (half site) 211: BceAI EaeI McrBC (half site) 716: Cac8I McrBC (half site) 722: Nt.CviPII 749: McrBC (half site) 774: McrBC (half site) --------------------------------------------------------------------------- --------- Sequence 25: D12S391 Amplicon length = 780 bps 1 GTCAGGAGTT CGAGACCAGC CTGGCCAACA TGGCGAAACC CTGTCTCTAC TAAAAATACA 61 AAAAAATTAG CTGGGCATGG TGGTGTGTTC CTGTAACCCC AGCTACTCAG GAGGCTGAGG 121 CAAGAGAATC GCTGGAACCC AGGAGGTGGA AGTTGCAGTG AGCTGAGATT GCACCACTGC 181 ACTCCAGTGT GGGCAACAGA GCGAGACTCT GTCTCAGAAA AAAAAAAGAA TACATGAAAT 241 CAGAGAAACT CAAATTGTGA TAGTAGTTTC TTCTGGTGAA GGAAGAAAAG AGAATGATAT 301 CAGGGAAGAT GAAAAAAGAG ACTGTATTAG TAAGGCTTCT CCAGAGAGAA AGAATCAACA 361 GGATCAATGG ATGCATAGGT AGATAGATAG ATAGATAGAT AGATAGATAG ATAGATAGAT 421 AGATAGACAG ACAGACAGAC AGACAGACAG ACAGATGAGA GGGGATTTAT TAGAGGAATT 481 AGCTCAAGTG ATATGGAGGC TGAAAAATCT CATGACAGTC CATCTGCAAG CTGGAGACCC 541 AGGGACACTA GGAGCATGGC TCAGTCCAGG TCTAAAAGCC AAAAAACCAG GGAAACTGAT 601 GGTGTAATTA TCCATCCCAG GTGGAAGGCC TGAGAACCTG GAGTGCCCCT GGTATAAGTC 661 CCAGAGTACA AAGACAGGAG AGCCTGGAGT TCTGACTTCC AAGGGCAGAA GAATGTGTCG 721 CAGCTCCAGG AGAGAGAGAG AAAGAATTTC TTTCCTCCGC CTTTTGATTC TATCTGGGGG CG locations, methylation status and restricting enzymes: 11: Hpy188iii 34: BglI MwoI McrBC (half site) 130: HinfI TfiI 202: McrBC (half site) 719: 758: AciI Nt.CviPII --------------------------------------------------------------------------- --------- Sequence 26: ADD6 (from ncbi accession NT 022135) 16664701 cttgaacctg agaggcagag gttgcagtga gccgagacca tgccattgca ctccagcctg 16664761 ggcaatagag taaaactcca tcctcccgct ccaaaaaagt agacaacgtc catgaggtga 16664821 tgaggaaggg gttatcgtgt gttgcttgct gagaacagga cccccagact caccgtgtcg 16664881 acgccggcca gcagcatctc agtcacgttg gcgtagatct cctgcagcgt cagagcctgg 16664941 ctaaggaaga ggtatgtgag aagtcccccg ctcaccctcc ggcctcggtc catttggtac 16665001 tgtatgtccc tcaacttgtt gtcaacatga atttggcctg tttgaaaaca gtatttcttt 16665061 tgaaaggagt ttgggttgag aatcatcttt tcagtctcaa agccctctgt cctcccagta 16665121 gcttaactaa accagtggca ggtgacagag ggtaaggaaa cccaatttat ctaacgtcaa 16665181 cctgggagtt tcactcatac acttgcttat gtaaatgaat gaaaagttaa aagacaagct Sequence 27: ADD10 (from chromosome 17:3477839-3478292) 1 AGAGAGCCCA GGAGACAGGC AGAAAGGAAG GCATGTGACC GGATCACAAT CATCAGCTCT 61 CTGCTGTCCT CTTTGGGAAG GGTTTTAGTA TTAAAAGGAC ATTTATTCTC ATTAATGCAA 121 AATTAAGGAG TTTTAAAAGC TTTTACAACC TAGACTCCCT CTGAGAGGTT AGCCTTGACA 181 CCCTAATCGC CTTCTGCTCC CGCCACTGCT CGGTGCCAAG CAGCTCCCAC GGCCCCGGCG 241 GGTCTGATGA TAGCCGGACA GGAGGGAGGA AGGGGAGGAG GAAGAGCCTG CATCAGCTCC 301 TACGATTGCC CAGCCCCATC CTGGGAGTGA TTAAACGGTG CATCACCAAA TGCCAGTCCC 361 ACTGACAGGC AGGTCACCGT GCACTTCAGG GCACTCTAAA TTGCCGACTC TCCATGTAGA 421 GAGGGATGAA TCCAATATTG AAATCCTCAT AACTACAGCC CCCCAAAGTA GCCGTCCATC 481 TTCTGCTTAA AATGTTGATC TGTAGTAAAA TGTTGATTTT GTTGAAGCTG AGTGATG Sequence 28: ADD17 (from chromosome 1: 50149332-50149574) 1 TTGAACCTAG GAGATGGAGG TTGCAGTGAG CTGCGATCAT GCCACTTCCC TCCAGGCTGG 61 GCAACAGAGC GAGACTCCAT CTCAAAAAAA CAAAAAAGAA AACCAACCTT TTGAATGTAG 121 GGGAAACTTT TCAAAGGATA TCTAGTTTTC AATTACAGTA AACTTGTGGA AGGGAGGTTC 181 AGAGTTGAGA TTGAGATTAT AGATTTTGCT GATGATAAAC CATGAGTTCC AGAGGACATA 241 GTAGACTATT CTGGGCAGTT ATACAGGGGT GGATGGAATG TGGGAGTGGG GTTGTATAGT 301 GCCATAAAGA AATGAGAGTC CGGATTAAAA ATAATGAGCT GGACTCGCGA GCCTTTTGTA 361 ACTGAAATAA ATAGAAAAAT AAGAAATACA TTATTTCTGT GATTGTTGAG AGGAAGAAAT 421 GGTGGAAATC TTGTGAGAAG CACACTGAGC TCTAGCACCA CCTCTTCACT CCTACAGATG 481 GTGGAATAAA CGGCAGGCAA GTTCAAAATC ACATATAGTC ATTATTGCAA GATAGTTCTA 541 TGGATATAGA TACTACATAC AATATAAATC ATGCTCATTG AATGGTTCAG TGGAAACTAC 601 TCTGAACTT Sequence 29: Hypo23(from ncbi accession NM_004907) 123161 GAGTTTGGGA AGGGTATTTT AGGGGGGAAT AACTTTTGAG TTCCCAGCGT GCGGGGGAAG 123221 GGCGGGACGG GAGGGTGTCC CAAGGCCTGA GAAGATCAGT GTGGGGCAGG GGTCAGGAAT 123281 AACCTGGGAG GGGGCCTTGT ATGGGGGAAA TAATTGGGAA GAGGAGAGAT GGGATGAAGG 123341 GGGCCTCAGC GGGTCGTCTC CTGTGTATGC AGGGTCGTTC TGCAGCGTCT CTGGGAGATG 123401 GCGTCCCTGG GAGCCCTCAG GTCGCCCCTA CCCGCTGCGG GGTGCTTTCC TGGCGTCACG 123461 CCTTCCTGGC CCCTGGAGGG AAGGAAGTGA AACTCTCCTC TTCCCCCACC CGGCTGGAAT 123521 GCGAGTCAGG AAGCCTGGGG CTCCAGCCTG CTCCGGCTGC CCGGGTCGGG GATGGGGAGG 123581 GGCGTGGCCG GAGCGCAAAG CCCCGCCCCT CCGCGCCCCC CCCCCGGAAG CCCCGCCGCC 123641 GGCCGCTAAG GCGATCACGG GCCCTGTCCT AATATGGGCA ACCGGAAGCG GCCCGCGCGA 123701 CTGCCCTACG TCACTCCGTC CAAATTTAGT TGTGGAAGTC AGCGGGCGCT GGTGGCGGGA 123761 AGGCGCCGCG AGCCAGTGCG GGCGGAAAGG GGGCGGGGGG CGCACCACCC CTTAAAGGGC 123821 CCGCACCAGG AATGAATGGA GCCATTCGAA CAATTCTGCA TCCTATTTTT GGAGGAAGTG 123881 GAATTAGTAT TT Sequence 30: Hypo28 (from chromosome 5: 85949232-85949719) 949232 TTTATTTTTA AAAAAGAAAG AAAGAAGAGA AAAGGGATGG GTTTATTGTC CTTTTCAACA 949292 GACTAGAGTA TACGGGGTGA AACTGCTTCA CTTGATTCAA TAAAATCGTT TCCGGTAACA 949352 GGCCCCAGGA ATCCTAGACC TAAGCCTGGC GCGAAACTAC ATTTCCCACA ATCCTTCGGG 949412 GGCTGATAAG GCTCCGCAAT GGTCTGAACT ACAATTCCCA CAATCCAGGG CGATTTCCGC 949472 TTTGTCGCGT TTCCTCAAGG CTCCGCCCCA TTTCCCATCT TTCTTTTCAG TCCTTGCGCA 949532 CCGGGGAACA AGGTCGTGAA AAAAAAGGTC TTGGTGAGGT GCCGCCATTT CATCTGTCCT 949592 CATTCTCTGC GCCTTTCGCA GAGCTTCCAG CAGCGGTATG TTGGGCCAGA GCATCCGGAG 949652 GTTCACAACC TCTGTGGTCC GTAGGAGCCA CTATGAGGAG GGCCCTGGGA AGGTTAGTGT 949712 GTAAGGGG Sequence 31: Hypo33 (from chromosome 6: 34211067-34211314) 211067 ACCCTCATTT CACATTTCAC CCCTTCCTCA AAATGCTCCC TTCATATTAC CTCCTCAGAA 211127 ACCAAGAATA TGGCTACTAA TTCTCCCTGG CCCCATGCTG CAGGTGAACC GGTAGCCCAG 211187 AGGTATCACA TAATTCTCCC AAAGTCACAC AGCAAATCAA GATGCATCCA GGACTAGAAG 211247 CCATGTCAGC CACACTGGGA AGCCCCAGCG AAGCTGACAG AAAGTTTCAT AATACCACCC 211307 TCTCCCCT Sequence 32: OCA2 sequence: (from chromosome 15: 25276967-25277446) 6967 aaacacccca gtctgaaaat aaccatagtt tgttgctctt acgagtgaaa atgctatttc 7027 atacacgaag ctttgtcctt cagcacccaa gatttaagga taattatgga tgaatattat 7087 ggattcattt taaatccttt ggcaaatctg ctctgggggc ttctctgtca gaaggtctct 7147 ccttcccaac tctaagaaac gttattccta tgcaaatgct gctgagtcaa gacggggagg 7207 gaagtgcaga gagaagggct ggtggcatgg tcagtaagtc atgagggtga gattaggggt 7267 gacacactgc ttgccaacgt aggagaaggc tctgccctca cctagcaggt ctgatggaag 7327 ccccttattc cgtccttcct gccgggttcc accgagatcc aaaaaggaat gctgtgtagg 7387 agcacatgat atgtgataaa tgagagaaag gtcaaacatt taaggaacgc ccagagaaag
Sequence CWU
1
1
381889DNAHomo sapiens 1ctcttctcat tccacaagct ctccccaaaa gaccccattc
ctccccacct tcaaccatct 60ctggcaggga ggagggggaa ctgagaggct actttctgac
ccaggaccct aagcctgtgt 120acggagagag catgagctgg gtgagctgct tgccaaggag
tggcatctgc cctcatcagt 180ggacacaaaa agccccaggg gttaagtggc catggctgcc
ctcatggctg caccgggagg 240atgactgtgt tcccactctc agtcctgccg aggtgcctga
cagccctgca cccaggagct 300ggggggtcta agagcttgta aaaagtgtac aagtgccaga
tgctcgttgt gcacaaatct 360aaatgcagaa aagcactgaa agaagaatcc agaaaaccac
agttcccatt tttatatggg 420agcaaacaaa ggcagatccc aagctcttcc tcttccctag
atcaatacag acagacagac 480aggtggatag atagatagat agatagatag atagatagat
agatagatat cattgaaaga 540caaaacagag atggatgata gatacatgct tacagatgca
cacacaaacg ctaaatggta 600taaaaatgga atcactctgt aggctgtttt accacctact
ttactaaatt aatgagttat 660tgagtataat ttaattttat atactaattt gaaactgtgt
cattaggttt ttaagtctat 720ggcatcactt tcgcttgtat ttttctattg atttcttttc
ttttcttttc ttttttgaga 780cagagtctca ctctcaccca ggctggagta ccgtggcacg
atcttggctc attgcaacca 840ccacctcccg ggctcaagtg attatcctgc ctcagcctcc
caaatagct 8892843DNAHomo sapiens 2atatgctaac tggatgtgaa
caattgtgtt ctaatgagct taatatgagt ttcataattt 60gtgcattttg ctgttaaaaa
gccagaaaac aaaacaaaac aaaatactga aaccagtgtg 120aacaagagtt acacgatgga
aggcatcagt tttcacacca gaaggaataa aaacaggcaa 180aaataccata agttgatcct
caaaatatga ttgattttaa gccttatgag ataattgtga 240ggtcttaaaa tctgaggtat
caaaaactca gagggaatat atattcttaa gaattataac 300gattccacat ttatcctcat
tgacagaatt gcaccaaata ttggtaatta aatgtttact 360atagactatt tagtgagatt
aaaaaaaact atcaatctgt ctatctatct atctatctat 420ctatctatct atctatctat
ctatctatct atcgttagtt cgttctaaac tatgacaagt 480gttctatcat accctttata
tatattaacc ttaaaataac tccatagtca gcctgaccaa 540catggtgaaa ccccgtctct
aaaaaaaata caaaaattag ctggatgcag tagcacatgc 600ctgtagtccc agctactcag
gaggctgggg caggagaacc acttgaccca agaagcggag 660gttgcagtga gccgagatcg
caccactgca ctccagcctg ggtgacagag tgagactcca 720tctcaagata aagaaataaa
taaaaacaaa caaacaaaaa aattccatag ggggtcaggt 780gcggtggctc atgcctgtaa
tcccagcact ttgggaggcc gaagcaggtg gatcacttga 840ggt
8433792DNAHomo sapiens
3aatatgaatt caatgtatac agagagagag agagagagag agagagagag agacttctac
60agagctctaa gcataattgt gtaactccaa gctcacagtg cctaagacca gtaccaggct
120gactcattgg aaagctgcca tagtaagact cttctgttca ctgcattatt tattgatgta
180ttgcaagcac ttagttacat ttctagcata taacacatga tcaataaata ttttgacatg
240aacaaatggt aattctgcct acagccaatg tgaatattgg gatgggttgc tggacatggt
300atcacagaag tctgggatgt ggaggagagt tcatttcttt agtgggcatc cgtgactctc
360tggactctga cccatctaac gcctatctgt atttacaaat acattatcta tctatctatc
420tatctatcta tctatctatc tatctatcaa tcaatcatct atctatcttt ctgtctgtct
480ttttgggctg cctatggctc aacccaagtt gaaggaggag atttgaccaa caattcaagc
540tctctgaata tgttttgaaa ataatgtata ttaatgaatg tacaaatttc cccacttgta
600ctttcagact gttatctgtg agttaaaact cctccactct ttttcctacc caaataatag
660catacttttt tctgagtata ttttgggaag aagagttatt cagttattgt tatattttaa
720aaaattcctt ataccaaact ctacttgatc taaggctatt cattgaaact ttcagcatgc
780ttaatagcag tc
7924735DNAHomo sapiens 4ccctctgtgt agcctggcta tgtgccacat tgtgaggttc
tctccctcta gctacttctt 60ccagtttcct ctttcaggat cccaattcct ttctcaaagc
actggtgaat aactccaaat 120actccatcat ttcattatac agagtaatat aagtcttctt
tttctaaacc tctcccatct 180ggatagtgga cctcatattt cagatgctaa taggctgttg
aggtagtttc ctaagcaaaa 240aagtaattgt ctctctcaga ggaatgcttt agtgcttttt
agccaagtga ttccaatcat 300agccacagtt tacaacattt gtatctttat ctgtatcctt
atttatacct ctatctatct 360atctatctat ctatctatct atctatctat ctatcttcaa
aatattacat aaggatacca 420aagaggaaaa tcacccttgt cacatacttg ctattaaaat
atacttttat tagtacagat 480tatctgggac accactttaa ttagaagctt taaaagcata
tgcatgtctc agtatttaat 540tttaaaatta ttacataatt atatactcct ttgaattaga
aaattacaaa tgtggctatg 600tattattttc tcccatgtat tttcaaaatg agggggtaag
ccagaccctc tccctctccc 660atgcctaata gctcaaagtt aaaggtaaag aaacaagaaa
atatggtgaa agttaaccag 720cttcacttca gagga
7355949DNAHomo sapiens 5attcaacaca tgaggcacgg
ccagacctaa atgtctcaga gcctgctccc actccgatga 60gctgctgcct tgcttcaggg
tctgagtcca gtgactgcca ctgcctgcac ccaatcacca 120tagccagaga cctggaggtc
atccttatct cctttctctt cctcatccct gcatctcaga 180ctcttccaca caccactggc
catcttcagc ccattctcca gcctccaggt tcccacccaa 240cccacatggt gccagactga
gccttctcag atactatctc ctggtgcaca cttggacagc 300atttcctgtg tcagaccctg
ttctaagtac ttcctatcta tctatctatc tatctatcta 360tctatctatc tatctatcta
tctatctaat ctatctatct tctatctatg aaggcagtta 420ctgttaatat cttcatttta
caggtaggaa aactgagaca cagggtggtt agcaacctgc 480tagtccttgg cagactcagg
ttggaacact gccctggagt gtgtgctcct gaccaccacg 540aagtgcctcc tctgtacaat
ctgaccccat cactctcctc tttacaatga cctcccaata 600ggttaagatg cagttattct
ttctcacttt aagacacctt tacctccggc ttctgccacc 660tcctctgctc ccctgtggcc
actcctcaca ccactccaca tcccagctgt tgtcaagttc 720tttcagtgtt ccaaatgatc
tatgttctct ttgcctttga gccttgcata tgttcctccc 780tctgccagaa gcgctgttcc
ccttcctttc ccacccttct gcccggccaa ctcaccttca 840ttcttcccat cccagtttag
aggccacctt ctcgaagcct gggttggggg gactcttcag 900tgttcccagg acaccttgtg
cttcccccat aatcactggg tgatcattg 9496832DNAHomo sapiens
6cccagcacac accttgcctc tggctgggac cccctttgct gctggccctg ctcaggcccc
60acagcttgat ctcctcatgt tcccactgct gacttcccca agctaactgt gccacagagt
120gggggacccc ctcccggctc tcacaacccc caccttcctc tgcttcactt ttcaccaact
180gaaatatggc caaaggcaaa aacccatgtt cccactggcc tgtgggtccc cccatagatc
240gtaagcccag gaggaagggc tgtgtttcag ggctgtgatc actagcaccc agaaccgtcg
300actggcacag aacaggcact tagggaaccc tcactgaatg aatgaatgaa tgaatgaatg
360aatgaatgtt tgggcaaata aacgctgaca aggacagaag ggcctagcgg gaagggaaca
420ggagtaagac cagcgcacag cccgacttgt gttcagaaga cctgggattg gacctgagga
480gttcaatttt ggatgaatct cttaattaac ctgtggggtt cccagttcct cccctgagcg
540cccaggacag tagagtcaac ctcacgtttg agcgttgggg acgcaaacac gagagtgctt
600ggtgtgagca cacaggagga gtcacgacag agcagtgtaa gagccgccac gtgggtccca
660cacaggggga gtcacgacac agcagtgtaa gagccgccac gagggtccca cacaggggga
720gtcgcgacac agcagtgtaa gagccgccac gagggtccca cacaggggga gtcacgacac
780agcagtgtaa gagccgccac gagggtccca cacaggggga gtcacgacac ag
8327766DNAHomo sapiens 7ttacccttgg ggtgggggtg taggatgcag ctggggctgc
agttccaggc cacggagagc 60ctgtgaggct gggccccggg gcgccctggg gaggggatgc
ctgatgggga gcctggtggg 120ggagggtagg ggagggcggg ggaggacggg ggagggcgcc
ctgtgtccct gagaaggtac 180ctggaaatga cactgctaca actcacacca catttcaatc
aaggtccata aataaaaacc 240cattttaaat gtgccaggga gcccaaggtt ctgagtgccc
aaggaggcac cgaagacccc 300tcctgtgggc tgaaaagctc ccgattatcc agcctggccc
acacagtccc ctgtacacag 360ggcttccgag tgcaggtcac agggaacaca gactccatgg
tgaatgaatg aatgaatgaa 420tgaatgaatg agggaaataa gggaggaaca ggccaatggg
aatcacccca gagcccagat 480accctttgaa ttttgccccc tatttgccca ggacccccca
ccatgagctg ctgctagagc 540ctgggaaggg ccttggggct gcctccccaa gcaggcaggc
tggttggggt gctgactagg 600gcagctgggg cagagggagg caggggcagg tgggagtagg
gtgggggctg ggtgcagcag 660ccggggacct ctggccatct tggatttttt ggatggattt
gtttccacat tccgatcgtt 720aagattcaag atgaaacaag acacagagac ccacacgacc
cccgag 7668751DNAHomo sapiens 8agatgataga tacatatgtt
agacagagat aggatagatg atagatacat aggttagata 60gagataggat agattataaa
tagatacaca ggttagatag attagacaga cagatagata 120catacataga tataggatag
ataactagat acaatagaga tagatagata gatagataga 180tgatagagga tagatgataa
atagatatat agcttagata gagataggat agatgataga 240tacataggat agatagagac
aggatagatg ataaatagat acataggtta gatagagata 300ggacagatga taaatacata
ggatggatgg atagatggat agatagatag atagatagat 360agatagatag atagatagat
agacagacag acagacagac agatagatca atccaagtca 420catactgatt attcttatca
tccactaggg ctttcacatc tcagccaagt caacttggat 480cctctagacc tgtttcttct
tctggaaggt gggaactcta ccttatagga tcagtctgag 540gagttcacaa aataataagg
gcaaagtgcc cggcacattg taggagacta gtaatgtcta 600taaaatgagg ggcttgaagt
aaatgatccc tctagttctc tctactgcta acattctaag 660acctccttta cattaattgt
tctcaagcca catctccctc ccctacagga cttctattta 720tttctgatca atttcatgag
tacaaataag t 7519945DNAHomo sapiens
9actgaacatt tgcttttgaa atttactatc tatgtaccgt tggaaaattt acttaatatc
60tctgaatttt ttttcttcaa ctgtggagtg aggaaaataa tacctacttt taggtagatg
120atggatataa cacttttctc tgcatatagt agacactcag tgcataacta tcgccttcct
180tttccctcta ctcagaaaca aggacatctg ggaccacagc cacatactta cctccagtcg
240tttcatatca accaactgag ctctaacatt tttctgcaga agctggatat gctgtacttt
300ttctatgact ttgcgcttca ggacttcaat tctgcttctc agatcctctg acactcggtt
360gtaggtatta tcacggtctg aaatcgaaaa tatggttatt gaagtagctg ctgagtgatt
420tgtctgtaat tgccagcaaa aaagaaagga agaaaggaag gaaggagaaa gaaagaaaga
480aagaaagaaa gaaagaaaga aagaaagaaa gaaagaaaga aagagaaaaa agaaagaaag
540aaactagctt gtaaatatgc ctaattttat tttggttaca gtttaatctg tgagttcaaa
600acctatgggg catttgactt ttggataatg ttatgccctg cagccttcca tgaatgccag
660ttaagatgtc ctaatagcaa ttagtaatcc caaagaaata tagaagaaga actttctttg
720gaattttaaa ggtgtaattt ggagttaaaa tagttggttt gattgcattt caattatttt
780ataacatcct taatcaaggg acttgaacat attggatttt cttactgatg agcttttctt
840tttaatctat agatttgaaa tggttcctaa gctgttttgg gtcaacagga tcactcactt
900gccagctagt gttgcatcac tgattttaaa tgtcaagtgt ttgtg
94510823DNAHomo sapiens 10gttggctggg gctcagagag aacaaaaagg cagaggaaaa
acaaatttcc cctctcactt 60ctggagatgg aacacttttc ttctgctttt ggacatcaga
aatccaagtt ctctggcctt 120tggactttgg gacttgtgcc agcaccctcc tgggttccct
ggcctttggc ctcaaactga 180aggttacact atcagcttcc gttgttctaa gggcttcaga
cttggacagc cacactgcca 240gcttccctga ttcttcagct tgtagatggt ctgttatggg
acttttctca gtctccataa 300atatgtgagt caattcccca agtgaattgc cttctatcta
tctatctatc tgtctgtctg 360tctgtctgtc tgtctatcta tctatatcta tctatctatc
atctatctat ccatatctat 420ctatctatct atctatctat ctatctatct atctatctat
cgtctatcta tccagtctat 480ctacctccta ttagtctgtc tctggagaac attgactaat
acaacatctt taatatatca 540cagtttaatt tcaagttata tcataccact tcatacatta
tataaaacct tacagtgttt 600ctcccttctc agtgtttatg gctagtaatt ttttactggg
tgccagacac taatttttat 660tttgctaagt ggtgaatatt ttttatatcc ttaaaaatat
ttttgagtgt tgatctgggt 720aaagttaagt tcaatattgg aaaaatattg attcttttga
ggatagttat cttctaatta 780gtctacctgt tgccccataa atggcatgat tttccactct
gtg 82311824DNAHomo sapiens 11tactacagca agagcgcttg
aaccagatgt aggggagata gcagctggag agcataacag 60aggcactgac atgtgagcag
ctaacgaggc cttttacaag acatctgtga ccacacggcc 120aagtagaaga aagccgttaa
aagcatcaag gtagttaggt aaagctgagt ctgaagtaag 180taaaacattg ttacaggatc
cttggggtgt cgcttttctg gccagaaacc tctgtagcca 240gtggcgcctt tgcctgagtt
ttgctcaggc ccactgggct ctttctgccc acacggcctg 300gcaacttata tgtatttttg
tatttcatgt gtacattcgt atctatctgt ctatctatct 360atctatctat ctatctatct
atctatctat ctattcccca cagtgaaaat aatctacagg 420ataggtaaat aaattaaggc
atattcacgc aatgggatac gatacagtga tgaaaatgaa 480ctaattatag ctacgtgaaa
ctatactcat gaacacaatt tggtaaaaga aactggaaac 540aagaatacat acggtttttg
acagctgtac tattttacat tcccaacaac aatgcacagg 600gtttcagttt ctccacatcc
ttgtcaacat ttgttatttt ctgggttttt gataatagct 660gtgaaaggaa aataaaaact
tgggccgggc gcggtggctc acgcctgtaa tcccagcact 720ttgggaggcc aaggcgggca
gatctcaagg tcgggagatt gagaccatcc tggctaacat 780ggtgaaaacc catctctact
aaaaatacaa aaacaaaaaa ttag 82412927DNAHomo sapiens
12catgccacta agctgtacac tgaaaaacgg ttaacatgat aaattttatg ttacatacat
60tttaccacaa tttaaaaaaa ttattaaaaa atactaacaa taggccaagc gtgatggctc
120acacctgtaa tcccagcact ttgggaggct gagacaggtg gatcaattga gctcaggagt
180ttgagaccag cctgggtaac acagtgagac ccctgtctct acaaaaaaat acaaaaatta
240gttgggcatg gtggcacgtg cctgtagtct cagctacttg cagggctgag gcaggaggag
300ttcttgagcc cagaaggtta aggctgcagt gagccatgtt catgccactg cacttcactc
360tgagtgacaa attgagacct tgtctcagaa agaaagaaag aaagaaagaa agaaagaaag
420aaagaaagaa agaaagaaag aaagaaagaa agaaagaaaa agagagagga aagaaagaga
480aaaagaaaag aaatagtagc aactgttatt gtaagacatc tccacacacc agagaagtta
540attttaattt taacatgtta agaacagaga gaagccaaca tgtccacctt aggctgacgg
600tttgtttatt tgtgttgttg ctggtagtcg ggtttgttat ttttaaagta gcttatccaa
660tacttcatta acaatttcag taagttattt catctttcaa cataaatacg cacaaggatt
720tcttctggtc aagaccaaac taatattagt ccatagtagg agctaatact atcacattta
780ctaagtattc tatttgcaat ttgactgtag cccatagcct tttgtcggct aaagtgagct
840taatgctgat caggtaaatt aaaaattata gttaattaaa agggcataaa tgttacctga
900ctcaataagt catttcaatt aggtctg
92713731DNAHomo sapiens 13ctggttttgg tggaattgac tccctctgtc acaaactcag
cttcagccca taccctgagc 60catagaccta tccctctaat gcattgtact agtctcaggg
ctaataacaa gggagaggtg 120tcaaagggcc agttccacct ccaccaccag tggaaaagct
attcccaggt gaggactgca 180gctgccaggg cactgctcca gaatgggcat gctggccata
ttcacttgcc cacttctgcc 240cagggatcta tttttctgtg gtgtgtattc cctgtgcctt
tgggggcatc tcttatactc 300atgaaatcaa cagaggcttg catgtatcta tctgtctatc
tatctatcta tctatctatc 360tatctatcta tctatctatc tatctatcta tgagacaggg
tcttgctctg tcacccagat 420tggactgcag tgggggaatc atagctcact acagcctcaa
actcctgggc tcaagcagtc 480ctcctgcctc agcctcccaa gtacctggga ttataggcat
gagccaccat gtccggctaa 540tttttttttt taagagatgg ggtctcgctg tgttccccag
ccttgtctta aactcctggc 600ctcaagtgat cctcccatct cagccttcca aagtgctgag
attacagcag aggcttttaa 660gtcaaagctt tccctgctag gacaagccct agttaaagtc
ctggagcact ggccactgca 720gctgcacttg g
731141026DNAHomo sapiens 14cctactcggg aggctgaggc
aggagaatcg cttgaaccca ggagggggcg actgcagtga 60gccgagatcg tgccactgca
ctccagcctg ggtgacagag cgagactcca tctcaaaaaa 120aaaaaaaaaa aaacagaatc
ataggccagg cacagtggct aattgtacct tgggaggctg 180agacgggagg atcgagacca
tcctgggcac catagtgaga ccccatctct acaaaaaaaa 240aaaaaaattt tttttaaata
gccaggcatg gtgaggctga agtaggatca cttgagcctg 300gaaggtcgaa gctgaagtga
gccatgatca caccactaca ctccagccta ggtgacagag 360caagacacca tctcaagaaa
gaaaaaaaag aaagaaaaga aaagaaaaga aaagaaaaga 420aaagaaaaga aaagaaaaga
aaagaaaaga aaagaaaaaa cgaaggggaa aaaaagagaa 480tcataaacat aaatgtaaaa
tttctcaaaa aaatcgttat gaccataggt taggcaaata 540tttcttagat atcacaaaat
catgacctat taaaaaataa taataaagta agtttcatca 600aaacttaaaa gttctactct
tcaaaagata ccttataaag aaagtaaaaa gacacgccac 660aggctaagag aaagtacttc
taatcacata tctaaaaaag gacttgtgtc cagattaaag 720aattcttaca catcaataag
acaacccaat taaaaatggg caaaagattt gaagagatat 780ttaaccaaag aaaacatata
aatgtgtccg ggcgcgatgg taatcccagc actttgagag 840gccgaggcag gcggatcact
tgaggtcagg agtttaggac cagtctggcc aacatggtga 900aaccctgtct ctaataaaaa
tacaaaaatt agctgggtgt ggtggcgtaa gcctgtaatc 960ccagctgctc aggaggctga
ggcagaagaa ttgcttgaac ctgggaggtg gaggctgcag 1020taagcg
102615977DNAHomo sapiens
15cacatgtgga catttcttat tttctcatat tggtggtatg gctcatttat gaagttaata
60ctggacattg tggggaggct gtgtaagaag tgttaaaggg gatcagggat acattcactt
120ctcttttcct ttgctagttc tgtggtctta agcaaagtag cctcaaacat cagtttcctc
180ttttataaaa tgaggaaaat aatactcatt accttgcatg catgatataa tgattacata
240acatacatgt gtgtaaagtg cttagtatca tgattgatac atggaaagaa ttctcttatt
300tgggttatta attgagaaaa ctccttacaa ttttcttttc ttttcttttc ttttctttga
360gactgagtct tgctcagtcg cccaggctgg agtgcaatgg cgtgatctcg gctcacttca
420atctccacct cctgggttca agtgattctc ctgtttcagc ctccagagta gctgggatta
480caggtgccta ccaccacacc cagctaattt tttgtatttt agtagagacg gggtttcacc
540atgttgccca ggctggtctt gatctcctga gctcaggtaa tacacctgca tcggcctccc
600aaagtgctag gattgcaggc gtgaatcacc gcacctgtcc acaattttct tgttattggt
660accctttcat gttggtaaaa tgtattttat tttctcttat caaataattt tcaatgcaat
720gagacgtcaa ctttaagccc aaagtagacc agtagtaaaa ctaaggctga aaccattgat
780tgattattac catatattgt cctaaaatat tcggctttta aaacatttgg tttcattttt
840catgataaaa atatgtagca tttttgcact tttaattcac tttgtagagt tctcaatcat
900ttctaacaca tgcttggcaa tgacaagcca tttgtgaaag agttttgctg gctttaaaat
960atatgcaaat gtaatat
97716706DNAHomo sapiens 16aggtctcctc ttctatacag cacatttgtt caaactaaaa
acagacctca agtatattct 60gcactatata gattttttta aagtagcttc agtctccttt
aatgtgaaca attgcatact 120gacttaatct cttcctctct cttctcttcc ttcactctct
cccttcctct ctctttctat 180tctcctcccc tcctccctgt aaaagctacc acctcatcct
gggcaccctg gttatatcaa 240cttcagctat gaggtaattt ttctctttac taattttgac
cattgtttgc gttaacaatg 300ccctgggctc tgtaaagaat agtgtgttga ttctttatcc
cagatgtttc tcaagtggtc 360ctgattttac agttcctacc accagcttcc cagtttaagc
tctgatggtt ggcctcaagc 420ctgtgtcgtc ccagcagcct cccgcctggc cactctgact
cagtctgtcc tcctaaatat 480ggccgtaagc ttacccatca tgaaccacta ctcagggagg
ctccatgata gggcaaaaag 540taaactctga ccagcttggt tctaacccag ctagtaaaat
gtaaggatta ggtaagatgt 600tatttaaaac tctttccagc tcaaaaaact cctgattcta
agatagtcac actctatgtg 660tgtctcttgc ttgcctctgc tgaaatatta gtgactaagt
ggtata 70617712DNAHomo sapiens 17ttattctcca atattttgaa
atgtgaatat tacagtaatt tcccttgtcc aaatgagaaa 60accagggttc caaagagagg
aaattatttg cccaaagtta gtaattttac ctaatcttta 120cattttaccg gatgggatag
aaccaagctg gtcagtcaga gttgactttt tgccctttca 180tggaaccttc ctgagcagtg
gttcatgaat gaataaactt acagccatat ttaggaggaa 240agagtcaatc cgaatggtca
ggcaggaggg tgctggagca acacaggctt gaggccaacc 300atcagagctt aaactgggaa
gctgatggta ggaactgtaa aattgggacc acttgagaaa 360ccactttatt tgggatgaag
aatccaccca ctattcttta cagagcccag gggactgcta 420atgcaaacag tgatcaaaat
tagtaaagag aaaaattacc tcatagctga agttgatata 480accagggtgc ccaggatgag
gtggtagctt ttatagggag gaggggagga gaagagaaag 540agagaggaag ggagagtgtg
aaggaaggga agagagagta agagattaag tcaatatgca 600attgttaaca ttaagagaga
ctaaaattac ttttaaaaaa tctatatagt acagaatata 660tttgaggtct gtttttcgtt
aaaacaagtg tgctatgtag gagaggagac tt 71218840DNAHomo sapiens
18acaaggcacg gaactcacac ccagcctctc tccatacaac agaatatggg ttcttgcgga
60gctggactct gcaggagtct atctaatatg gactctgtgt caatgactcc tgggcctcct
120ctgatcaccc cattaaagtc cttcgattgc tttgagcctc aaatctatgt gacatcaata
180cgttcatttc ttcctagcac ttagaactgt ttcttgttga tacatttgct ggcttcttcc
240ctgtctcacc ccttttccta ccagaatgcc agtcccagag gcccttgtca gtgttcatgc
300ctacatccct agtacctagc atggtacctg caggtggccc ataatcatga gttattcagt
360aagttaaagg attgcaggag ggaaggaagg acggaaggaa ggaaggaagg aaggaaggaa
420ggaaggaagg aaggaaggaa ggaaggcagg caggcaggca ggcaggcagg caaggccaag
480ccatttctgt ttccaaatcc actggctccc tcccacagct ggattatggg ccagtaggaa
540ttgccatttt cagggttttg ctgtcactgt agtcaggacc atgaagtctt taggcacctc
600cactccacac accccctggt gagagctccc atctccctgt tctgaaacag ctccccaata
660tagtactgat tccggttaaa cttgaacccc tgcccctgcc cctgcccctg atttacatga
720ggacactgag gcccagaggg gtaaagtgac tgccaggggt cacacagcta gaaagtggcg
780gtgccagaac tggaaggagg ccctcattcc tgagtcacgg cttttccata gcacagcctt
84019780DNAHomo sapiens 19atgaaactgg acacagaaac cagaccccag agcacatacc
gtatgagtcc attggtatga 60agtttaaaaa cagatggcac tagtccaaag gattggaagt
tggaatagtg gttaccagga 120ctggggggag gaagggatgg tggatggtga acaaaaggac
cttggagggc tcctggggtt 180ctaggaatca atcttccttc tttccttcct tccttccttc
ctctttctct ctttctttct 240gtttttattt caataggttt ttaaggaaca ggtggtgttg
gttacatgaa taagttcttt 300agcagtgatt tctgatattt tggtgcaccc attacccgaa
taaaaatctt ctctctttct 360tcctctctcc ttccttcctt ccttccttcc ttccttcctt
ccttccttcc ttccttccta 420ccttctttcc ttcaacagaa tcttattctg ttgcccaggc
tggagtgcag tggtacaatt 480atagcttttt gcagcctcaa cctcctgggc tcaagtgatc
ttcctgcccc agcctcctga 540gtagccagga ctacaggaat gtgccaacat gcctggctaa
ttttaaaaaa ttttttatag 600agaagaggtc tcactatgtt gcccagacta gacttgaact
ccttccctca agtgatcttt 660ctgcatcagt cttccaaagt gctgggattg caggcatgag
ccacctcacc cagccttaga 720aatgttctgt ttcttgacct gagagctgga tatacaggat
tgctcacttt gtgaaaattc 78020887DNAHomo sapiens 20gtacttcaga gtcaggatgc
ctctcttgct ctgggcctcc ttgcccacat aggagtcctt 60ctgacccatg cccaccatca
ctccctggtg cctagggtgc cccacaatgg aggggaagac 120ggcctgggga gccttgcgca
tgctggagca gttgtcgacg acgacgagcg cggtgatagc 180atcatccatg gtgagctggc
ggcgggtgcg gacgcaaggc gcagcggcaa ggacaaggtt 240ctgtgctcgc tgggctgacg
cggtctccgc ggtgtaagga ggtttatata tatttctaca 300acatctcccc taccgctata
gtaacttgct ctttctttcc ttcctttctt tctttctttc 360tttctttctt tctttctttc
tttctttctt tctttctttc tttctttttc tttctttctt 420tctttctttc tttctttctt
tctttctctt tctttctttc tctttctttc tttttctttc 480tttttcttcc ttccttcctt
tctctctctc tctctttctt tctttctaac tctctttgtc 540tctttctttc tttcttttga
cggagtttca ctcttgtcgc ccagattgga gtgcaatggc 600atgacctcgg ctcactgtag
cctccacctc ccaggttcaa gcgattatcc tgcctcagcc 660tccctaggag ctggaattac
agacgtgcac caccaagcct ggctaatttt tgtattatta 720gtagagacgg ggtttcacct
tgttggccag gctggtctcg aactcctgac ctcaggtgac 780ccacctgcct taggctccca
aagtcctggg attataggca tgagccacag tgcccagcct 840tcttttcatt taatactata
gtagtgtgat cctctctacc tattaca 88721720DNAHomo sapiens
21ttctgttttg cggtggttcc tagtatggta cctggccaag ggcacactag atctttgtca
60aggtaatgac tactttttat taaatgcttt ccatgtatca agttctgtgc caagcacttg
120acatatatca ttttatttta tcccgtgaag tagttattgg tatcttcatt tacaaataaa
180aaaacaagct tagtacttaa ctcactgcct tgaacataat tattgcttta aaggtagcta
240ggattcttaa tagctattat taccaaagca tgaacaatca gtaaaaagca aacctgagca
300ttagccccag gaccaatctg gtcacaaaca tattaatgaa ttgaacaaat gagtgagtgg
360aaggaaggaa ggaaggaagg aaggaaggaa ggaaggaagg aaggaaggaa atgaagacaa
420tacaaccaga gttgttcctt taataacaag acaagggaaa aagagaactg tcagaataag
480tgttaattat aatatccagg ggtgggatac agaggtttta gcatctgctc tttgccaagc
540actgcactta ttcctgagga atacctgagg gaaaaagtat ggtttctcac aggatctagt
600tggactggaa atatgacatt catattggaa tccagtgtct ttttctgaaa aagagagttc
660gttccaagct tagctcacat gcaagctaag acaaccacta gaaattactc tccccagggc
72022780DNAHomo sapiens 22gtcatgccta cagtgtaacg ggaattgacc aggtaggcga
cttgaactcc aactgcaggc 60tatggggaga catgtgacaa tgctaatccc ttaggcattt
attcagtgca ttgcagttta 120aatgtctgcc tttcaggcat ttcagagatt atgtcaccta
aagaggcagg ctggaattca 180aaacggcaag ccaggaaaga gagaaaccat gtgattccac
cgcagcacaa aactcgttta 240gcagctgtaa gcgcctggtc tttgtttatt tttaatttcc
tttctttccc aattctcctt 300cagtcctgtg ttagtcagga ttcttcagag aaatagaatc
actagggaac caaatatata 360tacatacaat taaacacaca cacacctatc tatctatcta
tctatctatc tatctatcta 420tctatctatc tatctatcta tctatctatc tacatcacac
agttgaccct tgagcaacac 480aggcttgaac ttatatgggg attttcttcc atctctacca
cccctgagac agcaagacca 540actcctcctc ctccttctca gcctactcaa catgaagata
ataaggatga agacctttac 600aatgacccag ttccacttaa taaatagtaa atgtatttcc
tcttccctat gattttcttg 660ataacatttc ttttctctgg cttatttatt gtaagaatac
agtatataat ataaataatt 720ataaaacatg ttaattggtt ctttacgtta tcgataagac
ttctggtcaa tggtaggcta 78023780DNAHomo sapiens 23gagcccaagt ttaaacccag
gccctctgtg tccccctaca gggtgactgc atctccgagt 60cctggcttgt catgcctgac
agagggctgc cgagtgagca gcttaaggca tcctgccact 120gtgcagctgc caaccctaca
gcccggcagc cctgcgggag gaagctctag tgcaggcctc 180ttaggatctg gggtccagga
tgctgatttc agggccggga ccttgggcac cgtccctctg 240gtctgcataa gacccactat
gggcaaacct taaacctgat cgttggaatt ccccaaactg 300gccagttcct ctccacccta
tagaccctgt cctagccttc ttatagctgc tatgggggct 360agattttccc cgatgatagt
agtctcatta ttattattat tattattatt attattatta 420ttattattac tattattgtt
ataaaaatat tgccaatcat acattcgcgt gatcactcac 480actgtgccgg gcactcttga
gagcacttta catatattgt ctcatttaat tctctcaact 540tgggcacagg cactgtcact
atttccattc tacagctgag gagactgaag cacagagagc 600cttagggact tgcctgaggt
cacacagcta agaaatggtg gagccaggat cagaaaccag 660gccacctaca gagctccctg
caaggggaac agcatccggt tccagaggct gtgattttat 720cagctacact gtgtgactcc
atcttcacac tctcctgccc ctcaagaaga catataacct 78024780DNAHomo sapiens
24atgaagagat ggtcaggcga ggtatggggg aaggggcgtg gagcttccat gtcctccctg
60ggcgccaccc tccaggaacc tccacgtgtt cagctataca gaagcttcct gaacccagtc
120ctcttggggt ttgagggaag cttcatgaca tcagcattcc ttcctccagg gtattaatgg
180gaccctctct gaagagattc ttaagaccca cggccagaaa gttgggtaaa gactagagtc
240ctgccttggg gcaggtgaaa ggagtgcaag agaaggtaag agagattctg ttcctgagcc
300ctaatgcacc caacattcta acaaaaggct gtaacaaggg ctacaggaat catgagccag
360gaactgtggc tcatctatga aaacttctat ctatctatct atctatctat ctatctatct
420atctatctat ctatatcata acaccacagc cacttagctc caatttaaaa gattaatcat
480aaacatttgg gaaggagagt gaagattttt gtgatgttaa ataagaatga ttatactaaa
540aaccaaaata atatgttatt tatggctggg tgtggtggct taagcctgta atcccagaac
600tttgggaggc caaggcttgt ggatcacttg agcccagaag ttcaagacca gcctgggcaa
660catagggaga ccctgtctct acaaaaaatt ttaaaattag ctggacatga tggcacgcac
720ccgtagtctc agctactcag gaggctcacg ccactgcatt ccagtctggg taacgcacac
78025780DNAHomo sapiens 25gtcaggagtt cgagaccagc ctggccaaca tggcgaaacc
ctgtctctac taaaaataca 60aaaaaattag ctgggcatgg tggtgtgttc ctgtaacccc
agctactcag gaggctgagg 120caagagaatc gctggaaccc aggaggtgga agttgcagtg
agctgagatt gcaccactgc 180actccagtgt gggcaacaga gcgagactct gtctcagaaa
aaaaaaagaa tacatgaaat 240cagagaaact caaattgtga tagtagtttc ttctggtgaa
ggaagaaaag agaatgatat 300cagggaagat gaaaaaagag actgtattag taaggcttct
ccagagagaa agaatcaaca 360ggatcaatgg atgcataggt agatagatag atagatagat
agatagatag atagatagat 420agatagacag acagacagac agacagacag acagatgaga
ggggatttat tagaggaatt 480agctcaagtg atatggaggc tgaaaaatct catgacagtc
catctgcaag ctggagaccc 540agggacacta ggagcatggc tcagtccagg tctaaaagcc
aaaaaaccag ggaaactgat 600ggtgtaatta tccatcccag gtggaaggcc tgagaacctg
gagtgcccct ggtataagtc 660ccagagtaca aagacaggag agcctggagt tctgacttcc
aagggcagaa gaatgtgtcg 720cagctccagg agagagagag aaagaatttc tttcctccgc
cttttgattc tatctggggg 7802674DNAHomo sapiens 26cagcaacagc acccagcttg
gcgcgggccg agggctccca ggcatgacac tgcagatccg 60cgactgagcc tgtg
742782DNAHomo sapiens
27ttaagtaatg tcaagaaggc aatgcgctga gactggagag cagaagaaag catcactggg
60ctaacacagc aaatgtggaa cc
822884DNAHomo sapiens 28cagcctagac gtcaagttac agcccgcgca gcagcagcaa
aggggaaggg gcaggagccg 60ggcacagttg gatccggagg tcgt
842991DNAHomo sapiens 29gccttcagca ggaagtccac
aaccctgcaa aagagggcgc tgcgtcacgc gggcacacgt 60ccgcagtctc ggagtctgtg
tgaggcacag g 9130103DNAHomo sapiens
30cttctccgag gtcgcaggtg gaacgggctt gcgcgtgaga acggggcctg ggcttaactc
60actggggcct cccccgggtg gccgaggttc ttttcccacg ccc
10331108DNAHomo sapiens 31cagcatccat cccatggtat gggtgggaag cctgaggctt
gggctggtca agggacctgc 60gccaggtcat gcagatgaac agcaggggag cccaagttta
aacccagg 10832480DNAHomo sapiens 32aaacacccca gtctgaaaat
aaccatagtt tgttgctctt acgagtgaaa atgctatttc 60atacacgaag ctttgtcctt
cagcacccaa gatttaagga taattatgga tgaatattat 120ggattcattt taaatccttt
ggcaaatctg ctctgggggc ttctctgtca gaaggtctct 180ccttcccaac tctaagaaac
gttattccta tgcaaatgct gctgagtcaa gacggggagg 240gaagtgcaga gagaagggct
ggtggcatgg tcagtaagtc atgagggtga gattaggggt 300gacacactgc ttgccaacgt
aggagaaggc tctgccctca cctagcaggt ctgatggaag 360ccccttattc cgtccttcct
gccgggttcc accgagatcc aaaaaggaat gctgtgtagg 420agcacatgat atgtgataaa
tgagagaaag gtcaaacatt taaggaacgc ccagagaaag 48033540DNAHomo sapiens
33cttgaacctg agaggcagag gttgcagtga gccgagacca tgccattgca ctccagcctg
60ggcaatagag taaaactcca tcctcccgct ccaaaaaagt agacaacgtc catgaggtga
120tgaggaaggg gttatcgtgt gttgcttgct gagaacagga cccccagact caccgtgtcg
180acgccggcca gcagcatctc agtcacgttg gcgtagatct cctgcagcgt cagagcctgg
240ctaaggaaga ggtatgtgag aagtcccccg ctcaccctcc ggcctcggtc catttggtac
300tgtatgtccc tcaacttgtt gtcaacatga atttggcctg tttgaaaaca gtatttcttt
360tgaaaggagt ttgggttgag aatcatcttt tcagtctcaa agccctctgt cctcccagta
420gcttaactaa accagtggca ggtgacagag ggtaaggaaa cccaatttat ctaacgtcaa
480cctgggagtt tcactcatac acttgcttat gtaaatgaat gaaaagttaa aagacaagct
54034537DNAHomo sapiens 34agagagccca ggagacaggc agaaaggaag gcatgtgacc
ggatcacaat catcagctct 60ctgctgtcct ctttgggaag ggttttagta ttaaaaggac
atttattctc attaatgcaa 120aattaaggag ttttaaaagc ttttacaacc tagactccct
ctgagaggtt agccttgaca 180ccctaatcgc cttctgctcc cgccactgct cggtgccaag
cagctcccac ggccccggcg 240ggtctgatga tagccggaca ggagggagga aggggaggag
gaagagcctg catcagctcc 300tacgattgcc cagccccatc ctgggagtga ttaaacggtg
catcaccaaa tgccagtccc 360actgacaggc aggtcaccgt gcacttcagg gcactctaaa
ttgccgactc tccatgtaga 420gagggatgaa tccaatattg aaatcctcat aactacagcc
ccccaaagta gccgtccatc 480ttctgcttaa aatgttgatc tgtagtaaaa tgttgatttt
gttgaagctg agtgatg 53735609DNAHomo sapiens 35ttgaacctag gagatggagg
ttgcagtgag ctgcgatcat gccacttccc tccaggctgg 60gcaacagagc gagactccat
ctcaaaaaaa caaaaaagaa aaccaacctt ttgaatgtag 120gggaaacttt tcaaaggata
tctagttttc aattacagta aacttgtgga agggaggttc 180agagttgaga ttgagattat
agattttgct gatgataaac catgagttcc agaggacata 240gtagactatt ctgggcagtt
atacaggggt ggatggaatg tgggagtggg gttgtatagt 300gccataaaga aatgagagtc
cggattaaaa ataatgagct ggactcgcga gccttttgta 360actgaaataa atagaaaaat
aagaaataca ttatttctgt gattgttgag aggaagaaat 420ggtggaaatc ttgtgagaag
cacactgagc tctagcacca cctcttcact cctacagatg 480gtggaataaa cggcaggcaa
gttcaaaatc acatatagtc attattgcaa gatagttcta 540tggatataga tactacatac
aatataaatc atgctcattg aatggttcag tggaaactac 600tctgaactt
60936732DNAHomo sapiens
36gagtttggga agggtatttt aggggggaat aacttttgag ttcccagcgt gcgggggaag
60ggcgggacgg gagggtgtcc caaggcctga gaagatcagt gtggggcagg ggtcaggaat
120aacctgggag ggggccttgt atgggggaaa taattgggaa gaggagagat gggatgaagg
180gggcctcagc gggtcgtctc ctgtgtatgc agggtcgttc tgcagcgtct ctgggagatg
240gcgtccctgg gagccctcag gtcgccccta cccgctgcgg ggtgctttcc tggcgtcacg
300ccttcctggc ccctggaggg aaggaagtga aactctcctc ttcccccacc cggctggaat
360gcgagtcagg aagcctgggg ctccagcctg ctccggctgc ccgggtcggg gatggggagg
420ggcgtggccg gagcgcaaag ccccgcccct ccgcgccccc cccccggaag ccccgccgcc
480ggccgctaag gcgatcacgg gccctgtcct aatatgggca accggaagcg gcccgcgcga
540ctgccctacg tcactccgtc caaatttagt tgtggaagtc agcgggcgct ggtggcggga
600aggcgccgcg agccagtgcg ggcggaaagg gggcgggggg cgcaccaccc cttaaagggc
660ccgcaccagg aatgaatgga gccattcgaa caattctgca tcctattttt ggaggaagtg
720gaattagtat tt
73237488DNAHomo sapiens 37tttattttta aaaaagaaag aaagaagaga aaagggatgg
gtttattgtc cttttcaaca 60gactagagta tacggggtga aactgcttca cttgattcaa
taaaatcgtt tccggtaaca 120ggccccagga atcctagacc taagcctggc gcgaaactac
atttcccaca atccttcggg 180ggctgataag gctccgcaat ggtctgaact acaattccca
caatccaggg cgatttccgc 240tttgtcgcgt ttcctcaagg ctccgcccca tttcccatct
ttcttttcag tccttgcgca 300ccggggaaca aggtcgtgaa aaaaaaggtc ttggtgaggt
gccgccattt catctgtcct 360cattctctgc gcctttcgca gagcttccag cagcggtatg
ttgggccaga gcatccggag 420gttcacaacc tctgtggtcc gtaggagcca ctatgaggag
ggccctggga aggttagtgt 480gtaagggg
48838248DNAHomo sapiens 38accctcattt cacatttcac
cccttcctca aaatgctccc ttcatattac ctcctcagaa 60accaagaata tggctactaa
ttctccctgg ccccatgctg caggtgaacc ggtagcccag 120aggtatcaca taattctccc
aaagtcacac agcaaatcaa gatgcatcca ggactagaag 180ccatgtcagc cacactggga
agccccagcg aagctgacag aaagtttcat aataccaccc 240tctcccct
248
User Contributions:
Comment about this patent or add new information about this topic:
 |  |
 | 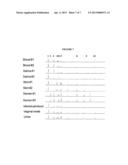 |
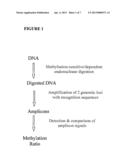 |  |
 |  |
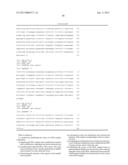 | 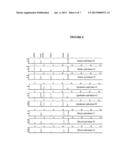 |
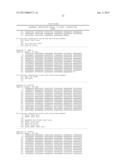 | 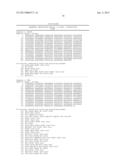 |
 |  |
 |  |
 |  |
 | 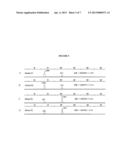 |
 | 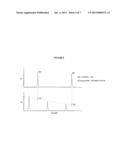 |
 |  |
 | 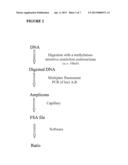 |
 |  |
 |  |
 |  |
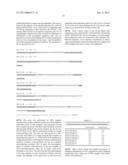 | 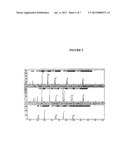 |
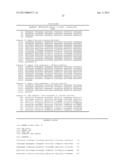 | 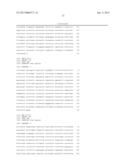 |
| Similar patent applications: | |
| Date | Title |
|---|---|
| 2012-06-28 | Identity profiling of cell surface markers |
| 2013-01-24 | Dna methylation profiles in cancer |
| 2013-07-25 | Method of determination of autoantibody level by means of enzyme immunoassay |
| 2013-07-25 | Immunoselection of recombinant vesicular stomatitis virus expressing hiv-1 proteins by broadly neutralizing antibodies |
| 2009-10-01 | Gene mutation profiling of csmd1 |
| New patent applications in this class: | |
| Date | Title |
|---|---|
| 2022-05-05 | Photocleavable mass-tags for multiplexed mass spectrometric imaging of tissues using biomolecular probes |
| 2022-05-05 | Macrophage expression in breast cancer |
| 2022-05-05 | Characterizing methylated dna, rna, and proteins in the detection of lung neoplasia |
| 2022-05-05 | Methods for identifying and improving t cell multipotency |
| 2022-05-05 | Sequence analysis using meta-stable nucleic acid molecules |
| New patent applications from these inventors: | |
| Date | Title |
|---|---|
| 2013-03-28 | Categorization of dna samples |
| 2012-07-26 | Methods for distinguishing between natural and artificial dna samples |
| 2012-01-05 | Identification of source of dna samples |
| Top Inventors for class "Chemistry: molecular biology and microbiology" | |
| Rank | Inventor's name |
|---|---|
| 1 | Marshall Medoff |
| 2 | Anthony P. Burgard |
| 3 | Mark J. Burk |
| 4 | Robin E. Osterhout |
| 5 | Rangarajan Sampath |