Patent application title: CATEGORIZATION OF DNA SAMPLES
Inventors:
Adam Wasserstrom (Nes-Ziona, IL)
Dan Frumkin (Tel-Aviv, IL)
Assignees:
Nucleix
IPC8 Class: AC12Q168FI
USPC Class:
435 611
Class name: Measuring or testing process involving enzymes or micro-organisms; composition or test strip therefore; processes of forming such composition or test strip involving nucleic acid nucleic acid based assay involving a hybridization step with a nucleic acid probe, involving a single nucleotide polymorphism (snp), involving pharmacogenetics, involving genotyping, involving haplotyping, or involving detection of dna methylation gene expression
Publication date: 2013-03-28
Patent application number: 20130078626
Abstract:
The present application describes methods for accurate and cost-effective
categorization of DNA samples into different types of in vitro generated
DNA or different types of natural DNA such as from different tissues
and/or physiological/pathological states. The invention achieves
categorization by comparing "signal ratios" that are correlated to ratios
of methylation levels at specific genomic loci, but does not rely on
calculation of actual methylation levels at any genomic locus. Therefore
the disclosed inventive method eliminates the requirement for external
DNA species and controls, thereby simplifying and increasing the accuracy
of the assay. The described inventive technology also enables performing
the categorization of DNA together with DNA profiling in the same
reaction, thereby allowing for concomitant categorization and
determination of identity of the samples.Claims:
1. A method for categorizing a DNA sample, comprising: (A) digesting a
DNA sample with at least one of a methylation-sensitive restriction
endonuclease and a methylation-dependent restriction endonuclease; (B)
amplifying at least two genomic loci from the digested DNA, wherein at
least one of the loci is a restriction locus; (C) determining the signal
intensity of each amplification product; (D) calculating at least one
signal ratio between signal intensities of amplification products; and
(E) comparing the signal ratio/s to reference values of different DNA
categories, wherein the approximation of the value of a signal ratio to
the values of reference ratios of a particular DNA category indicates the
categorical source of the DNA sample.
2. The method of claim 1, wherein the reference values against which the signal ratios are compared are from at least one DNA category selected from the group consisting of tissue type, cell type, physiological condition, pathological condition, age, ethnicity, sex, methylation level, species, cell lines, natural DNA and artificially-synthesized DNA, risk of developing a pathological condition, prenatal conditions, prognosis, propensity to respond to treatment, effects of cell line sub-culturing, response to medication.
3. The method of claim 2, wherein the tissue type or cell type is selected from the group consisting of blood, saliva, semen, epidermis, urine, plasma, hair, menstrual blood, vaginal cells and/or secretion, sweat, feces, brain, esophagus, lung, stomach, heart, duodenum, liver, gall bladder, intestine, kidney, adrenal gland, urinary bladder, urethra, colon, testicle, ovary, uterus, vagina, muscle, tendon, ligament, fat, cartilage, bone, endothelial cells, uterine cervix, lymph, thyroid, pituitary gland, cerebellum, and breast.
4. (canceled)
5. The method of claim 2, in which the pathological condition is cancer, inflammation, auto-immune disorder, metabolic disorder, infection, degenerative disease, hormonal imbalances, a disorder characterized by abnormal DNA methylation, neurodevelopmental disorder of ICF (immunodeficiency, centromeric instability, and facial anomalies), Rett syndrome, and fragile X syndrome.
6. The method of claim 2, in which the prenatal condition in Prader-Willi syndrome, Angelman syndrome, Beckwith-Wiedemann syndrome, fragile X syndrome, Russell-Silver syndrome, Transient neonatal diabetes mellitus, Albright hereditary osteodystrophy, McCune-Albright syndrome, Familial nonchromaffin paraganglioma, Maternal and paternal UPD14 syndromes.
7. The method of claim 1, wherein the reference values against which the signal ratios are compared represent categories that are mixtures of other categories.
8. The method of claim 7, wherein the reference values against which the signal ratios are compared are from mixtures of semen and non-semen at various ratios.
9.-11. (canceled)
12. The method of claim 2, wherein the reference DNA category is natural DNA or artificially-synthesized DNA, wherein at least one genomic locus in the natural DNA or artificially-synthesized DNA comprises a core short tandem repeat (STR) locus used for DNA profiling.
13. The method of claim 12, wherein the genomic locus comprises a human locus selected from the group consisting of D16S539 (SEQ ID NO. 1), D7S820 (SEQ ID NO. 2), D135317 (SEQ ID NO. 3), D5S818 (SEQ ID NO. 4), CSFIPO (SEQ ID NO. 5), TPOX (SEQ ID NO. 6), TH01 (SEQ ID NO. 7), vWA (SEQ ID NO. 8), FGA (SEQ ID NO. 9), D21 S11 (SEQ ID NO. 10), D8S1179 (SEQ ID NO. 11), D18551 (SEQ ID NO. 12), and D3S1358 (SEQ ID NO. 13), Penta D (SEQ ID NO. 14), Penta E (SEQ ID NO. 15), and Amelogenin (SEQ ID NOs. 16 and 17), D2S1338 (SEQ ID No. 18), D19S433(SEQ ID No. 19), ACTBP2SE33 (SEQ ID No. 20), D1051248 (SEQ ID No. 21), D1S1656 (SEQ ID No. 22), D22S1045 (SEQ ID No. 23), D2S441 (SEQ ID No. 24), and D125391 (SEQ ID No. 25).
14.-16. (canceled)
17. The method of claim 12, further comprising calculating at least one of the following ratios: (1) D3S1358/D18S51, (2) D3S1358/D7S820, (3) D3S1358/Penta_D, (4) D3S1358/TPOX, (5) D3S1358/FGA, (6) TH01/Penta_D, (7) D21S11/D18S51, (8) D21S11/D7S820, (9) D21S11/Penta_D, (10) D21S11/AMEL, (11) D21S11/TPOX, (12) D21S11/FGA, (13) D5S818/D18S51, (14) vWA/D18S51, (15) D5S818/Penta E, (16) vWA/Penta_E, (17) D5S818/D7S820, (18) D5S818/Penta_D, (19) D5S818/TPOX, (20) D5S818/FGA, (21) D13S317/D7S820, (22) D13S317/Penta_D, (23) D13S317/TPOX, (24) D13S317/FGA, (25) D16S539/D7S820, (26) CSFIPO/D7S820, (27) vWA/D7S820, (28) D8S1179/D7S820, (29) D16S539/TPOX, (30) D16S539/FGA, (31) CSF1PO/Penta_D, (32) CSF1PO/TPOX, (33) vWA/Penta_D, (34) AMEL/TPOX, (35) AMEL/FGA, (36) vWA/D8S1179, (37) vWA/TPOX, (38) vWA/FGA, (39) D8S1179/TPOX, and (40) D8S1179/FGA.
18.-19. (canceled)
20. The method of claim 1, wherein signal intensity is the amplification product's fluorescence level measured during capillary electrophoresis.
21. The method of claim 1, wherein steps (B) and (C) are performed by real-time PCR.
22.-23. (canceled)
24. The method of claim 1, further comprising assigning confidence levels to potential categories of a DNA sample, wherein the confidence level reflects the likelihood that a particular DNA category indicates the categorical source of the DNA sample; wherein the likelihood is calculated by: (A) assigning a probability score to each comparison of a signal ratio to the reference values that correspond to the various categories of DNA, wherein the probability score is obtained by (i) assigning a gamma probability distribution function to the reference values of each potential category; wherein (ii) the probability score is equal to the value of the gamma probability distribution function assigned in step (A) at the observed signal ratio; (B) for each category, calculating the category likelihood score, which is the product of the probability scores obtained in step (A); and (C) normalizing likelihood scores by dividing the category likelihood score of each potential category by the sum of all category likelihood scores; wherein the confidence level of each category is the normalized likelihood score of that category.
25. The method of claim 1, further comprising simultaneously performing DNA profiling with the DNA categorization.
26. The method of claim 1, wherein the steps of DNA digestion and polymerase chain reaction are performed together in a single tube.
27. (canceled)
28. A kit for categorization of a DNA sample into at least two predetermined categories and for obtaining an associated categorization confidence level, comprising (1) primers for amplification of specific genomic loci; and at least one or more reagents selected from the group consisting of (2) a reaction buffer, (3) control DNA, (4) a methylation sensitive restriction endonuclease and/or a methylation dependent restriction endonuclease, (5) a written protocol for performing categorization.
29. (canceled)
30. A kit for categorizing a DNA sample as semen or non-semen, comprising: (a) primer mix, comprising the following primers: TABLE-US-00012 SD1f (AAGAGCCCATCAGGCAGGTC); SD1r (GTTTCTTGTCGAGCAGCACGTGGATGATG); SD2f (CTCCAGAACTGGAACTTCCTG); SD2r (GTTTCTTAACTTGGAGACGACGGCATC); SD3f (TGGAGGACAATGCCCTGGTG); SD3r (GTTTCTTGGCTTCACCTGCGACCGTCTC); SD4f (CCCTCCGAGTGGCCAGCAG); SD4r (GTTTCTGACCACTGCCGTGGGAATG); SD5f (CTTCTCAGCCAATGGGAAGAG); SD5r (ACGTAGAAGGACCCGAGGAC);
(b) reaction buffer; (c) HhaI restriction endonuclease; (d) DNA polymerase (e) a written protocol for performing categorization.
31. The kit of claim 30, further comprising control DNA samples.
32.-45. (canceled)
46. A kit for categorizing a DNA sample as blood, saliva, semen, or skin epidermis, and for obtaining an associated categorization confidence level, comprising: (a) primer mix that comprises forward and reverse primers for amplifying the denoted loci as follows: TABLE-US-00013 1. L91762 (forward GCAGCAGGCCGCGGAGAAG (FAM); reverse AGCAGCTGTGCCGGGCCAG) 2. L68346 (forward CAGCAACAGCACCCAGCTTG (JOE); reverse CACAGGCTCAGTCGCGGATC) 3. L50468 (forward AGGAAACCTCAGTAGCAAAATTG (JOE); reverse GCGAGACTTTAGGTGTGCATC) 4. L14432 (forward CGTAGGCTGCGGTGAGCTC (FAM); reverse GATCCATGCCCGCTGGGATG) 5. L4648 (forward CAGCCTAGACGTCAAGTTACAG (JOE); reverse ACGACCTCCGGATCCAACTG) 6. L39664 (forward CCCAGCTGGTTGGACATGTTG (FAM); reverse CACTTCCTTCGTGGACGCC) 7. L30139 (forward GAGAAGCGGGAGGATGAGAC (FAM); reverse CCGCATCTCCTCCGTCCTG) 8. L55429 (forward GCCTTCAGCAGGAAGTCCAC (JOE); reverse CCTGTGCCTCACACAGACTC) 9. L62086 (forward GTGCATGGTGTCTGGTACTTC (FAM); reverse GAAGCTCTCGTGGACTACTTG) 10. L76138 (forward CAGCCTGCTCTTCACTGCAG (JOE); reverse AGAGGCCGATGAAGCCGTAG) 11. L15952 (forward CTCCCTGATTTACGACAAGTTC (FAM); reverse GACAGTATGCTGATGCTTCTTG) 12. L36599 (forward AAGGGCAGAGTTCCGCTGTC (FAM); reverse CGGATGCAGGAGGATCCTAG) 13. L26688 (forward CGGACCAGATTGCTGGTCAC (JOE); reverse CGACCTTGCCAGATGTTTGAC) 14. L81528 (forward AGCCTCATCCACACTGACCAG (JOE); reverse TCAGAGCTCTCCTATCTGGAC) 15. L36556 (forward GCCAGGCCGTTGATGATGAC (JOE); reverse GAATATGGAGCCCTGGGCAG)
(b) reaction buffer; (c) HhaI restriction endonuclease; (d) DNA polymerase (e) a written protocol for performing categorization.
47.-50. (canceled)
51. A method for calculating a distance measure of differential methylation between DNA samples, comprising: (A) digesting each DNA sample with a methylation-sensitive and/or methylation-dependent restriction endonuclease; (B) performing PCR on each digested DNA amplifying at least two genomic loci of which at least one is a restriction locus; (C) for each DNA sample, determining the intensity of the signal of each amplification product; (D) for each DNA sample, calculating "signal ratios" between the intensities of the signals produced by the loci; (E) calculating the differential methylation measure between DNA samples by performing a quantitative comparison of their corresponding signal ratios.
52.-57. (canceled)
58. The method of claim 26, wherein said single test tube comprises DNA template, digestion and amplification enzymes, buffer, primers, and accessory ingredients.
59. The method of claim 26, wherein said single test tube is closed and placed in a thermal cycler, where the single reaction takes place.
60. The method of claim 1, wherein the restriction loci are chosen such that they produce distinct signal ratios for specific categories.
61.-65. (canceled)
66. A method for categorizing a DNA sample as blood, saliva, semen, or skin epidermis, comprising: (A) digesting a DNA sample with HbaI restriction endonuclease; (B) amplifying 15 genomic loci (Sequences 39-53) with the following primers: TABLE-US-00014 1. L91762 (forward GCAGCAGGCCGCGGAGAAG (FAM); reverse AGCAGCTGTGCCGGGCCAG); 2. L68346 (forward CAGCAACAGCACCCAGCTTG (JOE); reverse CACAGGCTCAGTCGCGGATC); 3. L50468 (forward AGGAAACCTCAGTAGCAAAATTG (JOE); reverse GCGAGACTTTAGGTGTGCATC); 4. L14432 (forward CGTAGGCTGCGGTGAGCTC (FAM); reverse GATCCATGCCCGCTGGGATG); 5. L4648 (forward CAGCCTAGACGTCAAGTTACAG (JOE); reverse ACGACCTCCGGATCCAACTG); 6. L39664 (forward CCCAGCTGGTTGGACATGTTG (FAM); reverse CACTTCCTTCGTGGACGCC); 7. L30139 (forward GAGAAGCGGGAGGATGAGAC (FAM); reverse CCGCATCTCCTCCGTCCTG); 8. L55429 (forward GCCTTCAGCAGGAAGTCCAC (JOE); reverse CCTGTGCCTCACACAGACTC); 9. L62086 (forward GTGCATGGTGTCTGGTACTTC (FAM); reverse GAAGCTCTCGTGGACTACTTG); 10. L76138 (forward CAGCCTGCTCTTCACTGCAG (JOE); reverse AGAGGCCGATGAAGCCGTAG); 11. L15952 (forward CTCCCTGATTTACGACAAGTTC (FAM); reverse GACAGTATGCTGATGCTTCTTG); 12. L36599 (forward AAGGGCAGAGTTCCGCTGTC (FAM); reverse CGGATGCAGGAGGATCCTAG); 13. L26688 (forward CGGACCAGATTGCTGGTCAC (JOE); reverse CGACCTTGCCAGATGTTTGAC); 14. L81528 (forward AGCCTCATCCACACTGACCAG (JOE); reverse TCAGAGCTCTCCTATCTGGAC); 15. L36556 (forward GCCAGGCCGTTGATGATGAC (JOE); reverse GAATATGGAGCCCTGGGCAG).
(C) determining the signal intensity of each amplification product; (D) calculating signal ratios between the signal intensities of amplification products; and (E) comparing the signal ratios to reference values of DNA from blood, saliva, semen, and skin epidermis, wherein the approximation of the value of a signal ratio to the values of reference ratios of a particular DNA category indicates the categorical source of the DNA sample.
67. The method of claim 66, wherein a ratio of L91762/L68346 that is between 0.04 to 0.53 is indicative of semen.
68. The method of claim 66, wherein a ratio of L76138/L26688 that is between 0.08 and 1.54, concomiatant with a ratio of L91762/L68346 that is over 0.53 is indicative of skin epidermis.
69. The method of claim 1, wherein the reference values against which the signal ratios are compared represent categories that are mixtures of at least two other categories.
70. The method of claim 1, further comprising performing DNA profiling concomitant with categorization.
71. The method of claim 70, wherein profiling is performed with at least one of genomic loci from Sequences 1-25.
72. The method of claim 70, wherein categorization is to semen or non-semen.
73. The method of claim 70, further comprising an associated confidence level of the categorization.
74. The method of claim 72, wherein loci used for categorization are Sequences 40 and 54.
75. The method of claim 74, wherein the primers used for amplifying Sequence 40 are CAGCAACAGCACCCAGCTTG and CACAGGCTCAGTCGCGGATC, and wherein the primers used for amplifying Sequence 54 are GGACGAGTTAACTTCCTTAATTTC and GTTTCTTCGCGGAACCTGGTTTAACTTC.
76. The method of claim 74, wherein a signal ratio of amplification products corresponding to Sequence 40 and Sequence 54 over 1 indicate that the category is semen.
77. A method for obtaining a methylation profile of a DNA sample, comprising: (a) digesting a DNA sample with at least one of a methylation-sensitive restriction endonuclease and a methylation-dependent restriction endonuclease; (b) amplifying at least two genomic loci from the digested DNA, wherein at least one of the loci is a restriction locus; (c) determining the signal intensity of each amplification product; and (d) calculating signal ratios between the signal intensities of the amplification products; wherein the signal ratios obtained in step (d) are considered the methylation profile of the DNA sample.
78. The kit of claim 30, further including an associated confidence level of the categorization.
79. (canceled)
Description:
CROSS-REFERENCE TO RELATED PATENT APPLICATIONS
[0001] This application is a Continuation-In-Part of International Patent Application PCT/IB2010/003397, filed Dec. 8, 2010, which claims priority to U.S. Provisional Application 61/285,758 filed on Dec. 11, 2009, and Continuation-In-Part of International Patent Application No.: PCT/IB2011/000861, filed Apr. 19, 2011, which claims priority to U.S. Provisional Application 61/325,977, filed Apr. 20, 2010, and Continuation-In-Part of International Patent Application PCT/IB2011/000300 and U.S. patent application Ser. No. 13/029,719, both filed Feb. 17, 2011 and both claiming priority to U.S. Provisional Patent Application 61/306,201, filed Feb. 19, 2010, which are all incorporated herein by reference in their entirety.
BACKGROUND OF THE INVENTION
Field Of The Invention
[0002] The present inventive technology relates to methods for accurate and cost-effective categorization and profiling of DNA samples to identify the originating source and identity of the DNA sample or mixed DNA samples.
SUMMARY OF THE INVENTION
[0003] The present invention relates to methods for accurate and cost-effective categorization of DNA samples into different types of in vitro generated DNA or different types of natural DNA such as from different tissues and/or physiological/pathological states. The invention achieves categorization by comparing "signal ratios" that are correlated to ratios of methylation levels at specific genomic loci, but does not rely on calculation of actual methylation levels at any genomic locus. Therefore the invention setup eliminates the requirement for external DNA species and/or controls, thereby both simplifying and increasing the accuracy of the assay. The inventive technology also enables performing the categorization of DNA together with DNA profiling in the same reaction, thereby allowing for concomitant categorization and determination of identity of the samples.
[0004] One aspect of the present invention is a method for categorization of a DNA sample, the method comprising:
[0005] (A) digesting a DNA sample with a methylation-sensitive and/or methylation-dependent restriction endonuclease;
[0006] (B) performing PCR on the digested DNA amplifying at least two genomic loci of which at least one is a restriction locus;
[0007] (C) determining the intensity of the signal of each amplification product;
[0008] (D) calculating "signal ratios" between the intensities of the signals produced by the loci; and
[0009] (E) comparing the signal ratios to reference values corresponding to different categories of DNA, wherein the category whose reference values correspond best to the signal ratios is determined to be the category of the DNA sample. That is, for instance, the approximation of the value of a signal ratio to the value of a reference value of a particular DNA category indicates the categorical source of the DNA sample. So if a signal ratio that has a value that is close to the value of a reference category, then the likelihood that the tested DNA sample originated from that particular type of category--based on the similarity in values between the signal ratio and the reference value--is high. Thus, the signal ratio(s) that best correspond to, or best approximate, a particular reference value(s) for a particular DNA category makes it likely that that DNA sample originated from that particular DNA categorical source. For examples about how to compare the signal ratios and category reference values see the disclosure elsewhere in this application, such as in the section entitled Algorithm and Software, which explains how to calculate probability distributions and likelihood probalities that a test DNA sample can be categorized to one or more reference categories.
[0010] In one embodiment, DNA digestion and PCR are performed in a single biochemical reaction in which the DNA template, digestion and amplification enzymes, buffers, primers, and accessory ingredients are placed together in a test tube and then the test tube is closed and placed in a thermal cycler, where the reaction takes place.
[0011] In one embodiment, the methylation-sensitive restriction endonuclease is unable to cut or digest a DNA if its recognition sequence is methylated. In one embodiment, a methylation-sensitive restriction endonuclease is selected from the group consisting of AatII, Acc65I, AccI, Acil, ACII, Afel, Agel, Apal, ApaLI, AscI, AsiSI, Aval, AvaII, BaeI, BanI, BbeI, BceAI, BcgI, BfuCI, BglI, BmgBI, BsaAI, BsaBI, BsaHI, BsaI, BseYI, BsiEI, BsiWI, BslI, BsmAI, BsmBI, BsmFI, BspDI, BsrBI, BsrFI, BssHII, BssKI, BstAPI, BstBI, BstUI, BstZl7I, Cac8I, ClaI, DpnI, DrdI, EaeI, EagI, Eagl-HF, EciI, EcoRI, EcoRI-HF, FauI, Fnu4HI, FseI, FspI, HaeII, HgaI, HhaI, HincII, HincII, Hinfl, HinPlI, HpaI, HpaII, Hpyl66ii, Hpyl88iii, Hpy99I, HpyCH4IV, KasI, MluI, MmeI, MspAlI, MwoI, NaeI, NacI, NgoNIV, Nhe-HFI, NheI, NlaIV, NotI, NotI-HF, NruI, Nt.BbvCI, Nt.BsmAI, Nt.CviPII, PaeR7I, PleI, PmeI, PmlI, PshAI, PspOMI, PvuI, RsaI, RsrII, SacII, Sall, SalI-HF, Sau3AI, Sau96I, ScrFI, SfiI, SfoI, SgrAI, SmaI, SnaBI, TfiI, TscI, TseI, TspMI, and ZraI.
[0012] In another embodiment, a methylation dependent restriction enzyme can be used to digest a DNA sample. A methylation dependent restriction endonuclease digests only methylated DNA. Examples of such restriction enzymes include but are not limited to McrBC, McrA, and MrrA.
[0013] In one embodiment, at least one restriction locus is known to be methylated in natural DNA.
[0014] In another embodiment, at least one restriction locus is known to be unmethylated in natural DNA
[0015] In another embodiment, at least two restriction loci are known to be differentially methylated in natural DNA.
[0016] In another embodiment, the signal ratio between at least two loci is known to be different for at least two potential categories.
[0017] In another embodiment, primer pairs used to amplify loci are selected to amplify the core short tandem repeat (STR) loci identified in the Federal Bureau of Investigation's Combined DNA Index System (CODIS).
[0018] In one embodiment, the CODIS loci are human genomic loci selected from the group consisting of D16S539 (SEQ ID NO. 1), D7S820 (SEQ ID NO. 2), D135317 (SEQ ID NO. 3), D5S818 (SEQ ID NO. 4), CSF1PO (SEQ ID NO. 5), TPOX (SEQ ID NO. 6), TH01 (SEQ ID NO. 7), vWA (SEQ ID NO. 8), FGA (SEQ ID NO. 9), D21S11 (SEQ ID NO. 10), D8S1179 (SEQ ID NO. 11), D18S51 (SEQ ID NO. 12), and D3S1358 (SEQ ID NO. 13).
[0019] In a particular embodiment, the forward and reverse primers of a restriction and/or profile locus are designed to anneal to SEQ ID NO. 1, 2, 3, 4, 5, 6, 7, 8, 9, 10, 11, 12, 13, 14, 15, 16, 17, 18, 19, 20, 21, 22, 23, 24, or 25.
[0020] In one embodiment, the forward and reverse primers of a locus are available in a Promega Corporation commercial kit selected from the group consisting of PowerPlex® 16 HS (Cat.# DC2100, DC2101), PowerPlex® 16 (Cat.# DC6530, DC6531), PowerPlex® 2.1 (Cat.# DC6470, DC6471), PowerPlex® 16 BIO (Cat.# DC6540, DC6541), and PowerPlex® ES Systems (Cat.# DC6730, DC6731).
[0021] In one embodiment, the forward and reverse primers of a locus are available in an Applied Biosystems/Life commercial kit selected from the group consisting of SGM, SGM+, AmpFlSTR Identifiler, AmpFlSTR Profiler, AmpFlSTR ProfilerPlus, AmpFlSTR ProfilerPlusID, AmpFlSTR SEfiler, AmpFlSTR SEfiler Plus, AmpFlSTR Cofiler, AmpFlSTR Identifiler Direct, AmpFlSTR Identifiler Plus, AmpFlSTR NGM, AmpFlSTR Y-filer, AmpFlSTR Minifiler.
[0022] In one embodiment, the forward and reverse primers of a locus are available in a Qiagen commercial kit selected from the group consisting of Investigator ESSPlex, Investigator ESSPlex SE, Investigator Nonaplex ESSPlex, Investigator Hexaplex ESSPlex, Investigator Triplex AFS QS, Investigator Triplex DSF, Investigator IDplex, Investigator Decaplex SE, Investigator HDplex, Investigator Argus X-12, Investigator Y-12 QS, Investigator DIPplex.
[0023] In another embodiment, the restriction loci contain a HpaII recognition sequence and are selected from the group consisting of ADD6, ADD10, ADD17 (SEQ ID NOs. 26-28) and Hypo23, Hypo28, Hypo33 (SEQ ID NOs. 29-31). In one embodiment, the DNA sample is mammalian DNA or plant DNA. In one embodiment, the mammalian DNA is DNA from a mammal selected from the group consisting of human, ape, monkey, rat, mouse, rabbit, cow, pig, sheep, and horse. In a particular embodiment, the mammalian DNA is human DNA. In one embodiment, the human DNA is from a male. In another embodiment, the human DNA is from a female.
[0024] In one embodiment, the human DNA sample is obtained from a male or female who has a disorder characterized by abnormal DNA methylation. In one embodiment, the disorder is a neurodevelopmental disorder of ICF (immunodeficiency, centromeric instability, and facial anomalies), Rett syndrome, and fragile X syndrome.
[0025] In one embodiment, the plant DNA is DNA from a plant. In one embodiment, the plant is a monocotyledonous plant selected from the group consisting of wheat, turf grass, cereal, maize, rice, oat, barley, sorghum, orchid, iris, lily, onion, banana, sugarcane, sorghum, and palm. In another embodiment, the plant is a dicotyledonous plant selected from the group consisting of avocado, potato, tobacco, tomato, sugarbeet, broccoli, cassava, sweet potato, pepper, cotton, poinsettia, legumes, alfalfa, soybean, carrot, strawberry, lettuce, oak, maple, walnut, rose, mint, squash, daisy, and cactus.
[0026] In one embodiment of the method, at least two loci are amplified by PCR with fluorescently labeled primers and wherein pairwise comparisons of the intensity of the fluorescent signals corresponding to the loci is performed in order to calculate signal ratios for each pair of loci.
[0027] In one embodiment, primer pairs are used to amplify pairs of loci selected from the group of pairs consisting of D3S1358/D18S51, D3S1358/D7S820, D3S1358/Penta_D, D3S1358/TPOX, D3S1358/FGA, TH01/Penta_D, D21S11/D18S51, D21S11/D7S820, D21S11/Penta_D, D21S11/AMEL, D21S11/TPOX, D21S11/FGA, D5S818/D18S51, vWA/D18S51, D5S818/Penta_E, vWA/Penta_E, D5S818/D7S820, D5S818/Penta_D, D5S818/TPOX, D5S818/FGA, D13S317/D7S820, D13S317/Penta_D, D13S317/TPOX, D13S317/FGA, D16S539/D7S820, CSF1PO/D7S820, vWA/D7S820, D8S1179/D7S820, D16S539/TPOX, D16S539/FGA, CSF1PO/Penta_D, CSF1PO/TPOX, vWA/Penta_D, AMEL/TPOX, AMEL/FGA, vWA/D8S1179, vWA/TPOX, vWA/FGA, D8S1179/TPOX, D8S1179/FGA.
[0028] In another embodiment, the restriction loci amplicons are smaller than the smallest amplicons used in DNA profiling, which is about 100 bps in size.
[0029] In one aspect of the present inventive technology, quantification of amplicon signals is performed and not necessarily the quantification of the amount of DNA templates. By calculating ratios of amplicon signals, no standard curve or reference DNA is needed since it is unnecessary to calculate actual DNA concentrations. In this embodiment, the ratios of amplicon signals is calculated. The signals may be signals detected from any kind of labeling used for detecting PCR amplification products, such as, but not limited to, ethidium bromide staining, sybr green staining, silver staining, or by fluorescence.
[0030] With respect to the latter, in one embodiment, the PCR reaction is performed with fluorescently labeled primers, and determination of the intensity of the signals of the amplification products is achieved by separation of products by capillary electrophoresis and quantification of fluorescence signals.
[0031] In another embodiment, the PCR is real time PCR, and determination of the intensity of the signals of the amplification products is achieved by quantification of fluorescence signals.
[0032] In a particular embodiment, the methylation-sensitive restriction endonuclease is HhaI.
[0033] In a particular embodiment, the methylation-sensitive restriction endonuclease is HhaI and the first restriction locus is the TPOX locus.
[0034] In a particular embodiment, the methylation-sensitive restriction endonuclease is HhaI and the first restriction locus is the FGA locus.
[0035] In a particular embodiment in which categorization is according to semen or non-semen, the methylation-sensitive restriction endonuclease is HhaI, the restriction loci are SD1, SD2, SD3, and SD4 (SEQ ID NOs. 33-36), a digested control locus is SD5 (SEQ ID NO. 37), and an undigested control locus is SD6 (SEQ ID NO. 38).
[0036] In a particular embodiment in which categorization is according to blood, saliva, semen, or skin epidermis, the methylation-sensitive restriction endonuclease is HhaI and the restriction loci are SEQ ID NOs. 39-53.
[0037] In a particular embodiment in which categorization is performed together with DNA profiling, and is according to semen or non-semen, the methylation-sensitive restriction endonuclease is HhaI, and the restriction loci are SEQ ID NO. 40 and SEQ ID NO. 54.
[0038] In one embodiment, a pair of loci are selected from loci with known methylation levels in at least two DNA categories, such that one of the loci in the pair is known to have a higher methylation level than the second locus in that pair in one DNA category but not in the other.
[0039] In another embodiment, a pair of loci are selected without knowledge of methylation levels as follows: select a pair of random genomic loci; design fluorescently labeled primers for amplifying each locus; amplify both loci in DNA samples obtained from different categories; separate amplicons with capillary electrophoresis; calculate signal ratios in the different DNA samples; if ratios calculated from samples corresponding to at least one category are significantly different (e.g. as determined by the Kolmogorov-Smirnov test with a threshold of p=0.05) than those obtained from samples corresponding to at least one other category, select the pair for use in assay. In one embodiment, the calculated ratios are compared to a set of ratios obtained from natural samples and to a set of ratios obtained from artificial samples.
[0040] With respect to the latter, in one embodiment, the respective mean signal ratios of natural and artificial DNA samples digested with HhaI for specific pairs of loci determined herein are shown below.
TABLE-US-00001 Natural DNA Artificial DNA FGA(PowerPlex16)/Hypo12 10.3 0.89 FGA(PowerPlex16)/Hypo28 12.4 0.76 TPDX(PowerPlex16)/Hypo12 9.7 1.12
[0041] In another embodiment, the calculated ratios are compared to a set of ratios obtained from DNA samples extracted from different tissue categories. See Tables 1-4 presented in FIGS. 7-10 for additional examples of loci sequences and illustrative signal ratios and results used and obtained in accordance with the inventive categorization methods disclosed herein.
[0042] In one embodiment this method, or any method described herein, further comprises simultaneously profiling a DNA sample and determining whether the category of the DNA. In one embodiment, the step of profiling a DNA sample is performed according to instructions provided in a commercially available DNA profiling kit. In another embodiment, the commercially available DNA profiling kit is the PowerPlex®16 profiling kit (Promega Corporation).
[0043] In one embodiment, with respect to the latter, categorization of DNA is according to tissue types. Any tissue type can be used such as, but not limited to blood, saliva, semen, epidermis, urine, plasma, and hair.
[0044] Accordingly, one aspect of the present invention is a method for categorizing a DNA sample, comprising:
[0045] (A) digesting a DNA sample with at least one of a methylation-sensitive restriction endonuclease and a methylation-dependent restriction endonuclease;
[0046] (B) amplifying at least two genomic loci from the digested DNA, wherein at least one of the loci is a restriction locus;
[0047] (C) determining the signal intensity of each amplification product;
[0048] (D) calculating signal ratios between the signal intensities of the amplification products; and
[0049] (E) comparing the signal ratios to reference values of different DNA categories,
[0050] wherein the approximation of the value of a signal ratio to the values of reference ratios of a particular DNA category indicates the categorical source of the DNA sample.
[0051] In one embodiment, the reference values against which the signal ratios are compared are from at least one DNA category selected from the group consisting of tissue type, cell type, physiological condition, pathological condition, age, ethnicity, sex, methylation level, species, cell lines, natural DNA and artificially-synthesized DNA, risk of developing a pathological condition, prenatal conditions, prognosis, propensity to respond to treatment, effects of cell line sub-culturing, response to medication.
[0052] In another embodiment, the tissue type or cell type is selected from the group consisting of blood, saliva, semen, epidermis, urine, plasma, hair, menstrual blood, vaginal cells and/or secretion, sweat, feces, brain, esophagus, lung, stomach, heart, duodenum, liver, gall bladder, intestine, kidney, adrenal gland, urinary bladder, urethra, colon, testicle, ovary, uterus, vagina, muscle, tendon, ligament, fat, cartilage, bone, endothelial cells, uterine cervix, lymph, thyroid, pituitary gland, cerebellum, and breast.
[0053] In a particular embodiment, the tissue type or cell type is blood, saliva, semen, or epidermis.
[0054] In another embodiment, the pathological condition is cancer, inflammation, auto-immune disorder, metabolic disorder, infection, degenerative disease, hormonal imbalances, a disorder characterized by abnormal DNA methylation, neurodevelopmental disorder of ICF (immunodeficiency, centromeric instability, and facial anomalies), Rett syndrome, and fragile X syndrome.
[0055] In one embodiment, the prenatal condition in Prader-Willi syndrome, Angelman syndrome, Beckwith-Wiedemann syndrome, fragile X syndrome, Russell-Silver syndrome, Transient neonatal diabetes mellitus, Albright hereditary osteodystrophy, McCune-Albright syndrome, Familial nonchromaffin paraganglioma, Maternal and paternal UPD14 syndromes.
[0056] In another embodiment, the reference values against which the signal ratios are compared represent categories that are mixtures of other categories.
[0057] In another embodiment, the reference values against which the signal ratios are compared are from mixtures of semen and non-semen at various ratios.
[0058] In one embodiment, the methylation-sensitive restriction endonuclease is selected from the group consisting of AatII, Acc65I, AccI, Acil, AC1I, Afel, Agel, Apal, ApaLI, AscI, AsiSI, Aval, AvaII, BaeI, BanI, BbeI, BceAI, BcgI, BfuCI, BglI, BmgBI, BsaAI, BsaBI, BsaHI, BsaI, BseYI, BsiEI, BsiWI, BslI, BsmAI, BsmBI, BsmFI, BspDI, BsrBI, BsrFI, BssHII, BssKI, BstAPI, BstBI, BstUI, BstZl7I, Cac8I, ClaI, DpnI, DrdI, EaeI, EagI, Eagl-HF, EciI, EcoRI, EcoRI-HF, Faul, Fnu4HI, FseI, FspI, HaeII, HgaI, HhaI, HincII, HincII, Hinfl, HinPlI, HpaI, HpaII, Hpyl66ii, Hpyl88iii, Hpy99I, HpyCH4IV, KasI, MluI, MmeI, MspAlI, MwoI, NaeI, Nan, NgoNIV, Nhe-HFI, NheI, NlaIV, NotI, NotI-HF, NruI, Nt.BbvCI, Nt.BsmAI, Nt.CviPII, PaeR7I, PleI, PmeI, PmlI, PshAI, PspOMI, PvuI, RsaI, RsrII, SacII, Sall, SalI-HF, Sau3AI, Sau96I, ScrFI, SfiI, SfoI, SgrAI, SmaI, SnaBI, TfiI, TscI, TseI, TspMI, and ZraI.
[0059] In a particular embodiment, the methylation-sensitive restriction endonuclease is HhaI.
[0060] In another embodiment, the methylation-dependent restriction endonuclease is selected from the group consisting of McrBC, McrA, and MrrA.
[0061] In one embodiment, the reference DNA category is natural DNA or artificially-synthesized DNA, wherein at least one genomic locus in the natural DNA or artificially-synthesized DNA comprises a core short tandem repeat (STR) locus used for DNA profiling.
[0062] In another embodiment, the genomic locus comprises a human locus selected from the group consisting of D16S539 (SEQ ID NO. 1), D7S820 (SEQ ID NO. 2), D135317 (SEQ ID NO. 3), D5S818 (SEQ ID NO. 4), CSF1PO (SEQ ID NO. 5), TPOX (SEQ ID NO. 6), TH01 (SEQ ID NO. 7), vWA (SEQ ID NO. 8), FGA (SEQ ID NO. 9), D21S11 (SEQ ID NO. 10), D8S1179 (SEQ ID NO. 11), D18551 (SEQ ID NO. 12), and D3S1358 (SEQ ID NO. 13), Penta D (SEQ ID NO. 14), Penta E (SEQ ID NO. 15), and Amelogenin (SEQ ID NOs. 16 and 17), D2S1338 (SEQ ID No. 18), D19S433(SEQ ID No. 19), ACTBP2SE33 (SEQ ID No. 20), D1051248 (SEQ ID No. 21), D1S1656 (SEQ ID No. 22), D22S1045 (SEQ ID No. 23), D2S441 (SEQ ID No. 24), and D125391 (SEQ ID No. 25).
[0063] In one embodiment, the primers for amplification of at least one of the genomic loci are available in:
[0064] (1) a Promega Corporation commercial kit selected from the group consisting of PowerPlex® 16 HS (Cat.# DC2100, DC2101), PowerPlex® 16 (Cat.# DC6530, DC6531), PowerPlex® 2.1 (Cat.# DC6470, DC6471), PowerPlex® 16 BIO (Cat.# DC6540, DC6541), and PowerPlex® ES Systems (Cat.# DC6730, DC6731);
[0065] (2) an Applied Biosystems commercial kit selected from the group consisting of SGM, SGM+, AmpFlSTR Identifiler, AmpFlSTR Profiler, AmpFlSTR ProfilerPlus, AmpFlSTR ProfilerPlusID, AmpFlSTR SEfiler, AmpFlSTR SEfiler Plus, AmpFlSTR Cofiler, AmpFlSTR Identifiler Direct, AmpFlSTR Identifiler Plus, AmpFlSTR NGM, AmpFlSTR Y-filer, and AmpFlSTR Minifiler; or
[0066] (3) Investigator ESSPlex, Investigator ESSPlex SE, Investigator Nonaplex ESSPlex, Investigator Hexaplex ESSPlex, Investigator Triplex AFS QS, Investigator Triplex DSF, Investigator IDplex, Investigator Decaplex SE, Investigator HDplex, Investigator Argus X-12, Investigator Y-12 QS, Investigator DIPplex.
[0067] In another embodiment, one of the genomic loci is known to be unmethylated in all tissues of natural DNA. In one embodiment, one of the genomic loci is selected from the group consisting of Hypo23, Hypo28, and Hypo33.
[0068] In another embodiment, the method further comprises calculating at least one of the following ratios:
[0069] (1) D3S1358/D18S51,
[0070] (2) D3S1358/D7S820,
[0071] (3) D3S1358/Penta_D,
[0072] (4) D3S1358/TPOX, (5) D3S1358/FGA,
[0073] (6) TH01/Penta_D,
[0074] (7) D21S11/D18S51,
[0075] (8) D21S11/D7S820,
[0076] (9) D21S11/Penta_D,
[0077] (10) D21S11/AMEL,
[0078] (11) D21S11/TPOX,
[0079] (12) D21S11/FGA,
[0080] (13) D5S818/D18S51,
[0081] (14) vWA/D18S51,
[0082] (15) D5S818/Penta_E,
[0083] (16) vWA/Penta_E,
[0084] (17) D5S818/D7S820,
[0085] (18) D5S818/Penta_D,
[0086] (19) D5S818/TPOX,
[0087] (20) D5S818/FGA,
[0088] (21) D13S317/D7S820,
[0089] (22) D13S317/Penta_D,
[0090] (23) D13S317/TPOX,
[0091] (24) D13S317/FGA,
[0092] (25) D16S539/D7S820,
[0093] (26) CSF1PO/D7S820,
[0094] (27) vWA/D7S820,
[0095] (28) D8S1179/D7S820,
[0096] (29) D16S539/TPOX,
[0097] (30) D16S539/FGA,
[0098] (31) CSF1PO/Penta_D,
[0099] (32) CSF1PO/TPOX,
[0100] (33) vWA/Penta_D,
[0101] (34) AMEL/TPOX,
[0102] (35) AMEL/FGA,
[0103] (36) vWA/D8S1179,
[0104] (37) vWA/TPOX,
[0105] (38) vWA/FGA,
[0106] (39) D8S1179/TPOX, and
[0107] (40) D8S1179/FGA.
[0108] In a particular embodiment, at least one of the genomic loci is TPOX (SEQ ID NO. 6) or FGA (SEQ ID NO. 9).
[0109] In another embodiment, the amplified loci are 90 bps or smaller in size.
[0110] In one embodiment, signal intensity is the amplification product's fluorescence level measured during capillary electrophoresis.
[0111] In one embodiment, steps (B) and (C) of the method disclosed above are performed by real-time PCR. That is, in one embodiment, all of the required reagents and primers and enzymes necessary for DNA digestion and amplification by PCR are present together in the same tube or vessel.
[0112] In one embodiment, fluorescently-labeled primers are used to PCR amplify the chosen loci of the digested DNA, wherein the signal intensity of each amplification product is the fluorescence level of each amplification product.
[0113] In another embodiment, the method further comprises hybridizing a fluorescently-labeled probe to an amplification product, wherein the signal intensity of the amplification product is the fluorescence level measured after hybridization of the probe to the product.
[0114] In another embodiment, the method further comprises assigning confidence levels to potential categories of a DNA sample, wherein the confidence level reflects the likelihood that a particular DNA category indicates the categorical source of the DNA sample; wherein the likelihood is calculated by:
[0115] (A) assigning a probability score to each comparison of a signal ratio to the reference values that correspond to the various categories of DNA, wherein the probability score is obtained by (i) assigning a gamma probability distribution function to the reference values of each potential category; wherein (ii) the probability score is equal to the value of the gamma probability distribution function assigned in step (A) at the observed signal ratio;
[0116] (B) for each category, calculating the category likelihood score, which is the product of the probability scores obtained in step (A); and
[0117] (C) normalizing likelihood scores by dividing the category likelihood score of each potential category by the sum of all category likelihood scores;
[0118] wherein the confidence level of each category is the normalized likelihood score of that category.
[0119] In another embodiment, the method further comprises simultaneously performing DNA profiling with the DNA categorization.
[0120] In one embodiment, the steps of DNA digestion and polymerase chain reaction are performed together in a single tube.
[0121] In one embodiment, the genomic loci that are amplified are chosen to produce distinct signal ratios for different potential categories.
[0122] Another aspect of the present invention is a kit for categorization of a DNA sample into at least two predetermined categories and for obtaining an associated categorization confidence level, comprising (1) primers for amplification of specific genomic loci; and at least one or more reagents selected from the group consisting of (2) a reaction buffer, (3) control DNA, (4) a methylation sensitive restriction endonuclease and/or a methylation dependent restriction endonuclease, (5) a written protocol for performing categorization. In one embodiment of the present invention, the written protocol may comprise instructions for performing any of the methods disclosed herein, including but not limited to, DNA digestion parameters, PCR cycling parameters, signal ratio analysis, and categorization analysis, as well as DNA profiling methods.
[0123] In another embodiment, the kit further comprises analysis software for performing categorization analyses.
[0124] Another aspect of the present invention is a kit for categorizing a DNA sample as semen or non-semen and for obtaining an associated categorization confidence level, comprising:
[0125] (a) primer mix, comprising the following primers:
TABLE-US-00002
[0125] SD1f (AAGAGCCCATCAGGCAGGTC); SD1r (GTTTCTTGTCGAGCAGCACGTGGATGATG); SD2f (CTCCAGAACTGGAACTTCCTG); SD2r (GTTTCTTAACTTGGAGACGACGGCATC); SD3f (TGGAGGACAATGCCCTGGTG); SD3r (GTTTCTTGGCTTCACCTGCGACCGTCTC); SD4f (CCCTCCGAGTGGCCAGCAG); SD4r (GTTTCTGACCACTGCCGTGGGAATG); SD5f (CTTCTCAGCCAATGGGAAGAG); SD5r (ACGTAGAAGGACCCGAGGAC); SD6f (TACAGACAAATCACTCAGCAGC); and SD6r (GTTTCTTGTCTGACACTCGGTTGTAGGTATT);
[0126] (b) reaction buffer;
[0127] (c) HhaI restriction endonuclease;
[0128] (d) DNA polymerase
[0129] (d) a written protocol for performing categorization.
[0130] In another embodiment, the kit further comprises control DNA samples.
[0131] In another aspect of the present invention is a kit for categorizing a DNA sample as semen or non-semen and for obtaining an associated categorization confidence level, comprising at least one pair of forward (f) and reverse (r) primer pair combinations selected from the group consisting of:
TABLE-US-00003 (1) SD1f (AAGAGCCCATCAGGCAGGTC) and SD1r (GTTTCTTGTCGAGCAGCACGTGGATGATG); (2) SD2f (CTCCAGAACTGGAACTTCCTG) and SD2r (GTTTCTTAACTTGGAGACGACGGCATC); (3) SD3f (TGGAGGACAATGCCCTGGTG) and SD3r (GTTTCTTGGCTTCACCTGCGACCGTCTC); (4) SD4f (CCCTCCGAGTGGCCAGCAG) and SD4r (GTTTCTGACCACTGCCGTGGGAATG); (5) SD5f (CTTCTCAGCCAATGGGAAGAG) and SD5r (ACGTAGAAGGACCCGAGGAC); (6) SD6f (TACAGACAAATCACTCAGCAGC) and SD6r (GTTTCTTGTCTGACACTCGGTTGTAGGTATT).
[0132] In one embodiment, the concentration of the primers in the primer mix are: 0.6 μM SD1f, 0.6 μM SD1r, 1.75 μM SD2f, 1.75 μM SD2r, 1.25 μM SD3f, 1.25 μM SD3r, 1.75 μM SD4f, 1.75 82 M SD4r, 1.75 μM SD5f, 1.75 μM SD5r, 0.9 μM SD6f, and 0.9 μM SD6r.
[0133] In one embodiment, the reaction buffer comprises 150 mM TRIS-HCl, 15 mM MgCl2, 0.2 mM each dntp, and 0.1 μg/μl BSA.
[0134] In one embodiment, the kit further comprises a DNA ladder.
[0135] In one embodiment, the kit further comprises analysis software for performing categorization analyses.
[0136] Another aspect of the present invention is a kit for profiling, categorizing a DNA sample as semen or non-semen, and obtaining an associated categorization confidence level, comprising:
[0137] (a) primers for amplifying at least one semen-specific locus;
[0138] (b) primers for amplifying at least one locus used for DNA profiling;
[0139] (c) reaction buffer;
[0140] (d) HhaI restriction endonuclease,
[0141] (e) DNA polymerase
[0142] (f) a written protocol for performing categorization.
[0143] In one embodiment, the kit further comprises control DNA samples.
[0144] Another aspect of the present invention is a kit for profiling, categorizing a DNA sample as semen or non-semen, and obtaining an associated categorization confidence level, comprising:
[0145] (a) primers for amplifying at least one semen-specific locus; and
[0146] (b) primers for amplifying at least one locus used for DNA profiling.
[0147] In one embodiment, at least one semen-specific locus amplified by a kit disclosed herein is the L68346 locus. In one embodiment, the primers for amplifying a 70 by semen-specific amplification product from L68346 are a forward primer comprising the sequence of CAGCAACAGCACCCAGCTTG (FAM) and a reverse primer comprising the sequence of CACAGGCTCAGTCGCGGATC.
[0148] In one embodiment, at least one semen-specific locus amplified by a kit disclosed herein is the L16264 locus. In one embodiment, the primers for amplifying a 95 by semen-specific amplification product from L16264 are a forward primer comprising the sequence of GGACGAGTTAACTTCCTTAATTTC (FAM) and reverse primer comprising the sequence of GTTTCTTCGCGGAACCTGGTTTAACTTC.
[0149] In another embodiment, the reaction buffer comprises 150 mM TRIS-HCl, 15 mM MgCl2, 0.2 mM each dntp, and 0.1 μg/μl BSA.
[0150] In another embodiment, the kit further comprises at least one of (a) a DNA ladder, (b) a Material Safety Data Sheet (MSDS), and (c) analysis software for performing categorization analyses.
[0151] Another aspect of the present invention is a kit for categorizing a DNA sample as blood, saliva, semen, or skin epidermis, and for obtaining an associated categorization confidence level, comprising:
[0152] (a) primer mix that comprises forward and reverse primers for amplifying the denoted loci as follows:
TABLE-US-00004
[0152] 1. L91762 (forward GCAGCAGGCCGCGGAGAAG (FAM); reverse AGCAGCTGTGCCGGGCCAG) 2. L68346 (forward CAGCAACAGCACCCAGCTTG (JOE); reverse CACAGGCTCAGTCGCGGATC) 3. L50468 (forward AGGAAACCTCAGTAGCAAAATTG (JOE); reverse GCGAGACTTTAGGTGTGCATC) 4. L14432 (forward CGTAGGCTGCGGTGAGCTC (FAM); reverse GATCCATGCCCGCTGGGATG) 5. L4648 (forward CAGCCTAGACGTCAAGTTACAG (JOE); reverse ACGACCTCCGGATCCAACTG) 6. L39664 (forward CCCAGCTGGTTGGACATGTTG (FAM); reverse CACTTCCTTCGTGGACGCC) 7. L30139 (forward GAGAAGCGGGAGGATGAGAC (FAM); reverse CCGCATCTCCTCCGTCCTG) 8. L55429 (forward GCCTTCAGCAGGAAGTCCAC (JOE); reverse CCTGTGCCTCACACAGACTC) 9. L62086 (forward GTGCATGGTGTCTGGTACTTC (FAM); reverse GAAGCTCTCGTGGACTACTTG) 10. L76138 (forward CAGCCTGCTCTTCACTGCAG (JOE); reverse AGAGGCCGATGAAGCCGTAG) 11. L15952 (forward CTCCCTGATTTACGACAAGTTC (FAM); reverse GACAGTATGCTGATGCTTCTTG) 12. L36599 (forward AAGGGCAGAGTTCCGCTGTC (FAM); reverse CGGATGCAGGAGGATCCTAG) 13. L26688 (forward CGGACCAGATTGCTGGTCAC (JOE); reverse CGACCTTGCCAGATGTTTGAC) 14. L81528 (forward AGCCTCATCCACACTGACCAG (JOE); reverse TCAGAGCTCTCCTATCTGGAC) 15. L36556 (forward GCCAGGCCGTTGATGATGAC (JOE); reverse GAATATGGAGCCCTGGGCAG)
[0153] (b) reaction buffer;
[0154] (c) HhaI restriction endonuclease;
[0155] (d) DNA polymerase
[0156] (e) a written protocol for performing categorization.
[0157] In another embodiment, the kit further comprises control DNA samples.
[0158] In one embodiment, the reaction buffer comprises 150 mM TRIS-HCl, 15 mM MgCl2, 0.2 mM each dntp, and 0.1 μg/μl BSA.
[0159] In another embodiment, the kit further comprises at least one of (a) a DNA ladder, (b) a Material Safety Data Sheet (MSDS), and (c) analysis software for performing categorization analyses.
[0160] In one embodiment in any of the methods disclosed herein, the DNA sample comprises a mixture of DNA samples.
[0161] Another aspect of the present invention is a method for calculating a distance measure of differential methylation between DNA samples, comprising:
[0162] (A) digesting each DNA sample with a methylation-sensitive and/or methylation-dependent restriction endonuclease;
[0163] (B) performing PCR on each digested DNA amplifying at least two genomic loci of which at least one is a restriction locus;
[0164] (C) for each DNA sample, determining the intensity of the signal of each amplification product;
[0165] (D) for each DNA sample, calculating "signal ratios" between the intensities of the signals produced by the loci;
[0166] (E) calculating the differential methylation measure between DNA samples by performing a quantitative comparison of their corresponding signal ratios.
[0167] In one embodiment of this method, the distance measure is sum of absolute differences between the signal ratios of the DNA samples.
[0168] In another embodiment of this method, the distance measure is the square-root of the sum of squared differences between the signal ratios of the DNA samples.
[0169] In one embodiment of this method, the distance measured between a subject sample and a reference healthy sample indicates the amount of medication required to treat a pathological state.
[0170] In another embodiment of this method, the distance measured between a DNA sample obtained from cultured cells to a reference sample indicates the number of sub-culturing procedures that the cells underwent.
[0171] Another aspect of the present invention is a primer selected from the group consisting of:
TABLE-US-00005 1. GCAGCAGGCCGCGGAGAAG; 2. AGCAGCTGTGCCGGGCCAG; 3. CAGCAACAGCACCCAGCTTG; 4. CACAGGCTCAGTCGCGGATC; 5. AGGAAACCTCAGTAGCAAAATTG; 6. GCGAGACTTTAGGTGTGCATC; 7. CGTAGGCTGCGGTGAGCTC; 8. GATCCATGCCCGCTGGGATG; 9. CAGCCTAGACGTCAAGTTACAG; 10. ACGACCTCCGGATCCAACTG; 11. CCCAGCTGGTTGGACATGTTG; 12. CACTTCCTTCGTGGACGCC; 13. GAGAAGCGGGAGGATGAGAC; 14. CCGCATCTCCTCCGTCCTG; 15. GCCTTCAGCAGGAAGTCCAC; 16. CCTGTGCCTCACACAGACTC; 17. GTGCATGGTGTCTGGTACTTC; 18. GAAGCTCTCGTGGACTACTTG; 19. CAGCCTGCTCTTCACTGCAG; 20. AGAGGCCGATGAAGCCGTAG; 21. CTCCCTGATTTACGACAAGTTC; 22. GACAGTATGCTGATGCTTCTTG; 23. AAGGGCAGAGTTCCGCTGTC; 24. CGGATGCAGGAGGATCCTAG; 25. CGGACCAGATTGCTGGTCAC; 26. CGACCTTGCCAGATGTTTGAC; 27. AGCCTCATCCACACTGACCAG; 28. TCAGAGCTCTCCTATCTGGAC; 29. GCCAGGCCGTTGATGATGAC; and 30. GAATATGGAGCCCTGGGCAG 31. AAGAGCCCATCAGGCAGGTC 32. GTTTCTTGTCGAGCAGCACGTGGATGATG 33. CTCCAGAACTGGAACTTCCTG 34. GTTTCTTAACTTGGAGACGACGGCATC 35. TGGAGGACAATGCCCTGGTG 36. GTTTCTTGGCTTCACCTGCGACCGTCTC 37. CCCTCCGAGTGGCCAGCAG 38. GTTTCTGACCACTGCCGTGGGAATG 39. CTTCTCAGCCAATGGGAAGAG 40. ACGTAGAAGGACCCGAGGAC 41. TACAGACAAATCACTCAGCAGC 42. GTTTCTTGTCTGACACTCGGTTGTAGGTATT 43. GGACGAGTTAACTTCCTTAATTTC 44. GTTTCTTCGCGGAACCTGGTTTAACTTC
[0172] Another aspect of the present invention is a primer pair for amplifying a specific human genomic locus selected from the group consisting of:
TABLE-US-00006 1. L91762 (forward GCAGCAGGCCGCGGAGAAG (FAM); reverse AGCAGCTGTGCCGGGCCAG); 2. L68346 (forward CAGCAACAGCACCCAGCTTG (JOE); reverse CACAGGCTCAGTCGCGGATC); 3. L50468 (forward AGGAAACCTCAGTAGCAAAATTG (JOE); reverse GCGAGACTTTAGGTGTGCATC); 4. L14432 (forward CGTAGGCTGCGGTGAGCTC (FAM); reverse GATCCATGCCCGCTGGGATG); 5. L4648 (forward CAGCCTAGACGTCAAGTTACAG (JOE); reverse ACGACCTCCGGATCCAACTG); 6. L39664 (forward CCCAGCTGGTTGGACATGTTG (FAM); reverse CACTTCCTTCGTGGACGCC); 7. L30139 (forward GAGAAGCGGGAGGATGAGAC (FAM); reverse CCGCATCTCCTCCGTCCTG); 8. L55429 (forward GCCTTCAGCAGGAAGTCCAC (JOE); reverse CCTGTGCCTCACACAGACTC); 9. L62086 (forward GTGCATGGTGTCTGGTACTTC (FAM); reverse GAAGCTCTCGTGGACTACTTG); 10. L76138 (forward CAGCCTGCTCTTCACTGCAG (JOE); reverse AGAGGCCGATGAAGCCGTAG); 11. L15952 (forward CTCCCTGATTTACGACAAGTTC (FAM); reverse GACAGTATGCTGATGCTTCTTG); 12. L36599 (forward AAGGGCAGAGTTCCGCTGTC (FAM); reverse CGGATGCAGGAGGATCCTAG); 13. L26688 (forward CGGACCAGATTGCTGGTCAC (JOE); reverse CGACCTTGCCAGATGTTTGAC); 14. L81528 (forward AGCCTCATCCACACTGACCAG (JOE); reverse TCAGAGCTCTCCTATCTGGAC); 15. L36556 (forward GCCAGGCCGTTGATGATGAC (JOE); reverse GAATATGGAGCCCTGGGCAG). 16. SD1 (forward AAGAGCCCATCAGGCAGGTC (FAM); reverse GTTTCTTGTCGAGCAGCACGTGGATGATG); 17. SD2 (forward CTCCAGAACTGGAACTTCCTG (FAM); reverse GTTTCTTAACTTGGAGACGACGGCATC); 18. SD3 (forward TGGAGGACAATGCCCTGGTG (FAM); reverse GTTTCTTGGCTTCACCTGCGACCGTCTC); 19. SD4 (forward CCCTCCGAGTGGCCAGCAG (FAM); reverse GTTTCTGACCACTGCCGTGGGAATG); 20. SD5 (forward CTTCTCAGCCAATGGGAAGAG (FAM); reverse ACGTAGAAGGACCCGAGGAC); 21. SD6 (forward TACAGACAAATCACTCAGCAGC (FAM); reverse GTTTCTTGTCTGACACTCGGTTGTAGGTATT); and 22. L16264 (forward GGACGAGTTAACTTCCTTAATTTC (FAM); reverse GTTTCTTCGCGGAACCTGGTTTAACTTC).
BRIEF DESCRIPTION OF THE DRAWINGS
[0173] FIGS. 1A-D. Tissue identification assay. (A) Schematic overview of the assay. (B) Biochemical procedure--methylated loci remain intact during digestion and subsequently are amplified efficiently in the PCR, producing a strong signal (locus A) while unmethylated loci are digested and subsequently amplify inefficiently in the PCR, producing a weak signal (Locus B). The signal ratio (SR; rfu of locus A/rfu of locus B) reflects the differential methylation level between loci A and B. (C) Signal ratios between locus 1 and locus 2 are different in blood, saliva, skin, and semen, reflecting the differential methylation patterns in these tissues. (D) The observed differences in signal ratios between blood and semen (i.e. the signal) are more than a magnitude greater than the observed differences in signal ratios obtained from different PCRs and from different amounts of input DNA (i.e. the noise).
[0174] FIG. 2. Tissue identification of different tissue types. Electropherograms of 8 samples (2 samples from each of 4 different tissues) are depicted demonstrating the distinct amplification pattern observed for each tissue type.
[0175] FIGS. 3A-D. Combined semen detection and DNA profiling. (A,B) Electropherograms of the combined assay performed on a semen (A) and urine (B) sample from the same individual. The ProfilerPlus profiles of the samples are identical, and the differences in tissue source are indicated by the differential amplification of two semen detection loci (arrows). (C) FAM channel data of the combined assay performed on samples from different tissue types. The signal ratio between the semen detection loci (arrows) is 25.04 in the semen sample, and less than 0.1 in all other tissue types. The top panel includes undigested DNA for reference. (D) FAM channel data of the combined assay performed on mixtures of semen and saliva (from different individuals) with various ratios. The signal ratio is correlated to the percentage of semen in the mixture.
[0176] FIG. 4. Assessment of HhaI digestion. DNA samples of different sources were subjected to the same single digestion-amplification reaction used in the tissue identification experiments. In this experiment, the panel of loci consisted of two loci: an undigested control locus (L98328) that lacks an HhaI site and a digested control locus (SW14) thath is unmethylated in these tissues. All samples showed presence of the undigested control locus and complete absence of the digested control locus, indicating complete digestion by HhaI in contrast to the undigested sample which showed presence of both loci.
[0177] FIG. 5. Aged samples. The stand-alone tissue identification assay was tested on DNA samples extracted from 20-month old stains of blood and semen. Both samples amplified well, similar to their fresh counterparts, and their source was correctly identified by the analysis software.
[0178] FIG. 6. Simulation of degraded samples. Blood (top) and semen (bottom) samples were partially digested using DNAseI and analyzed with the combined semen detection and profiling assay. Although only partial profiles were obtained for both samples, the smaller tissue identification loci (the two loci in the top channel to the left of D3S1358) amplified successfully with the expected pattern, and the algorithm correctly identified the presence/absence of semen in these samples.
[0179] FIG. 7. Table 1.
[0180] FIG. 8. Table 2.
[0181] FIG. 9. Table 3.
[0182] FIG. 10. Table 4.
[0183] FIG. 11. Table 5.
[0184] FIG. 12. Stand alone semen detection assay. Sample plots of 6 DNA samples from different tissue types are depicted. Correct categorization (semen vs. non-semen) was achieved for all samples. For each sample the confidence level of the least likely category is shown (e.g. for a "semen" categorization, the p value of non-semen is shown)
DETAILED DESCRIPTION
[0185] 1. Introduction
[0186] The present invention relates to methods and assays that enable distinguishing between sources of DNA using loci-specific primers and commercially available enzymes. An underlying aspect of an inventive assay is the comparison of signals from at least two loci amplified from a particular source of DNA, which ultimately yields a numerical ratio that indicates whether that source of the DNA sample is, in one embodiment, natural or artificial. The inventive assays also can be used to distinguish between, for example, different physiological and pathological sources of DNA and between different tissues.
[0187] The signal ratios employed by the assay are correlated to methylation levels at specific genomic loci, but do not indicate actual methylation levels at any genomic locus. Therefore the invention setup eliminates the requirement for external DNA species and/or controls, thereby both simplifying and increasing the accuracy of the assay.
[0188] The inventive DNA categorization assays described herein are therefore powerful, multiplex, accurate, and inexpensive techniques applicable in any setting that calls for the categorization of a DNA sample. Thus, the inventive assays can be used, for example, by the police in a forensics capacity; the health care industry for diagnostic and therapeutic purposes; in the insurance industry to verify claims pursuant to anti-discrimination genetic laws, such as the Genetic Information Nondiscrimination Act (H.R. 493); by prosecutors and defense counsel for evidentiary purposes in criminal trials and civil proceedings and appeals; and the food and agriculture industry to verify the integrity of meats, crops, and plants such as grapevines and sources of coffee. The present invention is not limited to this non-exclusive, but representative, list of applications.
[0189] An underlying principle of a method disclosed herein therefore is the measurement of signal intensities between amplified genomic loci and their subsequent pairwise comparison against each other to produce ratios of signal intensities between the amplified loci. For example, if loci A, B, C, and D are all amplified according to the techniques described herein, then the signal intensity for each of A, B, C, and D is measured and recorded. Then, the signal intensities of A and B, A and C, and A and D are compared respectively and signal intensity ratios calculated for each of the A/B, A/C and A/D combinations. Then, the signal intensity ratios of B/C and B/D are calculated, and so on.
[0190] The value of each of those signal intensity ratios can then be compared against the values of known reference signal intensity ratios of DNAs whose source of origin is known. Thus, for instance, in the case of DNA whose source of origin is known to be human semen, the signal intensity ratios of loci, such as the pairwise ratios of the A, B, C, and D illustrative loci are known, or can be readily established afresh when analysing a test DNA sample. Thus the DNA category is "semen" and its respective signal intensity ratios for those loci are reference values against which the test DNA sample may be compared.
[0191] Accordingly, after establishing the various signal intensity ratios of loci A, B, C, and D, from the DNA sample, each ratio can be compared against one or more reference values of particular known categories of DNA, e.g., against the semen DNA ratio values. The ratio of any loci combination from the DNA sample that more closely approximates the signal intensity ratio reference value of a particular DNA category means it is highly likely that the tested DNA sample originated from that particular category of DNA to which it more or most closely approximates when compared. Thus, a signal intensity ratio from the tested DNA sample of the A/B loci that is the same as, or close to, the value of the signal intensity ratio of the A/B loci from semen indicates that the tested DNA sample likely originated from semen. By conducting the same comparative analysis across many different loci, and against many different reference categories, the likelihood that the tested DNA sample originated from a particular biological source, or that it did not originate from a particular biological source, increases.
[0192] Similarly, in a situation where a sample might comprise mixtures of DNA from different sources, such as saliva and blood, or saliva, blood, epidermis, and semen, it will be possible, by performing the methods disclosed herein, to identify the presence of different categories of DNAs within the sample. Thus, the identification of multiple as well as sole sources of DNA present in a sample can be achieved using the methods and reagents disclosed herein.
[0193] Accordingly, the present "categorization" methods can also be thought of as a tissue identification assay. In one example, as explained in the following passage, a tissue identification assay uses a panel of loci that are differentially methylated between tissues to determine the most probable source tissue of a DNA sample. See Table 1 (FIG. 7). A scheme of the assay is presented in FIG. 1A. DNA from a forensic sample is digested with, for example, the HhaI methylation-sensitive restriction enzyme, which cleaves DNA at its recognition sequence GCGC only if it is unmethylated (while leaving methylated targets intact).
[0194] A panel of tissue identification loci is then amplified by PCR from the digested DNA using fluorescently-labeled primers, and an aliquot of amplified products is separated by capillary electrophoresis. In the situation with HhaI-digested DNA, loci with higher methylation levels are amplified with higher efficiency because more DNA molecules are protected from digestion, producing a relatively strong signal in the electropherogram (FIG. 1B, locus A). Conversely, loci with a lower methylation level are amplified with lower efficiency, yielding a relatively weak signal in the electropherogram (FIG. 1B, locus B).
[0195] Automated signal analysis software disclosed herein enables analysis of an output electropherogram, and assigns heights (in rfu) to amplicons corresponding to tissue identification loci. Thus, the height of a single locus is correlated with its methylation level. Ratios of methylation levels between co-amplified loci can then be calculated as described generically above. For each pair of loci a signal ratio, calculated as the ratio between the heights of the first and second loci, and this ratio reflects the ratio between the methylation levels of the corresponding loci.
[0196] All calculated signal ratios can then be combined into a single numerical value. For example, 105 pairwise ratios can be calculated from a panel of 15 loci (e.g., as between locus 1 and 2, locus 1 and 3, etc.). Those can then be compared to a database of reference values obtained from a data set of samples of known tissue origin. The tissue identification algorithm calculates for each potential tissue source a likelihood score, reflecting the likelihood that the DNA sample originated from that tissue, and the output of the algorithm is the most likely tissue. Disclosed elsewhere herein are algorithms and specific calculations for deriving likelihood and probability scores from these ratios and comparisons.
[0197] As shown in Example 1, for instance, such a tissue identification assay was performed on 50 samples: 14 blood, 14 saliva, 11 semen, and 11 skin epidermis using a panel of 15 tissue identification loci, ranging in amplicon size from 66 to 150 bps. FIG. 2 depicts electropherograms of eight of these samples--two of each tissue type. Each tissue type had a distinct methylation profile. For example, the ratio of the L91762/L68346 loci in semen samples ranged from 0.04-0.53 and was higher in all other tissue samples (2.15-18.28; see Table 2 in FIG. 8). Therefore a low L91762/L68346 ratio was found to be distinctive of semen samples. The ratio of the L76138/L26688 loci, however, was low in blood and saliva (0.08-1.54) and higher in semen and skin epidermis (2.04-19.56; Table 2 in FIG. 8). Therefore a high ratio of L91762/L68346 concomitant with a high ratio of L76138/L26688 was distinctive of skin epidermis samples
[0198] The tissue identification algorithm disclosed herein correctly identified the true tissue source of all 50 samples. Further analysis of the data using subsets of tissue identification loci revealed that the full set of 15 loci was redundant and 100% identification was achieved by using only 7 out of the 15 loci (L91762, L68346, L50468, L14432, L30139, L15952, and L26688).
[0199] Accordingly, this illustrative example corroborates the generic inventive aspect of the present invention, namely that the comparative signal intensity ratio analyses provides exacting and correct DNA sample identification and categorization.
[0200] Furthermore, another significant aspect of the present invention is that it can readily complement and expand the usefulness of existing commercial DNA profiling kits to do more than profile a particular subject's DNA. The combination of the inventive assays disclosed herein, such as the signal ratio assay described in detail below, with Promega Corporation's PowerPlex® 16 kit, for example, enables a user to not only profile an individual's DNA composition but also to determine whether the profiled DNA is from a natural source or has been artificially synthesized. In another example, combining DNA profiling with DNA categorization enables a user to both profile DNA and determine the source tissue of the DNA sample.
[0201] For instance, one assay described herein may employ both conventional profiling of a DNA sample, for example with the PowerPlex16 kit (Promega), and categorization of DNA into categories of natural vs. artificial. See, for instance, Example 6 below.
[0202] For illustrative purposes only of how combined categorization and profiling may work together as disclosed herein, two samples of DNA are analyzed: (1) a natural DNA sample extracted from the blood of subject A, and (2) an artificial DNA sample synthesized by in vitro multiple displacement amplification using a commercial kit from a minute quantity of subject A's real DNA as template.
[0203] Furthermore, this illustration demonstrates how the present inventive method is far superior to any existing method because it is able to distinguish artificial DNA from natural DNA samples even though conventional profiling kits would identify both samples as identical to one another--because both the natural and artificial DNA are from subject A. Accordingly, notwithstanding the fact that the profiling kit would identify the samples as the same, the present inventive signal intensity ratio analyses can readily tell them apart and identify one profile as generated from artificial DNA, while the other profile was generated from natural DNA.
[0204] To explain further, the two samples are first profiled with PowerPlex16 and analyzed using a conventional profiling software, such as GeneMapperID-X. The scheme of this procedure can be briefly described as (1) performing multiplex PCR using the PowerPlex16 primer mix on a DNA sample; (2) separating the amplification products on a capillary electrophoresis machine; and then (3) analyzing the output data with, for instance, the GeneMapperID-X software. For each of the samples, the end product of this assay is a profile. The profiles of the two samples are identical. See FIGS. 9A-B.
[0205] Furthermore, the GeneMapperID-X software determined the profiles of both samples to be single contributor (i.e. from a single person) profiles, with no anomalies. This shows that a profile obtained from artificial DNA can be identical to a profile obtained from natural DNA. See D. Frumkin, et al., Authentication of forensic DNA samples, Forensic Sci. Int. Genet. (2009), doi:10.1016/j.fsigen.2009.06.009, which is incorporated herein by reference.
[0206] Both samples of DNA were subsequently also analyzed by a combined profiling and categorization assay based on the following scheme: digest a DNA sample with HhaI and perform multiplex PCR using the PowerPlex16 primer mix with the addition of primers for amplifying an additional locus, such as Hypo23; separating the amplification products on a capillary electrophoresis machine; and analyzing the output data with the capillary analyzer software, such as the software algorithm disclosed herein.
[0207] For each sample, the end product of this assay is a profile and assignment of category. As can be seen in FIGS. 9C and D, the natural DNA was assigned as "natural," in contrast to the artificial sample which was assigned as "artificial."
[0208] In this particular example, the assignment of category was performed by analysis of three parameters: (1) SR1 (signal ratio of TPOX/D8S1179), (2) SR2 (signal ratio of D3S1358/H o23), and (3) RR (representation ratio of OCA2/D3S1358).
[0209] The threshold values for these parameters are provided in Table 6:
TABLE-US-00007 TABLE 6 SR1 SR2 RR Threshold for natural >=0.9 >=10 >=2 Threshold for artificial <0.9 <10 <2
[0210] The observed values for these parameters, and the assigned category are provided in Table 7 (values that are above the threshold for natural DNA are shaded).
TABLE-US-00008 TABLE 7 SR1 SR2 RR Category Natural DNA sample ##STR00001## ##STR00002## ##STR00003## Natural Artificial DNA sample 0.06 2.06 ##STR00004## Artificial
[0211] Assignment of the category was performed according to the following rule:
[0212] If all observed parameter values are above their respective thresholds for natural DNA, then assign a "natural" category, otherwise assign an "artificial" category. Thus, the present inventive signal intensity ratio analyses can readily identify sources of DNA, such as for example from natural vs. artificial sources, and in conjunction with DNA profiling techniques provides a powerful and sophisticated method for identifying genomic materials.
[0213] Specific compositions, methods, or embodiments discussed are intended to be only illustrative of the invention disclosed by this specification. Variations on these compositions, methods, or embodiments are readily apparent to a person of skill in the art based upon the teachings of this specification and are therefore intended to be included as part of the inventions disclosed herein.
[0214] In practicing the present invention, many conventional techniques in molecular biology and recombinant DNA are used. These techniques are explained in, e.g., Current Protocols in Molecular Biology, Vols. I-III, Ausubel, Ed. (1997); Sambrook et al., Molecular Cloning: A Laboratory Manual, Second Ed. (Cold Spring Harbor Laboratory Press, Cold Spring Harbor, N.Y., 1989); DNA Cloning: A Practical Approach, Vols. I and II, Glover, Ed. (1985); Oligonucleotide Synthesis, Gait, Ed. (1984); Nucleic Acid Hybridization, Hames & Higgins, Eds. (1985); Transcription and Translation, Hames & Higgins, Eds. (1984); Perbal, A Practical Guide to Molecular Cloning; the series, Meth. Enzymol., (Academic Press, Inc., 1984); Gene Transfer Vectors for Mammalian Cells, Miller & Calos, Eds. (Cold Spring Harbor Laboratory, NY, 1987); and Meth. Enzymol., Vols. 154 and 155, Wu & Grossman, and Wu, Eds., respectively.
[0215] 2. Definitions
[0216] The present technology is described herein using several definitions, as set forth throughout the specification. Unless defined otherwise, all technical and scientific terms used herein generally have the same meaning as commonly understood by one of ordinary skill in the art to which this invention belongs. As used herein, unless otherwise stated, the singular forms "a," "an," and "the" include plural reference. Thus, for example, a reference to "a nucleic acid" is a reference to one or more nucleic acids.
[0217] As used herein, the term "allele" is intended to be a genetic variation associated with a segment of DNA, i.e., one of two or more alternate forms of a DNA sequence occupying the same locus.
[0218] The term "artificial DNA" or "artificially-synthesized DNA" or "artificial nucleic acid" as used herein refers to a nucleic acid which is synthesized by various in vitro methods. Herein disclosed are the characterizations of different methods for synthesizing DNA in vitro. Such in vitro generated nucleic acids include, but are not limited to:
[0219] 1. Chemically synthesized oligonucleotides.
[0220] 2. Products of PCR amplification of target sequences.
[0221] 3. Products of Rolling circle amplification (RCA) of circular target sequences.
[0222] 4. Products of molecular cloning (e.g. plasmids cloned in E. coli.)
[0223] 5. DNA fragments assembled from other DNA fragments that were generated by any of methods 1-4, or a combination of them. Such assembly being achieved by any of the following methods (or a combination of them): annealing, ligation, polymerization. The process of assembly may also include steps of breaking DNA molecules (e.g. by restriction endonucleases, mechanical shearing etc.)
[0224] 6. Products of PCR-based Whole genome amplification (WGA), and/or ligation mediated PCR (LMP)-based WGA methods, including primer extension preamplification (PEP)-PCR, degenerate oligonucleotide primed (DOP)-PCR, T7-based linear amplification of DNA (TLAD), Adaptor-Ligation PCR. The Genomeplex (Sigma) commercial kit utilizes Adaptor-Ligation PCR.
[0225] 7. Products of WGA by Multiple displacement amplification (MDA) and Restriction and Circularization-Aided Rolling Circle Amplification (RCA-RCA). The Repli-G (Qiagen), and GenomiPhi (GE Healthcare) commercial kits utilize this method.
[0226] 8. A mix of products from any of 1-7.
[0227] 9. Products from any of 1-8 in which all or some products were methylated in vitro following their synthesis (e.g. by Sss1 Methylase).
[0228] 10. Products from any of 1-8 mixed with natural DNA.
[0229] 11. Products from 9 mixed with natural DNA.
[0230] The term "biological sample" or "test sample" as used herein, refers to, but is not limited to, any biological sample derived from, or obtained from, a subject. The sample may comprise nucleic acids, such as DNAs or RNAs. In some embodiments, samples are not directly retrieved from the subject, but are collected from the environment, e.g. a crime scene or a rape victim. Examples of such samples include but are not limited to fluids, tissues, cell samples, organs, biopsies, etc. Suitable samples include but are not limited to are blood, plasma, saliva, urine, sperm, hair, etc. The biological sample can also be blood drops, dried blood stains, dried saliva stains, dried underwear stains (e.g. stains on underwear, pads, tampons, diapers), clothing, dental floss, ear wax, electric razor clippings, gum, hair, licked envelope, nails, paraffin embedded tissue, post mortem tissue, razors, teeth, toothbrush, toothpick, dried umbilical cord. Genomic DNA can be extracted from such samples according to methods known in the art. (for example using a protocol from Sambrook et al., Molecular Cloning: A Laboratory Manual, Second Ed., Cold Spring Harbor Laboratory Press, Cold Spring Harbor, NY, 1989);
[0231] The term "capillary electrophoresis histogram" as used herein refers to a histogram obtained from capillary electrophoresis of PCR products wherein the products were amplified from genomic loci with fluorescent primers.
[0232] The term "methylated" as used herein means methylated at a level of at least 80% (i.e. at least 80% of the DNA molecules methylated) in DNA of cells of tissues including blood, saliva, semen, epidermis, nasal discharge, buccal cells, hair, nail clippings, menstrual excretion, vaginal cells, urine, and feces.
[0233] The term "partially-methylated" as used herein means methylated at a level between 20-80% (i.e. between 20-80% of the DNA molecules methylated) in DNA of cells of tissues including blood, saliva, semen, epidermis, nasal discharge, buccal cells, hair, nail clippings, menstrual excretion, vaginal cells, urine, and feces.
[0234] The term "unmethylated" as used herein means methylated at a level less than 20% (i.e. less than 20% of the DNA molecules methylated) in DNA of cells of tissues including blood, saliva, semen, epidermis, nasal discharge, buccal cells, hair, nail clippings, menstrual excretion, vaginal cells, urine, bone, and feces. The methods provided herein have been demonstrated to distinguish methylated and unmethylated forms of nucleic acid loci in various tissues and cell types including blood, saliva, semen, epidermis, nasal discharge, buccal cells, hair, nail clippings, menstrual excretion, vaginal cells, urine, bone, and feces.
[0235] The terms "determining," "measuring," "assessing," "assaying," and "evaluating" are used interchangeably to refer to any form of quantitative or qualitative measurement, and include determining if a characteristic, trait, or feature is present or not. Assessing may be relative or absolute. "Assessing the presence of" includes determining the amount of something present, as well as determining whether it is present or absent.
[0236] The term "forensics" or "forensic science" as used herein refers to the application of a broad spectrum of methods aimed to answer questions of identity being of interest to the legal system. For example, the identification of potential suspects whose DNA may match evidence left at crime scenes, the exoneration of persons wrongly accused of crimes, identification of crime and catastrophe victims, or establishment of paternity and other family relationships.
[0237] The term "locus" (plural--loci) refers to a position on a chromosome of a gene or other genetic element. Locus may also mean the DNA at that position. A variant of the DNA sequence at a given locus is called an allele. Alleles of a locus are located at identical sites on homologous chromosomes. A restriction locus is a locus that contains the recognition sequence of the restriction enzyme used in the assay. The term digested control locus as used herein refers to a genomic locus known to be unmethylated in all potential DNA categories. The term undigested control locus as used herein refers to a genomic locus that is either known to be methylated in all potential DNA categories, or is a genomic locus lacking the recognition sequence of the endonuclease used in the assay.
[0238] The term "natural DNA" or "natural nucleic acid" as used herein refers to, but is not limited to, nucleic acid which originates directly from the cells of a subject without modification or amplification.
[0239] The term "nucleic acid" as used herein refers to, but is not limited to, genomic DNA, cDNA, hnRNA, mRNA, rRNA, tRNA, fragmented nucleic acid, and nucleic acid obtained from subcellular organelles such as mitochondria. In addition, nucleic acids include, but are not limited to, synthetic nucleic acids or in vitro transcription products.
[0240] The term "nucleic-acid based analysis procedures" as used herein refers to any identification procedure which is based on the analysis of nucleic acids, e.g. DNA profiling.
[0241] The term "polymerase chain reaction (PCR) stutter" as used herein refers to PCR byproducts, obtained along with the main PCR product. These "stutter" byproducts are usually shorter by multiples of the repeated unit produced in the course of PCR amplification of STR sequences. The mechanism by which these artifacts are formed is understood, but it represents an intrinsic limitation of the PCR technology and therefore no effective remedy has been found to eliminate these spurious products (Olejniczak M, Krzyzosiak WJ., Electrophoresis. 2006 Oct; 27 (19):3724-34). The term "-1 stutter" as used herein refers to a stutter byproduct that is one repeat unit smaller than its associated allele. Similarly, "+1 stutter" refers to a stutter byproduct that is one repeat unit larger than its associated allele. The term `-1 stutter fraction` refers to the height (or area) of the -1 stutter peak divided by the height (or area) of the true allele peak. Similarly, "+1 stutter fraction" refers to the height (or area) of the +1 stutter peak divided by the height (or area) of the true allele peak.
[0242] The term "Restriction and Circularization-Aided Rolling Circle Amplification (RCA-RCA)" refers to a whole genome amplification procedure which retains the allelic differences among degraded amplified genomes while achieving almost complete genome coverage. RCA-RCA utilizes restriction digestion and whole genome circularization to generate genomic sequences amenable to rolling circle amplification.
[0243] The term "STR primers" as used herein refers to any commercially available or made-in-the-lab nucleotide primers that can be used to amplify a target nucleic acid sequence from a biological sample by PCR. There are approximately 1.5 million non-CODIS STR loci. Non-limiting examples of the above are presented in the following website www.csanist.gov/biotech/strbase/str_ref.htm that currently contains 3156 references for STRs employed in science, forensics and beyond. In addition to published primer sequences, STR primers may be obtained from commercial kits for amplification of hundreds of STR loci (for example, ABI Prism Linkage Mapping Set-MD10 -Applied Biosystems), and for amplification of thousands of SNP loci (for example, Illumina BeadArray linkage mapping panel). The term "CODIS STR primers" as used herein refers to STR primers that are designed to amplify any of the thirteen core STR loci designated by the FBI's "Combined DNA Index System," specifically, the repeated sequences of TH01, TPOX, CSF1PO, VWA, FGA, D3S1358, D5S818, D7S820, D135317, D165539, D8S1179, D18551, and D21S11, and the Amelogenin locus.
[0244] The term "signal ratio" as used herein refers to the ratio between the intensities of the signals obtained from amplification of two loci.
[0245] 3. Methods for Distinguishing Between Natural and Artificial DNA Samples
[0246] In one aspect, the present invention provides a method for distinguishing between natural and artificial DNA samples. A general scheme of the invention is as follows: the method accepts as input a DNA sample. The DNA undergoes a procedure including one or more biochemical steps followed by signal detection. In the last step of the procedure, the signal is analyzed to determine whether the DNA is natural or artificial. In another aspect, the present invention provides a method for verifying that a DNA profile is of natural DNA. A general scheme of the invention is as follows: the method accepts as an input a DNA sample that underwent profiling (e.g. with Identifiler). The DNA sample undergoes a verification procedure which includes one or more biochemical steps followed by signal detection. In the last step of the entire procedure, data from both profiling and verification of the DNA sample are analyzed. The signal analysis determines whether the profile obtained from the DNA sample represents natural (in vivo) or artificial (in vitro) DNA.
[0247] In various aspects, the methods of the present invention concern the verification that DNA profiles represent natural DNA. The methods are employed on a DNA sample in question, for example, DNA from a blood sample found at a crime scene. The isolation of nucleic acids (e.g. DNA) from a biological sample may be achieved by various methods known in the art (e.g. see Sambrook et al, (1989) Molecular Cloning: A Laboratory Manual, 2nd ed. Cold Spring Harbor, New York). Distinguishing between natural and artificial DNA, or the determination whether a DNA profile represents natural DNA, may be accomplished using various strategies, including those described in the following sections.
[0248] 4. Methylation
[0249] Methylation in the human genome occurs in the form of 5-methyl cytosine and is confined to cytosine residues that are part of the sequence CG (cytosine residues that are part of other sequences are not methylated).
[0250] Some CG dinucleotides in the human genome are methylated, and others are not. In addition, methylation is cell and tissue specific, such that a specific CG dinucleotide can be methylated in a certain cell and at the same time unmethylated in a different cell, or methylated in a certain tissue and at the same time unmethylated in different tissues. Since methylation at a specific locus can vary from cell to cell, when analyzing the methylation status of DNA extracted from a plurality of cells (e.g. from a forensic sample), the signal can be mixed, showing both the methylated and unmethylated signals in varying ratios. The inventors discovered that in some genomic regions all CG loci are constitutively methylated.
[0251] These regions are provided in Table 1 and in the section herein entitled Sequences. The inventors also discovered that in some genomic regions all CG loci are partially methylated. These regions are provided in Table 1 and in the section herein entitled Sequences. The inventors also discovered that in some genomic regions all CG loci are constitutively unmethylated. These regions are provided in Table 1 and in the section herein entitled Sequences. The inventors also discovered contiguous genomic regions containing constitutively methylated, partially methylated, and constitutively unmethylated CG loci. These regions are provided in Table 1 and in the section herein entitled Sequences. There are several different methods for determining the methylation level of genomic loci. Examples of methods that are commonly used are bisulfite sequencing, methylation-specific PCR, and methylation-sensitive endonuclease digestion. Further, various data sources are available for retrieving or storing DNA methylation data and making these data readily available to the public, for example MetDB (http://www.methdb.net).
[0252] Exemplary methods for determining the methylation level of nucleic acids include, but are not limited to the following methods:
[0253] Bisulfite sequencing. Bisulfite sequencing is the sequencing of bisulfite treated-DNA to determine its pattern of methylation. The method is based on the fact that treatment of DNA with sodium bisulfite results in conversion of non-methylated cytosine residues to uracil, while leaving the methylated cytosine residues unaffected. Following conversion by sodium bisulfite, specific regions of the DNA are amplified by PCR, and the PCR products are sequenced. Since in the polymerase chain reaction uracil residues are amplified as if they were thymine residues, unmethylated cytosine residues in the original DNA appear as thymine residues in the sequenced PCR product, whereas methylated cytosine residues in the original DNA appear as cytosine residues in the sequenced PCR product.
[0254] 5. Methylation-Specific PCR
[0255] Methylation specific PCR is a method of methylation analysis that, like bisulfite sequencing, is also performed on bisulfite-treated DNA, but avoids the need to sequence the genomic region of interest. Instead, the selected region in the bisulfite-treated DNA is amplified by PCR using two sets of primers that are designed to anneal to the same genomic targets. The primer pairs are designed to be "methylated-specific" by including sequences complementing only unconverted 5-methylcytosines, or conversely "unmethylated-specific," complementing thymines converted from unmethylated cytosines. Methylation is determined by the relative efficiency of the different primer pairs in achieving amplification.
[0256] It should be understood in the context of the present invention that methylation specific PCR determines the methylation level of CG dinucleotides in the primer sequences only, and not in the entire genomic region that is amplified by PCR. Therefore, CG dinucleotides that are found in the amplified sequence but are not in the primer sequences are not part of the CG locus.
[0257] 6. Methylation-Sensitive Endonuclease Digestion
[0258] Digestion of DNA with methylation-sensitive endonucleases represents a method for methylation analysis that can be applied directly to genomic DNA without the need to perform bisulfite conversion. The method is based on the fact that methylation-sensitive endonucleases digest only unmethylated DNA, while leaving methylated DNA intact. Following digestion, the DNA can be analyzed for methylation level by a variety of methods, including gel electrophoresis, and PCR amplification of specific loci.
[0259] In the procedure based on methylation-sensitive endonuclease digestion, each CG locus is comprised of one or more CG dinucleotides that are part of recognition sequence(s) of the methylation-sensitive restriction endonuclease(s) that are used in the procedure. CG dinucleotides that are found in the amplified genomic region, but are not in the recognition sequence(s) of the endonuclease(s) are not part of the CG locus.
[0260] In one embodiment, the one or more CG loci that are detected are partially methylated in natural DNA, but would be unmethylated in artificial DNA. Partial methylation would be expected to result in a mixture of T and C at the position being interrogated. Hybridization would be observed to both the T specific probes/primers and the C specific probes/primers, similar to detection of a heterozygous SNP. Relative amounts of hybridization may be used to determine the relative amount of methylation. Alternatively, both C and T would be observed upon bisulfite sequencing. Alternatively, fluorescent signals corresponding to amplification products of methylated or partially methylated CG loci can be detected.
[0261] 7. Overview of the Present Signal Ratio Assay
[0262] As mentioned above, one particular assay of the present invention involves the quantitative comparison of intensity of the signals from a pair of locus-specific amplification products produced by performing a Polymerase Chain Reaction on restriction-digested DNA. See FIG. 1A,B. The numerical ratio of intensities corresponds to the category of the template DNA, for example whether the DNA sample was extracted from semen or from a non-semen tissue. For example, in one embodiment, locus 1 and locus 2 can be amplified using fluorescently labeled primers, separated by electrophoresis, and the intensity of the signals is the relative fluorescence units (rfu) of peaks corresponding to the loci. See FIG. 1B,C. The intensity of the signals will correspond to the successfulness of amplification of locus 1 and locus 2 from the source DNA template. By comparing rfu between the two amplification products one can calculate a signal ratio--a ratio that reflects the ratio of the quantities of the amplification products.
[0263] In addition, however, one aspect of this assay includes the predetermination of the expected signal ratios from various types of DNA categories. Thus, the template DNA that is subject to analysis is first digested with a methylation-sensitive restriction endonuclease before it is cycled through the quantitative-styled PCR amplification protocol. If the level of methylation at the site/s of the restriction recognition sequence/s in the pair of the two loci in the various categories of DNA is known, the skilled person can predict the expected signal ratios of amplification products of the pair of loci in the respective categories. Alternatively, if the levels of methylation are unknown, the skilled person can nonetheless empirically determine the signal ratios between a pair of genomic loci in the various categories of DNA by performing the assay on samples from known categories.
[0264] With this premise, the present inventive assays comprise digesting a DNA sample with a methylation-sensitive and/or methylation dependent enzyme, performing a PCR amplification reaction on the digested DNA, and determining the intensity of the signals from locus-specific amplification products. As mentioned, the intensity of signals can be quantified or measured by using fluorescent PCR. Determination of the category of the DNA sample is performed by comparing the observed signal ratios to reference ratios obtained from DNA samples of known categories, and determining which category corresponds best to the observed ratios.
[0265] This particular signal ratio assay is not reliant upon identifying or obtaining measurements of the absolute methylation fraction or level of selected loci. In addition, this particular signal ratio assay is not reliant upon the efficiencies of the primer pairs used, does not necessitate that both primer pairs have similar efficiencies, is not reliant upon amount of input template DNA, is not reliant upon specific thermocycler machine and reaction conditions. Rather, the assay determines the ratio between two signals which correspond to the ratio of methylation levels in the different loci. By this manner, the quantity or concentration of starting DNA material in the sample is irrelevant to the analysis and does not skew the output results. That is, the ratio of signal levels between a first locus and a second locus will remain constant regardless of how much DNA is used as a template for PCR and regardless of the number of amplification cycles that are run on the thermocycler. For example, a signal ratio of 10 between loci 1 and 2 will remain the same whether the input DNA represents methylation levels of 0.9 and 0.09 (90% methylation in locus 1 and 9% in 2), or 0.5 and 0.05 (50% methylation in locus 1 and 5% in 2), etc. In another example, a signal ratio of 10 between loci 1 and 2 will remain the same regardless of the amount of DNA template used in the reaction.
[0266] The fact that the inventive assay does not depend on determination of methylation levels at any genomic locus, and does not require any external control, allows the assay to be more accurate, cost effective, and applicable to samples with low amounts of DNA.
[0267] In the context of forensic tissue identification, the inventive assay represents a standardized procedure which is identical regardless of the specific tissue identification task that is being performed (except for the use of panel-specific primers), that requires only standard forensic procedures and equipment, thus enabling the assay to be automated and easily integrated into forensic labs.
[0268] Furthermore, the setup of the inventive assay makes possible combining tissue identification and DNA profiling into a single assay.
[0269] The fact that the inventive assay performs digestion and amplification in the same reaction minimizes the complexity (the number of required tubes and pipetting steps of the assay), thereby minimizing the risk of contamination and/or error.
[0270] This inventive assay therefore provides a useful biochemical marker in the form of, in one example, a numerical ratio, that can be used to differentiate between natural DNA and artificial DNA that was synthesized in vitro such as by PCR, chemical synthesis, or multiple displacement amplification (MDA). More particular details of this exemplary assay follow.
[0271] 8. Characteristics of Primers for Locus-Specific Amplification
[0272] Accordingly, an aspect of the present invention concerns obtaining a "signal ratio" in which the fluorescence intensities of multiple DNA loci amplification products produced from fluorescent PCR are compared to one another in order to calculate ratios between successive pairs of loci, e.g., Loci #1 vs. Loci #2; Loci #1 vs. Loci #3; Loci #1 vs. Loci #4; Loci #2 vs. Loci #3, Loci #2 vs. Loci #4, and so on. When this technique is used to test the natural vs. artificial nature of a DNA sample, the primers that are used in the signal ratio amplification reactions are chosen so as to amplify a pair of loci that are differentially methylated in natural DNA (e.g. the first is 90% methylated and the second is 30% methylated in natural DNA).
[0273] One consideration for selecting which two pairs of primers (a first pair and a second pair) to use to amplify two loci (1) and (2) is the degree to which the two loci are differentially methylated in in vivo DNA. Thus, a pair of loci in which locus (1) is more methylated in comparison to locus (2), are examples of loci that can be used to design primers for the signal ratio amplification assay.
[0274] 9. Selection of Genomic Loci 1. Selection of putative loci can be performed in any of three modes:
[0275] (i) Select a locus closest to the transcription start site of a gene that has been shown in the literature to be differentially expressed (mRNA data) in the relevant categories (e.g. different tissues).
[0276] (ii) Select a locus that has been shown in the literature to be differentially methylated between different categories (e.g. tissues).
[0277] (iii) Select a random genomic locus.
[0278] 2. Design primers for putative loci.
[0279] 3. Empirically test "informativeness" of putative loci. For each putative locus calculate the signal ratio between the putative locus and another putative locus, or alternatively, between the putative locus and an undigested control locus.
[0280] 4. Choose "informative" loci (i.e. loci whose signal ratios are significantly different in the different DNA categories) for use in the assay.
[0281] 10. Methylation-Sensitive Restriction Endonucleases
[0282] A second consideration of the present inventive method is the selection of loci that are or are not cut or digested by a methylation-sensitive and/or methylation-dependent restriction endonuclease, depending on their methylation status. The endonuclease is selected if, for instance, it is unable to cut the DNA strand if its recognition sequence in that locus is methylated. Thus, in the context of locus (1), which is methylated, and locus (2), which is not methylated, an endonuclease like HhaI or HpaII will not digest locus (1) but will digest locus (2). Accordingly, the selection of loci for amplification in the signal ratio assay may also take into account the presence of methylation-sensitive restriction endonuclease recognition sequences within each locus.
[0283] Forward and reverse primers can then be designed to anneal to a region of DNA that flanks the recognition sequence of the loci.
[0284] Accordingly, in the case of a methylation-sensitive enzyme, if a locus is methylated it will (A) not be digested but (B) it will be amplified. Conversely, if a locus is unmethylated, it will (A) be digested but (B) not amplified. In the case of a methylation-dependent enzyme, the situation is vice versa.
[0285] 11. Advantages of the Signal Ratio Assay
[0286] The signal ratio assay of the present invention has several advantages and benefits over other approaches for analyzing methylation, and therefore the skilled person would appreciate the various advantageous uses to which this signal ratio assay can be put. For instance, this assay is insensitive to various "noise" factors inherent when relying on the absolute intensity level of an amplicon signal that fluctuates as a consequence of changes in template DNA concentration, thermocycler manufacturer, and PCR conditions, and presence of inhibitors. Instead, the presently-calculated methylation ratio does not depend on such factors, since the two analyzed loci are co-amplified in the same reaction and are therefore subject to the effects of such disparities. Thus, the present inventive method does not require absolute quantification of genomic targets or amplicons; and the assay is a single stand-alone reaction with no need for a standard curve or any external controls.
[0287] The signal ratio can be performed on very small quantities of DNA in a single biochemical reaction and is therefore an inexpensive, rapid, and powerful method for establishing, for example, whether a sample contains natural or artificial DNA. An important feature of the design of the inventive methods is that it can be combined with other PCR-based procedures, such as DNA profiling, in a single biochemical reaction.
[0288] 12. Capillary Electrophoresis and Multiplexing
[0289] The rapidity of the analysis is evident in consideration of the use of, for instance, capillary electrophoresis to separate numerous amplification products produced from the amplification of multiple pairs of target loci. As described above the present signal ratio assay can be performed on multiple loci, and in each case a signal ratio is calculated for each pair of loci separately. For example, if four loci (A,B,C,D) are co-amplified in the reaction, six different signal ratios can be calculated, i.e.: A/B, A/C, A/D, B/C, B/D, C/D.
[0290] Accordingly, if "n" loci are co-amplified, then (n2-n)/2 different ratios can be calculated. Therefore, the amount of information that is provided by the present methylation assay rises exponentially with the number of analyzed loci. Capillary electrophoresis, as opposed to real-time PCR amplification methods, can distinguish between a large number of loci in a single run. For example, for DNA profiling, 17 genomic loci are routinely co-amplified from a particular DNA sample, and analyzed together. As a consequence, the performance of the present signal ratio assay on all 17 loci yields 136 independent signal ratios. Real-time PCR cannot simultaneously distinguish in a single reaction those numbers of discrete amplification products necessary to produce 136 ratios. About four loci can by distinguished by real time PCR, which corresponds to the calculation of only six ratios.
[0291] By contrast, capillary electrophoresis can readily separate out amplification products from all paired permutations of 17 loci and can therefore readily produce data to simultaneously calculate all 136 signal ratios in a single reaction. Theoretically, hundreds of loci can be run together and separated in a single capillary electrophoresis run. In order to facilitate analysis of multiple ratios, it can be advantageous to calculate a single score, herein termed "Combined Signal Score" (CSS), from these ratios. The CSS can then be used, for example, in order to ascertain whether the source DNA sample is natural or artificial.
[0292] 13. Sequences
[0293] The sequences provided herein for the various CODIS, PowerPlex® 16, and other loci commonly used for profiling, i.e., SEQ ID NOs. 1-25 are of genomic loci commonly used for STR profiling., have been analyzed herein to determine (1) the position of every cytosine-guanine (CG) dinucleotide, (2)the methylation level of all CG dinucleotides in the locus in natural DNA, and (3) the methylation sensitive and methylation dependent restriction enzyme profile for that particular locus. The sequence listing included within the text of this application therefore provides guidance to the skilled person in the identification of particular methylation-sensitive and methylation-dependent restriction endonucleases that can be used in accordance with the inventive ratio-generating assay methods. For example, SEQ ID NO. 8, which is the 751-long nucleotide sequence for the "vWA" CODIS and PowerPlex® 16-amplified locus, comprises only one CG dinucleotide at position 571. That CG and the nucleotides that immediately flank it, provide the recognition sequence for enzymes BssKI, HpaII, Nt.CviPII, and SEQ ID NOs 26-32 are genomic loci that have been found by the inventors to produce signal ratios with significantly different values between natural and artificial DNA samples. SEQ ID NOs 33-54 are genomic loci that have been found by the inventors to produce signal ratios with significantly different values (based on the Kolomogorov-Smirnov test using a threshold of p=0.05) between samples of DNA extracted from different tissues.
[0294] The sequence information provided herein also permits the skilled artisan to design forward and reverse amplification primers that anneal to regions of a selected locus that flank the CG and restriction site. Thus, the present invention is not limited to the amplification of, for instance, CODIS loci, using only those commercially available primers, although the use and availability of commercially available primers can be a more convenient and cost-effective option for performing the present inventive authentication assays.
[0295] 14. Algorithm and Software
[0296] In one embodiment, calculation of signal ratios and/or representation ratios (for example in order to determine whether a DNA profile represents natural DNA) is performed based on analysis of the signal intensities of amplification products of fluorescent PCR that are run on a capillary electrophoresis machine. The output of the capillary electrophoresis machine is a binary computer file (for example, an FSA file in the case of capillary electrophoresis machines of Applied Biosystems). This file includes information regarding the capillary electrophoresis run, including the channel data, which is the relative fluorescent units (rfus) of each fluorophore as a function of each sampling time point (called datapoint).
[0297] The present invention also describes a software program that accepts as input a file that is the output a capillary electrophoresis machine run, and calculates the fluorescence intensities of a set of loci whose amplification products were run on the capillary electrophoresis machine. Based on these intensities, the software calculates signal ratios and/or representation ratios (or combined scores based on these ratios), based on a set of predefined pairs of loci for which the ratios are defined to be calculated. Finally, the software outputs a decision based on the comparison of the calculated ratios to predefined thresholds.
[0298] Following is a scheme of this analysis performed by the software program:
[0299] 1. Subtract from the signal of each dye channel the baseline level, defined as the mean rfu level of that channel in the range 400-500 bps, and remove spectral overlap between fluorophores based on the matrix obtained from the spectral calibration procedure of the capillary electrophoresis machine.
[0300] 2. Obtain the rfu level of each analyzed locus, defined as the maximal rfu level in the range -0.5 bp to +0.5 bp of the expected size of the locus.
[0301] 3. Calculate signal ratios between a set of pairs of loci, defined as the ratio between the rfu levels of the first and second loci in the pair (to avoid division by zero assign a level of 50 rfus to all loci with rfu levels below 50).
[0302] 4. For each ratio calculated in step 3 and for each tissue type calculate a Probability Score, defined as the value of the reference probability function (see below) at the observed ratio.
[0303] 5. For each tissue type, calculate a Combined Probability Score, defined as the product of the separate Probability Scores for that tissue obtained in step 4 (where n is the number of signal ratios).
[0304] 6. For each tissue type, calculate a Likelihood Score (representing the likelihood that the DNA sample originated from that tissue), defined as the ratio between the Combined Probability Score of the tissue and the sum of the Combined Probability Scores of all tissues. The tissue with the highest Likelihood Score is considered the source tissue of the sample.
[0305] 15. Reference Probability Functions
[0306] The reference probability function of a certain pair of loci in a certain tissue is the gamma distribution function fitted to the set of signal ratios observed in samples of natural DNA of that tissue type.
[0307] 16. Correction for Incomplete Digestion
[0308] Since incomplete digestion of template DNA might occur as a result of the presence of inhibitors in the sample, it is useful to incorporate into the assay an analysis of actual digestion level. This can be achieved by incorporation of at least one "digested control locus" and at least one "undigested control locus." A digested control locus is a genomic locus known to be unmethylated in natural DNA in all potential tissues. An undigested control locus is a locus that is either known to be methylated in natural DNA in all potential tissues, or is a locus lacking the recognition sequence of the endonuclease used in the assay. The signal ratio between a digested control locus and an undigested control locus is correlated to the actual digestion level in the assay. The algorithm can make use of such loci by checking whether adequate digestion occurred (and if not--aborting analysis), and by modifying actual rfu levels of loci to values representing rfu values that would have been obtained had complete digestion occurred. If this modification is performed, then signal ratios are calculated from the modified rfu values.
EXAMPLES
Materials and Methods
[0309] A. Collection of Biological Tissues
[0310] Blood (venous/menstrual), saliva, semen, skin epidermis, urine, and vaginal secretion were collected from volunteers. Informed consent was obtained from all participants recruited into the study.
[0311] B. DNA Extraction and Quantification
[0312] DNA was extracted from all samples using by organic extraction. The quantity of recovered DNA was determined using the Quantifiler® Human DNA quantification kit (Applied Biosystems) and the 7300 Real-Time PCR system (Applied Biosystems).
[0313] C. Selection of Genetic Loci and Primer Design
[0314] Random CpG islands (defined as a region>=200 by and with a GC content>=0.5 and with at least 8 CGs; corresponding to observed/expected CpG ratio>0.6) were searched using a software program developed for this task. From these, CpG islands that contained a HhaI recognition sequence were selected for initial screening. Primers (18-28 bps) flanking the HhaI recognition sequence were designed with a Tm of 64-66° C. and for amplicon sizes of 66-150 bps. Fluorescently-labeled forward primers (FAM or JOE) were purchased from Integrated DNA Technologies. Loci were screened in pairs for differential methylation by comparing signals obtained from amplification of pooled DNA samples (each containing DNA from 10 individuals) of each tissue type. Loci that showed significant differential amplification patterns (defined as the largest signal ratio observed in all tissue types being greater that three times the smallest ratio observed) were selected for multiplexing. In total, 205 genomic loci were screened of which 38 showed significant differential amplification patterns. From these, 16 loci were used in the experiments. For the stand-alone tissue identification assay, 15 loci that could be co-amplified without significant noise were used. For the combined semen detection and profiling assay two loci (L68346 which was also used for the stand-alone assay and L16264) were used.
[0315] D. Endonuclease Digestion, PCR, and Capillary Electrophoresis
[0316] In stand-alone assay experiments, each DNA sample was digested by HhaI and subjected to PCR amplification in the same reaction, consisting of 30 U HhaI (New England Biolabs), 2.5 U AmpliTaq Gold (Applied Biosystems), 2.5 μg BSA (New England Biolabs), 0.2 mM each dNTP, 0.1-0.3 μM each primer, 2.5 μl reaction buffer (150 mM Tris-Hcl, 15 mM MgCl2) and DDW to a total volume of 25 μl. The reaction composition in the combined tissue identification-profiling experiments was the same as in the stand-alone assay except for the primers, which were 0.2 μM each semen identification primer together with 5 μl Primer Set of ProfilerPlus (Applied Biosystems). Reactions (for both stand-alone and combined assay) were performed in a GeneAmp® PCR System 9700 (Applied Biosystems), and the thermocycling program used was: 37° C. for 15 min, 95° C. for 11 min, followed by 28 cycles of 94° C. for 1 min, 59° C. for 1 min, 72° C. for 1 min, and followed by a final extension step of 60° C. for 45 min. A mix containing 1.5 μl of amplification products, 24.5 μl HiDi formamide (Applied Biosystems) and 0.5 μl ROX size standard (Applied Biosystems) was denatured (95° C. for 3 min immediately followed by 3 min on ice), and run on an ABI 310 Genetic Analyzer (Applied Biosystems) according to the manufacturer's instructions. All resulting electropherograms were analyzed using in-house developed software, and electropherograms resulting from combined tissue identification-profiling experiments were also analyzed using GeneMapper ID-X analysis software (Applied Biosystems).
[0317] E. Tissue Identification Assay--Data Analysis
[0318] Data analysis for tissue identification was performed by an in-house developed software that accepts as input fsa files and outputs the most likely source tissue. Derivation of semen percentage in mixture samples was performed based on profiling loci and tissue identification loci. Derivation based on profiling loci was performed by dividing the sum of rfu values of alleles corresponding to the contributor of the semen by the total sum of rfu values of all alleles in STR loci that had 4 genotyped alleles. Derivation based on tissue identification loci was performed first by calculating the expected signal ratio for all possible percentages of mixtures (from 0 to 100% with 1% increments, based on the signal ratio of undigested DNA), and the algorithm provided the percentage of semen for which the expected signal ratio is closest to the observed signal ratio.
[0319] F. Simulation of Degraded Samples
[0320] Twenty nanograms of each sample were digested for 10min at 37° C. with 0.01 U DNAseI (Ambion), 2 μl 10× DNAseI buffer (Ambion) in total reaction volume of 20 μl, followed by heat-inactivation at 75° C. for 10 min. One nanogram of each digested DNA sample was then subjected to the combined tissue identification-profiling assay.
Example 1
Categorization of DNA According to Tissue Type--Stand Alone Assay
[0321] In this example, the categorization procedure is termed "tissue identification assay." The tissue identification assay uses a panel of loci that are differentially methylated between tissues to determine the most probable source tissue of a DNA sample as shown in Table 1 (FIG. 7). A scheme of the assay is presented in FIG. 1A. One nanogram of DNA from a forensic sample in question is digested with the HhaI methylation-sensitive restriction enzyme, which cleaves DNA at its recognition sequence GCGC only if it is unmethylated (while leaving methylated targets intact). A panel of tissue identification loci is then amplified by PCR from the digested DNA using fluorescently-labeled primers, and an aliquot of amplified products is separated by capillary electrophoresis. Loci with higher methylation levels are amplified with higher efficiency (because more DNA molecules are protected from digestion), producing a relatively strong signal in the electropherogram (FIG. 1B, locus A). Conversely, loci with a lower methylation level are amplified with lower efficiency, yielding a relatively weak signal in the electropherogram (FIG. 1B, locus B).
[0322] Automated signal analysis software enables analysis of an output electropherogram, and assigns heights (in rfu) to amplicons corresponding to tissue identification loci. Although the height of a single locus is correlated with its methylation level, the actual methylation level cannot be derived, because that level also depends on the precise template concentration and specific PCR conditions. Instead, ratios of methylation levels between co-amplified loci can be calculated, since all the loci are subjected to the same template concentration and specific reaction conditions. Therefore, for each pair of loci a signal ratio, defined as the ratio between the heights of the first and second loci, is calculated, and this ratio reflects the ratio between the methylation levels of the corresponding loci. All calculated signal ratios are combined into a single vector (if, for example, in a 15-loci panel the vector contains 105 ratios--between locus 1 and 2, locus 1 and 3, etc.), which is then compared to a database of reference vectors obtained from a data set of samples of known tissue origin. The tissue identification algorithm calculates for each potential tissue source a likelihood score, reflecting the likelihood that the DNA sample originated from that tissue, and the output of the algorithm is the most likely tissue.
[0323] A stand-alone tissue identification assay was performed on 50 samples: 14 blood, 14 saliva, 11 semen, and 11 skin epidermis using a panel of 15 tissue identification loci, ranging in amplicon size from 66 to 150 bps. FIG. 2 depicts electropherograms of eight of these samples--two of each tissue type. Although samples of the same tissue type from different individuals were not completely identical (due to natural variability of methylation levels and stochastic PCR effects), it was nevertheless evident that each tissue type had a distinct methylation profile. For example, the ratio of L91762/L68346 in semen samples ranged from 0.04-0.53 and was higher in all other tissue samples (2.15-18.28; Table 2 in FIG. 8), and therefore a low L91762/L68346 ratio was distinctive of semen samples. The ratio of L76138/L26688 was low in blood and saliva (0.08-1.54) and higher in semen and skin epidermis (2.04-19.56; Table 2 in FIG. 8); therefore a high ratio of L91762/L68346 concomitant with a high ratio of L76138/L26688 was distinctive of skin epidermis samples. The tissue identification algorithm correctly identified the true tissue source of all 50 samples. Further analysis of the data using subsets of tissue identification loci revealed that the full set of 15 loci was redundant and 100% identification was achieved by using only 7 out of the 15 loci (L91762, L68346, L50468, L14432, L30139, L15952, and L26688). Because tissue identification relies on efficient digestion, complete digestion of template DNA by HhaI was assessed in a single digestion-amplification reaction setup. The 50 DNA samples were subjected to the same procedure but using a panel of two different loci as shown in Table 3 (FIG. 9)--a control locus without a HhaI site (L98328) and a locus which was previously shown to be completely unmethylated in these tissues (SW14; see D. Frumkin et al., Authentication of forensic DNA samples, Forensic Sci. Int. Genet. 2009, doi: 10.1016/j.fsigen.2009.06.009, which is incorporated herein by reference). All samples showed presence of the reference locus and complete absence of SW14, indicating complete digestion by HhaI in contrast to the undigested sample which showed presence of both loci (example runs are shown in FIG. 4).
Example 2
Analysis of Noise Factors Affecting Signal Ratios
[0324] The assay described in example 1 is based on utilizing loci that are differentially methylated between tissues, for which signal ratio values are generally tissue-specific (FIG. 1C). However, even in differentially methylated tissues, there potentially could be some overlap in the observed signal ratios as a result of natural variability in methylation levels among different individuals and/or artifacts associated with the PCR such as differences in DNA template concentration (e.g. as a result of pipetting errors and stochastic effects). The effect of each of these "noise" factors was analyzed in relation to the "signal," which is the average signal ratio difference between tissues. Two loci with an average 10-fold difference in signal ratio values between semen and blood were selected. Different PCRs were performed on the same semen sample using 1 ng and 2 ng DNA as template. The ratios obtained from these amplifications were compared to each other and to ratios obtained from amplification of different blood samples. The differences between the ratios obtained in different PCRs and using different amounts of input DNA were more than one order of magnitude smaller than the differences between the ratios obtained from the different tissues (FIG. 1D).
Example 3
Combined Semen Detection and DNA Profiling
[0325] In this example categorization of the DNA is into one of two categories: semen and non-semen where non-semen refers to all tissues except semen. The categorization is performed together with DNA profiling in the same reaction.
[0326] The tissue identification procedure utilizes the same platforms used in standard STR profiling (i.e. thermocycler and capillary electrophoresis instruments) and is therefore readily amenable to integration with DNA profiling in a single reaction. This capability was demonstrated by generating an integrated STR profiling and semen detection assay. A STR profiling kit (Profiler Plus) PCR was supplemented with primers specific for two semen identification loci (Table 4 in FIG. 10). These loci consist of a 70 bps amplicon which is efficiently amplified only in semen and a 95 bps amplicon which is efficiently amplified in all tissues except semen. The assay was tested on pure samples of semen, urine (male), venous blood, menstrual blood, vaginal secretion, and saliva. The correct pattern of semen identification amplification was observed and the tissue identification algorithm correctly identified presence/absence of semen in all samples. FIGS. 3A and B depict complete electropherograms of semen and urine samples (obtained from the same individual), and FIG. 3C depicts FAM channel data from all samples including the two semen identification loci and three profiling loci. The observed signal ratio was 25.04 in the semen sample, and 0.04-0.089 in the other samples. The combined assay was also tested on mixtures of semen and saliva at various ratios (FIG. 3D). For each of these mixtures the percentage of the semen in the sample was derived from the signal ratio of the semen identification loci and compared with the corresponding percentage derived from the profiling loci (the semen and saliva samples were obtained from different individuals and could therefore be differentiated based on STR loci). The percentages derived were comparable, with a maximum difference of 10% (Table 5 in FIG. 11). Moreover, the presence vs. absence of semen was correctly determined in all samples (including a sample that contained only 13% semen; FIG. 3D). The STR profiles obtained from the samples using the integrated profiling-semen detection assay were identical to profiles obtained from the same samples using ProfilerPlus (without semen detection).
Example 4
Categorization of Aged and Degraded DNA Samples
[0327] The stand-alone tissue identification assay (described in example 1) was tested on two DNA samples extracted from 20-month old stains (blood and semen on cotton) as a proof-of-concept for application to forensic-type samples. Both samples amplified well, similarly to fresh samples (FIG. 5), and the algorithm correctly identified the tissue source of both samples. In order to simulate degraded DNA samples, two additional DNA samples (blood and semen) were subjected to digestion with DNAseI under conditions that yield partial digestion. These samples were then analyzed with the combined semen detection and profiling assay. DNAseI digestion resulted in dropout of alleles in the larger STRs in both samples such that their profiles were partial. In the blood sample only D3S1358 and Amelogenin alleles were typed, and in the semen sample dropout of alleles was observed in FGA, D21S11, D18S51, D13S317 and D7S820 (FIG. 6). The smaller tissue identification loci amplified successfully with the expected pattern, and the algorithm correctly identified the presence/absence of semen in these samples.
Example 5
Combined Profiling and Categorization of DNA
[0328] This particular assay employs both conventional profiling of a DNA sample (with the Promega PowerPlex16 kit), and categorization of DNA into categories of natural vs. artificial.
[0329] One aspect of this assay, therefore, is to check the natural nature of the DNA against several or all types of artificial DNA (see the Definitions section), and therefore contains an analysis of several different ratios. The combination of ratios makes it possible to therefore compare a single parameter various DNAs synthesized from various methods. A single parameter, for example representation ratio, can distinguish between a sample that contains the entire genome (natural DNA but also MDA synthesized DNA--as in this example) and a sample that contains only a subset (for example, only CODIS loci).
[0330] Two samples of DNA were analyzed--a natural DNA sample extracted from the blood of subject A, and an artificial DNA sample synthesized by in vitro multiple displacement amplification using a commercial kit (from a minute amount of subject A's real DNA as template).
[0331] The two samples were first profiled with a conventional kit (PowerPlex16) and analyzed using a conventional profiling software (GeneMapperID-X). The scheme of this procedure can be briefly described as performing multiplex PCR using the PowerPlex16 primer mix on a DNA sample; separating the amplification products on a capillary electrophoresis machine; and then analyzing the output data with, for instance, the GeneMapperID-X software.
[0332] For each sample, the end product of this assay is a profile. The profiles of the two samples are identical, as can be seen in FIG. 9A,B. Furthermore, the GeneMapperID-X software determined the profiles of both samples to be single contributor (i.e. from a single person) profiles, with no anomalies. This shows that a profile obtained from artificial DNA can be identical to a profile obtained from natural DNA. See D. Frumkin, et al., Authentication of forensic DNA samples, Forensic Sci. Int. Genet. (2009), doi:10.1016/j.fsigen.2009.06.009, which is incorporated herein by reference.
[0333] Both samples of DNA were subsequently also analyzed by a combined profiling and categorization assay based on the following scheme: digest a DNA sample with HhaI and perform multiplex PCR using the PowerPlex16 primer mix with the addition of primers for amplifying an additional locus, such as Hypo23; separating the amplification products on a capillary electrophoresis machine; and analyzing the output data with the capillary analyzer software, such as the software algorithm disclosed herein.
[0334] For each sample, the end product of this assay is a profile and assignment of category. As can be seen in FIG. 9 C and D, the natural DNA was assigned as "natural," in contrast to the artificial sample which was assigned as "artificial."
[0335] In this example, the assignment of category was performed by analysis of three parameters:
[0336] SR1 (signal ratio of TPOX/D8S1179), SR2 (signal ratio of D3S1358/H o23), and RR (representation ratio of OCA2/D3S1358).
[0337] The threshold values for these parameters are provided in Table 6:
TABLE-US-00009 TABLE 6 SR1 SR2 RR Threshold for natural >=0.9 >=10 >=2 Threshold for artificial <0.9 <10 <2
[0338] The observed values for these parameters, and the assigned category are provided in Table 7 (values that are above the threshold for natural DNA are shaded).
TABLE-US-00010 TABLE 7 SR1 SR2 RR Category Natural DNA sample ##STR00005## ##STR00006## ##STR00007## Natural Artificial DNA sample 0.06 2.06 ##STR00008## Artificial
[0339] Assignment of the category was performed according to the following rule:
[0340] If all observed parameter values are above their respective thresholds for natural DNA, then assign a "natural" category, otherwise assign an "artificial" category.
Example 6
Combined Profiling and Categorization of DNA (MDA vs. non-MDA)
[0341] This particular assay employs both conventional profiling of a DNA sample (with the Promega PowerPlex16 kit), and categorization of DNA into categories of MDA (artificial DNA that was synthesized by Multiple Displacement Amplification vs. other (non-MDA) types of DNA.
[0342] Two samples of DNA were analyzed--a natural DNA sample extracted from the blood of subject A, and an artificial DNA sample synthesized by in vitro multiple displacement amplification using a commercial kit (from a minute amount of subject A's real DNA as template).
[0343] The two samples were first profiled with a conventional kit (PowerPlex16) and analyzed using a conventional profiling software (GeneMapperID-X). The scheme of this procedure is as follows:
[0344] DNA→multiplex PCR using the PowerPlex16 primer mix→separation of amplification products on a capillary electrophoresis machine→analysis of data with the GeneMapperID-X software
[0345] For each sample, the end product of this assay is a profile. The profiles of the two samples are identical, as can be seen in FIG. 15A-B. Furthermore, the GeneMapperID-X software determined the profiles of both samples to be single contributor (i.e. from a single person) profiles, with no anomalies.
[0346] Both samples of DNA were subsequently also analyzed by the Capillary Analyzer software. For each sample, the end product of this assay is a profile and assignment of category. As can be seen in FIG. 15C-D, the natural DNA was assigned as "non-MDA," in contrast to the MDA sample which was assigned as "MDA."
[0347] In this example, the assignment of category was performed by analysis of three parameters:
[0348] RR1 (representation ratio of vWA/D18S51), RR2 (representation ratio of CSF1PO/Penta_D), and RR3 (representation ratio of D21S11/D7S820).
[0349] A Combined Representation Score was calculated based on these three ratios as follows:
CRS=3 R1*R2*R3
[0350] The threshold value that was determined based on analysis of multiple MDA-samples and non-MDA-samples was 1.5, hence an unknown sample with a CRS value of above 1.5 is categorized as "MDA," while an unknown sample with a CRS value of below 1.5 is categorized as "non-MDA."
[0351] The CRS values of the MDA sample and non-MDA sample were calculated, and are as follows:
[0352] CRS value of MDA sample=2.04
[0353] CRS value of non-MDA sample=0.91
[0354] Based on the threshold value, both samples were correctly categorized.
Example 7
Stand Alone Semen Detector Kit
[0355] The assay employed by the kit accepts as input a DNA sample which then undergoes a biochemical procedure followed by signal analysis by a dedicated software. The output of the assay is the category of the DNA sample (semen or non-semen), and a statistical confidence level representing the likelihood that the outputted category is the true category of the DNA sample.
[0356] A semen detection kit of the present invention may comprise one or more of the following components:
[0357] 1. A box that may comprise one or more of the following components:
[0358] Tube 1 comprising a 5× primer mix of:
TABLE-US-00011
[0358] 0.6 μM SD1f (AAGAGCCCATCAGGCAGGTC); 0.6 μM SD1r (GTTTCTTGTCGAGCAGCACGTGGATGATG); 1.75 μM SD2f (CTCCAGAACTGGAACTTCCTG); 1.75 μM SD2r (GTTTCTTAACTTGGAGACGACGGCATC); 1.25 μM SD3f (TGGAGGACAATGCCCTGGTG); 1.25 μM SD3r (GTTTCTTGGCTTCACCTGCGACCGTCTC); 1.75 μM SD4f (CCCTCCGAGTGGCCAGCAG); 1.75 μM SD4r (GTTTCTGACCACTGCCGTGGGAATG); 1.75 μM SD5f (CTTCTCAGCCAATGGGAAGAG); 1.75 μM SD5r (ACGTAGAAGGACCCGAGGAC); 0.9 μM SD6f (TACAGACAAATCACTCAGCAGC); and 0.9 μM SD6r (GTTTCTTGTCTGACACTCGGTTGTAGGTATT)
[0359] The forward primers (e.g., SD_f) are fluorescently labeled;
[0360] Tube 2 comprising a 10× reaction buffer (150 mM TRIS-HCl, 15 mM MgCl2, 0.2 mM each dntp, 2.5 μg BSA);
[0361] Tube 3 comprising HhaI restriction endonuclease;
[0362] Tube 4 comprising a control semen DNA sampl;
[0363] Tube 5 comprising a control non-semen DNA sampl;
[0364] Tube 6 comprising a DNA ladder; and
[0365] a Material Safety Data Sheet (MSDS).
[0366] 2. A paper detailing the following protocol, or similar instructions:
[0367] (a) For each reaction, combine in a 0.2 ml tube (not provided) the following ingredients: 5 μl 5× primer mix, 2.5 μl 10× reaction mix, 0.5 μl HhaI endonuclease, 0.5 μl DNA polymerase, 0.5 ng DNA, and DDW (distilled water) to a total volume of 25 μl.
[0368] (b) In addition to the tested DNA, set up a positive control semen reaction using the supplied semen DNA, a positive control non-semen reaction using the supplied blood DNA, a negative control reaction using DDW instead of DNA, and a digestion control reaction using DDW instead of HhaI.
[0369] (c) Place the reaction tubes in the thermal cycler and run the following program: 37° C. for 15 min, 95° C. for 11 min, followed by 30 cycles of 94° C. for 1 min, 59° C. for 1 min, 72° C. for 1 min, followed by a final extension step of 60° C. for 45 min, and hold at 25° C.
[0370] (d) For each post-amplification reaction, mix 1.5 μl product with 24.5 μl formamide and 0.5 μl fluorescent size standard in a new 0.2 ml tube.
[0371] (e) Denature samples at 95° C. for 3 minutes, then immediately chill on ice for 3 minutes.
[0372] (f) Run denatured samples in the capillary electrophoresis machine using the following parameters:
[0373] Module=GS STR POP4 (1 mL) F;
[0374] Inj. secs=5;
[0375] Inj. kV =15;
[0376] Run kV=15;
[0377] Run C=60;
[0378] Run time =24 min
[0379] (g) Analyze output .fsa files in the TissueIdentifier analysis software.
[0380] 3. "TissueIdentifier" analysis software implementing the tissue identification algorithm as described in the "Algorithm and Software" section above, with the following modifications:
[0381] In step 3 of the algorithm, the set of pairs of loci used are: {SD1,SD6}, {SD2,SD6}, {SD3,SD6}, {SD4,SD6}, and {SD5,SD6}.
[0382] A correction for incomplete digestion was performed using the signal ratio of {SD5,SD6}. SD5 acted as a digested control locus and SD6 acted as an undigested control locus.
[0383] Reference probability functions of semen and non-semen were obtained for {SD1,SD6}, {SD2,SD6}, {SD3,SD6}, {SD4,SD6} using a set of 27 reference semen samples obtained from 27 different individuals and 86 reference non-semen samples (blood, saliva, urine, vaginal swab, menstrual blood) obtained from different individuals.
[0384] The assay is based on analysis of 6 genomic loci. Of these, 4 loci were found by the inventors to be differentially methylated in semen vs. non-semen tissues. Two of these four loci are methylated in all tissues except semen, and the two other loci are unmethylated in all tissues except semen. The assay also includes an undigested control locus that does not contain a HhaI recognition sequence (SD6) and is therefore expected to be amplified successfully regardless of the tissue type, and a digested control locus (SD5) which was found by the inventors to be unmethylated in all potential tissues.
[0385] The kit was tested on 27 semen and 86 non-semen (blood, saliva, urine, vaginal swab, menstrual blood) DNA samples from 95 different donors of different sexes, ages, and ethnicities. The algorithm correctly identified the source of all samples with a typical confidence level>99.999999%. FIG. 12 shows sample plots of 6 samples. The tested samples were the same samples used for obtaining reference probability functions. However, in order to avoid bias, in each specific analysis, the analyzed sample was not used for obtaining the reference probability functions.
Sequence CWU
1
1
1041889DNAHomo sapiens 1ctcttctcat tccacaagct ctccccaaaa gaccccattc
ctccccacct tcaaccatct 60ctggcaggga ggagggggaa ctgagaggct actttctgac
ccaggaccct aagcctgtgt 120acggagagag catgagctgg gtgagctgct tgccaaggag
tggcatctgc cctcatcagt 180ggacacaaaa agccccaggg gttaagtggc catggctgcc
ctcatggctg caccgggagg 240atgactgtgt tcccactctc agtcctgccg aggtgcctga
cagccctgca cccaggagct 300ggggggtcta agagcttgta aaaagtgtac aagtgccaga
tgctcgttgt gcacaaatct 360aaatgcagaa aagcactgaa agaagaatcc agaaaaccac
agttcccatt tttatatggg 420agcaaacaaa ggcagatccc aagctcttcc tcttccctag
atcaatacag acagacagac 480aggtggatag atagatagat agatagatag atagatagat
agatagatat cattgaaaga 540caaaacagag atggatgata gatacatgct tacagatgca
cacacaaacg ctaaatggta 600taaaaatgga atcactctgt aggctgtttt accacctact
ttactaaatt aatgagttat 660tgagtataat ttaattttat atactaattt gaaactgtgt
cattaggttt ttaagtctat 720ggcatcactt tcgcttgtat ttttctattg atttcttttc
ttttcttttc ttttttgaga 780cagagtctca ctctcaccca ggctggagta ccgtggcacg
atcttggctc attgcaacca 840ccacctcccg ggctcaagtg attatcctgc ctcagcctcc
caaatagct 8892843DNAHomo sapiens 2atatgctaac tggatgtgaa
caattgtgtt ctaatgagct taatatgagt ttcataattt 60gtgcattttg ctgttaaaaa
gccagaaaac aaaacaaaac aaaatactga aaccagtgtg 120aacaagagtt acacgatgga
aggcatcagt tttcacacca gaaggaataa aaacaggcaa 180aaataccata agttgatcct
caaaatatga ttgattttaa gccttatgag ataattgtga 240ggtcttaaaa tctgaggtat
caaaaactca gagggaatat atattcttaa gaattataac 300gattccacat ttatcctcat
tgacagaatt gcaccaaata ttggtaatta aatgtttact 360atagactatt tagtgagatt
aaaaaaaact atcaatctgt ctatctatct atctatctat 420ctatctatct atctatctat
ctatctatct atcgttagtt cgttctaaac tatgacaagt 480gttctatcat accctttata
tatattaacc ttaaaataac tccatagtca gcctgaccaa 540catggtgaaa ccccgtctct
aaaaaaaata caaaaattag ctggatgcag tagcacatgc 600ctgtagtccc agctactcag
gaggctgggg caggagaacc acttgaccca agaagcggag 660gttgcagtga gccgagatcg
caccactgca ctccagcctg ggtgacagag tgagactcca 720tctcaagata aagaaataaa
taaaaacaaa caaacaaaaa aattccatag ggggtcaggt 780gcggtggctc atgcctgtaa
tcccagcact ttgggaggcc gaagcaggtg gatcacttga 840ggt
8433792DNAHomo sapiens
3aatatgaatt caatgtatac agagagagag agagagagag agagagagag agacttctac
60agagctctaa gcataattgt gtaactccaa gctcacagtg cctaagacca gtaccaggct
120gactcattgg aaagctgcca tagtaagact cttctgttca ctgcattatt tattgatgta
180ttgcaagcac ttagttacat ttctagcata taacacatga tcaataaata ttttgacatg
240aacaaatggt aattctgcct acagccaatg tgaatattgg gatgggttgc tggacatggt
300atcacagaag tctgggatgt ggaggagagt tcatttcttt agtgggcatc cgtgactctc
360tggactctga cccatctaac gcctatctgt atttacaaat acattatcta tctatctatc
420tatctatcta tctatctatc tatctatcaa tcaatcatct atctatcttt ctgtctgtct
480ttttgggctg cctatggctc aacccaagtt gaaggaggag atttgaccaa caattcaagc
540tctctgaata tgttttgaaa ataatgtata ttaatgaatg tacaaatttc cccacttgta
600ctttcagact gttatctgtg agttaaaact cctccactct ttttcctacc caaataatag
660catacttttt tctgagtata ttttgggaag aagagttatt cagttattgt tatattttaa
720aaaattcctt ataccaaact ctacttgatc taaggctatt cattgaaact ttcagcatgc
780ttaatagcag tc
7924735DNAHomo sapiens 4ccctctgtgt agcctggcta tgtgccacat tgtgaggttc
tctccctcta gctacttctt 60ccagtttcct ctttcaggat cccaattcct ttctcaaagc
actggtgaat aactccaaat 120actccatcat ttcattatac agagtaatat aagtcttctt
tttctaaacc tctcccatct 180ggatagtgga cctcatattt cagatgctaa taggctgttg
aggtagtttc ctaagcaaaa 240aagtaattgt ctctctcaga ggaatgcttt agtgcttttt
agccaagtga ttccaatcat 300agccacagtt tacaacattt gtatctttat ctgtatcctt
atttatacct ctatctatct 360atctatctat ctatctatct atctatctat ctatcttcaa
aatattacat aaggatacca 420aagaggaaaa tcacccttgt cacatacttg ctattaaaat
atacttttat tagtacagat 480tatctgggac accactttaa ttagaagctt taaaagcata
tgcatgtctc agtatttaat 540tttaaaatta ttacataatt atatactcct ttgaattaga
aaattacaaa tgtggctatg 600tattattttc tcccatgtat tttcaaaatg agggggtaag
ccagaccctc tccctctccc 660atgcctaata gctcaaagtt aaaggtaaag aaacaagaaa
atatggtgaa agttaaccag 720cttcacttca gagga
7355949DNAHomo sapiens 5attcaacaca tgaggcacgg
ccagacctaa atgtctcaga gcctgctccc actccgatga 60gctgctgcct tgcttcaggg
tctgagtcca gtgactgcca ctgcctgcac ccaatcacca 120tagccagaga cctggaggtc
atccttatct cctttctctt cctcatccct gcatctcaga 180ctcttccaca caccactggc
catcttcagc ccattctcca gcctccaggt tcccacccaa 240cccacatggt gccagactga
gccttctcag atactatctc ctggtgcaca cttggacagc 300atttcctgtg tcagaccctg
ttctaagtac ttcctatcta tctatctatc tatctatcta 360tctatctatc tatctatcta
tctatctaat ctatctatct tctatctatg aaggcagtta 420ctgttaatat cttcatttta
caggtaggaa aactgagaca cagggtggtt agcaacctgc 480tagtccttgg cagactcagg
ttggaacact gccctggagt gtgtgctcct gaccaccacg 540aagtgcctcc tctgtacaat
ctgaccccat cactctcctc tttacaatga cctcccaata 600ggttaagatg cagttattct
ttctcacttt aagacacctt tacctccggc ttctgccacc 660tcctctgctc ccctgtggcc
actcctcaca ccactccaca tcccagctgt tgtcaagttc 720tttcagtgtt ccaaatgatc
tatgttctct ttgcctttga gccttgcata tgttcctccc 780tctgccagaa gcgctgttcc
ccttcctttc ccacccttct gcccggccaa ctcaccttca 840ttcttcccat cccagtttag
aggccacctt ctcgaagcct gggttggggg gactcttcag 900tgttcccagg acaccttgtg
cttcccccat aatcactggg tgatcattg 9496832DNAHomo sapiens
6cccagcacac accttgcctc tggctgggac cccctttgct gctggccctg ctcaggcccc
60acagcttgat ctcctcatgt tcccactgct gacttcccca agctaactgt gccacagagt
120gggggacccc ctcccggctc tcacaacccc caccttcctc tgcttcactt ttcaccaact
180gaaatatggc caaaggcaaa aacccatgtt cccactggcc tgtgggtccc cccatagatc
240gtaagcccag gaggaagggc tgtgtttcag ggctgtgatc actagcaccc agaaccgtcg
300actggcacag aacaggcact tagggaaccc tcactgaatg aatgaatgaa tgaatgaatg
360aatgaatgtt tgggcaaata aacgctgaca aggacagaag ggcctagcgg gaagggaaca
420ggagtaagac cagcgcacag cccgacttgt gttcagaaga cctgggattg gacctgagga
480gttcaatttt ggatgaatct cttaattaac ctgtggggtt cccagttcct cccctgagcg
540cccaggacag tagagtcaac ctcacgtttg agcgttgggg acgcaaacac gagagtgctt
600ggtgtgagca cacaggagga gtcacgacag agcagtgtaa gagccgccac gtgggtccca
660cacaggggga gtcacgacac agcagtgtaa gagccgccac gagggtccca cacaggggga
720gtcgcgacac agcagtgtaa gagccgccac gagggtccca cacaggggga gtcacgacac
780agcagtgtaa gagccgccac gagggtccca cacaggggga gtcacgacac ag
8327766DNAHomo sapiens 7ttacccttgg ggtgggggtg taggatgcag ctggggctgc
agttccaggc cacggagagc 60ctgtgaggct gggccccggg gcgccctggg gaggggatgc
ctgatgggga gcctggtggg 120ggagggtagg ggagggcggg ggaggacggg ggagggcgcc
ctgtgtccct gagaaggtac 180ctggaaatga cactgctaca actcacacca catttcaatc
aaggtccata aataaaaacc 240cattttaaat gtgccaggga gcccaaggtt ctgagtgccc
aaggaggcac cgaagacccc 300tcctgtgggc tgaaaagctc ccgattatcc agcctggccc
acacagtccc ctgtacacag 360ggcttccgag tgcaggtcac agggaacaca gactccatgg
tgaatgaatg aatgaatgaa 420tgaatgaatg agggaaataa gggaggaaca ggccaatggg
aatcacccca gagcccagat 480accctttgaa ttttgccccc tatttgccca ggacccccca
ccatgagctg ctgctagagc 540ctgggaaggg ccttggggct gcctccccaa gcaggcaggc
tggttggggt gctgactagg 600gcagctgggg cagagggagg caggggcagg tgggagtagg
gtgggggctg ggtgcagcag 660ccggggacct ctggccatct tggatttttt ggatggattt
gtttccacat tccgatcgtt 720aagattcaag atgaaacaag acacagagac ccacacgacc
cccgag 7668751DNAHomo sapiens 8agatgataga tacatatgtt
agacagagat aggatagatg atagatacat aggttagata 60gagataggat agattataaa
tagatacaca ggttagatag attagacaga cagatagata 120catacataga tataggatag
ataactagat acaatagaga tagatagata gatagataga 180tgatagagga tagatgataa
atagatatat agcttagata gagataggat agatgataga 240tacataggat agatagagac
aggatagatg ataaatagat acataggtta gatagagata 300ggacagatga taaatacata
ggatggatgg atagatggat agatagatag atagatagat 360agatagatag atagatagat
agacagacag acagacagac agatagatca atccaagtca 420catactgatt attcttatca
tccactaggg ctttcacatc tcagccaagt caacttggat 480cctctagacc tgtttcttct
tctggaaggt gggaactcta ccttatagga tcagtctgag 540gagttcacaa aataataagg
gcaaagtgcc cggcacattg taggagacta gtaatgtcta 600taaaatgagg ggcttgaagt
aaatgatccc tctagttctc tctactgcta acattctaag 660acctccttta cattaattgt
tctcaagcca catctccctc ccctacagga cttctattta 720tttctgatca atttcatgag
tacaaataag t 7519945DNAHomo sapiens
9actgaacatt tgcttttgaa atttactatc tatgtaccgt tggaaaattt acttaatatc
60tctgaatttt ttttcttcaa ctgtggagtg aggaaaataa tacctacttt taggtagatg
120atggatataa cacttttctc tgcatatagt agacactcag tgcataacta tcgccttcct
180tttccctcta ctcagaaaca aggacatctg ggaccacagc cacatactta cctccagtcg
240tttcatatca accaactgag ctctaacatt tttctgcaga agctggatat gctgtacttt
300ttctatgact ttgcgcttca ggacttcaat tctgcttctc agatcctctg acactcggtt
360gtaggtatta tcacggtctg aaatcgaaaa tatggttatt gaagtagctg ctgagtgatt
420tgtctgtaat tgccagcaaa aaagaaagga agaaaggaag gaaggagaaa gaaagaaaga
480aagaaagaaa gaaagaaaga aagaaagaaa gaaagaaaga aagagaaaaa agaaagaaag
540aaactagctt gtaaatatgc ctaattttat tttggttaca gtttaatctg tgagttcaaa
600acctatgggg catttgactt ttggataatg ttatgccctg cagccttcca tgaatgccag
660ttaagatgtc ctaatagcaa ttagtaatcc caaagaaata tagaagaaga actttctttg
720gaattttaaa ggtgtaattt ggagttaaaa tagttggttt gattgcattt caattatttt
780ataacatcct taatcaaggg acttgaacat attggatttt cttactgatg agcttttctt
840tttaatctat agatttgaaa tggttcctaa gctgttttgg gtcaacagga tcactcactt
900gccagctagt gttgcatcac tgattttaaa tgtcaagtgt ttgtg
94510823DNAHomo sapiens 10gttggctggg gctcagagag aacaaaaagg cagaggaaaa
acaaatttcc cctctcactt 60ctggagatgg aacacttttc ttctgctttt ggacatcaga
aatccaagtt ctctggcctt 120tggactttgg gacttgtgcc agcaccctcc tgggttccct
ggcctttggc ctcaaactga 180aggttacact atcagcttcc gttgttctaa gggcttcaga
cttggacagc cacactgcca 240gcttccctga ttcttcagct tgtagatggt ctgttatggg
acttttctca gtctccataa 300atatgtgagt caattcccca agtgaattgc cttctatcta
tctatctatc tgtctgtctg 360tctgtctgtc tgtctatcta tctatatcta tctatctatc
atctatctat ccatatctat 420ctatctatct atctatctat ctatctatct atctatctat
cgtctatcta tccagtctat 480ctacctccta ttagtctgtc tctggagaac attgactaat
acaacatctt taatatatca 540cagtttaatt tcaagttata tcataccact tcatacatta
tataaaacct tacagtgttt 600ctcccttctc agtgtttatg gctagtaatt ttttactggg
tgccagacac taatttttat 660tttgctaagt ggtgaatatt ttttatatcc ttaaaaatat
ttttgagtgt tgatctgggt 720aaagttaagt tcaatattgg aaaaatattg attcttttga
ggatagttat cttctaatta 780gtctacctgt tgccccataa atggcatgat tttccactct
gtg 82311824DNAHomo sapiens 11tactacagca agagcgcttg
aaccagatgt aggggagata gcagctggag agcataacag 60aggcactgac atgtgagcag
ctaacgaggc cttttacaag acatctgtga ccacacggcc 120aagtagaaga aagccgttaa
aagcatcaag gtagttaggt aaagctgagt ctgaagtaag 180taaaacattg ttacaggatc
cttggggtgt cgcttttctg gccagaaacc tctgtagcca 240gtggcgcctt tgcctgagtt
ttgctcaggc ccactgggct ctttctgccc acacggcctg 300gcaacttata tgtatttttg
tatttcatgt gtacattcgt atctatctgt ctatctatct 360atctatctat ctatctatct
atctatctat ctattcccca cagtgaaaat aatctacagg 420ataggtaaat aaattaaggc
atattcacgc aatgggatac gatacagtga tgaaaatgaa 480ctaattatag ctacgtgaaa
ctatactcat gaacacaatt tggtaaaaga aactggaaac 540aagaatacat acggtttttg
acagctgtac tattttacat tcccaacaac aatgcacagg 600gtttcagttt ctccacatcc
ttgtcaacat ttgttatttt ctgggttttt gataatagct 660gtgaaaggaa aataaaaact
tgggccgggc gcggtggctc acgcctgtaa tcccagcact 720ttgggaggcc aaggcgggca
gatctcaagg tcgggagatt gagaccatcc tggctaacat 780ggtgaaaacc catctctact
aaaaatacaa aaacaaaaaa ttag 82412927DNAHomo sapiens
12catgccacta agctgtacac tgaaaaacgg ttaacatgat aaattttatg ttacatacat
60tttaccacaa tttaaaaaaa ttattaaaaa atactaacaa taggccaagc gtgatggctc
120acacctgtaa tcccagcact ttgggaggct gagacaggtg gatcaattga gctcaggagt
180ttgagaccag cctgggtaac acagtgagac ccctgtctct acaaaaaaat acaaaaatta
240gttgggcatg gtggcacgtg cctgtagtct cagctacttg cagggctgag gcaggaggag
300ttcttgagcc cagaaggtta aggctgcagt gagccatgtt catgccactg cacttcactc
360tgagtgacaa attgagacct tgtctcagaa agaaagaaag aaagaaagaa agaaagaaag
420aaagaaagaa agaaagaaag aaagaaagaa agaaagaaaa agagagagga aagaaagaga
480aaaagaaaag aaatagtagc aactgttatt gtaagacatc tccacacacc agagaagtta
540attttaattt taacatgtta agaacagaga gaagccaaca tgtccacctt aggctgacgg
600tttgtttatt tgtgttgttg ctggtagtcg ggtttgttat ttttaaagta gcttatccaa
660tacttcatta acaatttcag taagttattt catctttcaa cataaatacg cacaaggatt
720tcttctggtc aagaccaaac taatattagt ccatagtagg agctaatact atcacattta
780ctaagtattc tatttgcaat ttgactgtag cccatagcct tttgtcggct aaagtgagct
840taatgctgat caggtaaatt aaaaattata gttaattaaa agggcataaa tgttacctga
900ctcaataagt catttcaatt aggtctg
92713731DNAHomo sapiens 13ctggttttgg tggaattgac tccctctgtc acaaactcag
cttcagccca taccctgagc 60catagaccta tccctctaat gcattgtact agtctcaggg
ctaataacaa gggagaggtg 120tcaaagggcc agttccacct ccaccaccag tggaaaagct
attcccaggt gaggactgca 180gctgccaggg cactgctcca gaatgggcat gctggccata
ttcacttgcc cacttctgcc 240cagggatcta tttttctgtg gtgtgtattc cctgtgcctt
tgggggcatc tcttatactc 300atgaaatcaa cagaggcttg catgtatcta tctgtctatc
tatctatcta tctatctatc 360tatctatcta tctatctatc tatctatcta tgagacaggg
tcttgctctg tcacccagat 420tggactgcag tgggggaatc atagctcact acagcctcaa
actcctgggc tcaagcagtc 480ctcctgcctc agcctcccaa gtacctggga ttataggcat
gagccaccat gtccggctaa 540tttttttttt taagagatgg ggtctcgctg tgttccccag
ccttgtctta aactcctggc 600ctcaagtgat cctcccatct cagccttcca aagtgctgag
attacagcag aggcttttaa 660gtcaaagctt tccctgctag gacaagccct agttaaagtc
ctggagcact ggccactgca 720gctgcacttg g
731141026DNAHomo sapiens 14cctactcggg aggctgaggc
aggagaatcg cttgaaccca ggagggggcg actgcagtga 60gccgagatcg tgccactgca
ctccagcctg ggtgacagag cgagactcca tctcaaaaaa 120aaaaaaaaaa aaacagaatc
ataggccagg cacagtggct aattgtacct tgggaggctg 180agacgggagg atcgagacca
tcctgggcac catagtgaga ccccatctct acaaaaaaaa 240aaaaaaattt tttttaaata
gccaggcatg gtgaggctga agtaggatca cttgagcctg 300gaaggtcgaa gctgaagtga
gccatgatca caccactaca ctccagccta ggtgacagag 360caagacacca tctcaagaaa
gaaaaaaaag aaagaaaaga aaagaaaaga aaagaaaaga 420aaagaaaaga aaagaaaaga
aaagaaaaga aaagaaaaaa cgaaggggaa aaaaagagaa 480tcataaacat aaatgtaaaa
tttctcaaaa aaatcgttat gaccataggt taggcaaata 540tttcttagat atcacaaaat
catgacctat taaaaaataa taataaagta agtttcatca 600aaacttaaaa gttctactct
tcaaaagata ccttataaag aaagtaaaaa gacacgccac 660aggctaagag aaagtacttc
taatcacata tctaaaaaag gacttgtgtc cagattaaag 720aattcttaca catcaataag
acaacccaat taaaaatggg caaaagattt gaagagatat 780ttaaccaaag aaaacatata
aatgtgtccg ggcgcgatgg taatcccagc actttgagag 840gccgaggcag gcggatcact
tgaggtcagg agtttaggac cagtctggcc aacatggtga 900aaccctgtct ctaataaaaa
tacaaaaatt agctgggtgt ggtggcgtaa gcctgtaatc 960ccagctgctc aggaggctga
ggcagaagaa ttgcttgaac ctgggaggtg gaggctgcag 1020taagcg
102615977DNAHomo sapiens
15cacatgtgga catttcttat tttctcatat tggtggtatg gctcatttat gaagttaata
60ctggacattg tggggaggct gtgtaagaag tgttaaaggg gatcagggat acattcactt
120ctcttttcct ttgctagttc tgtggtctta agcaaagtag cctcaaacat cagtttcctc
180ttttataaaa tgaggaaaat aatactcatt accttgcatg catgatataa tgattacata
240acatacatgt gtgtaaagtg cttagtatca tgattgatac atggaaagaa ttctcttatt
300tgggttatta attgagaaaa ctccttacaa ttttcttttc ttttcttttc ttttctttga
360gactgagtct tgctcagtcg cccaggctgg agtgcaatgg cgtgatctcg gctcacttca
420atctccacct cctgggttca agtgattctc ctgtttcagc ctccagagta gctgggatta
480caggtgccta ccaccacacc cagctaattt tttgtatttt agtagagacg gggtttcacc
540atgttgccca ggctggtctt gatctcctga gctcaggtaa tacacctgca tcggcctccc
600aaagtgctag gattgcaggc gtgaatcacc gcacctgtcc acaattttct tgttattggt
660accctttcat gttggtaaaa tgtattttat tttctcttat caaataattt tcaatgcaat
720gagacgtcaa ctttaagccc aaagtagacc agtagtaaaa ctaaggctga aaccattgat
780tgattattac catatattgt cctaaaatat tcggctttta aaacatttgg tttcattttt
840catgataaaa atatgtagca tttttgcact tttaattcac tttgtagagt tctcaatcat
900ttctaacaca tgcttggcaa tgacaagcca tttgtgaaag agttttgctg gctttaaaat
960atatgcaaat gtaatat
97716706DNAHomo sapiens 16aggtctcctc ttctatacag cacatttgtt caaactaaaa
acagacctca agtatattct 60gcactatata gattttttta aagtagcttc agtctccttt
aatgtgaaca attgcatact 120gacttaatct cttcctctct cttctcttcc ttcactctct
cccttcctct ctctttctat 180tctcctcccc tcctccctgt aaaagctacc acctcatcct
gggcaccctg gttatatcaa 240cttcagctat gaggtaattt ttctctttac taattttgac
cattgtttgc gttaacaatg 300ccctgggctc tgtaaagaat agtgtgttga ttctttatcc
cagatgtttc tcaagtggtc 360ctgattttac agttcctacc accagcttcc cagtttaagc
tctgatggtt ggcctcaagc 420ctgtgtcgtc ccagcagcct cccgcctggc cactctgact
cagtctgtcc tcctaaatat 480ggccgtaagc ttacccatca tgaaccacta ctcagggagg
ctccatgata gggcaaaaag 540taaactctga ccagcttggt tctaacccag ctagtaaaat
gtaaggatta ggtaagatgt 600tatttaaaac tctttccagc tcaaaaaact cctgattcta
agatagtcac actctatgtg 660tgtctcttgc ttgcctctgc tgaaatatta gtgactaagt
ggtata 70617712DNAHomo sapiens 17ttattctcca atattttgaa
atgtgaatat tacagtaatt tcccttgtcc aaatgagaaa 60accagggttc caaagagagg
aaattatttg cccaaagtta gtaattttac ctaatcttta 120cattttaccg gatgggatag
aaccaagctg gtcagtcaga gttgactttt tgccctttca 180tggaaccttc ctgagcagtg
gttcatgaat gaataaactt acagccatat ttaggaggaa 240agagtcaatc cgaatggtca
ggcaggaggg tgctggagca acacaggctt gaggccaacc 300atcagagctt aaactgggaa
gctgatggta ggaactgtaa aattgggacc acttgagaaa 360ccactttatt tgggatgaag
aatccaccca ctattcttta cagagcccag gggactgcta 420atgcaaacag tgatcaaaat
tagtaaagag aaaaattacc tcatagctga agttgatata 480accagggtgc ccaggatgag
gtggtagctt ttatagggag gaggggagga gaagagaaag 540agagaggaag ggagagtgtg
aaggaaggga agagagagta agagattaag tcaatatgca 600attgttaaca ttaagagaga
ctaaaattac ttttaaaaaa tctatatagt acagaatata 660tttgaggtct gtttttcgtt
aaaacaagtg tgctatgtag gagaggagac tt 71218840DNAHomo sapiens
18acaaggcacg gaactcacac ccagcctctc tccatacaac agaatatggg ttcttgcgga
60gctggactct gcaggagtct atctaatatg gactctgtgt caatgactcc tgggcctcct
120ctgatcaccc cattaaagtc cttcgattgc tttgagcctc aaatctatgt gacatcaata
180cgttcatttc ttcctagcac ttagaactgt ttcttgttga tacatttgct ggcttcttcc
240ctgtctcacc ccttttccta ccagaatgcc agtcccagag gcccttgtca gtgttcatgc
300ctacatccct agtacctagc atggtacctg caggtggccc ataatcatga gttattcagt
360aagttaaagg attgcaggag ggaaggaagg acggaaggaa ggaaggaagg aaggaaggaa
420ggaaggaagg aaggaaggaa ggaaggcagg caggcaggca ggcaggcagg caaggccaag
480ccatttctgt ttccaaatcc actggctccc tcccacagct ggattatggg ccagtaggaa
540ttgccatttt cagggttttg ctgtcactgt agtcaggacc atgaagtctt taggcacctc
600cactccacac accccctggt gagagctccc atctccctgt tctgaaacag ctccccaata
660tagtactgat tccggttaaa cttgaacccc tgcccctgcc cctgcccctg atttacatga
720ggacactgag gcccagaggg gtaaagtgac tgccaggggt cacacagcta gaaagtggcg
780gtgccagaac tggaaggagg ccctcattcc tgagtcacgg cttttccata gcacagcctt
84019780DNAHomo sapiens 19atgaaactgg acacagaaac cagaccccag agcacatacc
gtatgagtcc attggtatga 60agtttaaaaa cagatggcac tagtccaaag gattggaagt
tggaatagtg gttaccagga 120ctggggggag gaagggatgg tggatggtga acaaaaggac
cttggagggc tcctggggtt 180ctaggaatca atcttccttc tttccttcct tccttccttc
ctctttctct ctttctttct 240gtttttattt caataggttt ttaaggaaca ggtggtgttg
gttacatgaa taagttcttt 300agcagtgatt tctgatattt tggtgcaccc attacccgaa
taaaaatctt ctctctttct 360tcctctctcc ttccttcctt ccttccttcc ttccttcctt
ccttccttcc ttccttccta 420ccttctttcc ttcaacagaa tcttattctg ttgcccaggc
tggagtgcag tggtacaatt 480atagcttttt gcagcctcaa cctcctgggc tcaagtgatc
ttcctgcccc agcctcctga 540gtagccagga ctacaggaat gtgccaacat gcctggctaa
ttttaaaaaa ttttttatag 600agaagaggtc tcactatgtt gcccagacta gacttgaact
ccttccctca agtgatcttt 660ctgcatcagt cttccaaagt gctgggattg caggcatgag
ccacctcacc cagccttaga 720aatgttctgt ttcttgacct gagagctgga tatacaggat
tgctcacttt gtgaaaattc 78020887DNAHomo sapiens 20gtacttcaga gtcaggatgc
ctctcttgct ctgggcctcc ttgcccacat aggagtcctt 60ctgacccatg cccaccatca
ctccctggtg cctagggtgc cccacaatgg aggggaagac 120ggcctgggga gccttgcgca
tgctggagca gttgtcgacg acgacgagcg cggtgatagc 180atcatccatg gtgagctggc
ggcgggtgcg gacgcaaggc gcagcggcaa ggacaaggtt 240ctgtgctcgc tgggctgacg
cggtctccgc ggtgtaagga ggtttatata tatttctaca 300acatctcccc taccgctata
gtaacttgct ctttctttcc ttcctttctt tctttctttc 360tttctttctt tctttctttc
tttctttctt tctttctttc tttctttttc tttctttctt 420tctttctttc tttctttctt
tctttctctt tctttctttc tctttctttc tttttctttc 480tttttcttcc ttccttcctt
tctctctctc tctctttctt tctttctaac tctctttgtc 540tctttctttc tttcttttga
cggagtttca ctcttgtcgc ccagattgga gtgcaatggc 600atgacctcgg ctcactgtag
cctccacctc ccaggttcaa gcgattatcc tgcctcagcc 660tccctaggag ctggaattac
agacgtgcac caccaagcct ggctaatttt tgtattatta 720gtagagacgg ggtttcacct
tgttggccag gctggtctcg aactcctgac ctcaggtgac 780ccacctgcct taggctccca
aagtcctggg attataggca tgagccacag tgcccagcct 840tcttttcatt taatactata
gtagtgtgat cctctctacc tattaca 88721720DNAHomo sapiens
21ttctgttttg cggtggttcc tagtatggta cctggccaag ggcacactag atctttgtca
60aggtaatgac tactttttat taaatgcttt ccatgtatca agttctgtgc caagcacttg
120acatatatca ttttatttta tcccgtgaag tagttattgg tatcttcatt tacaaataaa
180aaaacaagct tagtacttaa ctcactgcct tgaacataat tattgcttta aaggtagcta
240ggattcttaa tagctattat taccaaagca tgaacaatca gtaaaaagca aacctgagca
300ttagccccag gaccaatctg gtcacaaaca tattaatgaa ttgaacaaat gagtgagtgg
360aaggaaggaa ggaaggaagg aaggaaggaa ggaaggaagg aaggaaggaa atgaagacaa
420tacaaccaga gttgttcctt taataacaag acaagggaaa aagagaactg tcagaataag
480tgttaattat aatatccagg ggtgggatac agaggtttta gcatctgctc tttgccaagc
540actgcactta ttcctgagga atacctgagg gaaaaagtat ggtttctcac aggatctagt
600tggactggaa atatgacatt catattggaa tccagtgtct ttttctgaaa aagagagttc
660gttccaagct tagctcacat gcaagctaag acaaccacta gaaattactc tccccagggc
72022780DNAHomo sapiens 22gtcatgccta cagtgtaacg ggaattgacc aggtaggcga
cttgaactcc aactgcaggc 60tatggggaga catgtgacaa tgctaatccc ttaggcattt
attcagtgca ttgcagttta 120aatgtctgcc tttcaggcat ttcagagatt atgtcaccta
aagaggcagg ctggaattca 180aaacggcaag ccaggaaaga gagaaaccat gtgattccac
cgcagcacaa aactcgttta 240gcagctgtaa gcgcctggtc tttgtttatt tttaatttcc
tttctttccc aattctcctt 300cagtcctgtg ttagtcagga ttcttcagag aaatagaatc
actagggaac caaatatata 360tacatacaat taaacacaca cacacctatc tatctatcta
tctatctatc tatctatcta 420tctatctatc tatctatcta tctatctatc tacatcacac
agttgaccct tgagcaacac 480aggcttgaac ttatatgggg attttcttcc atctctacca
cccctgagac agcaagacca 540actcctcctc ctccttctca gcctactcaa catgaagata
ataaggatga agacctttac 600aatgacccag ttccacttaa taaatagtaa atgtatttcc
tcttccctat gattttcttg 660ataacatttc ttttctctgg cttatttatt gtaagaatac
agtatataat ataaataatt 720ataaaacatg ttaattggtt ctttacgtta tcgataagac
ttctggtcaa tggtaggcta 78023780DNAHomo sapiens 23gagcccaagt ttaaacccag
gccctctgtg tccccctaca gggtgactgc atctccgagt 60cctggcttgt catgcctgac
agagggctgc cgagtgagca gcttaaggca tcctgccact 120gtgcagctgc caaccctaca
gcccggcagc cctgcgggag gaagctctag tgcaggcctc 180ttaggatctg gggtccagga
tgctgatttc agggccggga ccttgggcac cgtccctctg 240gtctgcataa gacccactat
gggcaaacct taaacctgat cgttggaatt ccccaaactg 300gccagttcct ctccacccta
tagaccctgt cctagccttc ttatagctgc tatgggggct 360agattttccc cgatgatagt
agtctcatta ttattattat tattattatt attattatta 420ttattattac tattattgtt
ataaaaatat tgccaatcat acattcgcgt gatcactcac 480actgtgccgg gcactcttga
gagcacttta catatattgt ctcatttaat tctctcaact 540tgggcacagg cactgtcact
atttccattc tacagctgag gagactgaag cacagagagc 600cttagggact tgcctgaggt
cacacagcta agaaatggtg gagccaggat cagaaaccag 660gccacctaca gagctccctg
caaggggaac agcatccggt tccagaggct gtgattttat 720cagctacact gtgtgactcc
atcttcacac tctcctgccc ctcaagaaga catataacct 78024780DNAHomo sapiens
24atgaagagat ggtcaggcga ggtatggggg aaggggcgtg gagcttccat gtcctccctg
60ggcgccaccc tccaggaacc tccacgtgtt cagctataca gaagcttcct gaacccagtc
120ctcttggggt ttgagggaag cttcatgaca tcagcattcc ttcctccagg gtattaatgg
180gaccctctct gaagagattc ttaagaccca cggccagaaa gttgggtaaa gactagagtc
240ctgccttggg gcaggtgaaa ggagtgcaag agaaggtaag agagattctg ttcctgagcc
300ctaatgcacc caacattcta acaaaaggct gtaacaaggg ctacaggaat catgagccag
360gaactgtggc tcatctatga aaacttctat ctatctatct atctatctat ctatctatct
420atctatctat ctatatcata acaccacagc cacttagctc caatttaaaa gattaatcat
480aaacatttgg gaaggagagt gaagattttt gtgatgttaa ataagaatga ttatactaaa
540aaccaaaata atatgttatt tatggctggg tgtggtggct taagcctgta atcccagaac
600tttgggaggc caaggcttgt ggatcacttg agcccagaag ttcaagacca gcctgggcaa
660catagggaga ccctgtctct acaaaaaatt ttaaaattag ctggacatga tggcacgcac
720ccgtagtctc agctactcag gaggctcacg ccactgcatt ccagtctggg taacgcacac
78025780DNAHomo sapiens 25gtcaggagtt cgagaccagc ctggccaaca tggcgaaacc
ctgtctctac taaaaataca 60aaaaaattag ctgggcatgg tggtgtgttc ctgtaacccc
agctactcag gaggctgagg 120caagagaatc gctggaaccc aggaggtgga agttgcagtg
agctgagatt gcaccactgc 180actccagtgt gggcaacaga gcgagactct gtctcagaaa
aaaaaaagaa tacatgaaat 240cagagaaact caaattgtga tagtagtttc ttctggtgaa
ggaagaaaag agaatgatat 300cagggaagat gaaaaaagag actgtattag taaggcttct
ccagagagaa agaatcaaca 360ggatcaatgg atgcataggt agatagatag atagatagat
agatagatag atagatagat 420agatagacag acagacagac agacagacag acagatgaga
ggggatttat tagaggaatt 480agctcaagtg atatggaggc tgaaaaatct catgacagtc
catctgcaag ctggagaccc 540agggacacta ggagcatggc tcagtccagg tctaaaagcc
aaaaaaccag ggaaactgat 600ggtgtaatta tccatcccag gtggaaggcc tgagaacctg
gagtgcccct ggtataagtc 660ccagagtaca aagacaggag agcctggagt tctgacttcc
aagggcagaa gaatgtgtcg 720cagctccagg agagagagag aaagaatttc tttcctccgc
cttttgattc tatctggggg 78026540DNAHomo sapiens 26cttgaacctg agaggcagag
gttgcagtga gccgagacca tgccattgca ctccagcctg 60ggcaatagag taaaactcca
tcctcccgct ccaaaaaagt agacaacgtc catgaggtga 120tgaggaaggg gttatcgtgt
gttgcttgct gagaacagga cccccagact caccgtgtcg 180acgccggcca gcagcatctc
agtcacgttg gcgtagatct cctgcagcgt cagagcctgg 240ctaaggaaga ggtatgtgag
aagtcccccg ctcaccctcc ggcctcggtc catttggtac 300tgtatgtccc tcaacttgtt
gtcaacatga atttggcctg tttgaaaaca gtatttcttt 360tgaaaggagt ttgggttgag
aatcatcttt tcagtctcaa agccctctgt cctcccagta 420gcttaactaa accagtggca
ggtgacagag ggtaaggaaa cccaatttat ctaacgtcaa 480cctgggagtt tcactcatac
acttgcttat gtaaatgaat gaaaagttaa aagacaagct 54027537DNAHomo sapiens
27agagagccca ggagacaggc agaaaggaag gcatgtgacc ggatcacaat catcagctct
60ctgctgtcct ctttgggaag ggttttagta ttaaaaggac atttattctc attaatgcaa
120aattaaggag ttttaaaagc ttttacaacc tagactccct ctgagaggtt agccttgaca
180ccctaatcgc cttctgctcc cgccactgct cggtgccaag cagctcccac ggccccggcg
240ggtctgatga tagccggaca ggagggagga aggggaggag gaagagcctg catcagctcc
300tacgattgcc cagccccatc ctgggagtga ttaaacggtg catcaccaaa tgccagtccc
360actgacaggc aggtcaccgt gcacttcagg gcactctaaa ttgccgactc tccatgtaga
420gagggatgaa tccaatattg aaatcctcat aactacagcc ccccaaagta gccgtccatc
480ttctgcttaa aatgttgatc tgtagtaaaa tgttgatttt gttgaagctg agtgatg
53728609DNAHomo sapiens 28ttgaacctag gagatggagg ttgcagtgag ctgcgatcat
gccacttccc tccaggctgg 60gcaacagagc gagactccat ctcaaaaaaa caaaaaagaa
aaccaacctt ttgaatgtag 120gggaaacttt tcaaaggata tctagttttc aattacagta
aacttgtgga agggaggttc 180agagttgaga ttgagattat agattttgct gatgataaac
catgagttcc agaggacata 240gtagactatt ctgggcagtt atacaggggt ggatggaatg
tgggagtggg gttgtatagt 300gccataaaga aatgagagtc cggattaaaa ataatgagct
ggactcgcga gccttttgta 360actgaaataa atagaaaaat aagaaataca ttatttctgt
gattgttgag aggaagaaat 420ggtggaaatc ttgtgagaag cacactgagc tctagcacca
cctcttcact cctacagatg 480gtggaataaa cggcaggcaa gttcaaaatc acatatagtc
attattgcaa gatagttcta 540tggatataga tactacatac aatataaatc atgctcattg
aatggttcag tggaaactac 600tctgaactt
60929732DNAHomo sapiens 29gagtttggga agggtatttt
aggggggaat aacttttgag ttcccagcgt gcgggggaag 60ggcgggacgg gagggtgtcc
caaggcctga gaagatcagt gtggggcagg ggtcaggaat 120aacctgggag ggggccttgt
atgggggaaa taattgggaa gaggagagat gggatgaagg 180gggcctcagc gggtcgtctc
ctgtgtatgc agggtcgttc tgcagcgtct ctgggagatg 240gcgtccctgg gagccctcag
gtcgccccta cccgctgcgg ggtgctttcc tggcgtcacg 300ccttcctggc ccctggaggg
aaggaagtga aactctcctc ttcccccacc cggctggaat 360gcgagtcagg aagcctgggg
ctccagcctg ctccggctgc ccgggtcggg gatggggagg 420ggcgtggccg gagcgcaaag
ccccgcccct ccgcgccccc cccccggaag ccccgccgcc 480ggccgctaag gcgatcacgg
gccctgtcct aatatgggca accggaagcg gcccgcgcga 540ctgccctacg tcactccgtc
caaatttagt tgtggaagtc agcgggcgct ggtggcggga 600aggcgccgcg agccagtgcg
ggcggaaagg gggcgggggg cgcaccaccc cttaaagggc 660ccgcaccagg aatgaatgga
gccattcgaa caattctgca tcctattttt ggaggaagtg 720gaattagtat tt
73230488DNAHomo sapiens
30tttattttta aaaaagaaag aaagaagaga aaagggatgg gtttattgtc cttttcaaca
60gactagagta tacggggtga aactgcttca cttgattcaa taaaatcgtt tccggtaaca
120ggccccagga atcctagacc taagcctggc gcgaaactac atttcccaca atccttcggg
180ggctgataag gctccgcaat ggtctgaact acaattccca caatccaggg cgatttccgc
240tttgtcgcgt ttcctcaagg ctccgcccca tttcccatct ttcttttcag tccttgcgca
300ccggggaaca aggtcgtgaa aaaaaaggtc ttggtgaggt gccgccattt catctgtcct
360cattctctgc gcctttcgca gagcttccag cagcggtatg ttgggccaga gcatccggag
420gttcacaacc tctgtggtcc gtaggagcca ctatgaggag ggccctggga aggttagtgt
480gtaagggg
48831248DNAHomo sapiens 31accctcattt cacatttcac cccttcctca aaatgctccc
ttcatattac ctcctcagaa 60accaagaata tggctactaa ttctccctgg ccccatgctg
caggtgaacc ggtagcccag 120aggtatcaca taattctccc aaagtcacac agcaaatcaa
gatgcatcca ggactagaag 180ccatgtcagc cacactggga agccccagcg aagctgacag
aaagtttcat aataccaccc 240tctcccct
24832480DNAHomo sapiens 32aaacacccca gtctgaaaat
aaccatagtt tgttgctctt acgagtgaaa atgctatttc 60atacacgaag ctttgtcctt
cagcacccaa gatttaagga taattatgga tgaatattat 120ggattcattt taaatccttt
ggcaaatctg ctctgggggc ttctctgtca gaaggtctct 180ccttcccaac tctaagaaac
gttattccta tgcaaatgct gctgagtcaa gacggggagg 240gaagtgcaga gagaagggct
ggtggcatgg tcagtaagtc atgagggtga gattaggggt 300gacacactgc ttgccaacgt
aggagaaggc tctgccctca cctagcaggt ctgatggaag 360ccccttattc cgtccttcct
gccgggttcc accgagatcc aaaaaggaat gctgtgtagg 420agcacatgat atgtgataaa
tgagagaaag gtcaaacatt taaggaacgc ccagagaaag 48033463DNAHomo sapiens
33cgctgggcgc gagtgaagag cccatcaggc aggtcgcgca ggaagcgctt gagcgccgag
60gaaacatcat ccacgtgctg ctcgccctcc ttgaggtgca cagagcgcgc atcctgccgc
120aggctctcca gcagccgctg tgtcttcgat gtctgcccac acttgcggta gatgccctcg
180gaggtcaggc ctagggaggg gcggggccaa gcgttcgggg cctgaggcat agagtcatgg
240ggcggggccg cgcagctctg gggcgggagg cggctctccg ggaggggcgg ggctggcacc
300ctaggggcag ggctcaccgc actgcgtgat gtagtccaca cagcggtaca cgatcaccgg
360gatatccgag tccccaagct gctgctccga cagcgtgtcc cccatgctgg cggctgcttt
420ctggatggcc cccagccaac ccatgaagtc cagccgccgc tcg
46334324DNAHomo sapiens 34cgatcccgtt cactcgcctg cccatccgca tggccaaggg
gctgggcaac atctctgcca 60agtatcgctg gttcgccgtc ttctacctga tcatcttctt
cttcctgatc ccgctgacgg 120tgtttggcct ctcgctggcc ggctggcggg tgctggttgg
tgtcggggtt cccgtcgtct 180tcatcatcat cctggtactg tgcctccgac tcctgcagtc
tcgctgccca cgcgtcctgc 240cgaagaaact ccagaactgg aacttcctgc cgctgtggat
gcgctcgctg aagccctggg 300atgccgtcgt ctccaagttc accg
32435264DNAHomo sapiens 35cgcgagagga ggggaatggc
aggtccccgc ttcgcgtacc ttggaaataa gctcatcgtg 60tttggccagg tgtgcacggc
agtggacaca gctgtaagtg cggtgacagc ggggcagata 120gctgcggaaa gtcttggtgg
ggaggcaggc agggcccgga ccggggtcac agctgggcat 180gacgggctgg aggacaatgc
cctggtgggc tggaggggct ggcgccgtgc agcccccgca 240gagacggtcg caggtgaagc
agcg 26436300DNAHomo sapiens
36cggtgctcac cggctcgacc ccccagcaac acgagagacc tcacagaggg agtcacacta
60acgtggtcgg ggctccagag cgaaacccca accactatgc tcacagccag gaccgagcag
120gctgggccaa cggcagtccc tgcccagcgc ccggctccct ccgagtggcc agcagcgccc
180tctggtggag actggctcgg cctccgcggc actgcattcc cacggcagtg gtccatctag
240tccccaagtc ctagaggagg cccctctctc tccctcagcc ctggcagggt ccttggcgcc
30037482DNAHomo sapiens 37ctgagagcca tggcgagagc aatgctaggc cggtgaacag
taggctcgag tttaggtttg 60aaaggtgagg tgagagaaat cggcaaaggg aacccctgcg
cagatctcgg gttcctttac 120tttataaccg cgggttccgg ttcctgccag gtgactgcac
agttcatcct catgaccctt 180ctcagccaat gggaagagag cgacgcccag gaagtcccgc
cctgtcccgg cctgtgggcg 240cgtcctcggg tccttctacg tcgctgactc gtgacctgac
cggtattttt ttcctaaact 300gggatcttgg gtaggaggaa gaaaagataa ggagttcctc
tatctgaaat tagtcgggct 360gttttgagga gtactggtta ggtatattgg agaatgtgcc
tttattggaa tttttcgcat 420aattacacag ggttatgggc ttaggggtac atgattgttg
gccgggcgtg gtggctcacg 480cc
482381301DNAHomo sapiens 38ttgcagggct agccaggata
agcaatggat gctgtttaat tcatcttagc ctcagaatgg 60atcaagagta aggtgctatt
ccctctcaaa ggaaacgcta attaaatgat ccttggtgaa 120actcaggctg agggctcaga
ggtgtggtga tgtaatgggc tttggaatta gacagggact 180gaacatttgc ttttgaaatt
tactatctat gtaccgttgg aaaatttact taatatctct 240gaattttttt tcttcaactg
tggagtgagg aaaataatac ctacttttag gtagatgatg 300gatataacac ttttctctgc
atatagtaga cactcagtgc ataactatcg ccttcctttt 360ccctctactc agaaacaagg
acatctggga ccacagccac atacttacct ccagtcgttt 420catatcaacc aactgagctc
taacattttt ctgcagaagc tggatatgct gtactttttc 480tatgactttg cgcttcagga
cttcaattct gcttctcaga tcctctgaca ctcggttgta 540ggtattatca cggtctgaaa
tcgaaaatat ggttattgaa gtagctgctg agtgatttgt 600ctgtaattgc cagcaaaaaa
gaaaggaaga aaggaaggaa ggagaaagaa agaaagaaag 660aaagaaagaa agaaagaaag
aaagaaagaa agaaagaaag agaaaaaaga aagaaagaaa 720ctagcttgta aatatgccta
attttatttt ggttacagtt taatctgtga gttcaaaacc 780tatggggcat ttgacttttg
gataatgtta tgccctgcag ccttccatga atgccagtta 840agatgtccta atagcaatta
gtaatcccaa agaaatatag aagaagaact ttctttggaa 900ttttaaaggt gtaatttgga
gttaaaatag ttggtttgat tgcatttcaa ttattttata 960acatccttaa tcaagggact
tgaacatatt ggattttctt actgatgagc ttttcttttt 1020aatctataga tttgaaatgg
ttcctaagct gttttgggtc aacaggatca ctcacttgcc 1080agctagtgtt gcatcactga
ttttaaatgt caagtgtttg tgaaggtgta aaaaggcaaa 1140gcaaaacttg agaaactgag
gactccctag actcgctgtc catgcccaga gtgaatgcaa 1200tgtttcctaa ccctaatgag
tagactgtga gaatgacgta gcttgaccct atattttaaa 1260tttaaaaatc tacctaatca
gctcagtgga gtctgggagt t 130139660DNAHomo sapiens
39gaactgaaat ttcggaggga gctaagagct ccatgttttt attttactat tctttaaaca
60agcagacaca gtgctggttt ctgatcatgt gggaggtgtg taggagagaa cacaggtaaa
120gtaaaataaa aatataaagc cataaatgcc acaacagaaa ttcaatgaac aaacatagaa
180gagaatacct taattcctag aagacagaga gaagagttta tgaaaggcat cctagaagag
240gagatatttg cactgattct taaaaggtga gagtacaaga cttcctctcc aggagtcggc
300ggagggaggg cagactcaaa gtgctcctgg acgcagaggc tcttgtcaga gggcacagac
360cggttggaac aaagtaagga tctgagcgac cccaactttg cagccgaggc ctccagctcc
420gaggtgcata gcaaccctag ggttccggta ggcgttcctc cgtccgcgac cctggcagag
480ccgcagagcc ctcctccaga cccgaccact gccccaggcc ccgagcgacc ggaaggctca
540gcagcaggcc gcggagaagg gcggcgccca ccaggcccct agcactgccc agtctggccc
600ggcacagctg ctgcagaagg cgcacgacga gctcgtgtgg tacatgcggg tcaaggacca
66040349DNAHomo sapiens 40cgcggacctc ggactcacca agtgccgagt ggcagatgtg
ctgctgaggg tgcgccgggg 60cgcagctgca tgcctcaccc agccccgggg gccgcagcaa
cgccagcagc cgcagcaaca 120gcacccagct tggcgcgggc cgagggctcc caggcatgac
actgcagatc cgcgactgag 180cctgtgaggt ctgggggact ggacggcccc agcagggctc
cttcccaagg ccgttgtgcc 240cctcgcccca ggctttatga ggtggcccta agggccaatc
ccgccccgac gggctccgcc 300ttcctttggc tctaggccac ccgcggaggc aggacccgag
gctcttccg 34941422DNAHomo sapiens 41cgcgtgccac ggggaggagg
actgggggcg tttgaggggc tcagcgcacc agaggagtga 60ggtggaggag ggcgttcccg
cgtcctcctc ttcaatccag agcagctcaa cgacgtggct 120ccctttctat gtatccctca
aagccttcgc gtcggattaa aggtgttctt gatccttctt 180taccaaccac ggtgcgggcc
aggcgtgatg agggatgagg gagaggaaac ctcagtagca 240aaattgttca gaggacgttc
ggagggcgcg gggagcagcc ggatgcacac ctaaagtctc 300gcaacaccca actcctcctc
cgcaggcagt cccttaagag aatagataaa aaggccaagc 360aaagatcctc tcccctcggc
cccggggcac tgccacattc agtctaggca tccccttctg 420ct
42242620DNAHomo sapiens
42gctcgggtcc gggggtgtgg atgaaggagc cccaggcagt ctcatgagca cagagagcac
60cgtaggctgc ggtgagctcc ggctcatcct cccagctaca tgactgcagc ctcctatgcg
120catcccagcg ggcatggatc agggccagtc cctgagcatc cttggccagg aagctcaggt
180accccagtgg gttgccaggg acggccttgg tcaagtggca ggaggtcctg taccagcgga
240gggcagggga gccccccagg gccaccccca ggaagcccag catcccaaac agccctgcct
300gaacccccat tctgcactgg cccagtccag tcagacaaag cccctgggat gcctgccctt
360ggtggcccca ccaggcggca gctgagcagt ggaacggaag cggagcccag caggcccggt
420gcggcgggac caatgaatgg agctgcggga ggaggaggaa agaggctgga gtatggggtg
480atcttgggct tgtaaccgaa tccaccagcc gggcaggacg ctgattggct gaggagtgca
540cttgccaggg cccacgcccc cattctgcct gccttctcag caccatccag tcacctgctg
600ccagccctgc ctagattggg
620431012DNAHomo sapiens 43cggcgcgctg gctccctgga gcggggcggg acgcggccgc
gcggactcac gtgcacaacc 60gcgcgggacg gggccacgcg gactcacgtg cacaaccgcg
ggaccccagc gccagcggga 120ccccagcgcc agcgggaccc cagcgccagc gggaccccag
cgccagcggg accccagcgc 180cagcgggacc ccagcgccag cgggacccca gcgccagcgg
gtctgtggcc cagtggagcg 240agtggagcgc tggcgacctg agcggagact gcgccctgga
cgccccagcc tagacgtcaa 300gttacagccc gcgcagcagc agcaaagggg aaggggcagg
agccgggcac agttggatcc 360ggaggtcgtg acccagggga aagcgtgggc ggtcgaccca
gggcagctgc ggcggcgagg 420caggtgggct ccttgctccc tggagccgcc cctccccaca
cctgccctcg gcgcccccag 480cagttttcac cttggccctc cgcggtcact gcgggattcg
gcgttgccgc cagcccagtg 540gggagtgaat tagcgccctc cttcgtcctc ggcccttccg
acggcacgag gaactcctgt 600cctgccccac agaccttcgg cctccgccga gtgcggtact
ggagcctgcc ccgccagggc 660cctggaatca gagaaagtcg ctctttggcc acctgaagcg
tcggatccct acagtgcctc 720ccagcctggg cgggagcggc ggctgcgtcg ctgaaggttg
gggtccttgg tgcgaaaggg 780aggcagctgc agcctcagcc ccaccccaga agcggccttc
gcatcgctgc ggtgggcgtt 840ctcgggcttc gacttcgcca gcgccgcggg gcagaggcac
ctggagctcg cagggcccag 900acctgggttg gaaaagcttc gctgactgca ggcaagcgtc
cgggaggggc ggccaggcga 960agccccggcg ctttaccaca cacttccggg tcccatgcca
gttgcatccg cg 101244295DNAHomo sapiens 44cgcgctgagc ggttggtgag
gagacagggg tcatcgtgca ggttgtcaaa gggcagcagg 60gcccggccgt tgtcttggaa
gcgctggttg acggccagca gccccagctg gttggacatg 120ttgcgcaggt tcctggccag
gggctcctcg ctgccgtaca ccatgctggc gtccacgaag 180gaagtgagcg cgttgatctg
gttgcggatg gtgatgttgc tcccggggca agccgggcag 240gagcggaaga acgggatgca
gtcggcttgg ttcttgatgc gggggtcatt gggcg 29545801DNAHomo sapiens
45tgcccaccag aagcccatca ccaccagcaa agccaccacc aaagccacca cccaagccag
60caccaaggcc accaccatat cctcccccaa agccactacc aaagctgctg ctgctgctgc
120tgaagccacc gccatagccg ccccccagcc cgcaggctcc cccagaggag aagcgggagg
180atgagacaga caggccgccc ccgtaggtgc tgggggcgcg gcaggaccct ccggccagga
240cggaggagat gcggctggag ccgcccccga tgccgccccc gatgccgcag gagcccttca
300tggagctgga ggaggtgaac tggcggctgc aggtggtcat ggtgcagagg agggaggtga
360gcgagcgagc agttggctga gtgaagagaa ggtgctcggg taaattggaa agggatgcga
420gtgctttata ctcgtgggta gggggcgggt ctggcacttt ccattcccct tggctttcat
480cacccacagg ctagcgccaa ctcccagcca ggtccctcct ctcatccgcc tcatcatgtc
540tgtcatattt tactggaaac tcattgtttg gagtgttttg ggctttcttg tcccgccagg
600cgtgattcac agggggaggt gtgggcctgc aggctacact ttcccatcgg accctgggag
660tcccagccct caggaacccg cgcactgggc ttagccaggg tgacagagag cagggcctct
720gcaccttaaa cctagttacc tgctagctct ccatgaactg aatgggcctt taacatccac
780gtagaggaag cctgctgctg c
80146434DNAHomo sapiens 46cgatggagga catcgtcatg gtcacaggga tggcgtcgaa
gtaggacgag tgaggcgcga 60gcgtgaggat ggccgcctcg gtgggcagcg cctgccgccc
cttcacggcc acccggtgga 120agccgccggc gaaccacatg gtgcgcatga tggccttcag
caggaagtcc acaaccctgc 180aaaagagggc gctgcgtcac gcgggcacac gtccgcagtc
tcggagtctg tgtgaggcac 240aggggcggtc ccacgggaga gccctccagg gcgcagtcca
ggccacgggc ttcctgtggt 300cgccgccgct gggacatctg cttgagggaa gaaaagacgc
cgcgccttcc tggcctccgc 360ctgtgtcctc gctggctgcg ctctcaccta cgaaggaggc
cgcggggccc tgtgtggtgg 420tcacgggcca cgcg
43447411DNAHomo sapiens 47cgtccatctc ggccttcgaa
ggcacgtgcg tctccatccc ctgccgcttt gacttcccgg 60atgagctgcg gcccgctgtg
gtgcatggtg tctggtactt caatagcccc taccccaaga 120actacccccc ggtggtcttc
aagtcgcgca cccaagtagt ccacgagagc ttccagggcc 180gcagccgcct cctgggggac
ctgggcctgc gaaactgcac cctcctgctc agcaacgtca 240gccccgagct gggcgggaag
tactacttcc gtggggacct gggcggctac aaccagtaca 300ccttctcaga gcacagcgtc
ctggatatcg tcagtgagtc cccagcggtt gtgcaggcac 360cgggagctgg ggcagcgggg
cgggaaggag tgtggccgga aggcctcccc g 41148600DNAHomo sapiens
48cgggtggctc caccctgcgt cgggcctcag tcagcccccg ggggaggcca tgaacgccac
60ggggaccccg gtggcccccg agtcctgcca acagctggcg gccggcgggc acagccggct
120cattgttctg cactacaacc actcgggccg gctggccggg cgcggggggc cggaggatgg
180cggcctgggg gccctgcggg ggctgtcggt ggccgccagc tgcctggtgg tgctggagaa
240cttgctggtg ctggcggcca tcaccagcca catgcggtcg cgacgctggg tctactattg
300cctggtgaac atcacgctga gtgacctgct cacgggcgcg gcctacctgg ccaacgtgct
360gctgtcgggg gcccgcacct tccgtctggc gcccgcccag tggttcctac gggagggcct
420gctcttcacc gccctggccg cctccacctt cagcctgctc ttcactgcag gggagcgctt
480tgccaccatg gtgcggccgg tggccgagag cggggccacc aagaccagcc gcgtctacgg
540cttcatcggc ctctgctggc tgctggccgc gctgctgggg atgctgcctt tgctgggctg
60049540DNAHomo sapiens 49cggggcgagc acgtgcacct cgtgaccacc ggctctctag
agccccaggc agaggcccag 60ctctgcagta gggaaggcat cgggagtgcc agggtgaacg
taccccaagg gcccggcacg 120actgacctct cgtgcctgct ctctcccttc ctcgccaagc
ccccgtgatg tgggaagcca 180gcgtgaggcc ggtggggcag ccgccttccc gtggctgtgc
caagtccccc cggtcctctg 240cacatcatgc ctccttccac accctgacag gaagcagctg
ggagaagccg ttgggtgcac 300tcactccctg atttacgaca agttccttcc tcagcgcctc
tctctcctgc ctcctcctgc 360tctcctgccc tcccctgggc ctcgggaggt gccacgcaag
cccaagaagc atcagcatac 420tgtccctccc tctcctgtgg ccacgggctc ccccagggag
ctgagagtag cagcagctca 480cagcccaagc cacccttgcc cgtttctagg caggtggtgg
caccaggcac gaaggaagca 54050224DNAHomo sapiens 50cggtgacccg gccgggtcga
agggcagagt tccgctgtca ctagccctcc acccgtcctg 60tgtgctggga tgccctcgcg
gcgccgtcca cgccaccgcc gccccctctt gtgggttctg 120tctcctccgt gtctaggatc
ctcctgcatc cgtttttcct tcctcccttc tctccctccg 180tctgtcttgc ccgcacctga
ggttgtcgca gaggcgctga gacg 22451316DNAHomo sapiens
51cgcgggctgc ggggctgcgg ggagggaggg gcgggttcag ggctgtgggc cccgcccggg
60gcaccgcctg gatcaggcct gaggccggct gcagagaact tgggcaccgc ggaccagatt
120gctggtcacc aggatgaaaa ataaaaaaga cccaaacagc tcccccgacc ccgccttcgc
180gcaggcccct ggcgttctgc tcaggggttt ttgtttaatg aagaacgtca aacatctggc
240aaggtcggaa tgattttgcg atgagcaccg cctggattct gcggtgaaag cgactgtgtg
300cgcgctcacg gcctcg
31652372DNAHomo sapiens 52cgggcgccgc cccccttcct cctccatcag caacaggcgg
cgccggccag cctcatagtc 60agcctcatcc acactgacca gcaggcgaac agcctcccgg
cccacagcct ctcgcagggc 120ctcagtcagg aacacgcccc gcagggcctg cagcagggcg
ccactcaggt agtcgcccca 180gaaggcgtcc agataggaga gctctgagaa cttgatgtca
caaaccacag agcccaggtc 240ccttgagcgc agcactgcgg tggcctgccc aaacacgtcc
agctgccgcg ccagcgcctg 300gggccgccgg gatgccacgc cctgctccaa ggctggccca
tgctcgcagt actctgctcg 360aacccggagc cg
37253258DNAHomo sapiens 53cgcccagggc caggccgttg
atgatgacgg ggcccccgtt gaggagcact gctggggagc 60cgctggctgc caggaagctc
ccgttcacca ggatggagga ggaagccggg caaggcgcgg 120gagggccggt ccctgccagg
aatatggagc cctgggcagc ggcctcggcg gacactgggg 180ccgcccctct ctccaggtcc
tcaggacttc ggctggactc gtcctcagtc gtgggattcc 240catcagactc gctggccg
25854398DNAHomo sapiens
54cgccttttcc ttcggtcact cagaccgcgc ccgaggtccc tggtgccccc gcgggggagc
60tgaggtttgc ggtccctcct ggggttcgct tcccgcgggg ctaaaccgcg gcgaccaggg
120cccctttctc cactggtgcc ttttccggga aacgctgctc cttagatgga cgaatacgta
180ctcggtaccc agcacatcct ggacgagtta acttccttaa tttccatatt tgccggagaa
240ccagctggtt cagagcgcac agcaaacggg agaagttaaa ccaggttccg cgacccagag
300cccaggggtg gccccgggga cacccacctg actccgcacc ccccacgaga ggggaggatc
360cttgcagacc tcacctttgc tggcaacgct gcggcccg
3985520DNAArtificial Sequencesource/note="Description of Artificial
Sequence Synthetic primer" 55aagagcccat caggcaggtc
205629DNAArtificial
Sequencesource/note="Description of Artificial Sequence Synthetic
primer" 56gtttcttgtc gagcagcacg tggatgatg
295721DNAArtificial Sequencesource/note="Description of Artificial
Sequence Synthetic primer" 57ctccagaact ggaacttcct g
215827DNAArtificial
Sequencesource/note="Description of Artificial Sequence Synthetic
primer" 58gtttcttaac ttggagacga cggcatc
275920DNAArtificial Sequencesource/note="Description of Artificial
Sequence Synthetic primer" 59tggaggacaa tgccctggtg
206028DNAArtificial
Sequencesource/note="Description of Artificial Sequence Synthetic
primer" 60gtttcttggc ttcacctgcg accgtctc
286119DNAArtificial Sequencesource/note="Description of Artificial
Sequence Synthetic primer" 61ccctccgagt ggccagcag
196225DNAArtificial
Sequencesource/note="Description of Artificial Sequence Synthetic
primer" 62gtttctgacc actgccgtgg gaatg
256321DNAArtificial Sequencesource/note="Description of Artificial
Sequence Synthetic primer" 63cttctcagcc aatgggaaga g
216420DNAArtificial
Sequencesource/note="Description of Artificial Sequence Synthetic
primer" 64acgtagaagg acccgaggac
206522DNAArtificial Sequencesource/note="Description of Artificial
Sequence Synthetic primer" 65tacagacaaa tcactcagca gc
226631DNAArtificial
Sequencesource/note="Description of Artificial Sequence Synthetic
primer" 66gtttcttgtc tgacactcgg ttgtaggtat t
316719DNAArtificial Sequencesource/note="Description of Artificial
Sequence Synthetic primer" 67gcagcaggcc gcggagaag
196820DNAArtificial
Sequencesource/note="Description of Artificial Sequence Synthetic
primer" 68cagcaacagc acccagcttg
206923DNAArtificial Sequencesource/note="Description of Artificial
Sequence Synthetic primer" 69aggaaacctc agtagcaaaa ttg
237019DNAArtificial
Sequencesource/note="Description of Artificial Sequence Synthetic
primer" 70cgtaggctgc ggtgagctc
197122DNAArtificial Sequencesource/note="Description of Artificial
Sequence Synthetic primer" 71cagcctagac gtcaagttac ag
227221DNAArtificial
Sequencesource/note="Description of Artificial Sequence Synthetic
primer" 72cccagctggt tggacatgtt g
217320DNAArtificial Sequencesource/note="Description of Artificial
Sequence Synthetic primer" 73gagaagcggg aggatgagac
207420DNAArtificial
Sequencesource/note="Description of Artificial Sequence Synthetic
primer" 74gccttcagca ggaagtccac
207521DNAArtificial Sequencesource/note="Description of Artificial
Sequence Synthetic primer" 75gtgcatggtg tctggtactt c
217620DNAArtificial
Sequencesource/note="Description of Artificial Sequence Synthetic
primer" 76cagcctgctc ttcactgcag
207722DNAArtificial Sequencesource/note="Description of Artificial
Sequence Synthetic primer" 77ctccctgatt tacgacaagt tc
227820DNAArtificial
Sequencesource/note="Description of Artificial Sequence Synthetic
primer" 78aagggcagag ttccgctgtc
207920DNAArtificial Sequencesource/note="Description of Artificial
Sequence Synthetic primer" 79cggaccagat tgctggtcac
208021DNAArtificial
Sequencesource/note="Description of Artificial Sequence Synthetic
primer" 80agcctcatcc acactgacca g
218120DNAArtificial Sequencesource/note="Description of Artificial
Sequence Synthetic primer" 81gccaggccgt tgatgatgac
208219DNAArtificial
Sequencesource/note="Description of Artificial Sequence Synthetic
primer" 82agcagctgtg ccgggccag
198320DNAArtificial Sequencesource/note="Description of Artificial
Sequence Synthetic primer" 83cacaggctca gtcgcggatc
208421DNAArtificial
Sequencesource/note="Description of Artificial Sequence Synthetic
primer" 84gcgagacttt aggtgtgcat c
218520DNAArtificial Sequencesource/note="Description of Artificial
Sequence Synthetic primer" 85gatccatgcc cgctgggatg
208620DNAArtificial
Sequencesource/note="Description of Artificial Sequence Synthetic
primer" 86acgacctccg gatccaactg
208719DNAArtificial Sequencesource/note="Description of Artificial
Sequence Synthetic primer" 87cacttccttc gtggacgcc
198819DNAArtificial
Sequencesource/note="Description of Artificial Sequence Synthetic
primer" 88ccgcatctcc tccgtcctg
198920DNAArtificial Sequencesource/note="Description of Artificial
Sequence Synthetic primer" 89cctgtgcctc acacagactc
209021DNAArtificial
Sequencesource/note="Description of Artificial Sequence Synthetic
primer" 90gaagctctcg tggactactt g
219120DNAArtificial Sequencesource/note="Description of Artificial
Sequence Synthetic primer" 91agaggccgat gaagccgtag
209222DNAArtificial
Sequencesource/note="Description of Artificial Sequence Synthetic
primer" 92gacagtatgc tgatgcttct tg
229320DNAArtificial Sequencesource/note="Description of Artificial
Sequence Synthetic primer" 93cggatgcagg aggatcctag
209421DNAArtificial
Sequencesource/note="Description of Artificial Sequence Synthetic
primer" 94cgaccttgcc agatgtttga c
219521DNAArtificial Sequencesource/note="Description of Artificial
Sequence Synthetic primer" 95tcagagctct cctatctgga c
219620DNAArtificial
Sequencesource/note="Description of Artificial Sequence Synthetic
primer" 96gaatatggag ccctgggcag
209720DNAArtificial Sequencesource/note="Description of Artificial
Sequence Synthetic primer" 97gcgaaggaag tgctggagtc
209822DNAArtificial
Sequencesource/note="Description of Artificial Sequence Synthetic
primer" 98caaagtactg gggttacagg tg
229922DNAArtificial Sequencesource/note="Description of Artificial
Sequence Synthetic primer" 99gtttcttgaa agggccagac ac
2210023DNAArtificial
Sequencesource/note="Description of Artificial Sequence Synthetic
primer" 100ggatgaacct ttaagacatc atc
2310120DNAArtificial Sequencesource/note="Description of
Artificial Sequence Synthetic primer" 101cagcaacagc acccagcttg
2010224DNAArtificial
Sequencesource/note="Description of Artificial Sequence Synthetic
primer" 102ggacgagtta acttccttaa tttc
2410320DNAArtificial Sequencesource/note="Description of
Artificial Sequence Synthetic primer" 103cacaggctca gtcgcggatc
2010428DNAArtificial
Sequencesource/note="Description of Artificial Sequence Synthetic
primer" 104gtttcttcgc ggaacctggt ttaacttc
28
User Contributions:
Comment about this patent or add new information about this topic:
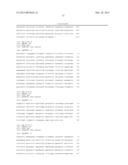 | 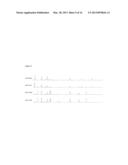 |
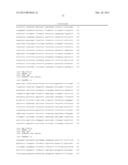 |  |
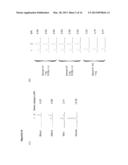 | 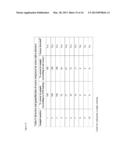 |
 | 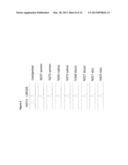 |
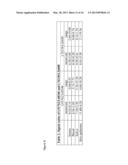 | 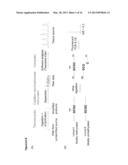 |
 | 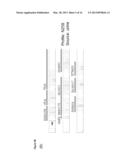 |
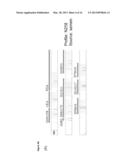 | 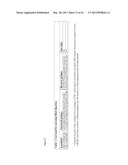 |
 |  |
 |  |
 |  |
 |  |
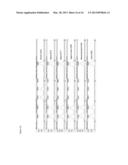 | 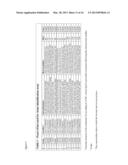 |
 |  |
 |  |
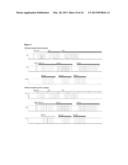 | 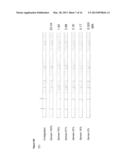 |
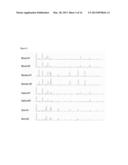 |  |
 |  |
 |  |
 |  |
 |  |
 | 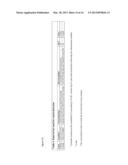 |
 | 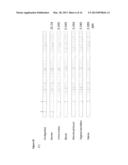 |
 |  |
 |  |
 |  |
 |  |
 |  |
 |  |
| Similar patent applications: | |
| Date | Title |
|---|---|
| 2013-02-07 | Preservation of cell-free rna in blood samples |
| 2013-03-07 | Cell suitable for fermentation of a mixed sugar composition |
| 2012-06-07 | Method for automatic determination of sample |
| 2013-03-14 | Method and system for determination of molecular interaction parameters |
| 2013-03-14 | Fluorescent substrate for detection of enzymatic activity of nitrile-related enzyme |
| New patent applications in this class: | |
| Date | Title |
|---|---|
| 2022-05-05 | Photocleavable mass-tags for multiplexed mass spectrometric imaging of tissues using biomolecular probes |
| 2022-05-05 | Macrophage expression in breast cancer |
| 2022-05-05 | Characterizing methylated dna, rna, and proteins in the detection of lung neoplasia |
| 2022-05-05 | Methods for identifying and improving t cell multipotency |
| 2022-05-05 | Sequence analysis using meta-stable nucleic acid molecules |
| New patent applications from these inventors: | |
| Date | Title |
|---|---|
| 2013-04-04 | Methylation profiling of dna samples |
| 2012-07-26 | Methods for distinguishing between natural and artificial dna samples |
| 2012-01-05 | Identification of source of dna samples |
| Top Inventors for class "Chemistry: molecular biology and microbiology" | |
| Rank | Inventor's name |
|---|---|
| 1 | Marshall Medoff |
| 2 | Anthony P. Burgard |
| 3 | Mark J. Burk |
| 4 | Robin E. Osterhout |
| 5 | Rangarajan Sampath |