Patent application title: DUCTILE IRON
Inventors:
Takashi Arai (Nagasaki, JP)
IPC8 Class: AC22C3706FI
USPC Class:
420 15
Class name: 1.7 percent or more carbon containing 2.7 percent or more carbon equivalent containing (i.e., cast iron) chromium containing
Publication date: 2011-09-01
Patent application number: 20110211986
Abstract:
A ductile iron having superior high-temperature strength and oxidation
resistance at temperatures exceeding 800° C. compared with
conventional high Si and Mo ductile iron. The ductile iron comprises, in
terms of mass ratio, carbon: 2.0 to 4.0%, silicon: 3.5 to 5.0%,
manganese: not more than 1.0%, chromium: 0.1 to 1.0%, molybdenum: 0.2 to
2.0%, vanadium: 0.1 to 1.0%, and magnesium: 0.02 to 0.1%, with the
remainder being composed of iron and unavoidable impurities.Claims:
1. A ductile iron comprising, in terms of mass ratio, carbon: 2.0 to
4.0%, silicon: 3.5 to 5.0%, manganese: not more than 1.0%, chromium: 0.1
to 1.0%, molybdenum: 0.2 to 2.0%, vanadium: 0.1 to 1.0%, and magnesium:
0.02 to 0.1%, with a remainder being composed of iron and unavoidable
impurities.
2. The ductile iron according to claim 1, further comprising a mass ratio of tungsten: 0.1 to 1.0%.
3. The ductile iron according to claim 1, further comprising a mass ratio of niobium: 0.02 to 0.30%.
4. The ductile iron according to claim 1, further comprising, in terms of mass ratio, tungsten: 0.1 to 1.0% and niobium: 0.02 to 0.30%.
5. The ductile iron according to claim 1, wherein the spheroidization rate of graphite is 90% or higher.
6. An exhaust system component, produced using the ductile iron according to claim 1.
7. The exhaust system component according to claim 6, wherein the exhaust system component is a turbine housing, an exhaust manifold, or a turbine housing-integrated exhaust manifold.
8. The ductile iron according to claim 2, wherein the spheroidization rate of graphite is 90% or higher.
9. The ductile iron according to claim 3, wherein the spheroidization rate of graphite is 90% or higher.
10. The ductile iron according to claim 4, wherein the spheroidization rate of graphite is 90% or higher.
11. An exhaust system component, produced using the ductile iron according to claim 2.
12. An exhaust system component, produced using the ductile iron according to claim 3.
13. An exhaust system component, produced using the ductile iron according to claim 4.
14. An exhaust system component, produced using the ductile iron according to claim 5.
Description:
TECHNICAL FIELD
[0001] The present invention provides a ductile iron having superior high-temperature strength and oxidation resistance.
BACKGROUND ART
[0002] Ductile iron exhibits excellent high-temperature strength and oxidation resistance, and is used in turbine housings and exhaust manifolds of turbocharger in the diesel engines of passenger vehicles and industrial machinery, and the like. In recent years, improvements in fuel consumption driven by environmental regulations have resulted in a tendency for increased engine exhaust gas temperatures. Turbine housings and exhaust manifolds are used under conditions where they are subjected to rapid temperature variation as a result of repeated exposure to high temperatures generated by the exhaust gases, and therefore require superior levels of high-temperature strength and oxidation resistance.
[0003] A high Si and Mo ductile iron (ductile cast iron) is conventionally used as the material for turbine housings, and the service temperature limit is typically not more than 800° C. However, in recent years there have been growing demands for turbine housings that can be used at temperatures exceeding 800° C.
[0004] Examples of other turbine housing materials having superior levels of high-temperature strength and oxidation resistance that may be used instead of high Si and Mo ductile iron include Ni-resist cast iron and stainless cast iron. However, these materials include large amounts of Ni and Cr within the raw materials, meaning the raw material costs are high.
[0005] Accordingly, investigations are being conducted into improving ductile iron by appropriate alloy design, thereby improving the high-temperature properties such as the heat resistance. For example, patent citation 1 discloses a ductile iron prepared by adding V to a high Si and Mo cast iron.
PRIOR ART CITATIONS
Patent Citations
[0006] Patent Citation 1: Publication of Japanese Patent No. 3,936,849
DISCLOSURE OF INVENTION
Problems to be Solved by the Invention
[0007] However, although the ductile iron of patent citation 1 was capable of improving the high-temperature strength at temperatures exceeding 800° C., the oxidation resistance was unsatisfactory.
[0008] The present invention has an object of providing a ductile iron that has improved levels of high-temperature strength and oxidation resistance compared with conventional high Si and Mo ductile iron as well as superior ductibility.
Means to Solve the Problems
[0009] In order to achieve the above object, the ductile iron of the present invention comprises, in terms of mass ratio, carbon: 2.0 to 4.0%, silicon: 3.5 to 5.0%, manganese: not more than 1.0%, chromium: 0.1 to 1.0%, molybdenum: 0.2 to 2.0%, vanadium: 0.1 to 1.0%, and magnesium: 0.02 to 0.1%, with the remainder being composed of iron and unavoidable impurities.
[0010] In the ductile iron of the present invention, the molybdenum content is optimized, and therefore the cast iron has excellent high-temperature strength as well as superior ductibility. Furthermore, the ductile iron of the present invention also comprises chromium, and because the chromium content is optimized, the cast iron exhibits superior oxidation resistance and ductibility. As a result, the ductile iron of the present invention can be used even under temperature conditions of 800° C. or higher. Furthermore, production can be conducted at lower cost than that of Ni-resist cast iron or stainless cast steel.
[0011] Further, the ductile iron described above preferably further comprises a mass ratio of tungsten: 0.1 to 1.0%. Alternatively, the ductile iron preferably further comprises niobium: 0.02 to 0.30%. Alternatively, the ductile iron preferably further comprises tungsten: 0.1 to 1.0% and niobium: 0.02 to 0.30%.
[0012] In this manner, by optimizing the amount of tungsten or niobium, or the amounts of both tungsten and niobium, the high-temperature strength can be further improved.
[0013] Reasons for restricting the amount of each of the components are described below.
[0014] Carbon (C): C and Si are extremely important elements in cast iron. If the C content is 2.0 mass % or less, then carbides tend to form readily, whereas a C content of 4.0 mass % or greater tends to induce graphite segregation (carbon dross), resulting in a deterioration in the strength and ductibility. Accordingly, the C content is specified as 2.0 to 4.0 mass %. Further, the carbon equivalent value (CE=C %+0.31Si %) is used as an indicator of the castability of the cast iron. The CE value of a typical ductile iron is within a range from 4.3 to 4.5. If this CE value is 4.3 or less, then defects tend to form more easily, whereas a CE value of 4.5 or greater tends to induce carbon dross. In the present invention, because the Si content is set to a high value as described below, the C content is preferably within a range from 2.7 to 3.2 mass %.
[0015] Silicon (Si): Si has the effects of promoting the graphitization of C and the ferritization of the matrix. The Si content in a typical ductile iron is approximately 2.5 mass %. In the present invention, the Si content is not less than 3.5 mass %. Further, because the toughness of the cast iron deteriorates as the Si content is increased, the upper limit for the Si content is 5.0 mass %. In order to further enhance the oxidation resistance, Si is preferably added in an amount of 4.3% or greater, but because the ductibility of the cast iron decreases and castability decreases due to increase of the CE value as the Si content is increased, the upper limit for the Si content is preferably 4.7 mass %.
[0016] Manganese (Mn): Mn is an element that is necessary for fixing the S that exists as an unavoidable impurity within the raw material as MnS, thereby rendering the S harmless. However, because Mn also causes formation of matrix pearlite structures, the upper limit for the Mn content is specified as 1.0 mass %.
[0017] Molybdenum (Mo): Mo is an element that undergoes solid dissolution within the matrix, thereby improving the tensile strength and yield strength at high temperatures. In the present invention, Mo is added in an amount of not less than 0.2 mass %. Moreover, in order to further improve the heat resistance, the addition of 0.4 mass % or more is particularly desirable. If the Mo content is too high, Mo and C tend to bond together to form carbides, and this causes the hardness to increase and the ductibility to deteriorate. Accordingly, the upper limit for the Mo content is specified as 2.0 mass %. In order to ensure no loss in cutting properties, the upper limit for the Mo content is preferably 1.0 mass %.
[0018] Vanadium (V): V is an element that is precipitated as fine carbides within the matrix, causing an increase in the tensile strength and yield strength at high temperatures. In the present invention, V is added in an amount of not less than 0.1 mass %. If the V content is too high, then the ductibility of the cast iron deteriorates, and therefore the upper limit for the V content is specified as 1.0 mass %. Further, because V has a strong tendency to form carbides, it tends to impede the spheroidization of C. Accordingly, the upper limit for the V content is preferably 0.4 mass %.
[0019] Chromium (Cr): Cr is an element that improves the oxidation resistance at high temperatures. In the present invention, Cr is added in an amount of not less than 0.1 mass %. In order to further enhance the oxidation resistance, addition of 0.2 mass % or more of Cr is preferred. If the Cr content is too high, then the ductibility of the cast iron deteriorates, and therefore the upper limit for the Cr content is specified as 1.0 mass %. Furthermore, Cr has a strong tendency to form carbides, meaning it impedes the spheroidization of C and tends to cause the size of the carbide grains within the matrix to coarsen, and therefore the upper limit for the Cr content is preferably 0.4 mass %.
[0020] Magnesium (Mg): Mg is added in an amount of not less than 0.02 mass % for the purpose of spheroidizing the graphite. However if the Mg content is too high, then carbides are generated and dross defects (the incorporation of oxides) tend to occur, and therefore the upper limit for the Mg content is specified as 0.1 mass %.
[0021] Tungsten (W): W, in a similar manner to Mo, is an element that undergoes solid dissolution within the matrix, thereby improving the tensile strength and yield strength at high temperatures. In the present invention, W is added in an amount of not less than 0.1 mass %. Moreover, in order to further improve the heat resistance, the addition of 0.2 mass % or more is particularly desirable. Because W also has a strong tendency to form carbides, meaning it tends to impede the spheroidization of C, the upper limit for the W content is specified as 1.0 mass %, and is preferably 0.4 mass %.
[0022] Niobium (Nb): Nb is an element that is precipitated as fine carbides within the matrix, causing an increase in the tensile strength and yield strength at high temperatures. In the present invention, Nb is added in an amount of not less than 0.02 mass %. If the Nb content is too high, then the ductibility of the cast iron deteriorates, and Nb also has a strong tendency to form carbides, meaning it impedes the spheroidization of C and tends to cause the size of the carbide grains within the matrix to coarsen, and therefore the upper limit for the Nb content is specified as 0.30 mass %. A preferred range for the amount of Nb, which realizes a marked strength improvement effect, prevents any significant deterioration in the ductibility and enables an increase in the spheroidization rate of C, is from 0.04 to 0.20 mass %, and a more preferred range is from 0.05 to 0.10 mass %.
[0023] In the above ductile iron, the spheroidization rate of the graphite is preferably 90% or higher. At a graphite spheroidization rate of 90%, the tensile strength and yield strength at high temperatures can be improved.
[0024] A turbine housing, exhaust manifold, and turbine housing-integrated exhaust manifold produced using the above ductile iron exhibit excellent high-temperature strength and oxidation resistance, and can be used under temperature conditions of 800° C. or higher.
Effect of the Invention
[0025] According to the present invention, by adopting the composition described above, a ductile iron having superior high-temperature strength and oxidation resistance as well as excellent ductibility can be produced at low cost.
[0026] A turbine housing, exhaust manifold, and turbine housing-integrated exhaust manifold produced using the ductile iron of the present invention are able to satisfactorily withstand usage under high-temperature conditions of 800° C. or higher.
BRIEF DESCRIPTION OF DRAWINGS
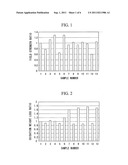
[0027] FIG. 1 A graph illustrating the 0.2% yield strength ratios for test pieces of sample numbers 1 to 13, referenced against the test piece of sample number 1.
[0028] FIG. 2 A graph illustrating the oxidation weight loss ratios for test pieces of sample numbers 1 to 13, referenced against the test piece of sample number 1.
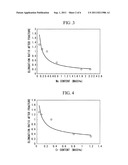
[0029] FIG. 3 A graph illustrating the relationship between the Mo content and the test piece elongation ratio after fracture (referenced against the test piece of sample number 1).
[0030] FIG. 4 A graph illustrating the relationship between the Cr content and the test piece elongation ratio after fracture (referenced against the test piece of sample number 1).
[0031] FIG. 5 A graph illustrating the 0.2% yield strength ratios for test pieces of sample numbers 1 and 14 to 18, referenced against the test piece of sample number 1.
[0032] FIG. 6 A graph illustrating the oxidation weight loss ratios for test pieces of sample numbers 1 and 14 to 18, referenced against the test piece of sample number 1.
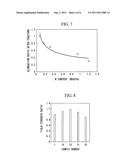
[0033] FIG. 7 A graph illustrating the relationship between the W content and the test piece elongation ratio after fracture (referenced against the test piece of sample number 1).
[0034] FIG. 8 A graph illustrating the 0.2% yield strength ratios for test pieces of sample numbers 1 and 19 to 22, referenced against the test piece of sample number 1.
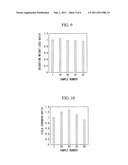
[0035] FIG. 9 A graph illustrating the oxidation weight loss ratios for test pieces of sample numbers 1 and 19 to 22, referenced against the test piece of sample number 1.
[0036] FIG. 10 A graph illustrating the 0.2% yield strength ratios for test pieces of sample numbers 1 and 23 to 26, referenced against the test piece of sample number 1.
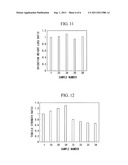
[0037] FIG. 11 A graph illustrating the oxidation weight loss ratios for test pieces of sample numbers 1 and 23 to 26, referenced against the test piece of sample number 1.
[0038] FIG. 12 A graph illustrating the tensile strength ratios for test pieces of sample numbers 1, 15, 20, 24 and 31 to 34 (referenced against the test piece of sample number 1).
BEST MODE FOR CARRYING OUT THE INVENTION
[0039] The ductile iron of the present invention is described below in more detail based on a series of examples.
Example 1
[0040] Table 1 shows the element composition of ductile iron test pieces of sample numbers 1 to 13.
TABLE-US-00001 TABLE 1 Sam- ple Num- Composition (mass %) ber C Si Mn Mo V W Cr Mg 1 2.98 4.68 0.42 0.41 0.29 -- 0.32 0.043 2 2.97 4.67 0.39 0.22 0.28 -- 0.32 0.042 3 3.03 4.62 0.40 0.82 0.30 -- 0.30 0.040 4 2.99 4.64 0.40 1.83 0.28 -- 0.28 0.042 5 2.92 4.65 0.39 0.10 0.30 -- 0.29 0.042 6 3.07 4.68 0.38 2.20 0.30 -- 0.31 0.040 7 2.97 4.62 0.38 0.39 0.29 -- 0.10 0.039 8 3.01 4.67 0.40 0.40 0.31 -- 0.82 0.042 9 2.99 4.66 0.41 0.40 0.30 -- 0.05 0.043 10 3.00 4.65 0.41 0.39 0.31 -- 1.20 0.040 11 3.06 4.63 0.39 0.40 0.30 -- -- 0.042 12 1.80 4.62 0.40 0.39 0.30 -- 0.30 0.040 13 3.06 3.30 0.40 0.39 0.28 -- 0.28 0.042
[0041] Raw materials were blended and melted to achieve the element compositions detailed in Table 1, and each composition was then cast in the shape of a Y-block B-type test piece prescribed in JIS G 5502, thus completing preparation of test pieces for sample numbers 1 to 13. Subsequently, each test piece was subjected to a heat treatment at 915° C. for 3 hours to effect ferritization.
[0042] Using the method prescribed in JIS G 5502, the spheroidization rate was measured for sample numbers 1 to 13. The spheroidization rate was at least 90% for each of the test pieces of sample numbers 1 to 11 and sample number 13. The spheroidization rate for the test piece of sample number 12 was 50%.
[0043] Each of the test pieces of ductile iron from sample numbers 1 to 13 was measured for 0.2% yield strength and oxidation resistance at 800° C., and for elongation after fracture at room temperature.
[0044] The oxidation resistance was evaluated using the oxidation weight loss.
[0045] The test piece was placed inside an electric furnace, and the temperature was held at 800° C. for 100 hours under normal atmospheric conditions. Subsequently, the test piece was boiled in an aqueous solution containing 18% NaOH and 3% KMnO4, and then boiled in a 10% ammonium citrate solution, thereby removing any oxides from the surface of the test piece. The mass of the test piece was measured prior to heating and was then re-measured following removal of the oxides, and the oxidation weight loss was calculated using formula (1).
Wd=(W0-Ws)/A0 (1)
wherein Wd represents the oxidation weight loss (mg/cm2), Ws represents the mass (mg) following testing, W0 represents the mass (mg) prior to testing, and A0 represents the surface area (cm2) of the test piece prior to testing.
[0046] FIG. 1 illustrates the 0.2% yield strength ratio for each test piece, referenced against the ductile iron test piece of sample number 1. In this figure, the vertical axis represents the 0.2% yield strength ratio. FIG. 2 illustrates the oxidation weight loss ratio for each test piece, referenced against the ductile iron test piece of sample number 1. In this figure, the vertical axis represents the oxidation weight loss ratio. FIG. 3 illustrates the relationship between the Mo content and the elongation ratio after fracture of the test piece (referenced against the test piece of sample number 1). In this figure, the horizontal axis represents the Mo content, and the vertical axis represents the elongation ratio after fracture. FIG. 4 illustrates the relationship between the Cr content and the elongation after fracture of the test piece (referenced against the test piece of sample number 1). In this figure, the horizontal axis represents the Cr content, and the vertical axis represents the elongation ratio after fracture.
[0047] In the test pieces of sample numbers 1 to 6, which had varying Mo content values, it is evident from FIG. 1 that the 0.2% yield strength increased as the Mo content was increased. Further, as illustrated in FIG. 2, the oxidation weight loss was substantially uniform, and was unaffected by the Mo content.
[0048] However, as illustrated in FIG. 3, the elongation after fracture (ductibility) deteriorated as the Mo content was increased.
[0049] In other words, by employing a Mo content within a range from 0.2 to 2.0 mass %, a ductile iron having a combination of superior high-temperature strength and superior ductibility was able to be obtained.
[0050] In the test pieces of sample numbers 1 and 7 to 11, which had varying Cr content values, it is evident from FIG. 2 that incorporating Cr reduced the oxidation weight loss, and that increasing the Cr content enabled the oxidation weight loss to be further reduced (namely, an improvement in the oxidation resistance). However, as illustrated in FIG. 4, the elongation after fracture (ductibility) deteriorated as the Cr content was increased.
[0051] Accordingly, by employing a Cr content within a range from 0.1 to 1 mass %, a ductile iron having a combination of superior oxidation resistance and superior ductibility was able to be obtained.
[0052] In the test piece of sample number 12, which had a very low C content, carbides formed and spheroidization of the carbon was inhibited, resulting in a dramatic fall in the 0.2% yield strength. The test piece of sample number 13, which had a low Si content, exhibited inferior oxidation resistance.
Example 2
[0053] Table 2 shows the element composition of ductile iron test pieces of sample numbers 1 and 14 to 18.
TABLE-US-00002 TABLE 2 Sam- ple Num- Composition (mass %) ber C Si Mn Mo V W Cr Mg 1 2.98 4.68 0.42 0.41 0.29 -- 0.32 0.043 14 2.99 4.62 0.40 0.40 0.29 0.18 0.30 0.039 15 3.01 4.68 0.40 0.41 0.29 0.31 0.33 0.043 16 3.03 4.60 0.41 0.40 0.30 0.95 0.32 0.045 17 2.98 4.64 0.42 0.39 0.29 0.07 0.30 0.043 18 3.01 4.68 0.40 0.41 0.29 1.21 0.31 0.044
[0054] Using the same method as example 1, test pieces were prepared using sample numbers 14 to 18 and subsequently subjected to ferritization. Measurement of the spheroidization rate using the method described in JIS G 5502 revealed a spheroidization rate of at least 90% for each of the test pieces.
[0055] Each of the test pieces from sample numbers 14 to 18 was measured for 0.2% yield strength and oxidation weight loss at 800° C. FIG. 5 illustrates the 0.2% yield strength ratio for each test piece, referenced against the ductile iron test piece of sample number 1. In this figure, the vertical axis represents the 0.2% yield strength ratio. FIG. 6 illustrates the oxidation weight loss ratio for each test piece, referenced against the ductile iron test piece of sample number 1. In this figure, the vertical axis represents the oxidation weight loss ratio. FIG. 7 illustrates the relationship between the W content and the elongation ratio after fracture of the test piece (referenced against the test piece of sample number 1). In this figure, the horizontal axis represents the W content, and the vertical axis represents the elongation ratio after fracture.
[0056] From the results for sample numbers 1, 14, 15 and 17 it was confirmed that as the W content was increased, the W underwent solid dissolution within the ferrite matrix, thereby strengthening the matrix and improving the 0.2% yield strength. However, the results from sample materials 16 and 18 revealed that addition of a very large amount of W did not result in a dramatic improvement in the high-temperature strength. As illustrated in FIG. 6, the oxidation weight loss was independent of the W content, with all of the test pieces exhibiting a high level of oxidation resistance. Further, as illustrated in FIG. 7, the elongation after fracture (ductibility) deteriorated as the W content was increased.
[0057] Based on the above results it is clear that by employing a W content within a range from 0.1 to 1 mass %, the high-temperature strength was able to be further improved.
Example 3
[0058] Table 3 shows the element composition of ductile iron test pieces of sample numbers 1 and 19 to 22.
TABLE-US-00003 TABLE 3 Sam- ple Num- Composition (mass %) ber C Si Mn Mo V Nb Cr Mg 1 2.98 4.68 0.42 0.41 0.29 -- 0.32 0.043 19 3.03 4.58 0.41 0.41 0.31 0.04 0.32 0.041 20 3.00 4.63 0.40 0.41 0.29 0.09 0.31 0.040 21 3.03 4.61 0.40 0.39 0.30 0.27 0.32 0.045 22 3.04 4.60 0.43 0.39 0.30 0.35 0.31 0.041
[0059] Using the same method as example 1, test pieces were prepared with the element compositions detailed for sample numbers 19 to 22. Following a homogenized heat treatment for one hour at 1,200° C., a heat treatment was performed at 915° C. for 3 hours to effect ferritization. Measurement of the spheroidization rate using the method described in JIS G 5502 confirmed a spheroidization rate of at least 90% for each of the test pieces. Subsequently, each of the test pieces was measured for 0.2% yield strength and oxidation weight loss at 800° C.
[0060] FIG. 8 illustrates the 0.2% yield strength ratio for each test piece, referenced against the ductile iron test piece of sample number 1. In this figure, the vertical axis represents the 0.2% yield strength ratio. FIG. 9 illustrates the oxidation weight loss ratio for each test piece, referenced against the ductile iron test piece of sample number 1. In this figure, the vertical axis represents the oxidation weight loss ratio.
[0061] From the results for sample numbers 19 and 20 it was confirmed that since Nb is an element that is precipitated as fine carbides within the matrix, the matrix is strengthened and the 0.2% yield strength is improved as the Nb content was increased. However, the results from sample materials 21 and 22 revealed that an additional increase in the amount of Nb actually tended to cause a reduction in the 0.2% yield strength. In particular, sample number 22 exhibited a lower 0.2% yield strength than that of sample number 1 which contained no Nb. Moreover, as illustrated in FIG. 9, the oxidation weight loss was independent of the Nb content and remained substantially constant.
[0062] In other words, by employing a Nb content within a range from 0.02 to 0.3 mass %, the high-temperature strength was able to be further improved.
Example 4
[0063] Table 4 shows the element composition of ductile iron test pieces of sample numbers 1 and 23 to 26.
TABLE-US-00004 TABLE 4 Sam- ple Num- Composition (mass %) ber C Si Mn Mo V W Nb Cr Mg 1 2.98 4.68 0.42 0.41 0.29 -- -- 0.32 0.043 23 3.02 4.64 0.40 0.42 0.30 0.30 0.04 0.34 0.043 24 3.01 4.67 0.39 0.41 0.29 0.32 0.08 0.35 0.041 25 2.98 4.68 0.41 0.40 0.29 0.31 0.26 0.33 0.044 26 3.01 4.68 0.41 0.41 0.31 0.31 0.35 0.34 0.040
[0064] Using the same method as example 1, test pieces were prepared with the element compositions detailed for sample numbers 23 to 26. Subsequently, a homogenized heat treatment was performed in the same manner as example 3, followed by ferritization. Measurement of the spheroidization rate using the method described in JIS G 5502 confirmed a spheroidization rate of at least 90% for each of the test pieces. Subsequently, each of the test pieces was measured for 0.2% yield strength and oxidation weight loss at 800° C.
[0065] FIG. 10 illustrates the 0.2% yield strength ratio for each test piece, referenced against the ductile iron test piece of sample number 1. In this figure, the vertical axis represents the 0.2% yield strength ratio. FIG. 11 illustrates the oxidation weight loss ratio for each test piece, referenced against the ductile iron test piece of sample number 1. In this figure, the vertical axis represents the oxidation weight loss ratio.
[0066] The results for sample numbers 1, 23 and 24 illustrate that increasing the Nb content improved the 0.2% yield strength. In particular, sample number 24 exhibited a higher 0.2% yield strength than samples containing only one of Nb and W. In the test pieces of sample numbers 25 and 26, which had an even higher Nb content, the 0.2% yield strength actually decreased. The test piece of sample number 26 exhibited a lower 0.2% yield strength than the test piece of sample number 1 which contained no added Nb or W. Moreover, as illustrated in FIG. 11, the oxidation weight loss was independent of the Nb content and remained substantially constant.
[0067] In other words, by including both W and Nb, the high-temperature strength was able to be further improved.
Example 5
[0068] The Mg content was reduced for the element compositions of sample numbers 1, 15, 20 and 24, and test pieces were prepared from the resulting sample numbers 31 to 34. The element composition of each of the test pieces is shown in Table 5.
TABLE-US-00005 TABLE 5 Sample Composition (mass %) Spheroidization Number C Si Mn Mo V W Nb Cr Mg rate (%) 1 2.98 4.68 0.42 0.41 0.29 -- -- 0.32 0.043 >90 15 3.01 4.68 0.40 0.41 0.29 0.31 -- 0.33 0.043 >90 20 3.00 4.63 0.40 0.41 0.29 -- 0.09 0.31 0.040 >90 24 3.01 4.67 0.39 0.41 0.29 0.32 0.08 0.35 0.041 >90 31 3.03 4.60 0.40 0.39 0.30 -- -- 0.29 0.020 51 32 2.98 4.64 0.40 0.39 0.31 0.29 -- 0.30 0.023 45 33 3.02 4.69 0.40 0.39 0.31 -- 0.09 0.31 0.023 43 34 2.95 4.61 0.39 0.41 0.30 0.30 0.08 0.31 0.021 40
[0069] Using the same method as example 3, test pieces were prepared with each of the element compositions detailed in Table 5, and a homogenized heat treatment was then performed, followed by ferritization. The spheroidization rate of each test piece was measured using the method described in JIS G 5502. The tensile strength of each test piece at 800° C. was also measured.
[0070] FIG. 12 illustrates the tensile strength ratio for each test piece, referenced against the test piece of sample number 1. In this figure, the vertical axis represents the tensile strength ratio. As the Mg content was reduced, the spheroidization rate decreased. Accompanying this decrease, the tensile strength at 800° C. also decreased.
[0071] In this manner, by ensuring that the spheroidization rate was at least 90%, the high-temperature strength was able to be increased.
User Contributions:
Comment about this patent or add new information about this topic:
Images included with this patent application:
 |  |
 |  |
 |  |
| New patent applications in this class: | |
| Date | Title |
|---|---|
| 2016-06-09 | Spheroidal graphite cast iron |
| 2016-04-21 | Gray cast iron for cylinder liner and method for manufacturing cylinder liner using the same |
| 2015-12-31 | Cast iron and brake component |
| 2014-12-25 | Cast iron material and motor vehicle part made of the cast iron material |
| 2014-06-12 | Compacted graphite iron, engine cylinder head and vehicle |
| Top Inventors for class "Alloys or metallic compositions" | |
| Rank | Inventor's name |
|---|---|
| 1 | David R. Whitcomb |
| 2 | Yasuhiro Aruga |
| 3 | Doreen C. Lynch |
| 4 | Keiichiro Oishi |
| 5 | Awadh B. Pandey |