Patent application title: METHODS AND COMPOSITIONS FOR DIAGNOSIS AND PROGNOSIS OF RENAL INJURY AND RENAL FAILURE
Inventors:
Joseph Anderberg (Encinitas, CA, US)
Joseph Anderberg (Encinitas, CA, US)
Jeff Gray (Solana Beach, CA, US)
Jeff Gray (Solana Beach, CA, US)
Paul Mcpherson (Encinitas, CA, US)
Paul Mcpherson (Encinitas, CA, US)
Kevin Nakamura (Cardiff By The Sea, CA, US)
Kevin Nakamura (Cardiff By The Sea, CA, US)
James Patrick Kampf (San Diego, CA, US)
James Patrick Kampf (San Diego, CA, US)
Assignees:
ASTUTE MEDICAL, INC.
IPC8 Class: AG01N3368FI
USPC Class:
435 794
Class name: Assay in which an enzyme present is a label heterogeneous or solid phase assay system (e.g., elisa, etc.) sandwich assay
Publication date: 2013-09-05
Patent application number: 20130230871
Abstract:
The present invention relates to methods and compositions for monitoring,
diagnosis, prognosis, and determination of treatment regimens in subjects
suffering from or suspected of having a renal injury. In particular, the
invention relates to using a one or more assays configured to detect a
kidney injury marker selected from the group consisting of Interleukin-5,
Interleukin-6 receptor subunit beta, Tissue factor, Sex hormone-binding
globulin, Alpha-2-macroglobulin, Apolipoprotein A-I, Calcitonin,
Thrombopoietin, C-reactive protein, Intercellular adhesion molecule 3,
Macrophage metalloelastase, Apolipoprotein B-100, and Fibrinogen as
diagnostic and prognostic biomarkers in renal injuries.Claims:
1. A method for evaluating biomarker levels in a body fluid sample from a
subject, comprising: obtaining a urine sample from a subject selected for
evaluation based on a determination that the subject is at risk of a
future or current acute renal injury; performing one or more assays
configured to detect one or more biomarkers selected from the group
consisting of Interleukin-5, Interleukin-6 receptor subunit beta, Tissue
factor, Sex hormone-binding globulin, Alpha-2-macroglobulin,
Apolipoprotein A-I, Calcitonin, Thrombopoietin, C-reactive protein,
Intercellular adhesion molecule 3, Macrophage metalloelastase,
Apolipoprotein B-100, and Fibrinogen by introducing the urine sample
obtained from the subject into an assay instrument which (i) for each
analyte binding assay performed, contacts all or a portion of the urine
sample with a binding reagent which specifically binds for detection the
kidney injury marker which is assayed, and (ii) generates one or more
assay results indicative of binding of each biomarker which is assayed to
its respective binding reagent and displays the assay results generated
in human readable form; and correlating the assay result(s) generated by
the assay instrument to the renal status of the subject.
2. A method according to claim 1, wherein said correlation step the subject is selected for evaluation based on a determination that the subject is in need of risk stratification, diagnosis, staging, prognosis, classifying and monitoring of the renal status of the subject.
3. A method according to claim 1, wherein the subject is selected for evaluation based on a determination that the subject is at risk of a future acute renal injury.
4. A method according to claim 3, wherein the subject is selected for evaluation based on a determination that the subject is at risk of a future injury to renal function, future reduced renal function, future improvement in renal function, and future acute renal failure (ARF).
5. A method according to claim 1, wherein said assay results comprise at least 2, 3, 4, or 5 of: a measured concentration of Interleukin-5, a measured concentration of Interleukin-6 receptor subunit beta, a measured concentration of Tissue factor, a measured concentration of Sex hormone-binding globulin, a measured concentration of Alpha-2-macroglobulin, a measured concentration of Apolipoprotein A-I, a measured concentration of Calcitonin, a measured concentration of Thrombopoietin, a measured concentration of C-reactive protein, a measured concentration of Intercellular adhesion molecule 3, a measured concentration of Macrophage metalloelastase, a measured concentration of Apolipoprotein B-100, a measured concentration of and Fibrinogen.
6. A method according to claim 5, wherein a plurality of assay results are combined using a function that converts the plurality of assay results into a single composite result.
7. (canceled)
8. A method according to claim 3, wherein the subject is selected for evaluation based on a determination that the subject is at risk of a future acute renal injury within 30 days of the time at which the urine sample is obtained from the subject.
9. A method according to claim 8, wherein the subject is selected for evaluation based on a determination that the subject is at risk of a future acute renal injury within a period selected from the group consisting of 21 days, 14 days, 7 days, 5 days, 96 hours, 72 hours, 48 hours, 36 hours, 24 hours, and 12 hours.
10. A method according to claim 1, wherein the subject is selected for evaluation of renal status based on the pre-existence in the subject of one or more known risk factors for prerenal, intrinsic renal, or postrenal ARF.
11. A method according to claim 1, wherein the subject is selected for evaluation of renal status based on an existing diagnosis of one or more of congestive heart failure, preeclampsia, eclampsia, diabetes mellitus, hypertension, coronary artery disease, proteinuria, renal insufficiency, glomerular filtration below the normal range, cirrhosis, serum creatinine above the normal range, sepsis, injury to renal function, reduced renal function, or ARF, or based on undergoing or having undergone major vascular surgery, coronary artery bypass, or other cardiac surgery, or based on exposure to NSAIDs, cyclosporines, tacrolimus, aminoglycosides, foscarnet, ethylene glycol, hemoglobin, myoglobin, ifosfamide, heavy metals, methotrexate, radiopaque contrast agents, or streptozotocin.
12. A method according to claim 1, wherein each assay is an immunoassay performed by (i) introducing the urine sample into an assay device comprising at least one of which binds to a biomarker which is assayed, and (ii) generating an assay result indicative of binding of each biomarker to its respective antibody
13. A method according to claim 1, wherein said correlating step comprises assessing whether or not renal function is improving or worsening in a subject who has suffered from an injury to renal function, reduced renal function, or ARF based on the assay result(s).
14-23. (canceled)
24. A method according to claim 1, wherein said one or more future changes in renal status comprise one or more of a future injury to renal function, future reduced renal function, future improvement in renal function, and future acute renal failure (ARF) within 72 hours of the time at which the body fluid sample is obtained.
25. A method according to claim 24, wherein said correlating step comprises correlating the assay results to a likelihood of one or more of a future injury to renal function, future reduced renal function, future improvement in renal function, and future acute renal failure (ARF) within 48 hours of the time at which the body fluid sample is obtained.
26. A method according to claim 24, wherein said correlating step comprises correlating the assay results to a likelihood of one or more of a future injury to renal function, future reduced renal function, future improvement in renal function, and future acute renal failure (ARF) within 24 hours of the time at which the body fluid sample is obtained.
27. A method according to claim 1, wherein the subject is in RIFLE stage 0 or R.
28. A method according to claim 27, wherein the subject is in RIFLE stage 0.
29-32. (canceled)
33. A method according to claim 27, wherein the subject is in RIFLE stage R.
34. (canceled)
35. A method according to claim 1, wherein the subject is in RIFLE stage 0, R, or I.
36. A method according to claim 35, wherein the subject is in RIFLE stage I.
37-54. (canceled)
55. A method according to claim 1, wherein the subject is not in acute renal failure.
56-99. (canceled)
100. A method according to claim 1, wherein said method comprises performing assays that detect one, two or three, or more of Interleukin-5, Interleukin-6 receptor subunit beta, Tissue factor, Sex hormone-binding globulin, Alpha-2-macroglobulin, Apolipoprotein A-I, Calcitonin, Thrombopoietin, C-reactive protein, Intercellular adhesion molecule 3, Macrophage metalloelastase, Apolipoprotein B-100, and Fibrinogen.
101-108. (canceled)
Description:
[0001] The present application claims priority to U.S. Provisional Patent
Application No. 61/301,961 filed Feb. 5, 2010; U.S. Provisional Patent
Application No. 61/301,970 filed Feb. 5, 2010; U.S. Provisional Patent
Application No. 61/301,981 filed Feb. 5, 2010; U.S. Provisional Patent
Application No. 61/301,985 filed Feb. 5, 2010; U.S. Provisional Patent
Application No. 61/301,992 filed Feb. 5, 2010; U.S. Provisional Patent
Application No. 61/302,009 filed Feb. 5, 2010; U.S. Provisional Patent
Application No. 61/302,012 filed Feb. 5, 2010; U.S. Provisional Patent
Application No. 61/302,016 filed Feb. 5, 2010; U.S. Provisional Patent
Application No. 61/302,032 filed Feb. 5, 2010; U.S. Provisional Patent
Application No. 61/302,039 filed Feb. 5, 2010; U.S. Provisional Patent
Application No. 61/302,045 filed Feb. 5, 2010; U.S. Provisional Patent
Application No. 61/302,047 filed Feb. 5, 2010; U.S. Provisional Patent
Application No. 61/302,048 filed Feb. 5, 2010; each of which is hereby
incorporated in its entirety including all tables, figures, and claims.
BACKGROUND OF THE INVENTION
[0002] The following discussion of the background of the invention is merely provided to aid the reader in understanding the invention and is not admitted to describe or constitute prior art to the present invention.
[0003] The kidney is responsible for water and solute excretion from the body. Its functions include maintenance of acid-base balance, regulation of electrolyte concentrations, control of blood volume, and regulation of blood pressure. As such, loss of kidney function through injury and/or disease results in substantial morbidity and mortality. A detailed discussion of renal injuries is provided in Harrison's Principles of Internal Medicine, 17th Ed., McGraw Hill, New York, pages 1741-1830, which are hereby incorporated by reference in their entirety. Renal disease and/or injury may be acute or chronic. Acute and chronic kidney disease are described as follows (from Current Medical Diagnosis & Treatment 2008, 47th Ed, McGraw Hill, New York, pages 785-815, which are hereby incorporated by reference in their entirety): "Acute renal failure is worsening of renal function over hours to days, resulting in the retention of nitrogenous wastes (such as urea nitrogen) and creatinine in the blood. Retention of these substances is called azotemia. Chronic renal failure (chronic kidney disease) results from an abnormal loss of renal function over months to years".
[0004] Acute renal failure (ARF, also known as acute kidney injury, or AKI) is an abrupt (typically detected within about 48 hours to 1 week) reduction in glomerular filtration. This loss of filtration capacity results in retention of nitrogenous (urea and creatinine) and non-nitrogenous waste products that are normally excreted by the kidney, a reduction in urine output, or both. It is reported that ARF complicates about 5% of hospital admissions, 4-15% of cardiopulmonary bypass surgeries, and up to 30% of intensive care admissions. ARF may be categorized as prerenal, intrinsic renal, or postrenal in causation. Intrinsic renal disease can be further divided into glomerular, tubular, interstitial, and vascular abnormalities. Major causes of ARF are described in the following table, which is adapted from the Merck Manual, 17th ed., Chapter 222, and which is hereby incorporated by reference in their entirety:
TABLE-US-00001 Type Risk Factors Prerenal ECF volume depletion Excessive diuresis, hemorrhage, GI losses, loss of intravascular fluid into the extravascular space (due to ascites, peritonitis, pancreatitis, or burns), loss of skin and mucus membranes, renal salt- and water-wasting states Low cardiac output Cardiomyopathy, MI, cardiac tamponade, pulmonary embolism, pulmonary hypertension, positive-pressure mechanical ventilation Low systemic vascular Septic shock, liver failure, antihypertensive drugs resistance Increased renal vascular NSAIDs, cyclosporines, tacrolimus, hypercalcemia, resistance anaphylaxis, anesthetics, renal artery obstruction, renal vein thrombosis, sepsis, hepatorenal syndrome Decreased efferent ACE inhibitors or angiotensin II receptor blockers arteriolar tone (leading to decreased GFR from reduced glomerular transcapillary pressure, especially in patients with bilateral renal artery stenosis) Intrinsic Renal Acute tubular injury Ischemia (prolonged or severe prerenal state): surgery, hemorrhage, arterial or venous obstruction; Toxins: NSAIDs, cyclosporines, tacrolimus, aminoglycosides, foscarnet, ethylene glycol, hemoglobin, myoglobin, ifosfamide, heavy metals, methotrexate, radiopaque contrast agents, streptozotocin Acute glomerulonephritis ANCA-associated: Crescentic glomerulonephritis, polyarteritis nodosa, Wegener's granulomatosis; Anti- GBM glomerulonephritis: Goodpasture's syndrome; Immune-complex: Lupus glomerulonephritis, postinfectious glomerulonephritis, cryoglobulinemic glomerulonephritis Acute tubulointerstitial Drug reaction (eg, β-lactams, NSAIDs, sulfonamides, nephritis ciprofloxacin, thiazide diuretics, furosemide, phenytoin, allopurinol, pyelonephritis, papillary necrosis Acute vascular Vasculitis, malignant hypertension, thrombotic nephropathy microangiopathies, scleroderma, atheroembolism Infiltrative diseases Lymphoma, sarcoidosis, leukemia Postrenal Tubular precipitation Uric acid (tumor lysis), sulfonamides, triamterene, acyclovir, indinavir, methotrexate, ethylene glycol ingestion, myeloma protein, myoglobin Ureteral obstruction Intrinsic: Calculi, clots, sloughed renal tissue, fungus ball, edema, malignancy, congenital defects; Extrinsic: Malignancy, retroperitoneal fibrosis, ureteral trauma during surgery or high impact injury Bladder obstruction Mechanical: Benign prostatic hyperplasia, prostate cancer, bladder cancer, urethral strictures, phimosis, paraphimosis, urethral valves, obstructed indwelling urinary catheter; Neurogenic: Anticholinergic drugs, upper or lower motor neuron lesion
[0005] In the case of ischemic ARF, the course of the disease may be divided into four phases. During an initiation phase, which lasts hours to days, reduced perfusion of the kidney is evolving into injury. Glomerular ultrafiltration reduces, the flow of filtrate is reduced due to debris within the tubules, and back leakage of filtrate through injured epithelium occurs. Renal injury can be mediated during this phase by reperfusion of the kidney. Initiation is followed by an extension phase which is characterized by continued ischemic injury and inflammation and may involve endothelial damage and vascular congestion. During the maintenance phase, lasting from 1 to 2 weeks, renal cell injury occurs, and glomerular filtration and urine output reaches a minimum. A recovery phase can follow in which the renal epithelium is repaired and GFR gradually recovers. Despite this, the survival rate of subjects with ARF may be as low as about 60%.
[0006] Acute kidney injury caused by radiocontrast agents (also called contrast media) and other nephrotoxins such as cyclosporine, antibiotics including aminoglycosides and anticancer drugs such as cisplatin manifests over a period of days to about a week. Contrast induced nephropathy (CIN, which is AKI caused by radiocontrast agents) is thought to be caused by intrarenal vasoconstriction (leading to ischemic injury) and from the generation of reactive oxygen species that are directly toxic to renal tubular epithelial cells. CIN classically presents as an acute (onset within 24-48 h) but reversible (peak 3-5 days, resolution within 1 week) rise in blood urea nitrogen and serum creatinine.
[0007] A commonly reported criteria for defining and detecting AKI is an abrupt (typically within about 2-7 days or within a period of hospitalization) elevation of serum creatinine. Although the use of serum creatinine elevation to define and detect AKI is well established, the magnitude of the serum creatinine elevation and the time over which it is measured to define AKI varies considerably among publications. Traditionally, relatively large increases in serum creatinine such as 100%, 200%, an increase of at least 100% to a value over 2 mg/dL and other definitions were used to define AKI. However, the recent trend has been towards using smaller serum creatinine rises to define AKI. The relationship between serum creatinine rise, AKI and the associated health risks are reviewed in Praught and Shlipak, Curr Opin Nephrol Hypertens 14:265-270, 2005 and Chertow et al, J Am Soc Nephrol 16: 3365-3370, 2005, which, with the references listed therein, are hereby incorporated by reference in their entirety. As described in these publications, acute worsening renal function (AKI) and increased risk of death and other detrimental outcomes are now known to be associated with very small increases in serum creatinine. These increases may be determined as a relative (percent) value or a nominal value. Relative increases in serum creatinine as small as 20% from the pre-injury value have been reported to indicate acutely worsening renal function (AKI) and increased health risk, but the more commonly reported value to define AKI and increased health risk is a relative increase of at least 25%. Nominal increases as small as 0.3 mg/dL, 0.2 mg/dL or even 0.1 mg/dL have been reported to indicate worsening renal function and increased risk of death. Various time periods for the serum creatinine to rise to these threshold values have been used to define AKI, for example, ranging from 2 days, 3 days, 7 days, or a variable period defined as the time the patient is in the hospital or intensive care unit. These studies indicate there is not a particular threshold serum creatinine rise (or time period for the rise) for worsening renal function or AKI, but rather a continuous increase in risk with increasing magnitude of serum creatinine rise.
[0008] One study (Lassnigg et all, J Am Soc Nephrol 15:1597-1605, 2004, hereby incorporated by reference in its entirety) investigated both increases and decreases in serum creatinine. Patients with a mild fall in serum creatinine of -0.1 to -0.3 mg/dL following heart surgery had the lowest mortality rate. Patients with a larger fall in serum creatinine (more than or equal to -0.4 mg/dL) or any increase in serum creatinine had a larger mortality rate. These findings caused the authors to conclude that even very subtle changes in renal function (as detected by small creatinine changes within 48 hours of surgery) seriously effect patient's outcomes. In an effort to reach consensus on a unified classification system for using serum creatinine to define AKI in clinical trials and in clinical practice, Bellomo et al., Crit Care. 8(4):R204-12, 2004, which is hereby incorporated by reference in its entirety, proposes the following classifications for stratifying AKI patients:
"Risk": serum creatinine increased 1.5 fold from baseline OR urine production of <0.5 ml/kg body weight/hr for 6 hours; "Injury": serum creatinine increased 2.0 fold from baseline OR urine production <0.5 ml/kg/hr for 12 h; "Failure": serum creatinine increased 3.0 fold from baseline OR creatinine >355 μmol/l (with a rise of >44) or urine output below 0.3 ml/kg/hr for 24 h or anuria for at least 12 hours; And included two clinical outcomes: "Loss": persistent need for renal replacement therapy for more than four weeks. "ESRD": end stage renal disease--the need for dialysis for more than 3 months.
[0009] These criteria are called the RIFLE criteria, which provide a useful clinical tool to classify renal status. As discussed in Kellum, Crit. Care Med. 36: S141-45, 2008 and Ricci et al., Kidney Int. 73, 538-546, 2008, each hereby incorporated by reference in its entirety, the RIFLE criteria provide a uniform definition of AKI which has been validated in numerous studies.
[0010] More recently, Mehta et al., Crit. Care 11:R31 (doi:10.1186.cc5713), 2007, hereby incorporated by reference in its entirety, proposes the following similar classifications for stratifying AKI patients, which have been modified from RIFLE:
"Stage I": increase in serum creatinine of more than or equal to 0.3 mg/dL (≧26.4 μmol/L) or increase to more than or equal to 150% (1.5-fold) from baseline OR urine output less than 0.5 mL/kg per hour for more than 6 hours; "Stage II": increase in serum creatinine to more than 200% (>2-fold) from baseline OR urine output less than 0.5 mL/kg per hour for more than 12 hours; "Stage III": increase in serum creatinine to more than 300% (>3-fold) from baseline OR serum creatinine ≧354 μmol/L accompanied by an acute increase of at least 44 μmol/L OR urine output less than 0.3 mL/kg per hour for 24 hours or anuria for 12 hours.
[0011] The CIN Consensus Working Panel (McCollough et al, Rev Cardiovasc Med. 2006; 7(4):177-197, hereby incorporated by reference in its entirety) uses a serum creatinine rise of 25% to define Contrast induced nephropathy (which is a type of AKI). Although various groups propose slightly different criteria for using serum creatinine to detect AKI, the consensus is that small changes in serum creatinine, such as 0.3 mg/dL or 25%, are sufficient to detect AKI (worsening renal function) and that the magnitude of the serum creatinine change is an indicator of the severity of the AKI and mortality risk.
[0012] Although serial measurement of serum creatinine over a period of days is an accepted method of detecting and diagnosing AKI and is considered one of the most important tools to evaluate AKI patients, serum creatinine is generally regarded to have several limitations in the diagnosis, assessment and monitoring of AKI patients. The time period for serum creatinine to rise to values (e.g., a 0.3 mg/dL or 25% rise) considered diagnostic for AKI can be 48 hours or longer depending on the definition used. Since cellular injury in AKI can occur over a period of hours, serum creatinine elevations detected at 48 hours or longer can be a late indicator of injury, and relying on serum creatinine can thus delay diagnosis of AKI. Furthermore, serum creatinine is not a good indicator of the exact kidney status and treatment needs during the most acute phases of AKI when kidney function is changing rapidly. Some patients with AKI will recover fully, some will need dialysis (either short term or long term) and some will have other detrimental outcomes including death, major adverse cardiac events and chronic kidney disease. Because serum creatinine is a marker of filtration rate, it does not differentiate between the causes of AKI (pre-renal, intrinsic renal, post-renal obstruction, atheroembolic, etc) or the category or location of injury in intrinsic renal disease (for example, tubular, glomerular or interstitial in origin). Urine output is similarly limited, Knowing these things can be of vital importance in managing and treating patients with AKI.
[0013] These limitations underscore the need for better methods to detect and assess AKI, particularly in the early and subclinical stages, but also in later stages when recovery and repair of the kidney can occur. Furthermore, there is a need to better identify patients who are at risk of having an AKI.
BRIEF SUMMARY OF THE INVENTION
[0014] It is an object of the invention to provide methods and compositions for evaluating renal function in a subject. As described herein, measurement of one or more biomarkers selected from the group consisting of Interleukin-5, Interleukin-6 receptor subunit beta, Tissue factor, Sex hormone-binding globulin, Alpha-2-macroglobulin, Apolipoprotein A-I, Calcitonin, Thrombopoietin, C-reactive protein, Intercellular adhesion molecule 3, Macrophage metalloelastase, Apolipoprotein B-100, and Fibrinogen (each referred to herein as a "kidney injury marker") can be used for diagnosis, prognosis, risk stratification, staging, monitoring, categorizing and determination of further diagnosis and treatment regimens in subjects suffering or at risk of suffering from an injury to renal function, reduced renal function, and/or acute renal failure (also called acute kidney injury).
[0015] The kidney injury markers of the present invention may be used, individually or in panels comprising a plurality of kidney injury markers, for risk stratification (that is, to identify subjects at risk for a future injury to renal function, for future progression to reduced renal function, for future progression to ARF, for future improvement in renal function, etc.); for diagnosis of existing disease (that is, to identify subjects who have suffered an injury to renal function, who have progressed to reduced renal function, who have progressed to ARF, etc.); for monitoring for deterioration or improvement of renal function; and for predicting a future medical outcome, such as improved or worsening renal function, a decreased or increased mortality risk, a decreased or increased risk that a subject will require renal replacement therapy (i.e., hemodialysis, peritoneal dialysis, hemofiltration, and/or renal transplantation, a decreased or increased risk that a subject will recover from an injury to renal function, a decreased or increased risk that a subject will recover from ARF, a decreased or increased risk that a subject will progress to end stage renal disease, a decreased or increased risk that a subject will progress to chronic renal failure, a decreased or increased risk that a subject will suffer rejection of a transplanted kidney, etc.
[0016] In a first aspect, the present invention relates to methods for evaluating renal status in a subject. These methods comprise performing an assay method that is configured to detect one or more biomarkers selected from the group consisting of Interleukin-5, Interleukin-6 receptor subunit beta, Tissue factor, Sex hormone-binding globulin, Alpha-2-macroglobulin, Apolipoprotein A-I, Calcitonin, Thrombopoietin, C-reactive protein, Intercellular adhesion molecule 3, Macrophage metalloelastase, Apolipoprotein B-100, and Fibrinogen is/are then correlated to the renal status of the subject. This correlation to renal status may include correlating the assay result(s) to one or more of risk stratification, diagnosis, prognosis, staging, classifying and monitoring of the subject as described herein. Thus, the present invention utilizes one or more kidney injury markers of the present invention for the evaluation of renal injury.
[0017] In certain embodiments, the methods for evaluating renal status described herein are methods for risk stratification of the subject; that is, assigning a likelihood of one or more future changes in renal status to the subject. In these embodiments, the assay result(s) is/are correlated to one or more such future changes. The following are preferred risk stratification embodiments.
[0018] In preferred risk stratification embodiments, these methods comprise determining a subject's risk for a future injury to renal function, and the assay result(s) is/are correlated to a likelihood of such a future injury to renal function. For example, the measured concentration(s) may each be compared to a threshold value. For a "positive going" kidney injury marker, an increased likelihood of suffering a future injury to renal function is assigned to the subject when the measured concentration is above the threshold, relative to a likelihood assigned when the measured concentration is below the threshold. For a "negative going" kidney injury marker, an increased likelihood of suffering a future injury to renal function is assigned to the subject when the measured concentration is below the threshold, relative to a likelihood assigned when the measured concentration is above the threshold.
[0019] In other preferred risk stratification embodiments, these methods comprise determining a subject's risk for future reduced renal function, and the assay result(s) is/are correlated to a likelihood of such reduced renal function. For example, the measured concentrations may each be compared to a threshold value. For a "positive going" kidney injury marker, an increased likelihood of suffering a future reduced renal function is assigned to the subject when the measured concentration is above the threshold, relative to a likelihood assigned when the measured concentration is below the threshold. For a "negative going" kidney injury marker, an increased likelihood of future reduced renal function is assigned to the subject when the measured concentration is below the threshold, relative to a likelihood assigned when the measured concentration is above the threshold.
[0020] In still other preferred risk stratification embodiments, these methods comprise determining a subject's likelihood for a future improvement in renal function, and the assay result(s) is/are correlated to a likelihood of such a future improvement in renal function. For example, the measured concentration(s) may each be compared to a threshold value. For a "positive going" kidney injury marker, an increased likelihood of a future improvement in renal function is assigned to the subject when the measured concentration is below the threshold, relative to a likelihood assigned when the measured concentration is above the threshold. For a "negative going" kidney injury marker, an increased likelihood of a future improvement in renal function is assigned to the subject when the measured concentration is above the threshold, relative to a likelihood assigned when the measured concentration is below the threshold.
[0021] In yet other preferred risk stratification embodiments, these methods comprise determining a subject's risk for progression to ARF, and the result(s) is/are correlated to a likelihood of such progression to ARF. For example, the measured concentration(s) may each be compared to a threshold value. For a "positive going" kidney injury marker, an increased likelihood of progression to ARF is assigned to the subject when the measured concentration is above the threshold, relative to a likelihood assigned when the measured concentration is below the threshold. For a "negative going" kidney injury marker, an increased likelihood of progression to ARF is assigned to the subject when the measured concentration is below the threshold, relative to a likelihood assigned when the measured concentration is above the threshold.
[0022] And in other preferred risk stratification embodiments, these methods comprise determining a subject's outcome risk, and the assay result(s) is/are correlated to a likelihood of the occurrence of a clinical outcome related to a renal injury suffered by the subject. For example, the measured concentration(s) may each be compared to a threshold value. For a "positive going" kidney injury marker, an increased likelihood of one or more of: acute kidney injury, progression to a worsening stage of AKI, mortality, a requirement for renal replacement therapy, a requirement for withdrawal of renal toxins, end stage renal disease, heart failure, stroke, myocardial infarction, progression to chronic kidney disease, etc., is assigned to the subject when the measured concentration is above the threshold, relative to a likelihood assigned when the measured concentration is below the threshold. For a "negative going" kidney injury marker, an increased likelihood of one or more of: acute kidney injury, progression to a worsening stage of AKI, mortality, a requirement for renal replacement therapy, a requirement for withdrawal of renal toxins, end stage renal disease, heart failure, stroke, myocardial infarction, progression to chronic kidney disease, etc., is assigned to the subject when the measured concentration is below the threshold, relative to a likelihood assigned when the measured concentration is above the threshold.
[0023] In such risk stratification embodiments, preferably the likelihood or risk assigned is that an event of interest is more or less likely to occur within 180 days of the time at which the body fluid sample is obtained from the subject. In particularly preferred embodiments, the likelihood or risk assigned relates to an event of interest occurring within a shorter time period such as 18 months, 120 days, 90 days, 60 days, 45 days, 30 days, 21 days, 14 days, 7 days, 5 days, 96 hours, 72 hours, 48 hours, 36 hours, 24 hours, 12 hours, or less. A risk at 0 hours of the time at which the body fluid sample is obtained from the subject is equivalent to diagnosis of a current condition.
[0024] In preferred risk stratification embodiments, the subject is selected for risk stratification based on the pre-existence in the subject of one or more known risk factors for prerenal, intrinsic renal, or postrenal ARF. For example, a subject undergoing or having undergone major vascular surgery, coronary artery bypass, or other cardiac surgery; a subject having pre-existing congestive heart failure, preeclampsia, eclampsia, diabetes mellitus, hypertension, coronary artery disease, proteinuria, renal insufficiency, glomerular filtration below the normal range, cirrhosis, serum creatinine above the normal range, or sepsis; or a subject exposed to NSAIDs, cyclosporines, tacrolimus, aminoglycosides, foscarnet, ethylene glycol, hemoglobin, myoglobin, ifosfamide, heavy metals, methotrexate, radiopaque contrast agents, or streptozotocin are all preferred subjects for monitoring risks according to the methods described herein. This list is not meant to be limiting. By "pre-existence" in this context is meant that the risk factor exists at the time the body fluid sample is obtained from the subject. In particularly preferred embodiments, a subject is chosen for risk stratification based on an existing diagnosis of injury to renal function, reduced renal function, or ARF.
[0025] In other embodiments, the methods for evaluating renal status described herein are methods for diagnosing a renal injury in the subject; that is, assessing whether or not a subject has suffered from an injury to renal function, reduced renal function, or ARF. In these embodiments, the assay result(s), for example measured concentration(s) of one or more biomarkers selected from the group consisting of Interleukin-5, Interleukin-6 receptor subunit beta, Tissue factor, Sex hormone-binding globulin, Alpha-2-macroglobulin, Apolipoprotein A-I, Calcitonin, Thrombopoietin, C-reactive protein, Intercellular adhesion molecule 3, Macrophage metalloelastase, Apolipoprotein B-100, and Fibrinogen is/are correlated to the occurrence or nonoccurrence of a change in renal status. The following are preferred diagnostic embodiments.
[0026] In preferred diagnostic embodiments, these methods comprise diagnosing the occurrence or nonoccurrence of an injury to renal function, and the assay result(s) is/are correlated to the occurrence or nonoccurrence of such an injury. For example, each of the measured concentration(s) may be compared to a threshold value. For a positive going marker, an increased likelihood of the occurrence of an injury to renal function is assigned to the subject when the measured concentration is above the threshold (relative to the likelihood assigned when the measured concentration is below the threshold); alternatively, when the measured concentration is below the threshold, an increased likelihood of the nonoccurrence of an injury to renal function may be assigned to the subject (relative to the likelihood assigned when the measured concentration is above the threshold). For a negative going marker, an increased likelihood of the occurrence of an injury to renal function is assigned to the subject when the measured concentration is below the threshold (relative to the likelihood assigned when the measured concentration is above the threshold); alternatively, when the measured concentration is above the threshold, an increased likelihood of the nonoccurrence of an injury to renal function may be assigned to the subject (relative to the likelihood assigned when the measured concentration is below the threshold).
[0027] In other preferred diagnostic embodiments, these methods comprise diagnosing the occurrence or nonoccurrence of reduced renal function, and the assay result(s) is/are correlated to the occurrence or nonoccurrence of an injury causing reduced renal function. For example, each of the measured concentration(s) may be compared to a threshold value. For a positive going marker, an increased likelihood of the occurrence of an injury causing reduced renal function is assigned to the subject when the measured concentration is above the threshold (relative to the likelihood assigned when the measured concentration is below the threshold); alternatively, when the measured concentration is below the threshold, an increased likelihood of the nonoccurrence of an injury causing reduced renal function may be assigned to the subject (relative to the likelihood assigned when the measured concentration is above the threshold). For a negative going marker, an increased likelihood of the occurrence of an injury causing reduced renal function is assigned to the subject when the measured concentration is below the threshold (relative to the likelihood assigned when the measured concentration is above the threshold); alternatively, when the measured concentration is above the threshold, an increased likelihood of the nonoccurrence of an injury causing reduced renal function may be assigned to the subject (relative to the likelihood assigned when the measured concentration is below the threshold).
[0028] In yet other preferred diagnostic embodiments, these methods comprise diagnosing the occurrence or nonoccurrence of ARF, and the assay result(s) is/are correlated to the occurrence or nonoccurrence of an injury causing ARF. For example, each of the measured concentration(s) may be compared to a threshold value. For a positive going marker, an increased likelihood of the occurrence of ARF is assigned to the subject when the measured concentration is above the threshold (relative to the likelihood assigned when the measured concentration is below the threshold); alternatively, when the measured concentration is below the threshold, an increased likelihood of the nonoccurrence of ARF may be assigned to the subject (relative to the likelihood assigned when the measured concentration is above the threshold). For a negative going marker, an increased likelihood of the occurrence of ARF is assigned to the subject when the measured concentration is below the threshold (relative to the likelihood assigned when the measured concentration is above the threshold); alternatively, when the measured concentration is above the threshold, an increased likelihood of the nonoccurrence of ARF may be assigned to the subject (relative to the likelihood assigned when the measured concentration is below the threshold).
[0029] In still other preferred diagnostic embodiments, these methods comprise diagnosing a subject as being in need of renal replacement therapy, and the assay result(s) is/are correlated to a need for renal replacement therapy. For example, each of the measured concentration(s) may be compared to a threshold value. For a positive going marker, an increased likelihood of the occurrence of an injury creating a need for renal replacement therapy is assigned to the subject when the measured concentration is above the threshold (relative to the likelihood assigned when the measured concentration is below the threshold); alternatively, when the measured concentration is below the threshold, an increased likelihood of the nonoccurrence of an injury creating a need for renal replacement therapy may be assigned to the subject (relative to the likelihood assigned when the measured concentration is above the threshold). For a negative going marker, an increased likelihood of the occurrence of an injury creating a need for renal replacement therapy is assigned to the subject when the measured concentration is below the threshold (relative to the likelihood assigned when the measured concentration is above the threshold); alternatively, when the measured concentration is above the threshold, an increased likelihood of the nonoccurrence of an injury creating a need for renal replacement therapy may be assigned to the subject (relative to the likelihood assigned when the measured concentration is below the threshold).
[0030] In still other preferred diagnostic embodiments, these methods comprise diagnosing a subject as being in need of renal transplantation, and the assay result (s0 is/are correlated to a need for renal transplantation. For example, each of the measured concentration(s) may be compared to a threshold value. For a positive going marker, an increased likelihood of the occurrence of an injury creating a need for renal transplantation is assigned to the subject when the measured concentration is above the threshold (relative to the likelihood assigned when the measured concentration is below the threshold); alternatively, when the measured concentration is below the threshold, an increased likelihood of the nonoccurrence of an injury creating a need for renal transplantation may be assigned to the subject (relative to the likelihood assigned when the measured concentration is above the threshold). For a negative going marker, an increased likelihood of the occurrence of an injury creating a need for renal transplantation is assigned to the subject when the measured concentration is below the threshold (relative to the likelihood assigned when the measured concentration is above the threshold); alternatively, when the measured concentration is above the threshold, an increased likelihood of the nonoccurrence of an injury creating a need for renal transplantation may be assigned to the subject (relative to the likelihood assigned when the measured concentration is below the threshold).
[0031] In still other embodiments, the methods for evaluating renal status described herein are methods for monitoring a renal injury in the subject; that is, assessing whether or not renal function is improving or worsening in a subject who has suffered from an injury to renal function, reduced renal function, or ARF. In these embodiments, the assay result(s), for example measured concentration(s) of one or more biomarkers selected from the group consisting of Interleukin-5, Interleukin-6 receptor subunit beta, Tissue factor, Sex hormone-binding globulin, Alpha-2-macroglobulin, Apolipoprotein A-I, Calcitonin, Thrombopoietin, C-reactive protein, Intercellular adhesion molecule 3, Macrophage metalloelastase, Apolipoprotein B-100, and Fibrinogen is/are correlated to the occurrence or nonoccurrence of a change in renal status. The following are preferred monitoring embodiments.
[0032] In preferred monitoring embodiments, these methods comprise monitoring renal status in a subject suffering from an injury to renal function, and the assay result(s) is/are correlated to the occurrence or nonoccurrence of a change in renal status in the subject. For example, the measured concentration(s) may be compared to a threshold value. For a positive going marker, when the measured concentration is above the threshold, a worsening of renal function may be assigned to the subject; alternatively, when the measured concentration is below the threshold, an improvement of renal function may be assigned to the subject. For a negative going marker, when the measured concentration is below the threshold, a worsening of renal function may be assigned to the subject; alternatively, when the measured concentration is above the threshold, an improvement of renal function may be assigned to the subject.
[0033] In other preferred monitoring embodiments, these methods comprise monitoring renal status in a subject suffering from reduced renal function, and the assay result(s) is/are correlated to the occurrence or nonoccurrence of a change in renal status in the subject. For example, the measured concentration(s) may be compared to a threshold value. For a positive going marker, when the measured concentration is above the threshold, a worsening of renal function may be assigned to the subject; alternatively, when the measured concentration is below the threshold, an improvement of renal function may be assigned to the subject. For a negative going marker, when the measured concentration is below the threshold, a worsening of renal function may be assigned to the subject; alternatively, when the measured concentration is above the threshold, an improvement of renal function may be assigned to the subject.
[0034] In yet other preferred monitoring embodiments, these methods comprise monitoring renal status in a subject suffering from acute renal failure, and the assay result(s) is/are correlated to the occurrence or nonoccurrence of a change in renal status in the subject. For example, the measured concentration(s) may be compared to a threshold value. For a positive going marker, when the measured concentration is above the threshold, a worsening of renal function may be assigned to the subject; alternatively, when the measured concentration is below the threshold, an improvement of renal function may be assigned to the subject. For a negative going marker, when the measured concentration is below the threshold, a worsening of renal function may be assigned to the subject; alternatively, when the measured concentration is above the threshold, an improvement of renal function may be assigned to the subject.
[0035] In other additional preferred monitoring embodiments, these methods comprise monitoring renal status in a subject at risk of an injury to renal function due to the pre-existence of one or more known risk factors for prerenal, intrinsic renal, or postrenal ARF, and the assay result(s) is/are correlated to the occurrence or nonoccurrence of a change in renal status in the subject. For example, the measured concentration(s) may be compared to a threshold value. For a positive going marker, when the measured concentration is above the threshold, a worsening of renal function may be assigned to the subject; alternatively, when the measured concentration is below the threshold, an improvement of renal function may be assigned to the subject. For a negative going marker, when the measured concentration is below the threshold, a worsening of renal function may be assigned to the subject; alternatively, when the measured concentration is above the threshold, an improvement of renal function may be assigned to the subject.
[0036] In still other embodiments, the methods for evaluating renal status described herein are methods for classifying a renal injury in the subject; that is, determining whether a renal injury in a subject is prerenal, intrinsic renal, or postrenal; and/or further subdividing these classes into subclasses such as acute tubular injury, acute glomerulonephritis acute tubulointerstitial nephritis, acute vascular nephropathy, or infiltrative disease; and/or assigning a likelihood that a subject will progress to a particular RIFLE stage. In these embodiments, the assay result(s), for example measured concentration(s) of one or more biomarkers selected from the group consisting of Interleukin-5, Interleukin-6 receptor subunit beta, Tissue factor, Sex hormone-binding globulin, Alpha-2-macroglobulin, Apolipoprotein A-I, Calcitonin, Thrombopoietin, C-reactive protein, Intercellular adhesion molecule 3, Macrophage metalloelastase, Apolipoprotein B-100, and Fibrinogen is/are correlated to a particular class and/or subclass. The following are preferred classification embodiments.
[0037] In preferred classification embodiments, these methods comprise determining whether a renal injury in a subject is prerenal, intrinsic renal, or postrenal; and/or further subdividing these classes into subclasses such as acute tubular injury, acute glomerulonephritis acute tubulointerstitial nephritis, acute vascular nephropathy, or infiltrative disease; and/or assigning a likelihood that a subject will progress to a particular RIFLE stage, and the assay result(s) is/are correlated to the injury classification for the subject. For example, the measured concentration may be compared to a threshold value, and when the measured concentration is above the threshold, a particular classification is assigned; alternatively, when the measured concentration is below the threshold, a different classification may be assigned to the subject.
[0038] A variety of methods may be used by the skilled artisan to arrive at a desired threshold value for use in these methods. For example, the threshold value may be determined from a population of normal subjects by selecting a concentration representing the 75th, 85th, 90th, 95th, or 99th percentile of a kidney injury marker measured in such normal subjects. Alternatively, the threshold value may be determined from a "diseased" population of subjects, e.g., those suffering from an injury or having a predisposition for an injury (e.g., progression to ARF or some other clinical outcome such as death, dialysis, renal transplantation, etc.), by selecting a concentration representing the 75th, 85th, 90th, 95th, or 99th percentile of a kidney injury marker measured in such subjects. In another alternative, the threshold value may be determined from a prior measurement of a kidney injury marker in the same subject; that is, a temporal change in the level of a kidney injury marker in the subject may be used to assign risk to the subject.
[0039] The foregoing discussion is not meant to imply, however, that the kidney injury markers of the present invention must be compared to corresponding individual thresholds. Methods for combining assay results can comprise the use of multivariate logistical regression, loglinear modeling, neural network analysis, n-of-m analysis, decision tree analysis, calculating ratios of markers, etc. This list is not meant to be limiting. In these methods, a composite result which is determined by combining individual markers may be treated as if it is itself a marker; that is, a threshold may be determined for the composite result as described herein for individual markers, and the composite result for an individual patient compared to this threshold.
[0040] The ability of a particular test to distinguish two populations can be established using ROC analysis. For example, ROC curves established from a "first" subpopulation which is predisposed to one or more future changes in renal status, and a "second" subpopulation which is not so predisposed can be used to calculate a ROC curve, and the area under the curve provides a measure of the quality of the test. Preferably, the tests described herein provide a ROC curve area greater than 0.5, preferably at least 0.6, more preferably 0.7, still more preferably at least 0.8, even more preferably at least 0.9, and most preferably at least 0.95.
[0041] In certain aspects, the measured concentration of one or more kidney injury markers, or a composite of such markers, may be treated as continuous variables. For example, any particular concentration can be converted into a corresponding probability of a future reduction in renal function for the subject, the occurrence of an injury, a classification, etc. In yet another alternative, a threshold that can provide an acceptable level of specificity and sensitivity in separating a population of subjects into "bins" such as a "first" subpopulation (e.g., which is predisposed to one or more future changes in renal status, the occurrence of an injury, a classification, etc.) and a "second" subpopulation which is not so predisposed. A threshold value is selected to separate this first and second population by one or more of the following measures of test accuracy:
an odds ratio greater than 1, preferably at least about 2 or more or about 0.5 or less, more preferably at least about 3 or more or about 0.33 or less, still more preferably at least about 4 or more or about 0.25 or less, even more preferably at least about 5 or more or about 0.2 or less, and most preferably at least about 10 or more or about 0.1 or less; a specificity of greater than 0.5, preferably at least about 0.6, more preferably at least about 0.7, still more preferably at least about 0.8, even more preferably at least about 0.9 and most preferably at least about 0.95, with a corresponding sensitivity greater than 0.2, preferably greater than about 0.3, more preferably greater than about 0.4, still more preferably at least about 0.5, even more preferably about 0.6, yet more preferably greater than about 0.7, still more preferably greater than about 0.8, more preferably greater than about 0.9, and most preferably greater than about 0.95; a sensitivity of greater than 0.5, preferably at least about 0.6, more preferably at least about 0.7, still more preferably at least about 0.8, even more preferably at least about 0.9 and most preferably at least about 0.95, with a corresponding specificity greater than 0.2, preferably greater than about 0.3, more preferably greater than about 0.4, still more preferably at least about 0.5, even more preferably about 0.6, yet more preferably greater than about 0.7, still more preferably greater than about 0.8, more preferably greater than about 0.9, and most preferably greater than about 0.95; at least about 75% sensitivity, combined with at least about 75% specificity; a positive likelihood ratio (calculated as sensitivity/(1-specificity)) of greater than 1, at least about 2, more preferably at least about 3, still more preferably at least about 5, and most preferably at least about 10; or a negative likelihood ratio (calculated as (1-sensitivity)/specificity) of less than 1, less than or equal to about 0.5, more preferably less than or equal to about 0.3, and most preferably less than or equal to about 0.1. The term "about" in the context of any of the above measurements refers to +/-5% of a given measurement.
[0042] Multiple thresholds may also be used to assess renal status in a subject. For example, a "first" subpopulation which is predisposed to one or more future changes in renal status, the occurrence of an injury, a classification, etc., and a "second" subpopulation which is not so predisposed can be combined into a single group. This group is then subdivided into three or more equal parts (known as tertiles, quartiles, quintiles, etc., depending on the number of subdivisions). An odds ratio is assigned to subjects based on which subdivision they fall into. If one considers a tertile, the lowest or highest tertile can be used as a reference for comparison of the other subdivisions. This reference subdivision is assigned an odds ratio of 1. The second tertile is assigned an odds ratio that is relative to that first tertile. That is, someone in the second tertile might be 3 times more likely to suffer one or more future changes in renal status in comparison to someone in the first tertile. The third tertile is also assigned an odds ratio that is relative to that first tertile.
[0043] In certain embodiments, the assay method is an immunoassay. Antibodies for use in such assays will specifically bind a full length kidney injury marker of interest, and may also bind one or more polypeptides that are "related" thereto, as that term is defined hereinafter. Numerous immunoassay formats are known to those of skill in the art. Preferred body fluid samples are selected from the group consisting of urine, blood, serum, saliva, tears, and plasma.
[0044] The foregoing method steps should not be interpreted to mean that the kidney injury marker assay result(s) is/are used in isolation in the methods described herein. Rather, additional variables or other clinical indicia may be included in the methods described herein. For example, a risk stratification, diagnostic, classification, monitoring, etc. method may combine the assay result(s) with one or more variables measured for the subject selected from the group consisting of demographic information (e.g., weight, sex, age, race), medical history (e.g., family history, type of surgery, pre-existing disease such as aneurism, congestive heart failure, preeclampsia, eclampsia, diabetes mellitus, hypertension, coronary artery disease, proteinuria, renal insufficiency, or sepsis, type of toxin exposure such as NSAIDs, cyclosporines, tacrolimus, aminoglycosides, foscarnet, ethylene glycol, hemoglobin, myoglobin, ifosfamide, heavy metals, methotrexate, radiopaque contrast agents, or streptozotocin), clinical variables (e.g., blood pressure, temperature, respiration rate), risk scores (APACHE score, PREDICT score, TIMI Risk Score for UA/NSTEMI, Framingham Risk Score, risk scores of Thakar et al. (J. Am. Soc. Nephrol. 16: 162-68, 2005), Mehran et al. (J. Am. Coll. Cardiol. 44: 1393-99, 2004), Wijeysundera et al. (JAMA 297: 1801-9, 2007), Goldstein and Chawla (Clin. J. Am. Soc. Nephrol. 5: 943-49, 2010), or Chawla et al. (Kidney Intl. 68: 2274-80, 2005)), a glomerular filtration rate, an estimated glomerular filtration rate, a urine production rate, a serum or plasma creatinine concentration, a urine creatinine concentration, a fractional excretion of sodium, a urine sodium concentration, a urine creatinine to serum or plasma creatinine ratio, a urine specific gravity, a urine osmolality, a urine urea nitrogen to plasma urea nitrogen ratio, a plasma BUN to creatnine ratio, a renal failure index calculated as urine sodium/(urine creatinine/plasma creatinine), a serum or plasma neutrophil gelatinase (NGAL) concentration, a urine NGAL concentration, a serum or plasma cystatin C concentration, a serum or plasma cardiac troponin concentration, a serum or plasma BNP concentration, a serum or plasma NTproBNP concentration, and a serum or plasma proBNP concentration. Other measures of renal function which may be combined with one or more kidney injury marker assay result(s) are described hereinafter and in Harrison's Principles of Internal Medicine, 17th Ed., McGraw Hill, New York, pages 1741-1830, and Current Medical Diagnosis & Treatment 2008, 47th Ed, McGraw Hill, New York, pages 785-815, each of which are hereby incorporated by reference in their entirety.
[0045] When more than one marker is measured, the individual markers may be measured in samples obtained at the same time, or may be determined from samples obtained at different (e.g., an earlier or later) times. The individual markers may also be measured on the same or different body fluid samples. For example, one kidney injury marker may be measured in a serum or plasma sample and another kidney injury marker may be measured in a urine sample. In addition, assignment of a likelihood may combine an individual kidney injury marker assay result with temporal changes in one or more additional variables.
[0046] In various related aspects, the present invention also relates to devices and kits for performing the methods described herein. Suitable kits comprise reagents sufficient for performing an assay for at least one of the described kidney injury markers, together with instructions for performing the described threshold comparisons.
[0047] In certain embodiments, reagents for performing such assays are provided in an assay device, and such assay devices may be included in such a kit. Preferred reagents can comprise one or more solid phase antibodies, the solid phase antibody comprising antibody that detects the intended biomarker target(s) bound to a solid support. In the case of sandwich immunoassays, such reagents can also include one or more detectably labeled antibodies, the detectably labeled antibody comprising antibody that detects the intended biomarker target(s) bound to a detectable label. Additional optional elements that may be provided as part of an assay device are described hereinafter.
[0048] Detectable labels may include molecules that are themselves detectable (e.g., fluorescent moieties, electrochemical labels, ecl (electrochemical luminescence) labels, metal chelates, colloidal metal particles, etc.) as well as molecules that may be indirectly detected by production of a detectable reaction product (e.g., enzymes such as horseradish peroxidase, alkaline phosphatase, etc.) or through the use of a specific binding molecule which itself may be detectable (e.g., a labeled antibody that binds to the second antibody, biotin, digoxigenin, maltose, oligohistidine, 2,4-dintrobenzene, phenylarsenate, ssDNA, dsDNA, etc.).
[0049] Generation of a signal from the signal development element can be performed using various optical, acoustical, and electrochemical methods well known in the art. Examples of detection modes include fluorescence, radiochemical detection, reflectance, absorbance, amperometry, conductance, impedance, interferometry, ellipsometry, etc. In certain of these methods, the solid phase antibody is coupled to a transducer (e.g., a diffraction grating, electrochemical sensor, etc) for generation of a signal, while in others, a signal is generated by a transducer that is spatially separate from the solid phase antibody (e.g., a fluorometer that employs an excitation light source and an optical detector). This list is not meant to be limiting. Antibody-based biosensors may also be employed to determine the presence or amount of analytes that optionally eliminate the need for a labeled molecule.
DETAILED DESCRIPTION OF THE INVENTION
[0050] The present invention relates to methods and compositions for diagnosis, differential diagnosis, risk stratification, monitoring, classifying and determination of treatment regimens in subjects suffering or at risk of suffering from injury to renal function, reduced renal function and/or acute renal failure through measurement of one or more kidney injury markers. In various embodiments, a measured concentration of one or more biomarkers selected from the group consisting of Interleukin-5, Interleukin-6 receptor subunit beta, Tissue factor, Sex hormone-binding globulin, Alpha-2-macroglobulin, Apolipoprotein A-I, Calcitonin, Thrombopoietin, C-reactive protein, Intercellular adhesion molecule 3, Macrophage metalloelastase, Apolipoprotein B-100, and Fibrinogen or one or more markers related thereto, are correlated to the renal status of the subject.
[0051] For purposes of this document, the following definitions apply:
[0052] As used herein, an "injury to renal function" is an abrupt (within 14 days, preferably within 7 days, more preferably within 72 hours, and still more preferably within 48 hours) measurable reduction in a measure of renal function. Such an injury may be identified, for example, by a decrease in glomerular filtration rate or estimated GFR, a reduction in urine output, an increase in serum creatinine, an increase in serum cystatin C, a requirement for renal replacement therapy, etc. "Improvement in Renal Function" is an abrupt (within 14 days, preferably within 7 days, more preferably within 72 hours, and still more preferably within 48 hours) measurable increase in a measure of renal function. Preferred methods for measuring and/or estimating GFR are described hereinafter.
[0053] As used herein, "reduced renal function" is an abrupt (within 14 days, preferably within 7 days, more preferably within 72 hours, and still more preferably within 48 hours) reduction in kidney function identified by an absolute increase in serum creatinine of greater than or equal to 0.1 mg/dL (≧8.8 μmol/L), a percentage increase in serum creatinine of greater than or equal to 20% (1.2-fold from baseline), or a reduction in urine output (documented oliguria of less than 0.5 ml/kg per hour).
[0054] As used herein, "acute renal failure" or "ARF" is an abrupt (within 14 days, preferably within 7 days, more preferably within 72 hours, and still more preferably within 48 hours) reduction in kidney function identified by an absolute increase in serum creatinine of greater than or equal to 0.3 mg/dl (≧26.4 μmol/l), a percentage increase in serum creatinine of greater than or equal to 50% (1.5-fold from baseline), or a reduction in urine output (documented oliguria of less than 0.5 ml/kg per hour for at least 6 hours). This term is synonymous with "acute kidney injury" or "AKI."
[0055] As used herein, the term "Interleukin-5" refers to one or more polypeptides present in a biological sample that are derived from the Interleukin-5 precursor (human precursor Swiss-Prot P05113 (SEQ ID NO: 1))
TABLE-US-00002 10 20 30 40 50 60 MRMLLHLSLL ALGAAYVYAI PTEIPTSALV KETLALLSTH RTLLIANETL RIPVPVHKNH 70 80 90 100 110 120 QLCTEEIFQG IGTLESQTVQ GGTVERLFKN LSLIKKYIDG QKKKCGEERR RVNQFLDYLQ 130 EFLGVMNTEW IIES
[0056] The following domains have been identified in Interleukin-5:
TABLE-US-00003 Residues Length Domain ID 1-19 19 Signal peptide 20-134 115 Interleukin-5
[0057] As used herein, the term "Interleukin-6 receptor subunit beta" refers to one or more polypeptides present in a biological sample that are derived from the Interleukin-6 receptor subunit beta precursor (human precursor Swiss-Prot P40189 (SEQ ID NO: 2))
TABLE-US-00004 10 20 30 40 50 60 MLTLQTWLVQ ALFIFLTTES TGELLDPCGY ISPESPVVQL HSNFTAVCVL KEKCMDYFHV 70 80 90 100 110 120 NANYIVWKTN HFTIPKEQYT IINRTASSVT FTDIASLNIQ LTCNILTFGQ LEQNVYGITI 130 140 150 160 170 180 ISGLPPEKPK NLSCIVNEGK KMRCEWDGGR ETHLETNFTL KSEWATHKFA DCKAKRDTPT 190 200 210 220 230 240 SCTVDYSTVY FVNIEVWVEA ENALGKVTSD HINFDPVYKV KPNPPHNLSV INSEELSSIL 250 260 270 280 290 300 KLTWTNPSIK SVIILKYNIQ YRTKDASTWS QIPPEDTAST RSSFTVQDLK PFTEYVFRIR 310 320 330 340 350 360 CMKEDGKGYW SDWSEEASGI TYEDRPSKAP SFWYKIDPSH TQGYRTVQLV WKTLPPFEAN 370 380 390 400 410 420 GKILDYEVTL TRWKSHLQNY TVNATKLTVN LTNDRYLATL TVRNLVGKSD AAVLTIPACD 430 440 450 460 470 480 FQATHPVMDL KAFPKDNMLW VEWTTPRESV KKYILEWCVL SDKAPCITDW QQEDGTVHRT 490 500 510 520 530 540 YLRGNLAESK CYLITVTPVY ADGPGSPESI KAYLKQAPPS KGPTVRTKKV GKNEAVLEWD 550 560 570 580 590 600 QLPVDVQNGF IRNYTIFYRT IIGNETAVNV DSSHTEYTLS SLTSDTLYMV RMAAYTDEGG 610 620 630 640 650 660 KDGPEFTFTT PKFAQGEIEA IVVPVCLAFL LTTLLGVLFC FNKRDLIKKH IWPNVPDPSK 670 680 690 700 710 720 SHIAQWSPHT PPRHNFNSKD QMYSDGNFTD VSVVEIEAND KKPFPEDLKS LDLFKKEKIN 730 740 750 760 770 780 TEGHSSGIGG SSCMSSSRPS ISSSDENESS QNTSSTVQYS TVVHSGYRHQ VPSVQVFSRS 790 800 810 820 830 840 ESTQPLLDSE ERPEDLQLVD HVDGGDGILP RQQYFKQNCS QHESSPDISH FERSKQVSSV 850 860 870 880 890 900 NEEDFVRLKQ QISDHISQSC GSGQMKMFQE VSAADAFGPG TEGQVERFET VGMEAATDEG 910 MPKSYLPQTV RQGGYMPQ
[0058] Most preferably, the Interleukin-6 receptor subunit beta assay detects one or more soluble forms of Interleukin-6 receptor subunit beta. Interleukin-6 receptor subunit beta is a type I membrane protein having a large extracellular domain, most or all of which is present in soluble forms of Interleukin-6 receptor subunit beta generated either through alternative splicing event which deletes all or a portion of the transmembrane domain, or by proteolysis of the membrane-bound form. In the case of an immunoassay, one or more antibodies that bind to epitopes within this extracellular domain may be used to detect these soluble form(s). The following domains have been identified in Interleukin-6 receptor subunit beta:
TABLE-US-00005 Residues Length Domain ID 1-22 22 Signal peptide 23-918 896 Interleukin-6 receptor subunit beta 642-918 277 Cytoplasmic domain 620-641 21 transmembrane domain 23-619 597 Extracellular domain 330-918 589 Missing in isoform 2 325-329 5 RPSKA (SEQ ID NO: 3) → NIASF (SEQ ID NO: 4) in isoform 2
[0059] As used herein, the term "Tissue factor" refers to one or more polypeptides present in a biological sample that are derived from the Tissue factor precursor (human precursor Swiss-Prot P13726 (SEQ ID NO: 5))
TABLE-US-00006 10 20 30 40 50 60 METPAWPRVP RPETAVARTL LLGWVFAQVA GASGTTNTVA AYNLTWKSTN FKTILEWEPK 70 80 90 100 110 120 PVNQVYTVQI STKSGDWKSK CFYTTDTECD LTDEIVKDVK QTYLARVFSY PAGNVESTGS 130 140 150 160 170 180 AGEPLYENSP EFTPYLETNL GQPTIQSFEQ VGTKVNVTVE DERTLVRRNN TFLSLRDVFG 190 200 210 220 230 240 KDLIYTLYYW KSSSSGKKTA KTNTNEFLID VDKGENYCFS VQAVIPSRTV NRKSTDSPVE 250 260 270 280 290 CMGQEKGEFR EIFYIIGAVV FVVIILVIIL AISLHKCRKA GVGQSWKENS PLNVS
[0060] Most preferably, the Tissue factor assay detects one or more soluble forms of Tissue factor. Tissue factor is a type I membrane protein having a large extracellular domain, most or all of which is present in soluble forms of Tissue factor generated either through alternative splicing event which deletes all or a portion of the transmembrane domain, or by proteolysis of the membrane-bound form. In the case of an immunoassay, one or more antibodies that bind to epitopes within this extracellular domain may be used to detect these soluble form(s). The following domains have been identified in Tissue factor:
TABLE-US-00007 Residues Length Domain ID 1-32 32 Signal peptide 33-295 263 Tissue factor 275-295 21 Cytoplasmic domain 252-274 23 transmembrane domain 33-251 456 Extracellular domain
[0061] As used herein, the term "Sex hormone-binding globulin" refers to one or more polypeptides present in a biological sample that are derived from the Sex hormone-binding globulin precursor (human precursor Swiss-Prot P04278 (SEQ ID NO: 6))
TABLE-US-00008 10 20 30 40 50 60 MESRGPLATS RLLLLLLLLL LRHTRQGWAL RPVLPTQSAH DPPAVHLSNG PGQEPIAVMT 70 80 90 100 110 120 FDLTKITKTS SSFEVRTWDP EGVIFYGDTN PKDDWFMLGL RDGRPEIQLH NHWAQLTVGA 130 140 150 160 170 180 GPRLDDGRWH QVEVKMEGDS VLLEVDGEEV LRLRQVSGPL TSKRHPIMRI ALGGLLFPAS 190 200 210 220 230 240 NLRLPLVPAL DGCLRRDSWL DKQAEISASA PTSLRSCDVE SNPGIFLPPG TQAEFNLRDI 250 260 270 280 290 300 PQPHAEPWAF SLDLGLKQAA GSGHLLALGT PENPSWLSLH LQDQKVVLSS GSGPGLDLPL 310 320 330 340 350 360 VLGLPLQLKL SMSRVVLSQG SKMKALALPP LGLAPLLNLW AKPQGRLFLG ALPGEDSSTS 370 380 390 400 FCLNGLWAQG QRLDVDQALN RSHEIWTHSC PQSPGNGTDA SH
[0062] The following domains have been identified in Sex hormone-binding globulin:
TABLE-US-00009 Residues Length Domain ID 1-29 29 Signal peptide 30-402 373 Sex hormone-binding globulin
[0063] As used herein, the term "Alpha-2-macroglobulin" refers to one or more polypeptides present in a biological sample that are derived from the Alpha-2-macroglobulin precursor (human precursor Swiss-Prot P01023 (SEQ ID NO: 7))
TABLE-US-00010 10 20 30 40 50 60 MGKNKLLHPS LVLLLLVLLP TDASVSGKPQ YMVLVPSLLH TETTEKGCVL LSYLNETVTV 70 80 90 100 110 120 SASLESVRGN RSLFTDLEAE NDVLHCVAFA VPKSSSNEEV MFLTVQVKGP TQEFKKRTTV 130 140 150 160 170 180 MVKNEDSLVF VQTDKSIYKP GQTVKFRVVS MDENFHPLNE LIPLVYIQDP KGNRIAQWQS 190 200 210 220 230 240 FQLEGGLKQF SFPLSSEPFQ GSYKVVVQKK SGGRTEHPFT VEEFVLPKFE VQVTVPKIIT 250 260 270 280 290 300 ILEEEMNVSV CGLYTYGKPV PGHVTVSICR KYSDASDCHG EDSQAFCEKF SGQLNSHGCF 310 320 330 340 350 360 YQQVKTKVFQ LKRKEYEMKL HTEAQIQEEG TVVELTGRQS SEITRTITKL SFVKVDSHFR 370 380 390 400 410 420 QGIPFFGQVR LVDGKGVPIP NKVIFIRGNE ANYYSNATTD EHGLVQFSIN TTNVMGTSLT 430 440 450 460 470 480 VRVNYKDRSP CYGYQWVSEE HEEAHHTAYL VFSPSKSFVH LEPMSHELPC GHTQTVQAHY 490 500 510 520 530 540 ILNGGTLLGL KKLSFYYLIM AKGGIVRTGT HGLLVKQEDM KGHFSISIPV KSDIAPVARL 550 560 570 580 590 600 LIYAVLPTGD VIGDSAKYDV ENCLANKVDL SFSPSQSLPA SHAHLRVTAA PQSVCALRAV 610 620 630 640 650 660 DQSVLLMKPD AELSASSVYN LLPEKDLTGF PGPLNDQDDE DCINRHNVYI NGITYTPVSS 670 680 690 700 710 720 TNEKDMYSFL EDMGLKAFTN SKIRKPKMCP QLQQYEMHGP EGLRVGFYES DVMGRGHARL 730 740 750 760 770 780 VHVEEPHTET VRKYFPETWI WDLVVVNSAG VAEVGVTVPD TITEWKAGAF CLSEDAGLGI 790 800 810 820 830 840 SSTASLRAFQ PFFVELTMPY SVIRGEAFTL KATVLNYLPK CIRVSVQLEA SPAFLAVPVE 850 860 870 880 890 900 KEQAPHCICA NGRQTVSWAV TPKSLGNVNF TVSAEALESQ ELCGTEVPSV PEHGRKDTVI 910 920 930 940 950 960 KPLLVEPEGL EKETTFNSLL CPSGGEVSEE LSLKLPPNVV EESARASVSV LGDILGSAMQ 970 980 990 1000 1010 1020 NTQNLLQMPY GCGEQNMVLF APNIYVLDYL NETQQLTPEI KSKAIGYLNT GYQRQLNYKH 1030 1040 1050 1060 1070 1080 YDGSYSTFGE RYGRNQGNTW LTAFVLKTFA QARAYIFIDE AHITQALIWL SQRQKDNGCF 1090 1100 1110 1120 1130 1140 RSSGSLLNNA IKGGVEDEVT LSAYITIALL EIPLTVTHPV VRNALFCLES AWKTAQEGDH 1150 1160 1170 1180 1190 1200 GSHVYTKALL AYAFALAGNQ DKRKEVLKSL NEEAVKKDNS VHWERPQKPK APVGHFYEPQ 1210 1220 1230 1240 1250 1260 APSAEVEMTS YVLLAYLTAQ PAPTSEDLTS ATNIVKWITK QQNAQGGFSS TQDTVVALHA 1270 1280 1290 1300 1310 1320 LSKYGAATFT RTGKAAQVTI QSSGTFSSKF QVDNNNRLLL QQVSLPELPG EYSMKVTGEG 1330 1340 1350 1360 1370 1380 CVYLQTSLKY NILPEKEEFP FALGVQTLPQ TCDEPKAHTS FQISLSVSYT GSRSASNMAI 1390 1400 1410 1420 1430 1440 VDVKMVSGFI PLKPTVKMLE RSNHVSRTEV SSNHVLIYLD KVSNQTLSLF FTVLQDVPVR 1450 1460 1470 DLKPAIVKVY DYYETDEFAI AEYNAPCSKD LGNA
[0064] The following domains have been identified in Alpha-2-macroglobulin:
TABLE-US-00011 Residues Length Domain ID 1-23 23 Signal peptide 24-1474 1451 Alpha-2-macroglobulin
[0065] As used herein, the term "Apolipoprotein A-I" refers to one or more polypeptides present in a biological sample that are derived from the Apolipoprotein A-I precursor (human precursor Swiss-Prot P02647 (SEQ ID NO: 8))
TABLE-US-00012 10 20 30 40 50 60 MKAAVLTLAV LFLTGSQARH FWQQDEPPQS PWDRVKDLAT VYVDVLKDSG RDYVSQFEGS 70 80 90 100 110 120 ALGKQLNLKL LDNWDSVTST FSKLREQLGP VTQEFWDNLE KETEGLRQEM SKDLEEVKAK 130 140 150 160 170 180 VQPYLDDFQK KWQEEMELYR QKVEPLRAEL QEGARQKLHE LQEKLSPLGE EMRDRARAHV 190 200 210 220 230 240 DALRTHLAPY SDELRQRLAA RLEALKENGG ARLAEYHAKA TEHLSTLSEK AKPALEDLRQ 250 260 GLLPVLESFK VSFLSALEEY TKKLNTQ
[0066] The following domains have been identified in Apolipoprotein A-I:
TABLE-US-00013 Residues Length Domain ID 1-18 18 Signal peptide 19-24 6 Propeptide 25-267 243 Apolipoprotein A-I 25-266 242 Apolipoprotein A-I(1-242)
[0067] As used herein, the term "Calcitonin" refers to one or more polypeptides present in a biological sample that are derived from the Calcitonin precursor (human precursor Swiss-Prot P01258 (SEQ ID NO: 9))
TABLE-US-00014 10 20 30 40 50 60 MGFQKFSPFL ALSILVLLQA GSLHAAPFRS ALESSPADPA TLSEDEARLL LAALVQDYVQ 70 80 90 100 110 120 MKASELEQEQ EREGSSLDSP RSKRCGNLST CMLGTYTQDF NKFHTFPQTA IGVGAPGKKR 130 140 DMSSDLERDH RPHVSMPQNA N
[0068] The following domains have been identified in Calcitonin:
TABLE-US-00015 Residues Length Domain ID 1-25 25 Signal peptide 26-82 57 Propeptide 85-116 32 Calcitonin 121-141 21 Katacalcin 134-141 32 VSMPQNAN (SEQ ID NO: 10)→ NHCPEESL (SEQ ID NO: 11) in isoform 2
[0069] As used herein, the term "Thrombopoietin" refers to one or more polypeptides present in a biological sample that are derived from the Thrombopoietin precursor (human precursor Swiss-Prot P40225 (SEQ ID NO: 12))
TABLE-US-00016 10 20 30 40 50 60 MELTELLLVV MLLLTARLTL SSPAPPACDL RVLSKLLRDS HVLHSRLSQC PEVHPLPTPV 70 80 90 100 110 120 LLPAVDFSLG EWKTQMEETK AQDILGAVTL LLEGVMAARG QLGPTCLSSL LGQLSGQVRL 130 140 150 160 170 180 LLGALQSLLG TQLPPQGRTT AHKDPNAIFL SFQHLLRGKV RFLMLVGGST LCVRRAPPTT 190 200 210 220 230 240 AVPSRTSLVL TLNELPNRTS GLLETNFTAS ARTTGSGLLK WQQGFRAKIP GLLNQTSRSL 250 260 270 280 290 300 DQIPGYLNRI HELLNGTRGL FPGPSRRTLG APDISSGTSD TGSLPPNLQP GYSPSPTHPP 310 320 330 340 350 TGQYTLFPLP PTLPTPVVQL HPLLPDPSAP TPTPTSPLLN TSYTHSQNLS QEG
[0070] The following domains have been identified in Thrombopoietin:
TABLE-US-00017 Residues Length Domain ID 1-21 21 Signal peptide 22-353 332 Thrombopoietin 133-136 4 Missing in Thrombopoietin, isoform 2 160-198 39 Missing in Thrombopoietin, isoform 3
[0071] As used herein, the term "C-reactive protein" refers to one or more polypeptides present in a biological sample that are derived from the C-reactive protein precursor (human precursor Swiss-Prot P02741 (SEQ ID NO: 13))
TABLE-US-00018 10 20 30 40 50 60 MEKLLCFLVL TSLSHAFGQT DMSRKAFVFP KESDTSYVSL KAPLTKPLKA FTVCLHFYTE 70 80 90 100 110 120 LSSTRGYSIF SYATKRQDNE ILIFWSKDIG YSFTVGGSEI LFEVPEVTVA PVHICTSWES 130 140 150 160 170 180 ASGIVEFWVD GKPRVRKSLK KGYTVGAEAS IILGQEQDSF GGNFEGSQSL VGDIGNVNMW 190 200 210 220 DFVLSPDEIN TIYLGGPFSP NVLNWRALKY EVQGEVFTKP QLWP
[0072] The following domains have been identified in C-reactive protein:
TABLE-US-00019 Residues Length Domain ID 1-18 18 Signal peptide 19-224 206 C-reactive protein 19-223 205 C-reactive protein (1-205) 67-199 133 Missing in isoform 2
[0073] As used herein, the term "Intercellular adhesion molecule 3" refers to one or more polypeptides present in a biological sample that are derived from the Intercellular adhesion molecule 3 precursor (human precursor Swiss-Prot P32942 (SEQ ID NO: 14))
TABLE-US-00020 10 20 30 40 50 60 MATMVPSVLW PRACWTLLVC CLLTPGVQGQ EFLLRVEPQN PVLSAGGSLF VNCSTDCPSS 70 80 90 100 110 120 EKIALETSLS KELVASGMGW AAFNLSNVTG NSRILCSVYC NGSQITGSSN ITVYRLPERV 130 140 150 160 170 180 ELAPLPPWQP VGQNFTLRCQ VEDGSPRTSL TVVLLRWEEE LSRQPAVEEP AEVTATVLAS 190 200 210 220 230 240 RDDHGAPFSC RTELDMQPQG LGLFVNTSAP RQLRTFVLPV TPPRLVAPRF LEVETSWPVD 250 260 270 280 290 300 CTLDGLFPAS EAQVYLALGD QMLNATVMNH GDTLTATATA TARADQEGAR EIVCNVTLGG 310 320 330 340 350 360 ERREARENLT VFSFLGPIVN LSEPTAHEGS TVTVSCMAGA RVQVTLDGVP AAAPGQPAQL 370 380 390 400 410 420 QLNATESDDG RSFFCSATLE VDGEFLHRNS SVQLRVLYGP KIDRATCPQH LKWKDKTRHV 430 440 450 460 470 480 LQCQARGNPY PELRCLKEGS SREVPVGIPF FVNVTHNGTY QCQASSSRGK YTLVVVMDIE 490 500 510 520 530 540 AGSSHFVPVF VAVLLTLGVV TIVLALMYVF REHQRSGSYH VREESTYLPL TSMQPTEAMG EEPSRAE
[0074] Most preferably, the Intercellular adhesion molecule 3 assay detects one or more soluble forms of Intercellular adhesion molecule 3. Intercellular adhesion molecule 3 is a type I membrane protein having a large extracellular domain, most or all of which is present in soluble forms of Intercellular adhesion molecule 3 generated either through alternative splicing event which deletes all or a portion of the transmembrane domain, or by proteolysis of the membrane-bound form. In the case of an immunoassay, one or more antibodies that bind to epitopes within this extracellular domain may be used to detect these soluble form(s). The following domains have been identified in Intercellular adhesion molecule 3:
TABLE-US-00021 Residues Length Domain ID 1-29 29 Signal peptide 30-547 518 Intercellular adhesion molecule 3 511-547 37 Cytoplasmic domain 486-510 25 transmembrane domain 30-485 456 Extracellular domain
[0075] As used herein, the term "Macrophage metalloelastase" refers to one or more polypeptides present in a biological sample that are derived from the Macrophage metalloelastase precursor (human precursor Swiss-Prot P39900 (SEQ ID NO: 15))
TABLE-US-00022 10 20 30 40 50 60 MKFLLILLLQ ATASGALPLN SSTSLEKNNV LFGERYLEKF YGLEINKLPV TKMKYSGNLM 70 80 90 100 110 120 KEKIQEMQHF LGLKVTGQLD TSTLEMMHAP RCGVPDVHHF REMPGGPVWR KHYITYRINN 130 140 150 160 170 180 YTPDMNREDV DYAIRKAFQV WSNVTPLKFS KINTGMADIL VVFARGAHGD FHAFDGKGGI 190 200 210 220 230 240 LAHAFGPGSG IGGDAHFDED EFWTTHSGGT NLFLTAVHEI GHSLGLGHSS DPKAVMFPTY 250 260 270 280 290 300 KYVDINTFRL SADDIRGIQS LYGDPKENQR LPNPDNSEPA LCDPNLSFDA VTTVGNKIFF 310 320 330 340 350 360 FKDRFFWLKV SERPKTSVNL ISSLWPTLPS GIEAAYEIEA RNQVFLFKDD KYWLISNLRP 370 380 390 400 410 420 EPNYPKSIHS FGFPNFVKKI DAAVFNPRFY RTYFFVDNQY WRYDERRQMM DPGYPKLITK 430 440 450 460 470 NFQGIGPKID AVFYSKNKYY YFFQGSNQFE YDFLLQRITK TLKSNSWFGC
[0076] The following domains have been identified in Macrophage metalloelastase:
TABLE-US-00023 Residues Length Domain ID 1-16 16 Signal peptide 17-105 89 Activation peptide 106-470 365 Macrophage metalloelastase
[0077] As used herein, the term "Apolipoprotein B-100" refers to one or more polypeptides present in a biological sample that are derived from the Apolipoprotein B-100 precursor (human precursor Swiss-Prot P04114 (SEQ ID NO: 16))
TABLE-US-00024 10 20 30 40 50 60 MDPPRPALLA LLALPALLLL LLAGARAEEE MLENVSLVCP KDATRFKHLR KYTYNYEAES 70 80 90 100 110 120 SSGVPGTADS RSATRINCKV ELEVPQLCSF ILKTSQCTLK EVYGFNPEGK ALLKKTKNSE 130 140 150 160 170 180 EFAAAMSRYE LKLAIPEGKQ VFLYPEKDEP TYILNIKRGI ISALLVPPET EEAKQVLFLD 190 200 210 220 230 240 TVYGNCSTHF TVKTRKGNVA TEISTERDLG QCDRFKPIRT GISPLALIKG MTRPLSTLIS 250 260 270 280 290 300 SSQSCQYTLD AKRKHVAEAI CKEQHLFLPF SYNNKYGMVA QVTQTLKLED TPKINSRFFG 310 320 330 340 350 360 EGTKKMGLAF ESTKSTSPPK QAEAVLKTLQ ELKKLTISEQ NIQRANLFNK LVTELRGLSD 370 380 390 400 410 420 EAVTSLLPQL IEVSSPITLQ ALVQCGQPQC STHILQWLKR VHANPLLIDV VTYLVALIPE 430 440 450 460 470 480 PSAQQLREIF NMARDQRSRA TLYALSHAVN NYHKTNPTGT QELLDIANYL MEQIQDDCTG 490 500 510 520 530 540 DEDYTYLILR VIGNMGQTME QLTPELKSSI LKCVQSTKPS LMIQKAAIQA LRKMEPKDKD 550 560 570 580 590 600 QEVLLQTFLD DASPGDKRLA AYLMLMRSPS QADINKIVQI LPWEQNEQVK NFVASHIANI 610 620 630 640 650 660 LNSEELDIQD LKKLVKEALK ESQLPTVMDF RKFSRNYQLY KSVSLPSLDP ASAKIEGNLI 670 680 690 700 710 720 FDPNNYLPKE SMLKTTLTAF GFASADLIEI GLEGKGFEPT LEALFGKQGF FPDSVNKALY 730 740 750 760 770 780 WVNGQVPDGV SKVLVDHFGY TKDDKHEQDM VNGIMLSVEK LIKDLKSKEV PEARAYLRIL 790 800 810 820 830 840 GEELGFASLH DLQLLGKLLL MGARTLQGIP QMIGEVIRKG SKNDFFLHYI FMENAFELPT 850 860 870 880 890 900 GAGLQLQISS SGVIAPGAKA GVKLEVANMQ AELVAKPSVS VEFVTNMGII IPDFARSGVQ 910 920 930 940 950 960 MNTNFFHESG LEAHVALKAG KLKFIIPSPK RPVKLLSGGN TLHLVSTTKT EVIPPLIENR 970 980 990 1000 1010 1020 QSWSVCKQVF PGLNYCTSGA YSNASSTDSA SYYPLTGDTR LELELRPTGE IEQYSVSATY 1030 1040 1050 1060 1070 1080 ELQREDRALV DTLKFVTQAE GAKQTEATMT FKYNRQSMTL SSEVQIPDFD VDLGTILRVN 1090 1100 1110 1120 1130 1140 DESTEGKTSY RLTLDIQNKK ITEVALMGHL SCDTKEERKI KGVISIPRLQ AEARSEILAH 1150 1160 1170 1180 1190 1200 WSPAKLLLQM DSSATAYGST VSKRVAWHYD EEKIEFEWNT GTNVDTKKMT SNFPVDLSDY 1210 1220 1230 1240 1250 1260 PKSLHMYANR LLDHRVPETD MTFRHVGSKL IVAMSSWLQK ASGSLPYTQT LQDHLNSLKE 1270 1280 1290 1300 1310 1320 FNLQNMGLPD FHIPENLFLK SDGRVKYTLN KNSLKIEIPL PFGGKSSRDL KMLETVRTPA 1330 1340 1350 1360 1370 1380 LHFKSVGFHL PSREFQVPTF TIPKLYQLQV PLLGVLDLST NVYSNLYNWS ASYSGGNTST 1390 1400 1410 1420 1430 1440 DHFSLRARYH MKADSVVDLL SYNVQGSGET TYDHKNTFTL SCDGSLRHKF LDSNIKFSHV 1450 1460 1470 1480 1490 1500 EKLGNNPVSK GLLIFDASSS WGPQMSASVH LDSKKKQHLF VKEVKIDGQF RVSSFYAKGT 1510 1520 1530 1540 1550 1560 YGLSCQRDPN TGRLNGESNL RFNSSYLQGT NQITGRYEDG TLSLTSTSDL QSGIIKNTAS 1570 1580 1590 1600 1610 1620 LKYENYELTL KSDTNGKYKN FATSNKMDMT FSKQNALLRS EYQADYESLR FFSLLSGSLN 1630 1640 1650 1660 1670 1680 SHGLELNADI LGTDKINSGA HKATLRIGQD GISTSATTNL KCSLLVLENE LNAELGLSGA 1690 1700 1710 1720 1730 1740 SMKLTTNGRF REHNAKFSLD GKAALTELSL GSAYQAMILG VDSKNIFNFK VSQEGLKLSN 1750 1760 1770 1780 1790 1800 DMMGSYAEMK FDHTNSLNIA GLSLDFSSKL DNIYSSDKFY KQTVNLQLQP YSLVTTLNSD 1810 1820 1830 1840 1850 1860 LKYNALDLTN NGKLRLEPLK LHVAGNLKGA YQNNEIKHIY AISSAALSAS YKADTVAKVQ 1870 1880 1890 1900 1910 1920 GVEFSHRLNT DIAGLASAID MSTNYNSDSL HFSNVFRSVM APFTMTIDAH TNGNGKLALW 1930 1940 1950 1960 1970 1980 GEHTGQLYSK FLLKAEPLAF TFSHDYKGST SHHLVSRKSI SAALEHKVSA LLTPAEQTGT 1990 2000 2010 2020 2030 2040 WKLKTQFNNN EYSQDLDAYN TKDKIGVELT GRTLADLTLL DSPIKVPLLL SEPINIIDAL 2050 2060 2070 2080 2090 2100 EMRDAVEKPQ EFTIVAFVKY DKNQDVHSIN LPFFETLQEY FERNRQTIIV VVENVQRNLK 2110 2120 2130 2140 2150 2160 HINIDQFVRK YRAALGKLPQ QANDYLNSFN WERQVSHAKE KLTALTKKYR ITENDIQIAL 2170 2180 2190 2200 2210 2220 DDAKINFNEK LSQLQTYMIQ FDQYIKDSYD LHDLKIAIAN IIDEIIEKLK SLDEHYHIRV 2230 2240 2250 2260 2270 2280 NLVKTIHDLH LFIENIDFNK SGSSTASWIQ NVDTKYQIRI QIQEKLQQLK RHIQNIDIQH 2290 2300 2310 2320 2330 2340 LAGKLKQHIE AIDVRVLLDQ LGTTISFERI NDVLEHVKHF VINLIGDFEV AEKINAFRAK 2350 2360 2370 2380 2390 2400 VHELIERYEV DQQIQVLMDK LVELTHQYKL KETIQKLSNV LQQVKIKDYF EKLVGFIDDA 2410 2420 2430 2440 2450 2460 VKKLNELSFK TFIEDVNKFL DMLIKKLKSF DYHQFVDETN DKIREVTQRL NGEIQALELP 2470 2480 2490 2500 2510 2520 QKAEALKLFL EETKATVAVY LESLQDTKIT LIINWLQEAL SSASLAHMKA KFRETLEDTR 2530 2540 2550 2560 2570 2580 DRMYQMDIQQ ELQRYLSLVG QVYSTLVTYI SDWWTLAAKN LTDFAEQYSI QDWAKRMKAL 2590 2600 2610 2620 2630 2640 VEQGFTVPEI KTILGTMPAF EVSLQALQKA TFQTPDFIVP LTDLRIPSVQ INFKDLKNIK 2650 2660 2670 2680 2690 2700 IPSRFSTPEF TILNTFHIPS FTIDFVEMKV KIIRTIDQMQ NSELQWPVPD IYLRDLKVED 2710 2720 2730 2740 2750 2760 IPLARITLPD FRLPEIAIPE FIIPTLNLND FQVPDLHIPE FQLPHISHTI EVPTFGKLYS 2770 2780 2790 2800 2810 2820 ILKIQSPLFT LDANADIGNG TTSANEAGIA ASITAKGESK LEVLNFDFQA NAQLSNPKIN 2830 2840 2850 2860 2870 2880 PLALKESVKF SSKYLRTEHG SEMLFFGNAI EGKSNTVASL HTEKNTLELS NGVIVKINNQ 2890 2900 2910 2920 2930 2940 LTLDSNTKYF HKLNIPKLDF SSQADLRNEI KTLLKAGHIA WTSSGKGSWK WACPRFSDEG 2950 2960 2970 2980 2990 3000 THESQISFTI EGPLTSFGLS NKINSKHLRV NQNLVYESGS LNFSKLEIQS QVDSQHVGHS 3010 3020 3030 3040 3050 3060 VLTAKGMALF GEGKAEFTGR HDAHLNGKVI GTLKNSLFFS AQPFEITAST NNEGNLKVRF 3070 3080 3090 3100 3110 3120 PLRLTGKIDF LNNYALFLSP SAQQASWQVS ARFNQYKYNQ NFSAGNNENI MEAHVGINGE 3130 3140 3150 3160 3170 3180 ANLDFLNIPL TIPEMRLPYT IITTPPLKDF SLWEKTGLKE FLKTTKQSFD LSVKAQYKKN 3190 3200 3210 3220 3230 3240 KHRHSITNPL AVLCEFISQS IKSFDRHFEK NRNNALDFVT KSYNETKIKF DKYKAEKSHD 3250 3260 3270 3280 3290 3300 ELPRTFQIPG YTVPVVNVEV SPFTIEMSAF GYVFPKAVSM PSFSILGSDV RVPSYTLILP 3310 3320 3330 3340 3350 3360 SLELPVLHVP RNLKLSLPHF KELCTISHIF IPAMGNITYD FSFKSSVITL NTNAELFNQS 3370 3380 3390 3400 3410 3420 DIVAHLLSSS SSVIDALQYK LEGTTRLTRK RGLKLATALS LSNKFVEGSH NSTVSLTTKN 3430 3440 3450 3460 3470 3480 MEVSVAKTTK AEIPILRMNF KQELNGNTKS KPTVSSSMEF KYDFNSSMLY STAKGAVDHK 3490 3500 3510 3520 3530 3540 LSLESLTSYF SIESSTKGDV KGSVLSREYS GTIASEANTY LNSKSTRSSV KLQGTSKIDD 3550 3560 3570 3580 3590 3600 IWNLEVKENF AGEATLQRIY SLWEHSTKNH LQLEGLFFTN GEHTSKATLE LSPWQMSALV 3610 3620 3630 3640 3650 3660 QVHASQPSSF HDFPDLGQEV ALNANTKNQK IRWKNEVRIH SGSFQSQVEL SNDQEKAHLD 3670 3680 3690 3700 3710 3720 IAGSLEGHLR FLKNIILPVY DKSLWDFLKL DVTTSIGRRQ HLRVSTAFVY TKNPNGYSFS 3730 3740 3750 3760 3770 3780 IPVKVLADKF ITPGLKLNDL NSVLVMPTFH VPFTDLQVPS CKLDFREIQI YKKLRTSSFA 3790 3800 3810 3820 3830 3840 LNLPTLPEVK FPEVDVLTKY SQPEDSLIPF FEITVPESQL TVSQFTLPKS VSDGIAALDL 3850 3860 3870 3880 3890 3900 NAVANKIADF ELPTIIVPEQ TIEIPSIKFS VPAGIVIPSF QALTARFEVD SPVYNATWSA 3910 3920 3930 3940 3950 3960 SLKNKADYVE TVLDSTCSST VQFLEYELNV LGTHKIEDGT LASKTKGTLA HRDFSAEYEE 3970 3980 3990 4000 4010 4020 DGKFEGLQEW EGKAHLNIKS PAFTDLHLRY QKDKKGISTS AASPAVGTVG MDMDEDDDFS 4030 4040 4050 4060 4070 4080 KWNFYYSPQS SPDKKLTIFK TELRVRESDE ETQIKVNWEE EAASGLLTSL KDNVPKATGV 4090 4100 4110 4120 4130 4140 LYDYVNKYHW EHTGLTLREV SSKLRRNLQN NAEWVYQGAI RQIDDIDVRF QKAASGTTGT 4150 4160 4170 4180 4190 4200 YQEWKDKAQN LYQELLTQEG QASFQGLKDN VFDGLVRVTQ KFHMKVKHLI DSLIDFLNFP 4210 4220 4230 4240 4250 4260 RFQFPGKPGI YTREELCTMF IREVGTVLSQ VYSKVHNGSE ILFSYFQDLV ITLPFELRKH 4270 4280 4290 4300 4310 4320 KLIDVISMYR ELLKDLSKEA QEVFKAIQSL KTTEVLRNLQ DLLQFIFQLI EDNIKQLKEM 4330 4340 4350 4360 4370 4380 KFTYLINYIQ DEINTIFNDY IPYVFKLLKE NLCLNLHKFN EFIQNELQEA SQELQQIHQY 4390 4400 4410 4420 4430 4440 IMALREEYFD PSIVGWTVKY YELEEKIVSL IKNLLVALKD FHSEYIVSAS NFTSQLSSQV 4450 4460 4470 4480 4490 4500 EQFLHRNIQE YLSILTDPDG KGKEKIAELS ATAQEIIKSQ AIATKKIISD YHQQFRYKLQ 4510 4520 4530 4540 4550 4560 DFSDQLSDYY EKFIAESKRL IDLSIQNYHT FLIYITELLK KLQSTTVMNP YMKLAPGELT IIL
[0078] The following domains have been identified in Apolipoprotein B-100:
TABLE-US-00025 Residues Length Domain ID 1-27 27 Signal peptide 28-4563 4536 Apolipoprotein B-100 28-2179 2152 Apolipoprotein B-48
[0079] As used herein, the term "Fibrinogen" refers to one or more polypeptides present in a biological sample that are derived from one or more Fibrinogen precursors. Fibrinogen is a heterohexamer containing 2 sets of 3 non-identical chains (alpha, beta and gamma). The sequences of the fibrinogen precursors are:
[0080] Alpha chain precursor (human precursor Swiss-Prot P02671 (SEQ ID NO: 17))
TABLE-US-00026 10 20 30 40 50 60 MFSMRIVCLV LSVVGTAWTA DSGEGDFLAE GGGVRGPRVV ERHQSACKDS DWPFCSDEDW 70 80 90 100 110 120 NYKCPSGCRM KGLIDEVNQD FTNRINKLKN SLFEYQKNNK DSHSLTTNIM EILRGDFSSA 130 140 150 160 170 180 NNRDNTYNRV SEDLRSRIEV LKRKVIEKVQ HIQLLQKNVR AQLVDMKRLE VDIDIKIRSC 190 200 210 220 230 240 RGSCSRALAR EVDLKDYEDQ QKQLEQVIAK DLLPSRDRQH LPLIKMKPVP DLVPGNFKSQ 250 260 270 280 290 300 LQKVPPEWKA LTDMPQMRME LERPGGNEIT RGGSTSYGTG SETESPRNPS SAGSWNSGSS 310 320 330 340 350 360 GPGSTGNRNP GSSGTGGTAT WKPGSSGPGS TGSWNSGSSG TGSTGNQNPG SPRPGSTGTW 370 380 390 400 410 420 NPGSSERGSA GHWTSESSVS GSTGQWHSES GSFRPDSPGS GNARPNNPDW GTFEEVSGNV 430 440 450 460 470 480 SPGTRREYHT EKLVTSKGDK ELRTGKEKVT SGSTTTTRRS CSKTVTKTVI GPDGHKEVTK 490 500 510 520 530 540 EVVTSEDGSD CPEAMDLGTL SGIGTLDGFR HRHPDEAAFF DTASTGKTFP GFFSPMLGEF 550 560 570 580 590 600 VSETESRGSE SGIFTNTKES SSHHPGIAEF PSRGKSSSYS KQFTSSTSYN RGDSTFESKS 610 620 630 640 650 660 YKMADEAGSE ADHEGTHSTK RGHAKSRPVR DCDDVLQTHP SGTQSGIFNI KLPGSSKIFS 670 680 690 700 710 720 VYCDQETSLG GWLLIQQRMD GSLNFNRTWQ DYKRGFGSLN DEGEGEFWLG NDYLHLLTQR 730 740 750 760 770 780 GSVLRVELED WAGNEAYAEY HFRVGSEAEG YALQVSSYEG TAGDALIEGS VEEGAEYTSH 790 800 810 820 830 840 NNMQFSTFDR DADQWEENCA EVYGGGWWYN NCQAANLNGI YYPGGSYDPR NNSPYEIENG 850 860 VVWVSFRGAD YSLRAVRMKI RPLVTQ
[0081] The following domains have been identified in Fibrinogen alpha chain:
TABLE-US-00027 Residues Length Domain ID 1-19 19 Signal peptide 20-35 16 Fibrinopeptide A 36-866 831 Fibrinogen alpha chain
[0082] Beta chain (human precursor Swiss-Prot P02675 (SEQ ID NO: 18))
TABLE-US-00028 10 20 30 40 50 60 MKRMVSWSFH KLKTMKHLLL LLLCVFLVKS QGVNDNEEGF FSARGHRPLD KKREEAPSLR 70 80 90 100 110 120 PAPPPISGGG YRARPAKAAA TQKKVERKAP DAGGCLHADP DLGVLCPTGC QLQEALLQQE 130 140 150 160 170 180 RPIRNSVDEL NNNVEAVSQT SSSSFQYMYL LKDLWQKRQK QVKDNENVVN EYSSELEKHQ 190 200 210 220 230 240 LYIDETVNSN IPTNLRVLRS ILENLRSKIQ KLESDVSAQM EYCRTPCTVS CNIPVVSGKE 250 260 270 280 290 300 CEEIIRKGGE TSEMYLIQPD SSVKPYRVYC DMNTENGGWT VIQNRQDGSV DFGRKWDPYK 310 320 330 340 350 360 QGFGNVATNT DGKNYCGLPG EYWLGNDKIS QLTRMGPTEL LIEMEDWKGD KVKAHYGGFT 370 380 390 400 410 420 VQNEANKYQI SVNKYRGTAG NALMDGASQL MGENRTMTIH NGMFFSTYDR DNDGWLTSDP 430 440 450 460 470 480 RKQCSKEDGG GWWYNRCHAA NPNGRYYWGG QYTWDMAKHG TDDGVVWMNW KGSWYSMRKM 490 SMKIRPFFPQ Q
[0083] The following domains have been identified in Fibrinogen beta chain:
TABLE-US-00029 Residues Length Domain ID 1-30 30 Signal peptide 31-44 14 Fibrinopeptide B 45-491 447 Fibrinogen beta chain
[0084] Gamma chain (human precursor Swiss-Prot P02679 (SEQ ID NO: 19))
TABLE-US-00030 10 20 30 40 50 60 MSWSLHPRNL ILYFYALLFL SSTCVAYVAT RDNCCILDER FGSYCPTTCG IADFLSTYQT 70 80 90 100 110 120 KVDKDLQSLE DILHQVENKT SEVKQLIKAI QLTYNPDESS KPNMIDAATL KSRKMLEEIM 130 140 150 160 170 180 KYEASILTHD SSIRYLQEIY NSNNQKIVNL KEKVAQLEAQ CQEPCKDTVQ IHDITGKDCQ 190 200 210 220 230 240 DIANKGAKQS GLYFIKPLKA NQQFLVYCEI DGSGNGWTVF QKRLDGSVDF KKNWIQYKEG 250 260 270 280 290 300 FGHLSPTGTT EFWLGNEKIH LISTQSAIPY ALRVELEDWN GRTSTADYAM FKVGPEADKY 310 320 330 340 350 360 RLTYAYFAGG DAGDAFDGFD FGDDPSDKFF TSHNGMQFST WDNDNDKFEG NCAEQDGSGW 370 380 390 400 410 420 WMNKCHAGHL NGVYYQGGTY SKASTPNGYD NGIIWATWKT RWYSMKKTTM KIIPFNRLTI 430 440 450 GEGQQHHLGG AKQVRPEHPA ETEYDSLYPE DDL
[0085] The following domains have been identified in Fibrinogen gamma chain:
TABLE-US-00031 Residues Length Domain ID 1-26 26 Signal peptide 27-453 831 Fibrinogen gamma chain
[0086] As used herein, the term "relating a signal to the presence or amount" of an analyte reflects the following understanding. Assay signals are typically related to the presence or amount of an analyte through the use of a standard curve calculated using known concentrations of the analyte of interest. As the term is used herein, an assay is "configured to detect" an analyte if an assay can generate a detectable signal indicative of the presence or amount of a physiologically relevant concentration of the analyte. Because an antibody epitope is on the order of 8 amino acids, an immunoassay configured to detect a marker of interest will also detect polypeptides related to the marker sequence, so long as those polypeptides contain the epitope(s) necessary to bind to the antibody or antibodies used in the assay. The term "related marker" as used herein with regard to a biomarker such as one of the kidney injury markers described herein refers to one or more fragments, variants, etc., of a particular marker or its biosynthetic parent that may be detected as a surrogate for the marker itself or as independent biomarkers. The term also refers to one or more polypeptides present in a biological sample that are derived from the biomarker precursor complexed to additional species, such as binding proteins, receptors, heparin, lipids, sugars, etc.
[0087] In this regard, the skilled artisan will understand that the signals obtained from an immunoassay are a direct result of complexes formed between one or more antibodies and the target biomolecule (i.e., the analyte) and polypeptides containing the necessary epitope(s) to which the antibodies bind. While such assays may detect the full length biomarker and the assay result be expressed as a concentration of a biomarker of interest, the signal from the assay is actually a result of all such "immunoreactive" polypeptides present in the sample. Expression of biomarkers may also be determined by means other than immunoassays, including protein measurements (such as dot blots, western blots, chromatographic methods, mass spectrometry, etc.) and nucleic acid measurements (mRNA quatitation). This list is not meant to be limiting.
[0088] The term "positive going" marker as that term is used herein refer to a marker that is determined to be elevated in subjects suffering from a disease or condition, relative to subjects not suffering from that disease or condition. The term "negative going" marker as that term is used herein refer to a marker that is determined to be reduced in subjects suffering from a disease or condition, relative to subjects not suffering from that disease or condition.
[0089] The term "subject" as used herein refers to a human or non-human organism. Thus, the methods and compositions described herein are applicable to both human and veterinary disease. Further, while a subject is preferably a living organism, the invention described herein may be used in post-mortem analysis as well. Preferred subjects are humans, and most preferably "patients," which as used herein refers to living humans that are receiving medical care for a disease or condition. This includes persons with no defined illness who are being investigated for signs of pathology.
[0090] Preferably, an analyte is measured in a sample. Such a sample may be obtained from a subject, or may be obtained from biological materials intended to be provided to the subject. For example, a sample may be obtained from a kidney being evaluated for possible transplantation into a subject, and an analyte measurement used to evaluate the kidney for preexisting damage. Preferred samples are body fluid samples.
[0091] The term "body fluid sample" as used herein refers to a sample of bodily fluid obtained for the purpose of diagnosis, prognosis, classification or evaluation of a subject of interest, such as a patient or transplant donor. In certain embodiments, such a sample may be obtained for the purpose of determining the outcome of an ongoing condition or the effect of a treatment regimen on a condition. Preferred body fluid samples include blood, serum, plasma, cerebrospinal fluid, urine, saliva, sputum, and pleural effusions. In addition, one of skill in the art would realize that certain body fluid samples would be more readily analyzed following a fractionation or purification procedure, for example, separation of whole blood into serum or plasma components.
[0092] The term "diagnosis" as used herein refers to methods by which the skilled artisan can estimate and/or determine the probability ("a likelihood") of whether or not a patient is suffering from a given disease or condition. In the case of the present invention, "diagnosis" includes using the results of an assay, most preferably an immunoassay, for a kidney injury marker of the present invention, optionally together with other clinical characteristics, to arrive at a diagnosis (that is, the occurrence or nonoccurrence) of an acute renal injury or ARF for the subject from which a sample was obtained and assayed. That such a diagnosis is "determined" is not meant to imply that the diagnosis is 100% accurate. Many biomarkers are indicative of multiple conditions. The skilled clinician does not use biomarker results in an informational vacuum, but rather test results are used together with other clinical indicia to arrive at a diagnosis. Thus, a measured biomarker level on one side of a predetermined diagnostic threshold indicates a greater likelihood of the occurrence of disease in the subject relative to a measured level on the other side of the predetermined diagnostic threshold.
[0093] Similarly, a prognostic risk signals a probability ("a likelihood") that a given course or outcome will occur. A level or a change in level of a prognostic indicator, which in turn is associated with an increased probability of morbidity (e.g., worsening renal function, future ARF, or death) is referred to as being "indicative of an increased likelihood" of an adverse outcome in a patient.
[0094] Marker Assays
[0095] In general, immunoassays involve contacting a sample containing or suspected of containing a biomarker of interest with at least one antibody that specifically binds to the biomarker. A signal is then generated indicative of the presence or amount of complexes formed by the binding of polypeptides in the sample to the antibody. The signal is then related to the presence or amount of the biomarker in the sample. Numerous methods and devices are well known to the skilled artisan for the detection and analysis of biomarkers. See, e.g., U.S. Pat. Nos. 6,143,576; 6,113,855; 6,019,944; 5,985,579; 5,947,124; 5,939,272; 5,922,615; 5,885,527; 5,851,776; 5,824,799; 5,679,526; 5,525,524; and 5,480,792, and The Immunoassay Handbook, David Wild, ed. Stockton Press, New York, 1994, each of which is hereby incorporated by reference in its entirety, including all tables, figures and claims.
[0096] The assay devices and methods known in the art can utilize labeled molecules in various sandwich, competitive, or non-competitive assay formats, to generate a signal that is related to the presence or amount of the biomarker of interest. Suitable assay formats also include chromatographic, mass spectrographic, and protein "blotting" methods. Additionally, certain methods and devices, such as biosensors and optical immunoassays, may be employed to determine the presence or amount of analytes without the need for a labeled molecule. See, e.g., U.S. Pat. Nos. 5,631,171; and 5,955,377, each of which is hereby incorporated by reference in its entirety, including all tables, figures and claims. One skilled in the art also recognizes that robotic instrumentation including but not limited to Beckman ACCESS®, Abbott AXSYM®, Roche ELECSYS®, Dade Behring STRATUS® systems are among the immunoassay analyzers that are capable of performing immunoassays. But any suitable immunoassay may be utilized, for example, enzyme-linked immunoassays (ELISA), radioimmunoassays (RIAs), competitive binding assays, and the like.
[0097] Antibodies or other polypeptides may be immobilized onto a variety of solid supports for use in assays. Solid phases that may be used to immobilize specific binding members include those developed and/or used as solid phases in solid phase binding assays. Examples of suitable solid phases include membrane filters, cellulose-based papers, beads (including polymeric, latex and paramagnetic particles), glass, silicon wafers, microparticles, nanoparticles, TentaGels, AgroGels, PEGA gels, SPOCC gels, and multiple-well plates. An assay strip could be prepared by coating the antibody or a plurality of antibodies in an array on solid support. This strip could then be dipped into the test sample and then processed quickly through washes and detection steps to generate a measurable signal, such as a colored spot. Antibodies or other polypeptides may be bound to specific zones of assay devices either by conjugating directly to an assay device surface, or by indirect binding. In an example of the later case, antibodies or other polypeptides may be immobilized on particles or other solid supports, and that solid support immobilized to the device surface.
[0098] Biological assays require methods for detection, and one of the most common methods for quantitation of results is to conjugate a detectable label to a protein or nucleic acid that has affinity for one of the components in the biological system being studied. Detectable labels may include molecules that are themselves detectable (e.g., fluorescent moieties, electrochemical labels, metal chelates, etc.) as well as molecules that may be indirectly detected by production of a detectable reaction product (e.g., enzymes such as horseradish peroxidase, alkaline phosphatase, etc.) or by a specific binding molecule which itself may be detectable (e.g., biotin, digoxigenin, maltose, oligohistidine, 2,4-dintrobenzene, phenylarsenate, ssDNA, dsDNA, etc.).
[0099] Preparation of solid phases and detectable label conjugates often comprise the use of chemical cross-linkers. Cross-linking reagents contain at least two reactive groups, and are divided generally into homofunctional cross-linkers (containing identical reactive groups) and heterofunctional cross-linkers (containing non-identical reactive groups). Homobifunctional cross-linkers that couple through amines, sulfhydryls or react non-specifically are available from many commercial sources. Maleimides, alkyl and aryl halides, alpha-haloacyls and pyridyl disulfides are thiol reactive groups. Maleimides, alkyl and aryl halides, and alpha-haloacyls react with sulfhydryls to form thiol ether bonds, while pyridyl disulfides react with sulfhydryls to produce mixed disulfides. The pyridyl disulfide product is cleavable. Imidoesters are also very useful for protein-protein cross-links. A variety of heterobifunctional cross-linkers, each combining different attributes for successful conjugation, are commercially available.
[0100] In certain aspects, the present invention provides kits for the analysis of the described kidney injury markers. The kit comprises reagents for the analysis of at least one test sample which comprise at least one antibody that a kidney injury marker. The kit can also include devices and instructions for performing one or more of the diagnostic and/or prognostic correlations described herein. Preferred kits will comprise an antibody pair for performing a sandwich assay, or a labeled species for performing a competitive assay, for the analyte. Preferably, an antibody pair comprises a first antibody conjugated to a solid phase and a second antibody conjugated to a detectable label, wherein each of the first and second antibodies that bind a kidney injury marker. Most preferably each of the antibodies are monoclonal antibodies. The instructions for use of the kit and performing the correlations can be in the form of labeling, which refers to any written or recorded material that is attached to, or otherwise accompanies a kit at any time during its manufacture, transport, sale or use. For example, the term labeling encompasses advertising leaflets and brochures, packaging materials, instructions, audio or video cassettes, computer discs, as well as writing imprinted directly on kits.
[0101] Antibodies
[0102] The term "antibody" as used herein refers to a peptide or polypeptide derived from, modeled after or substantially encoded by an immunoglobulin gene or immunoglobulin genes, or fragments thereof, capable of specifically binding an antigen or epitope. See, e.g. Fundamental Immunology, 3rd Edition, W.E. Paul, ed., Raven Press, N.Y. (1993); Wilson (1994; J. Immunol. Methods 175:267-273; Yarmush (1992) J. Biochem. Biophys. Methods 25:85-97. The term antibody includes antigen-binding portions, i.e., "antigen binding sites," (e.g., fragments, subsequences, complementarity determining regions (CDRs)) that retain capacity to bind antigen, including (i) a Fab fragment, a monovalent fragment consisting of the VL, VH, CL and CH1 domains; (ii) a F(ab')2 fragment, a bivalent fragment comprising two Fab fragments linked by a disulfide bridge at the hinge region; (iii) a Fd fragment consisting of the VH and CH1 domains; (iv) a Fv fragment consisting of the VL and VH domains of a single arm of an antibody, (v) a dAb fragment (Ward et al., (1989) Nature 341:544-546), which consists of a VH domain; and (vi) an isolated complementarity determining region (CDR). Single chain antibodies are also included by reference in the term "antibody."
[0103] Antibodies used in the immunoassays described herein preferably specifically bind to a kidney injury marker of the present invention. The term "specifically binds" is not intended to indicate that an antibody binds exclusively to its intended target since, as noted above, an antibody binds to any polypeptide displaying the epitope(s) to which the antibody binds. Rather, an antibody "specifically binds" if its affinity for its intended target is about 5-fold greater when compared to its affinity for a non-target molecule which does not display the appropriate epitope(s). Preferably the affinity of the antibody will be at least about 5 fold, preferably 10 fold, more preferably 25-fold, even more preferably 50-fold, and most preferably 100-fold or more, greater for a target molecule than its affinity for a non-target molecule. In preferred embodiments, Preferred antibodies bind with affinities of at least about 107 M-1, and preferably between about 108 M-1 to about 109 M-1, about 109 M-1 to about 1010 M-1, or about 1010 M-1 to about 1012 M-1.
[0104] Affinity is calculated as Kd=koff/kon (koff is the dissociation rate constant, Kon is the association rate constant and Kd is the equilibrium constant). Affinity can be determined at equilibrium by measuring the fraction bound (r) of labeled ligand at various concentrations (c). The data are graphed using the Scatchard equation: r/c=K(n-r): where r=moles of bound ligand/mole of receptor at equilibrium; c=free ligand concentration at equilibrium; K=equilibrium association constant; and n=number of ligand binding sites per receptor molecule. By graphical analysis, r/c is plotted on the Y-axis versus r on the X-axis, thus producing a Scatchard plot. Antibody affinity measurement by Scatchard analysis is well known in the art. See, e.g., van Erp et al., J. Immunoassay 12: 425-43, 1991; Nelson and Griswold, Comput. Methods Programs Biomed. 27: 65-8, 1988.
[0105] The term "epitope" refers to an antigenic determinant capable of specific binding to an antibody. Epitopes usually consist of chemically active surface groupings of molecules such as amino acids or sugar side chains and usually have specific three dimensional structural characteristics, as well as specific charge characteristics. Conformational and nonconformational epitopes are distinguished in that the binding to the former but not the latter is lost in the presence of denaturing solvents.
[0106] Numerous publications discuss the use of phage display technology to produce and screen libraries of polypeptides for binding to a selected analyte. See, e.g, Cwirla et al., Proc. Natl. Acad. Sci. USA 87, 6378-82, 1990; Devlin et al., Science 249, 404-6, 1990, Scott and Smith, Science 249, 386-88, 1990; and Ladner et al., U.S. Pat. No. 5,571,698. A basic concept of phage display methods is the establishment of a physical association between DNA encoding a polypeptide to be screened and the polypeptide. This physical association is provided by the phage particle, which displays a polypeptide as part of a capsid enclosing the phage genome which encodes the polypeptide. The establishment of a physical association between polypeptides and their genetic material allows simultaneous mass screening of very large numbers of phage bearing different polypeptides. Phage displaying a polypeptide with affinity to a target bind to the target and these phage are enriched by affinity screening to the target. The identity of polypeptides displayed from these phage can be determined from their respective genomes. Using these methods a polypeptide identified as having a binding affinity for a desired target can then be synthesized in bulk by conventional means. See, e.g., U.S. Pat. No. 6,057,098, which is hereby incorporated in its entirety, including all tables, figures, and claims.
[0107] The antibodies that are generated by these methods may then be selected by first screening for affinity and specificity with the purified polypeptide of interest and, if required, comparing the results to the affinity and specificity of the antibodies with polypeptides that are desired to be excluded from binding. The screening procedure can involve immobilization of the purified polypeptides in separate wells of microtiter plates. The solution containing a potential antibody or groups of antibodies is then placed into the respective microtiter wells and incubated for about 30 min to 2 h. The microtiter wells are then washed and a labeled secondary antibody (for example, an anti-mouse antibody conjugated to alkaline phosphatase if the raised antibodies are mouse antibodies) is added to the wells and incubated for about 30 min and then washed. Substrate is added to the wells and a color reaction will appear where antibody to the immobilized polypeptide(s) are present.
[0108] The antibodies so identified may then be further analyzed for affinity and specificity in the assay design selected. In the development of immunoassays for a target protein, the purified target protein acts as a standard with which to judge the sensitivity and specificity of the immunoassay using the antibodies that have been selected. Because the binding affinity of various antibodies may differ; certain antibody pairs (e.g., in sandwich assays) may interfere with one another sterically, etc., assay performance of an antibody may be a more important measure than absolute affinity and specificity of an antibody.
[0109] While the present application describes antibody-based binding assays in detail, alternatives to antibodies as binding species in assays are well known in the art. These include receptors for a particular target, aptamers, etc. Aptamers are oligonucleic acid or peptide molecules that bind to a specific target molecule. Aptamers are usually created by selecting them from a large random sequence pool, but natural aptamers also exist. High-affinity aptamers containing modified nucleotides conferring improved characteristics on the ligand, such as improved in vivo stability or improved delivery characteristics. Examples of such modifications include chemical substitutions at the ribose and/or phosphate and/or base positions, and may include amino acid side chain functionalities.
[0110] Assay Correlations
[0111] The term "correlating" as used herein in reference to the use of biomarkers refers to comparing the presence or amount of the biomarker(s) in a patient to its presence or amount in persons known to suffer from, or known to be at risk of, a given condition; or in persons known to be free of a given condition. Often, this takes the form of comparing an assay result in the form of a biomarker concentration to a predetermined threshold selected to be indicative of the occurrence or nonoccurrence of a disease or the likelihood of some future outcome.
[0112] Selecting a diagnostic threshold involves, among other things, consideration of the probability of disease, distribution of true and false diagnoses at different test thresholds, and estimates of the consequences of treatment (or a failure to treat) based on the diagnosis. For example, when considering administering a specific therapy which is highly efficacious and has a low level of risk, few tests are needed because clinicians can accept substantial diagnostic uncertainty. On the other hand, in situations where treatment options are less effective and more risky, clinicians often need a higher degree of diagnostic certainty. Thus, cost/benefit analysis is involved in selecting a diagnostic threshold.
[0113] Suitable thresholds may be determined in a variety of ways. For example, one recommended diagnostic threshold for the diagnosis of acute myocardial infarction using cardiac troponin is the 97.5th percentile of the concentration seen in a normal population. Another method may be to look at serial samples from the same patient, where a prior "baseline" result is used to monitor for temporal changes in a biomarker level.
[0114] Population studies may also be used to select a decision threshold. Reciever Operating Characteristic ("ROC") arose from the field of signal detection theory developed during World War II for the analysis of radar images, and ROC analysis is often used to select a threshold able to best distinguish a "diseased" subpopulation from a "nondiseased" subpopulation. A false positive in this case occurs when the person tests positive, but actually does not have the disease. A false negative, on the other hand, occurs when the person tests negative, suggesting they are healthy, when they actually do have the disease. To draw a ROC curve, the true positive rate (TPR) and false positive rate (FPR) are determined as the decision threshold is varied continuously. Since TPR is equivalent with sensitivity and FPR is equal to 1-specificity, the ROC graph is sometimes called the sensitivity vs (1-specificity) plot. A perfect test will have an area under the ROC curve of 1.0; a random test will have an area of 0.5. A threshold is selected to provide an acceptable level of specificity and sensitivity.
[0115] In this context, "diseased" is meant to refer to a population having one characteristic (the presence of a disease or condition or the occurrence of some outcome) and "nondiseased" is meant to refer to a population lacking the characteristic. While a single decision threshold is the simplest application of such a method, multiple decision thresholds may be used. For example, below a first threshold, the absence of disease may be assigned with relatively high confidence, and above a second threshold the presence of disease may also be assigned with relatively high confidence. Between the two thresholds may be considered indeterminate. This is meant to be exemplary in nature only.
[0116] In addition to threshold comparisons, other methods for correlating assay results to a patient classification (occurrence or nonoccurrence of disease, likelihood of an outcome, etc.) include decision trees, rule sets, Bayesian methods, and neural network methods. These methods can produce probability values representing the degree to which a subject belongs to one classification out of a plurality of classifications.
[0117] Measures of test accuracy may be obtained as described in Fischer et al., Intensive Care Med. 29: 1043-51, 2003, and used to determine the effectiveness of a given biomarker. These measures include sensitivity and specificity, predictive values, likelihood ratios, diagnostic odds ratios, and ROC curve areas. The area under the curve ("AUC") of a ROC plot is equal to the probability that a classifier will rank a randomly chosen positive instance higher than a randomly chosen negative one. The area under the ROC curve may be thought of as equivalent to the Mann-Whitney U test, which tests for the median difference between scores obtained in the two groups considered if the groups are of continuous data, or to the Wilcoxon test of ranks.
[0118] As discussed above, suitable tests may exhibit one or more of the following results on these various measures: a specificity of greater than 0.5, preferably at least 0.6, more preferably at least 0.7, still more preferably at least 0.8, even more preferably at least 0.9 and most preferably at least 0.95, with a corresponding sensitivity greater than 0.2, preferably greater than 0.3, more preferably greater than 0.4, still more preferably at least 0.5, even more preferably 0.6, yet more preferably greater than 0.7, still more preferably greater than 0.8, more preferably greater than 0.9, and most preferably greater than 0.95; a sensitivity of greater than 0.5, preferably at least 0.6, more preferably at least 0.7, still more preferably at least 0.8, even more preferably at least 0.9 and most preferably at least 0.95, with a corresponding specificity greater than 0.2, preferably greater than 0.3, more preferably greater than 0.4, still more preferably at least 0.5, even more preferably 0.6, yet more preferably greater than 0.7, still more preferably greater than 0.8, more preferably greater than 0.9, and most preferably greater than 0.95; at least 75% sensitivity, combined with at least 75% specificity; a ROC curve area of greater than 0.5, preferably at least 0.6, more preferably 0.7, still more preferably at least 0.8, even more preferably at least 0.9, and most preferably at least 0.95; an odds ratio different from 1, preferably at least about 2 or more or about 0.5 or less, more preferably at least about 3 or more or about 0.33 or less, still more preferably at least about 4 or more or about 0.25 or less, even more preferably at least about 5 or more or about 0.2 or less, and most preferably at least about 10 or more or about 0.1 or less; a positive likelihood ratio (calculated as sensitivity/(1-specificity)) of greater than 1, at least 2, more preferably at least 3, still more preferably at least 5, and most preferably at least 10; and or a negative likelihood ratio (calculated as (1-sensitivity)/specificity) of less than 1, less than or equal to 0.5, more preferably less than or equal to 0.3, and most preferably less than or equal to 0.1
[0119] Additional clinical indicia may be combined with the kidney injury marker assay result(s) of the present invention. These include other biomarkers related to renal status. Examples include the following, which recite the common biomarker name, followed by the Swiss-Prot entry number for that biomarker or its parent: Actin (P68133); Adenosine deaminase binding protein (DPP4, P27487); Alpha-1-acid glycoprotein 1 (P02763); Alpha-1-microglobulin (P02760); Albumin (P02768); Angiotensinogenase (Renin, P00797); Annexin A2 (P07355); Beta-glucuronidase (P08236); B-2-microglobulin (P61679); Beta-galactosidase (P16278); BMP-7 (P18075); Brain natriuretic peptide (proBNP, BNP-32, NTproBNP; P16860); Calcium-binding protein Beta (S100-beta, P04271); Carbonic anhydrase (Q16790); Casein Kinase 2 (P68400); Ceruloplasmin (P00450); Clusterin (P10909); Complement C3 (P01024); Cysteine-rich protein (CYR61, O00622); Cytochrome C (P99999); Epidermal growth factor (EGF, P01133); Endothelin-1 (P05305); Exosomal Fetuin-A (P02765); Fatty acid-binding protein, heart (FABP3, P05413); Fatty acid-binding protein, liver (P07148); Ferritin (light chain, P02793; heavy chain P02794); Fructose-1,6-biphosphatase (P09467); GRO-alpha (CXCL1, (P09341); Growth Hormone (P01241); Hepatocyte growth factor (P14210); Insulin-like growth factor I (P01343); Immunoglobulin G; Immunoglobulin Light Chains (Kappa and Lambda); Interferon gamma (P01308); Lysozyme (P61626); Interleukin-1alpha (P01583); Interleukin-2 (P60568); Interleukin-4 (P60568); Interleukin-9 (P15248); Interleukin-12p40 (P29460); Interleukin-13 (P35225); Interleukin-16 (Q14005); L1 cell adhesion molecule (P32004); Lactate dehydrogenase (P00338); Leucine Aminopeptidase (P28838); Meprin A-alpha subunit (Q16819); Meprin A-beta subunit (Q16820); Midkine (P21741); MIP2-alpha (CXCL2, P19875); MMP-2 (P08253); MMP-9 (P14780); Netrin-1 (O95631); Neutral endopeptidase (P08473); Osteopontin (P10451); Renal papillary antigen 1 (RPA1); Renal papillary antigen 2 (RPA2); Retinol binding protein (P09455); Ribonuclease; S100 calcium-binding protein A6 (P06703); Serum Amyloid P Component (P02743); Sodium/Hydrogen exchanger isoform (NHE3, P48764); Spermidine/spermine N1-acetyltransferase (P21673); TGF-Beta1 (P01137); Transferrin (P02787); Trefoil factor 3 (TFF3, Q07654); Toll-Like protein 4 (O00206); Total protein; Tubulointerstitial nephritis antigen (Q9UJW2); Uromodulin (Tamm-Horsfall protein, P07911).
[0120] For purposes of risk stratification, Adiponectin (Q15848); Alkaline phosphatase (P05186); Aminopeptidase N (P15144); CalbindinD28k (P05937); Cystatin C (P01034); 8 subunit of FIFO ATPase (P03928); Gamma-glutamyltransferase (P19440); GSTa (alpha-glutathione-S-transferase, P08263); GSTpi (Glutathione-S-transferase P; GST class-pi; P09211); IGFBP-1 (P08833); IGFBP-2 (P18065); IGFBP-6 (P24592); Integral membrane protein 1 (Itm1, P46977); Interleukin-6 (P05231); Interleukin-8 (P10145); Interleukin-18 (Q14116); IP-10 (10 kDa interferon-gamma-induced protein, P02778); IRPR (IFRD1, O00458); Isovaleryl-CoA dehydrogenase (IVD, P26440); I-TAC/CXCL11 (O14625); Keratin 19 (P08727); Kim-1 (Hepatitis A virus cellular receptor 1, O43656); L-arginine:glycine amidinotransferase (P50440); Leptin (P41159); Lipocalin2 (NGAL, P80188); MCP-1 (P13500); MIG (Gamma-interferon-induced monokine Q07325); MIP-1a (P10147); MIP-3a (P78556); MIP-1beta (P13236); MIP-1d (Q16663); NAG (N-acetyl-beta-D-glucosaminidase, P54802); Organic ion transporter (OCT2, O15244); Osteoprotegerin (O14788); P8 protein (O60356); Plasminogen activator inhibitor 1 (PAI-1, P05121); ProANP (1-98) (P01160); Protein phosphatase 1-beta (PPI-beta, P62140); Rab GDI-beta (P50395); Renal kallikrein (Q86U61); RT1.B-1 (alpha) chain of the integral membrane protein (Q5Y7A8); Soluble tumor necrosis factor receptor superfamily member 1A (sTNFR-I, P19438); Soluble tumor necrosis factor receptor superfamily member 1B (sTNFR-II, P20333); Tissue inhibitor of metalloproteinases 3 (TIMP-3, P35625); uPAR (Q03405) may be combined with the kidney injury marker assay result(s) of the present invention.
[0121] Other clinical indicia which may be combined with the kidney injury marker assay result(s) of the present invention includes demographic information (e.g., weight, sex, age, race), medical history (e.g., family history, type of surgery, pre-existing disease such as aneurism, congestive heart failure, preeclampsia, eclampsia, diabetes mellitus, hypertension, coronary artery disease, proteinuria, renal insufficiency, or sepsis, type of toxin exposure such as NSAIDs, cyclosporines, tacrolimus, aminoglycosides, foscarnet, ethylene glycol, hemoglobin, myoglobin, ifosfamide, heavy metals, methotrexate, radiopaque contrast agents, or streptozotocin), clinical variables (e.g., blood pressure, temperature, respiration rate), risk scores (APACHE score, PREDICT score, TIMI Risk Score for UA/NSTEMI, Framingham Risk Score), a urine total protein measurement, a glomerular filtration rate, an estimated glomerular filtration rate, a urine production rate, a serum or plasma creatinine concentration, a renal papillary antigen 1 (RPA1) measurement; a renal papillary antigen 2 (RPA2) measurement; a urine creatinine concentration, a fractional excretion of sodium, a urine sodium concentration, a urine creatinine to serum or plasma creatinine ratio, a urine specific gravity, a urine osmolality, a urine urea nitrogen to plasma urea nitrogen ratio, a plasma BUN to creatnine ratio, and/or a renal failure index calculated as urine sodium/(urine creatinine/plasma creatinine). Other measures of renal function which may be combined with the kidney injury marker assay result(s) are described hereinafter and in Harrison's Principles of Internal Medicine, 17th Ed., McGraw Hill, New York, pages 1741-1830, and Current Medical Diagnosis & Treatment 2008, 47th Ed, McGraw Hill, New York, pages 785-815, each of which are hereby incorporated by reference in their entirety.
[0122] Combining assay results/clinical indicia in this manner can comprise the use of multivariate logistical regression, loglinear modeling, neural network analysis, n-of-m analysis, decision tree analysis, etc. This list is not meant to be limiting.
[0123] Diagnosis of Acute Renal Failure
[0124] As noted above, the terms "acute renal (or kidney) injury" and "acute renal (or kidney) failure" as used herein are defined in part in terms of changes in serum creatinine from a baseline value. Most definitions of ARF have common elements, including the use of serum creatinine and, often, urine output. Patients may present with renal dysfunction without an available baseline measure of renal function for use in this comparison. In such an event, one may estimate a baseline serum creatinine value by assuming the patient initially had a normal GFR. Glomerular filtration rate (GFR) is the volume of fluid filtered from the renal (kidney) glomerular capillaries into the Bowman's capsule per unit time. Glomerular filtration rate (GFR) can be calculated by measuring any chemical that has a steady level in the blood, and is freely filtered but neither reabsorbed nor secreted by the kidneys. GFR is typically expressed in units of ml/min:
G F R = Urine Concentration × Urine Flow Plasma Concentration ##EQU00001##
[0125] By normalizing the GFR to the body surface area, a GFR of approximately 75-100 ml/min per 1.73 m2 can be assumed. The rate therefore measured is the quantity of the substance in the urine that originated from a calculable volume of blood.
[0126] There are several different techniques used to calculate or estimate the glomerular filtration rate (GFR or eGFR). In clinical practice, however, creatinine clearance is used to measure GFR. Creatinine is produced naturally by the body (creatinine is a metabolite of creatine, which is found in muscle). It is freely filtered by the glomerulus, but also actively secreted by the renal tubules in very small amounts such that creatinine clearance overestimates actual GFR by 10-20%. This margin of error is acceptable considering the ease with which creatinine clearance is measured.
[0127] Creatinine clearance (CCr) can be calculated if values for creatinine's urine concentration (UCr), urine flow rate (V), and creatinine's plasma concentration (PCr) are known. Since the product of urine concentration and urine flow rate yields creatinine's excretion rate, creatinine clearance is also said to be its excretion rate (UCr×V) divided by its plasma concentration. This is commonly represented mathematically as:
C Cr = U Cr × V P Cr ##EQU00002##
[0128] Commonly a 24 hour urine collection is undertaken, from empty-bladder one morning to the contents of the bladder the following morning, with a comparative blood test then taken:
C Cr = U Cr × 24 - hour volume P Cr × 24 × 60 mins ##EQU00003##
[0129] To allow comparison of results between people of different sizes, the CCr is often corrected for the body surface area (BSA) and expressed compared to the average sized man as ml/min/1.73 m2. While most adults have a BSA that approaches 1.7 (1.6-1.9), extremely obese or slim patients should have their CCr corrected for their actual BSA:
C Cr - corrected = C Cr × 1.73 B S A ##EQU00004##
[0130] The accuracy of a creatinine clearance measurement (even when collection is complete) is limited because as glomerular filtration rate (GFR) falls creatinine secretion is increased, and thus the rise in serum creatinine is less. Thus, creatinine excretion is much greater than the filtered load, resulting in a potentially large overestimation of the GFR (as much as a twofold difference). However, for clinical purposes it is important to determine whether renal function is stable or getting worse or better. This is often determined by monitoring serum creatinine alone. Like creatinine clearance, the serum creatinine will not be an accurate reflection of GFR in the non-steady-state condition of ARF. Nonetheless, the degree to which serum creatinine changes from baseline will reflect the change in GFR. Serum creatinine is readily and easily measured and it is specific for renal function.
[0131] For purposes of determining urine output on a Urine output on a mL/kg/hr basis, hourly urine collection and measurement is adequate. In the case where, for example, only a cumulative 24-h output was available and no patient weights are provided, minor modifications of the RIFLE urine output criteria have been described. For example, Bagshaw et al., Nephrol. Dial. Transplant. 23: 1203-1210, 2008, assumes an average patient weight of 70 kg, and patients are assigned a RIFLE classification based on the following: <35 mL/h (Risk), <21 mL/h (Injury) or <4 mL/h (Failure).
[0132] Selecting a Treatment Regimen
[0133] Once a diagnosis is obtained, the clinician can readily select a treatment regimen that is compatible with the diagnosis, such as initiating renal replacement therapy, withdrawing delivery of compounds that are known to be damaging to the kidney, kidney transplantation, delaying or avoiding procedures that are known to be damaging to the kidney, modifying diuretic administration, initiating goal directed therapy, etc. The skilled artisan is aware of appropriate treatments for numerous diseases discussed in relation to the methods of diagnosis described herein. See, e.g., Merck Manual of Diagnosis and Therapy, 17th Ed. Merck Research Laboratories, Whitehouse Station, N.J., 1999. In addition, since the methods and compositions described herein provide prognostic information, the markers of the present invention may be used to monitor a course of treatment. For example, improved or worsened prognostic state may indicate that a particular treatment is or is not efficacious.
[0134] One skilled in the art readily appreciates that the present invention is well adapted to carry out the objects and obtain the ends and advantages mentioned, as well as those inherent therein. The examples provided herein are representative of preferred embodiments, are exemplary, and are not intended as limitations on the scope of the invention.
Example 1
Contrast-Induced Nephropathy Sample Collection
[0135] The objective of this sample collection study is to collect samples of plasma and urine and clinical data from patients before and after receiving intravascular contrast media. Approximately 250 adults undergoing radiographic/angiographic procedures involving intravascular administration of iodinated contrast media are enrolled. To be enrolled in the study, each patient must meet all of the following inclusion criteria and none of the following exclusion criteria:
Inclusion Criteria
[0136] males and females 18 years of age or older; undergoing a radiographic/angiographic procedure (such as a CT scan or coronary intervention) involving the intravascular administration of contrast media; expected to be hospitalized for at least 48 hours after contrast administration. able and willing to provide written informed consent for study participation and to comply with all study procedures.
Exclusion Criteria
[0137] renal transplant recipients; acutely worsening renal function prior to the contrast procedure; already receiving dialysis (either acute or chronic) or in imminent need of dialysis at enrollment; expected to undergo a major surgical procedure (such as involving cardiopulmonary bypass) or an additional imaging procedure with contrast media with significant risk for further renal insult within the 48 hrs following contrast administration; participation in an interventional clinical study with an experimental therapy within the previous 30 days; known infection with human immunodeficiency virus (HIV) or a hepatitis virus.
[0138] Immediately prior to the first contrast administration (and after any pre-procedure hydration), an EDTA anti-coagulated blood sample (10 mL) and a urine sample (10 mL) are collected from each patient. Blood and urine samples are then collected at 4 (±0.5), 8 (±1), 24 (±2) 48 (±2), and 72 (±2) hrs following the last administration of contrast media during the index contrast procedure. Blood is collected via direct venipuncture or via other available venous access, such as an existing femoral sheath, central venous line, peripheral intravenous line or hep-lock. These study blood samples are processed to plasma at the clinical site, frozen and shipped to Astute Medical, Inc., San Diego, Calif. The study urine samples are frozen and shipped to Astute Medical, Inc.
[0139] Serum creatinine is assessed at the site immediately prior to the first contrast administration (after any pre-procedure hydration) and at 4 (±0.5), 8 (±1), 24 (±2) and 48 (±2)), and 72 (±2) hours following the last administration of contrast (ideally at the same time as the study samples are obtained). In addition, each patient's status is evaluated through day 30 with regard to additional serum and urine creatinine measurements, a need for dialysis, hospitalization status, and adverse clinical outcomes (including mortality).
[0140] Prior to contrast administration, each patient is assigned a risk based on the following assessment: systolic blood pressure <80 mm Hg=5 points; intra-arterial balloon pump=5 points; congestive heart failure (Class III-IV or history of pulmonary edema)=5 points; age >75 yrs=4 points; hematocrit level <39% for men, <35% for women=3 points; diabetes=3 points; contrast media volume=1 point for each 100 mL; serum creatinine level >1.5 g/dL=4 points OR estimated GFR 40-60 mL/min/1.73 m2=2 points, 20-40 mL/min/1.73 m2=4 points, <20 mL/min/1.73 m2=6 points. The risks assigned are as follows: risk for CIN and dialysis: 5 or less total points=risk of CIN--7.5%, risk of dialysis--0.04%; 6-10 total points=risk of CIN--14%, risk of dialysis--0.12%; 11-16 total points=risk of CIN--26.1%, risk of dialysis--1.09%; >16 total points=risk of CIN--57.3%, risk of dialysis--12.8%.
Example 2
Cardiac Surgery Sample Collection
[0141] The objective of this sample collection study is to collect samples of plasma and urine and clinical data from patients before and after undergoing cardiovascular surgery, a procedure known to be potentially damaging to kidney function. Approximately 900 adults undergoing such surgery are enrolled. To be enrolled in the study, each patient must meet all of the following inclusion criteria and none of the following exclusion criteria:
Inclusion Criteria
[0142] males and females 18 years of age or older; undergoing cardiovascular surgery; Toronto/Ottawa Predictive Risk Index for Renal Replacement risk score of at least 2 (Wijeysundera et al., JAMA 297: 1801-9, 2007); and able and willing to provide written informed consent for study participation and to comply with all study procedures.
Exclusion Criteria
[0143] known pregnancy; previous renal transplantation; acutely worsening renal function prior to enrollment (e.g., any category of RIFLE criteria); already receiving dialysis (either acute or chronic) or in imminent need of dialysis at enrollment; currently enrolled in another clinical study or expected to be enrolled in another clinical study within 7 days of cardiac surgery that involves drug infusion or a therapeutic intervention for AKI; known infection with human immunodeficiency virus (HIV) or a hepatitis virus.
[0144] Within 3 hours prior to the first incision (and after any pre-procedure hydration), an EDTA anti-coagulated blood sample (10 mL), whole blood (3 mL), and a urine sample (35 mL) are collected from each patient. Blood and urine samples are then collected at 3 (±0.5), 6 (±0.5), 12 (±1), 24 (±2) and 48 (±2) hrs following the procedure and then daily on days 3 through 7 if the subject remains in the hospital. Blood is collected via direct venipuncture or via other available venous access, such as an existing femoral sheath, central venous line, peripheral intravenous line or hep-lock. These study blood samples are frozen and shipped to Astute Medical, Inc., San Diego, Calif. The study urine samples are frozen and shipped to Astute Medical, Inc.
Example 3
Acutely Ill Subject Sample Collection
[0145] The objective of this study is to collect samples from acutely ill patients. Approximately 900 adults expected to be in the ICU for at least 48 hours will be enrolled. To be enrolled in the study, each patient must meet all of the following inclusion criteria and none of the following exclusion criteria:
Inclusion Criteria
[0146] males and females 18 years of age or older; Study population 1: approximately 300 patients that have at least one of: shock (SBP <90 mmHg and/or need for vasopressor support to maintain MAP >60 mmHg and/or documented drop in SBP of at least 40 mmHg); and sepsis; Study population 2: approximately 300 patients that have at least one of: IV antibiotics ordered in computerized physician order entry (CPOE) within 24 hours of enrollment; contrast media exposure within 24 hours of enrollment; increased Intra-Abdominal Pressure with acute decompensated heart failure; and severe trauma as the primary reason for ICU admission and likely to be hospitalized in the ICU for 48 hours after enrollment; Study population 3: approximately 300 patients expected to be hospitalized through acute care setting (ICU or ED) with a known risk factor for acute renal injury (e.g. sepsis, hypotension/shock (Shock=systolic BP<90 mmHg and/or the need for vasopressor support to maintain a MAP >60 mmHg and/or a documented drop in SBP >40 mmHg), major trauma, hemorrhage, or major surgery); and/or expected to be hospitalized to the ICU for at least 24 hours after enrollment.
Exclusion Criteria
[0147] known pregnancy; institutionalized individuals; previous renal transplantation; known acutely worsening renal function prior to enrollment (e.g., any category of RIFLE criteria); received dialysis (either acute or chronic) within 5 days prior to enrollment or in imminent need of dialysis at the time of enrollment; known infection with human immunodeficiency virus (HIV) or a hepatitis virus; meets only the SBP <90 mmHg inclusion criterion set forth above, and does not have shock in the attending physician's or principal investigator's opinion.
[0148] After providing informed consent, an EDTA anti-coagulated blood sample (10 mL) and a urine sample (25-30 mL) are collected from each patient. Blood and urine samples are then collected at 4 (±0.5) and 8 (±1) hours after contrast administration (if applicable); at 12 (±1), 24 (±2), and 48 (±2) hours after enrollment, and thereafter daily up to day 7 to day 14 while the subject is hospitalized. Blood is collected via direct venipuncture or via other available venous access, such as an existing femoral sheath, central venous line, peripheral intravenous line or hep-lock. These study blood samples are processed to plasma at the clinical site, frozen and shipped to Astute Medical, Inc., San Diego, Calif. The study urine samples are frozen and shipped to Astute Medical, Inc.
Example 4
Immunoassay Format
[0149] Analytes are measured using standard sandwich enzyme immunoassay techniques. A first antibody which binds the analyte is immobilized in wells of a 96 well polystyrene microplate. Analyte standards and test samples are pipetted into the appropriate wells and any analyte present is bound by the immobilized antibody. After washing away any unbound substances, a horseradish peroxidase-conjugated second antibody which binds the analyte is added to the wells, thereby forming sandwich complexes with the analyte (if present) and the first antibody. Following a wash to remove any unbound antibody-enzyme reagent, a substrate solution comprising tetramethylbenzidine and hydrogen peroxide is added to the wells. Color develops in proportion to the amount of analyte present in the sample. The color development is stopped and the intensity of the color is measured at 540 nm or 570 nm. An analyte concentration is assigned to the test sample by comparison to a standard curve determined from the analyte standards. Concentrations reported below are as follows: Interleukin-5--ng/mL, Interleukin-6 receptor subunit beta--pg/mL, Tissue factor--ng/mL, Sex hormone-binding globulin--nmol/L, Alpha-2-macroglobulin--ng/mL, Apolipoprotein A-I--ng/mL, Calcitonin--pg/mL, Thrombopoietin--pg/mL, C-reactive protein--ng/mL, Intercellular adhesion molecule 3--ng/mL, Macrophage metalloelastase--pg/mL, Apolipoprotein B-100--ng/mL, and Fibrinogen--ng/mL.
Example 5
Apparently Healthy Donor and Chronic Disease Patient Samples
[0150] Human urine samples from donors with no known chronic or acute disease ("Apparently Healthy Donors") were purchased from two vendors (Golden West Biologicals, Inc., 27625 Commerce Center Dr., Temecula, Calif. 92590 and Virginia Medical Research, Inc., 915 First Colonial Rd., Virginia Beach, Va. 23454). The urine samples were shipped and stored frozen at less than -20° C. The vendors supplied demographic information for the individual donors including gender, race (Black/White), smoking status and age.
[0151] Human urine samples from donors with various chronic diseases ("Chronic Disease Patients") including congestive heart failure, coronary artery disease, chronic kidney disease, chronic obstructive pulmonary disease, diabetes mellitus and hypertension were purchased from Virginia Medical Research, Inc., 915 First Colonial Rd., Virginia Beach, Va. 23454. The urine samples were shipped and stored frozen at less than -20 degrees centigrade. The vendor provided a case report form for each individual donor with age, gender, race (Black/White), smoking status and alcohol use, height, weight, chronic disease(s) diagnosis, current medications and previous surgeries.
Example 6
Use of Kidney Injury Markers for Evaluating Renal Status in Patients
[0152] Patients from the intensive care unit (ICU) were enrolled in the following study. Each patient was classified by kidney status as non-injury (0), risk of injury (R), injury (I), and failure (F) according to the maximum stage reached within 7 days of enrollment as determined by the RIFLE criteria. EDTA anti-coagulated blood samples (10 mL) and a urine samples (25-30 mL) were collected from each patient at enrollment, 4 (±0.5) and 8 (±1) hours after contrast administration (if applicable); at 12 (±1), 24 (±2), and 48 (±2) hours after enrollment, and thereafter daily up to day 7 to day 14 while the subject is hospitalized. Markers were each measured by standard immunoassay methods using commercially available assay reagents in the urine samples and the plasma component of the blood samples collected.
[0153] Two cohorts were defined to represent a "diseased" and a "normal" population. While these terms are used for convenience, "diseased" and "normal" simply represent two cohorts for comparison (say RIFLE 0 vs RIFLE R, I and F; RIFLE 0 vs RIFLE R; RIFLE 0 and R vs RIFLE I and F; etc.). The time "prior max stage" represents the time at which a sample is collected, relative to the time a particular patient reaches the lowest disease stage as defined for that cohort, binned into three groups which are +/-12 hours. For example, "24 hr prior" which uses 0 vs R, I, F as the two cohorts would mean 24 hr (+/-12 hours) prior to reaching stage R (or I if no sample at R, or F if no sample at R or I).
[0154] A receiver operating characteristic (ROC) curve was generated for each biomarker measured and the area under each ROC curve (AUC) is determined. Patients in Cohort 2 were also separated according to the reason for adjudication to cohort 2 as being based on serum creatinine measurements (sCr), being based on urine output (UO), or being based on either serum creatinine measurements or urine output. Using the same example discussed above (0 vs R, I, F), for those patients adjudicated to stage R, I, or F on the basis of serum creatinine measurements alone, the stage 0 cohort may include patients adjudicated to stage R, I, or F on the basis of urine output; for those patients adjudicated to stage R, I, or F on the basis of urine output alone, the stage 0 cohort may include patients adjudicated to stage R, I, or F on the basis of serum creatinine measurements; and for those patients adjudicated to stage R, I, or F on the basis of serum creatinine measurements or urine output, the stage 0 cohort contains only patients in stage 0 for both serum creatinine measurements and urine output. Also, in the data for patients adjudicated on the basis of serum creatinine measurements or urine output, the adjudication method which yielded the most severe RIFLE stage is used.
[0155] The ability to distinguish cohort 1 from Cohort 2 was determined using ROC analysis. SE is the standard error of the AUC, n is the number of sample or individual patients ("pts," as indicated). Standard errors are calculated as described in Hanley, J. A., and McNeil, B. J., The meaning and use of the area under a receiver operating characteristic (ROC) curve. Radiology (1982) 143: 29-36; p values are calculated with a two-tailed Z-test. An AUC <0.5 is indicative of a negative going marker for the comparison, and an AUC >0.5 is indicative of a positive going marker for the comparison.
[0156] Various threshold (or "cutoff") concentrations were selected, and the associated sensitivity and specificity for distinguishing cohort 1 from cohort 2 are determined. OR is the odds ratio calculated for the particular cutoff concentration, and 95% CI is the confidence interval for the odds ratio.
[0157] FIG. 1: Comparison of marker levels in urine samples collected from Cohort 1 (patients that did not progress beyond RIFLE stage 0) and in urine samples collected from subjects at 0, 24 hours, and 48 hours prior to reaching stage R, I or F in Cohort 2.
TABLE-US-00032 Alpha-2 macroglobulin 0 hr prior to AKI stage 24 hr prior to AKI stage 48 hr prior to AKI stage Cohort 1 Cohort 2 Cohort 1 Cohort 2 Cohort 1 Cohort 2 sCr or UO Median 0.288 0.357 0.288 0.548 0.288 0.442 Average 4.38 2.76 4.38 8.09 4.38 6.42 Stdev 33.2 13.4 33.2 42.5 33.2 34.5 p(t-test) 0.68 0.37 0.71 Min 1.00E-9 1.00E-9 1.00E-9 1.00E-9 1.00E-9 1.00E-9 Max 510 115 510 368 510 224 n (Samp) 356 75 356 90 356 42 n (Patient) 189 75 189 90 189 42 sCr only Median 0.341 0.384 0.341 0.683 0.341 0.626 Average 3.67 5.29 3.67 7.91 3.67 10.5 Stdev 27.3 21.5 27.3 28.4 27.3 46.6 p(t-test) 0.76 0.36 0.25 Min 1.00E-9 0.0568 1.00E-9 1.00E-9 1.00E-9 1.00E-9 Max 510 115 510 133 510 224 n (Samp) 751 28 751 37 751 23 n (Patient) 296 28 296 37 296 23 UO only Median 0.322 0.466 0.322 0.649 0.322 0.626 Average 3.19 3.23 3.19 9.44 3.19 1.36 Stdev 20.7 14.4 20.7 45.9 20.7 2.71 p(t-test) 0.99 0.075 0.60 Min 1.00E-9 1.00E-9 1.00E-9 1.00E-9 1.00E-9 1.00E-9 Max 235 115 235 368 235 15.6 n (Samp) 314 65 314 77 314 35 n (Patient) 135 65 135 77 135 35 0 hr prior to AKI stage 24 hr prior to AKI stage 48 hr prior to AKI stage sCr or UO sCr only UO only sCr or UO sCr only UO only sCr or UO sCr only UO only AUC 0.57 0.55 0.60 0.60 0.61 0.62 0.56 0.58 0.58 SE 0.037 0.057 0.040 0.035 0.050 0.037 0.048 0.063 0.053 p 0.073 0.40 0.0095 0.0031 0.023 0.0014 0.19 0.20 0.13 nCohort 1 356 751 314 356 751 314 356 751 314 nCohort 2 75 28 65 90 37 77 42 23 35 Cutoff 1 0.203 0.187 0.213 0.243 0.280 0.262 0.229 0.312 0.224 Sens 1 71% 71% 71% 70% 70% 70% 71% 74% 71% Spec 1 39% 32% 40% 45% 45% 46% 42% 47% 41% Cutoff 2 0.184 0.164 0.196 0.153 0.209 0.166 0.102 0.196 0.144 Sens 2 80% 82% 80% 80% 81% 81% 81% 83% 80% Spec 2 36% 28% 38% 30% 36% 32% 23% 33% 28% Cutoff 3 0.102 0.0836 0.174 0.0850 0.119 0.0836 0.0183 0.0773 0.0183 Sens 3 91% 93% 91% 90% 92% 91% 90% 91% 91% Spec 3 23% 19% 33% 21% 23% 19% 13% 19% 12% Cutoff 4 0.644 0.788 0.668 0.644 0.788 0.668 0.644 0.788 0.668 Sens 4 33% 36% 40% 47% 43% 49% 40% 35% 49% Spec 4 70% 70% 70% 70% 70% 70% 70% 70% 70% Cutoff 5 1.03 1.32 1.06 1.03 1.32 1.06 1.03 1.32 1.06 Sens 5 23% 25% 29% 33% 35% 36% 26% 17% 31% Spec 5 80% 80% 80% 80% 80% 80% 80% 80% 80% Cutoff 6 2.87 3.45 2.87 2.87 3.45 2.87 2.87 3.45 2.87 Sens 6 11% 11% 15% 19% 11% 25% 7% 4% 6% Spec 6 90% 90% 90% 90% 90% 90% 90% 90% 90% OR Quart 2 3.1 2.6 3.9 2.2 2.3 2.0 0.75 0.74 1.0 p Value 0.0066 0.12 0.0055 0.038 0.17 0.087 0.59 0.70 1.0 95% CI of 1.4 0.79 1.5 1.0 0.70 0.90 0.27 0.16 0.34 OR Quart2 7.1 8.3 10 4.5 7.6 4.4 2.1 3.4 3.0 OR Quart 3 2.6 0.99 3.2 1.5 2.3 1.6 1.5 2.6 1.2 p Value 0.023 0.99 0.020 0.33 0.17 0.23 0.37 0.11 0.79 95% CI of 1.1 0.25 1.2 0.68 0.70 0.72 0.61 0.80 0.40 OR Quart 3 6.0 4.0 8.5 3.1 7.6 3.7 3.7 8.4 3.3 OR Quart 4 2.6 2.6 4.4 3.3 4.0 3.3 1.5 1.5 2.0 p Value 0.023 0.12 0.0023 9.4E-4 0.016 0.0022 0.38 0.53 0.17 95% CI of 1.1 0.79 1.7 1.6 1.3 1.5 0.61 0.42 0.75 OR Quart 4 6.0 8.3 11 6.6 12 7.0 3.7 5.4 5.2
TABLE-US-00033 Apolipoprotein A-I 0 hr prior to AKI stage 24 hr prior to AKI stage 48 hr prior to AKI stage Cohort 1 Cohort 2 Cohort 1 Cohort 2 Cohort 1 Cohort 2 sCr or UO Median 327 547 327 263 327 287 Average 1390 1310 1390 1100 1390 821 Stdev 2970 2650 2970 2630 2970 1870 p(t-test) 0.84 0.41 0.22 Min 1.00E-9 1.00E-9 1.00E-9 1.00E-9 1.00E-9 1.00E-9 Max 12000 12000 12000 13100 12000 12000 n (Samp) 354 75 354 89 354 43 n (Patient) 190 75 190 89 190 43 sCr only Median 325 217 325 233 325 487 Average 1280 836 1280 1030 1280 735 Stdev 2800 2260 2800 2770 2800 874 p(t-test) 0.40 0.60 0.35 Min 1.00E-9 1.00E-9 1.00E-9 1.00E-9 1.00E-9 1.00E-9 Max 13100 12000 13100 12000 13100 3230 n (Samp) 744 28 744 35 744 23 n (Patient) 295 28 295 35 295 23 UO only Median 377 591 377 413 377 325 Average 1480 1440 1480 1590 1480 1010 Stdev 3080 2840 3080 3180 3080 2080 p(t-test) 0.92 0.78 0.37 Min 1.00E-9 1.00E-9 1.00E-9 1.00E-9 1.00E-9 1.00E-9 Max 12000 12000 12000 13100 12000 12000 n (Samp) 314 64 314 76 314 36 n (Patient) 136 64 136 76 136 36 0 hr prior to AKI stage 24 hr prior to AKI stage 48 hr prior to AKI stage sCr or UO sCr only UO only sCr or UO sCr only UO only sCr or UO sCr only UO only AUC 0.52 0.41 0.52 0.46 0.44 0.50 0.47 0.52 0.48 SE 0.037 0.057 0.040 0.035 0.051 0.037 0.047 0.062 0.051 p 0.57 0.13 0.57 0.24 0.25 0.94 0.57 0.76 0.70 nCohort 1 354 744 314 354 744 314 354 744 314 nCohort 2 75 28 64 89 35 76 43 23 36 Cutoff 1 161 86.7 193 125 159 157 134 183 148 Sens 1 71% 71% 70% 71% 71% 71% 72% 74% 72% Spec 1 31% 19% 33% 23% 33% 28% 24% 36% 26% Cutoff 2 86.7 33.8 82.6 68.0 42.0 87.3 98.3 70.7 123 Sens 2 80% 82% 81% 81% 80% 80% 81% 83% 81% Spec 2 16% 7% 14% 12% 9% 15% 19% 15% 22% Cutoff 3 16.3 0 22.3 26.0 0 41.4 33.0 22.1 36.1 Sens 3 91% 100% 91% 91% 100% 91% 91% 91% 92% Spec 3 3% 0% 4% 4% 0% 6% 5% 6% 5% Cutoff 4 711 711 750 711 711 750 711 711 750 Sens 4 37% 21% 38% 26% 23% 34% 30% 35% 31% Spec 4 70% 70% 70% 70% 70% 70% 70% 70% 70% Cutoff 5 1110 1070 1120 1110 1070 1120 1110 1070 1120 Sens 5 24% 18% 23% 15% 11% 21% 12% 22% 19% Spec 5 80% 80% 80% 80% 80% 80% 80% 80% 80% Cutoff 6 3230 2410 3410 3230 2410 3410 3230 2410 3410 Sens 6 8% 4% 9% 8% 6% 12% 2% 9% 3% Spec 6 90% 90% 90% 90% 90% 90% 90% 90% 90% OR Quart 2 0.42 0.83 0.57 1.5 2.9 0.89 1.4 0.79 1.2 p Value 0.036 0.76 0.20 0.24 0.077 0.75 0.48 0.73 0.78 95% CI of 0.19 0.25 0.25 0.77 0.89 0.45 0.56 0.21 0.42 OR Quart 2 0.95 2.8 1.3 2.9 9.1 1.8 3.5 3.0 3.1 OR Quart 3 1.0 1.2 1.3 1.0 2.9 0.61 1.0 1.6 1.1 p Value 1.0 0.78 0.46 1.0 0.077 0.19 0.98 0.41 0.80 95% CI of 0.51 0.39 0.63 0.49 0.89 0.29 0.38 0.52 0.42 OR Quart 3 2.0 3.6 2.7 2.0 9.1 1.3 2.7 5.0 3.1 OR Quart 4 1.1 1.7 1.1 1.8 2.3 1.1 1.5 1.2 1.3 p Value 0.76 0.31 0.73 0.093 0.17 0.83 0.36 0.77 0.60 95% CI of 0.57 0.61 0.54 0.91 0.70 0.55 0.62 0.36 0.49 OR Quart 4 2.2 4.8 2.4 3.4 7.7 2.1 3.8 4.0 3.5
TABLE-US-00034 Apolipoprotein B-100 0 hr prior to AKI stage 24 hr prior to AKI stage 48 hr prior to AKI stage Cohort 1 Cohort 2 Cohort 1 Cohort 2 Cohort 1 Cohort 2 sCr or UO Median 56.7 106 56.7 74.9 56.7 45.4 Average 203 257 203 289 203 177 Stdev 359 452 359 499 359 289 p(t-test) 0.26 0.060 0.65 Min 1.00E-9 1.00E-9 1.00E-9 1.00E-9 1.00E-9 1.00E-9 Max 2530 2810 2530 2780 2530 1330 n (Samp) 360 76 360 92 360 43 n (Patient) 190 76 190 92 190 43 sCr only Median 67.6 63.8 67.6 88.8 67.6 64.2 Average 238 194 238 306 238 144 Stdev 431 308 431 527 431 212 p(t-test) 0.59 0.35 0.30 Min 1.00E-9 1.00E-9 1.00E-9 1.00E-9 1.00E-9 1.00E-9 Max 3580 1230 3580 2780 3580 752 n (Samp) 760 29 760 37 760 23 n (Patient) 296 29 296 37 296 23 UO only Median 68.4 121 68.4 76.6 68.4 72.2 Average 194 329 194 323 194 214 Stdev 321 572 321 533 321 325 p(t-test) 0.0083 0.0060 0.73 Min 1.00E-9 1.00E-9 1.00E-9 1.00E-9 1.00E-9 1.00E-9 Max 2530 2890 2530 2780 2530 1330 n (Samp) 317 66 317 79 317 36 n (Patient) 136 66 136 79 136 36 0 hr prior to AKI stage 24 hr prior to AKI stage 48 hr prior to AKI stage sCr or UO sCr only UO only sCr or UO sCr only UO only sCr or UO sCr only UO only AUC 0.57 0.51 0.61 0.54 0.58 0.55 0.48 0.46 0.50 SE 0.037 0.055 0.040 0.034 0.050 0.037 0.047 0.062 0.051 p 0.044 0.83 0.0078 0.20 0.093 0.19 0.72 0.49 0.94 nCohort 1 360 760 317 360 760 317 360 760 317 nCohort 2 76 29 66 92 37 79 43 23 36 Cutoff 1 42.8 31.9 52.5 21.5 57.1 21.5 15.4 15.1 20.0 Sens 1 71% 72% 71% 71% 70% 71% 72% 74% 72% Spec 1 44% 35% 46% 30% 47% 28% 25% 23% 28% Cutoff 2 22.8 22.9 37.1 13.7 36.9 11.4 9.12 5.62 12.9 Sens 2 80% 83% 80% 80% 81% 81% 81% 83% 81% Spec 2 32% 30% 38% 24% 37% 20% 19% 14% 21% Cutoff 3 9.70 6.99 13.9 4.19 17.0 4.07 1.38 0.907 3.64 Sens 3 91% 93% 91% 90% 92% 91% 91% 91% 92% Spec 3 20% 15% 21% 12% 24% 10% 8% 6% 10% Cutoff 4 163 179 169 163 179 169 163 179 169 Sens 4 36% 28% 41% 35% 38% 38% 28% 22% 33% Spec 4 70% 70% 70% 70% 70% 70% 70% 70% 70% Cutoff 5 301 329 301 301 329 301 301 329 301 Sens 5 21% 14% 24% 26% 27% 29% 16% 13% 22% Spec 5 80% 80% 80% 80% 80% 80% 80% 80% 80% Cutoff 6 572 689 537 572 689 537 572 689 537 Sens 6 12% 10% 14% 18% 11% 23% 12% 4% 14% Spec 6 90% 90% 90% 90% 90% 90% 90% 90% 90% OR Quart 2 1.6 2.9 2.0 0.94 1.6 0.88 1.1 1.5 1.0 p Value 0.24 0.077 0.13 0.86 0.40 0.72 0.82 0.52 1.0 95% CI of 0.73 0.89 0.81 0.48 0.52 0.43 0.45 0.42 0.38 OR Quart 2 3.5 9.1 5.0 1.9 5.1 1.8 2.7 5.5 2.7 OR Quart 3 2.3 2.3 3.0 1.1 2.5 0.71 1.1 1.5 0.88 p Value 0.031 0.17 0.012 0.87 0.092 0.35 0.82 0.52 0.80 95% CI of 1.1 0.70 1.3 0.54 0.86 0.34 0.45 0.42 0.32 OR Quart 3 4.8 7.6 7.3 2.1 7.2 1.5 2.7 5.5 2.4 OR Quart 4 2.0 1.2 3.2 1.5 2.5 1.4 1.1 1.8 1.1 p Value 0.065 0.74 0.0080 0.20 0.094 0.31 0.80 0.36 0.83 95% CI of 0.96 0.33 1.4 0.80 0.86 0.72 0.46 0.51 0.43 OR Quart 4 4.4 4.7 7.7 2.9 7.2 2.7 2.8 6.2 2.9
TABLE-US-00035 Calcitonin 0 hr prior to AKI stage 24 hr prior to AKI stage 48 hr prior to AKI stage Cohort 1 Cohort 2 Cohort 1 Cohort 2 Cohort 1 Cohort 2 sCr or UO Median 84.7 114 84.7 109 84.7 72.3 Average 213 234 213 976 213 1550 Stdev 1030 543 1030 5100 1030 7440 p(t-test) 0.89 0.028 0.0078 Min 1.48 12.1 1.48 4.11 1.48 7.43 Max 15500 3770 15500 38400 15500 38800 n (Samp) 255 48 255 57 255 27 n (Patient) 103 48 103 57 103 27 sCr only Median 91.6 110 91.6 126 91.6 57.1 Average 507 208 507 564 507 106 Stdev 3450 293 3450 1190 3450 154 p(t-test) 0.73 0.94 0.68 Min 1.48 25.1 1.48 4.11 1.48 7.79 Max 38800 1160 38800 4480 38800 583 n (Samp) 447 16 447 21 447 13 n (Patient) 170 16 170 21 170 13 UO only Median 80.6 113 80.6 99.7 80.6 72.3 Average 229 231 229 924 229 1670 Stdev 1130 552 1130 5360 1130 7730 p(t-test) 0.99 0.079 0.011 Min 2.78 12.1 2.78 5.40 2.78 7.43 Max 15500 3770 15500 38400 15500 38800 n (Samp) 218 46 218 51 218 25 n (Patient) 87 46 87 51 87 25 0 hr prior to AKI stage 24 hr prior to AKI stage 48 hr prior to AKI stage sCr or UO sCr only UO only sCr or UO sCr only UO only sCr or UO sCr only UO only AUC 0.60 0.56 0.61 0.56 0.61 0.58 0.48 0.37 0.52 SE 0.046 0.076 0.048 0.043 0.067 0.046 0.059 0.084 0.062 p 0.036 0.42 0.027 0.14 0.10 0.095 0.76 0.12 0.73 nCohort 1 255 447 218 255 447 218 255 447 218 nCohort 2 48 16 46 57 21 51 27 13 25 Cutoff 1 76.7 56.6 76.9 55.6 89.6 56.6 52.0 38.6 52.0 Sens 1 71% 75% 72% 70% 71% 71% 70% 77% 72% Spec 1 47% 32% 50% 35% 49% 38% 31% 20% 32% Cutoff 2 54.8 54.8 49.5 46.8 47.7 48.1 42.5 18.0 46.5 Sens 2 81% 81% 80% 81% 81% 80% 81% 85% 80% Spec 2 34% 30% 31% 28% 25% 29% 27% 9% 28% Cutoff 3 34.3 42.0 34.3 19.3 20.3 35.7 19.3 16.1 31.1 Sens 3 92% 94% 91% 91% 90% 90% 93% 92% 92% Spec 3 21% 22% 20% 12% 10% 21% 12% 7% 17% Cutoff 4 138 144 128 138 144 128 138 144 128 Sens 4 42% 31% 41% 39% 48% 39% 26% 15% 32% Spec 4 71% 70% 71% 71% 70% 71% 71% 70% 71% Cutoff 5 190 190 173 190 190 173 190 190 173 Sens 5 25% 25% 26% 26% 33% 25% 19% 15% 24% Spec 5 80% 80% 80% 80% 80% 80% 80% 80% 80% Cutoff 6 296 312 289 296 312 289 296 312 289 Sens 6 12% 12% 15% 19% 29% 16% 11% 8% 12% Spec 6 90% 90% 90% 90% 90% 90% 90% 90% 90% OR Quart 2 2.2 1.7 2.0 1.6 0.39 1.9 0.66 0.50 3.7 p Value 0.15 0.48 0.20 0.28 0.27 0.17 0.53 0.57 0.055 95% CI of 0.76 0.39 0.69 0.68 0.074 0.76 0.18 0.044 0.97 OR Quart 2 6.1 7.2 5.8 3.9 2.0 5.0 2.4 5.5 14 OR Quart 3 2.6 0.99 2.7 1.5 1.0 1.4 2.4 2.6 1.7 p Value 0.066 0.99 0.058 0.38 1.0 0.46 0.091 0.27 0.48 95% CI of 0.94 0.20 0.97 0.62 0.28 0.54 0.87 0.49 0.39 OR Quart 3 7.2 5.0 7.5 3.6 3.6 3.9 6.8 14 7.4 OR Quart 4 3.1 1.7 2.9 2.0 1.9 2.7 0.66 2.6 2.5 p Value 0.028 0.48 0.038 0.099 0.28 0.036 0.53 0.27 0.21 95% CI of 1.1 0.39 1.1 0.87 0.61 1.1 0.18 0.49 0.61 OR Quart 4 8.3 7.2 8.1 4.8 5.7 6.6 2.4 14 10
TABLE-US-00036 C-reactive protein 0 hr prior to AKI stage 24 hr prior to AKI stage 48 hr prior to AKI stage Cohort 1 Cohort 2 Cohort 1 Cohort 2 Cohort 1 Cohort 2 sCr or UO Median 8.10 14.2 8.10 19.1 8.10 6.30 Average 18.3 22.6 18.3 25.6 18.3 17.8 Stdev 27.1 25.6 27.1 30.1 27.1 25.3 p(t-test) 0.22 0.026 0.90 Min 1.00E-9 0.00556 1.00E-9 0.00494 1.00E-9 0.0137 Max 259 141 259 162 259 118 n (Samp) 357 75 357 90 357 42 n (Patient) 189 75 189 90 189 42 sCr only Median 8.80 15.2 8.80 30.4 8.80 5.66 Average 18.9 25.9 18.9 34.5 18.9 24.7 Stdev 24.0 33.9 24.0 46.6 24.0 37.3 p(t-test) 0.14 3.0E-4 0.26 Min 1.00E-9 1.00E-9 1.00E-9 0.210 1.00E-9 0.0137 Max 259 141 259 243 259 142 n (Samp) 752 28 752 37 752 23 n (Patient) 296 28 296 37 296 23 UO only Median 9.65 23.2 9.65 20.3 9.65 7.66 Average 19.2 25.3 19.2 26.7 19.2 20.7 Stdev 26.5 26.0 26.5 31.2 26.5 23.4 p(t-test) 0.091 0.033 0.74 Min 1.00E-9 0.0415 1.00E-9 0.00494 1.00E-9 0.0238 Max 259 141 259 162 259 83.0 n (Samp) 315 65 315 77 315 35 n (Patient) 135 65 135 77 135 35 0 hr prior to AKI stage 24 hr prior to AKI stage 48 hr prior to AKI stage sCr or UO sCr only UO only sCr or UO sCr only UO only sCr or UO sCr only UO only AUC 0.54 0.51 0.57 0.55 0.62 0.54 0.48 0.50 0.52 SE 0.037 0.056 0.040 0.035 0.050 0.037 0.048 0.061 0.052 p 0.31 0.81 0.074 0.14 0.013 0.25 0.70 0.94 0.67 nCohort 1 357 752 315 357 752 315 357 752 315 nCohort 2 75 28 65 90 37 77 42 23 35 Cutoff 1 2.01 1.32 2.61 2.36 9.34 2.36 1.49 1.32 2.73 Sens 1 71% 71% 71% 70% 70% 70% 71% 74% 71% Spec 1 28% 23% 29% 30% 51% 27% 24% 23% 30% Cutoff 2 0.734 0.726 1.12 0.659 3.75 0.525 0.910 0.660 0.967 Sens 2 80% 82% 80% 80% 81% 81% 81% 83% 80% Spec 2 18% 18% 20% 17% 36% 15% 20% 17% 19% Cutoff 3 0.195 0.0435 0.401 0.112 0.623 0.0424 0.419 0.123 0.441 Sens 3 91% 93% 91% 90% 92% 91% 90% 91% 91% Spec 3 9% 5% 13% 7% 16% 6% 13% 8% 13% Cutoff 4 24.9 30.4 30.4 24.9 30.4 30.4 24.9 30.4 30.4 Sens 4 43% 25% 34% 42% 32% 30% 29% 26% 31% Spec 4 70% 79% 81% 70% 79% 81% 70% 79% 81% Cutoff 5 30.4 32.5 30.4 30.4 32.5 30.4 30.4 32.5 30.4 Sens 5 27% 25% 34% 30% 32% 30% 24% 26% 31% Spec 5 81% 80% 81% 81% 80% 81% 81% 80% 81% Cutoff 6 46.7 51.5 44.5 46.7 51.5 44.5 46.7 51.5 44.5 Sens 6 19% 18% 22% 21% 24% 23% 14% 9% 23% Spec 6 90% 90% 90% 90% 90% 90% 90% 90% 90% OR Quart 2 0.49 0.29 0.58 0.44 1.4 0.35 0.39 0.66 0.88 p Value 0.065 0.063 0.21 0.030 0.56 0.013 0.085 0.52 0.79 95% CI of 0.23 0.078 0.25 0.21 0.44 0.15 0.13 0.18 0.34 OR Quart 2 1.0 1.1 1.4 0.92 4.5 0.80 1.1 2.4 2.3 OR Quart 3 0.94 0.69 0.93 1.2 2.7 1.0 1.0 1.0 0.47 p Value 0.86 0.46 0.84 0.66 0.063 1.0 1.0 1.0 0.18 95% CI of 0.48 0.26 0.43 0.62 0.95 0.51 0.43 0.32 0.15 OR Quart 3 1.8 1.8 2.0 2.2 7.8 2.0 2.3 3.2 1.4 OR Quart 4 0.89 0.79 1.7 1.2 2.5 1.1 1.1 1.2 1.1 p Value 0.73 0.63 0.16 0.66 0.094 0.74 0.81 0.77 0.84 95% CI of 0.45 0.31 0.82 0.62 0.86 0.58 0.48 0.39 0.44 OR Quart 4 1.7 2.0 3.4 2.2 7.2 2.2 2.6 3.6 2.7
TABLE-US-00037 Tissue factor 0 hr prior to AKI stage 24 hr prior to AKI stage 48 hr prior to AKI stage Cohort 1 Cohort 2 Cohort 1 Cohort 2 Cohort 1 Cohort 2 sCr or UO Median 0.00336 0.00336 0.00336 0.00336 0.00336 0.00336 Average 0.0564 0.112 0.0564 0.137 0.0564 0.0912 Stdev 0.105 0.153 0.105 0.203 0.105 0.194 p(t-test) 0.0022 2.3E-5 0.14 Min 0.00336 0.00336 0.00336 0.00336 0.00336 0.00336 Max 0.593 0.618 0.593 0.896 0.593 0.818 n (Samp) 255 48 255 57 255 27 n (Patient) 103 48 103 57 103 27 sCr only Median 0.00336 0.00336 0.00336 0.167 0.00336 0.00336 Average 0.0758 0.101 0.0758 0.165 0.0758 0.0603 Stdev 0.145 0.151 0.145 0.245 0.145 0.0985 p(t-test) 0.49 0.0086 0.70 Min 0.00336 0.00336 0.00336 0.00336 0.00336 0.00336 Max 0.917 0.472 0.917 1.12 0.917 0.310 n (Samp) 447 16 447 21 447 13 n (Patient) 170 16 170 21 170 13 UO only Median 0.00336 0.00336 0.00336 0.00336 0.00336 0.00336 Average 0.0603 0.101 0.0603 0.133 0.0603 0.110 Stdev 0.107 0.144 0.107 0.211 0.107 0.208 p(t-test) 0.029 5.0E-4 0.053 Min 0.00336 0.00336 0.00336 0.00336 0.00336 0.00336 Max 0.593 0.618 0.593 0.896 0.593 0.818 n (Samp) 218 46 218 51 218 25 n (Patient) 87 46 87 51 87 25 0 hr prior to AKI stage 24 hr prior to AKI stage 48 hr prior to AKI stage sCr or UO sCr only UO only sCr or UO sCr only UO only sCr or UO sCr only UO only AUC 0.60 0.55 0.58 0.62 0.65 0.59 0.51 0.50 0.53 SE 0.046 0.075 0.048 0.043 0.066 0.046 0.059 0.081 0.062 p 0.026 0.53 0.11 0.0062 0.020 0.050 0.85 0.97 0.62 nCohort 1 255 447 218 255 447 218 255 447 218 nCohort 2 48 16 46 57 21 51 27 13 25 Cutoff 1 0 0 0 0 0 0 0 0 0 Sens 1 100% 100% 100% 100% 100% 100% 100% 100% 100% Spec 1 0% 0% 0% 0% 0% 0% 0% 0% 0% Cutoff 2 0 0 0 0 0 0 0 0 0 Sens 2 100% 100% 100% 100% 100% 100% 100% 100% 100% Spec 2 0% 0% 0% 0% 0% 0% 0% 0% 0% Cutoff 3 0 0 0 0 0 0 0 0 0 Sens 3 100% 100% 100% 100% 100% 100% 100% 100% 100% Spec 3 0% 0% 0% 0% 0% 0% 0% 0% 0% Cutoff 4 0.00336 0.0873 0.00336 0.00336 0.0873 0.00336 0.00336 0.0873 0.00336 Sens 4 46% 38% 43% 46% 57% 43% 26% 31% 32% Spec 4 74% 70% 72% 74% 70% 72% 74% 70% 72% Cutoff 5 0.136 0.144 0.138 0.136 0.144 0.138 0.136 0.144 0.138 Sens 5 29% 25% 24% 40% 52% 33% 22% 23% 24% Spec 5 80% 80% 80% 80% 80% 80% 80% 80% 80% Cutoff 6 0.195 0.238 0.207 0.195 0.238 0.207 0.195 0.238 0.207 Sens 6 21% 19% 17% 28% 19% 22% 15% 8% 16% Spec 6 90% 90% 90% 90% 90% 90% 90% 90% 90% OR Quart 2 2.1 >11 1.6 1.1 >9.8 2.3 3.5 0.33 3.1 p Value 0.096 <0.024 0.35 0.84 <0.032 0.10 0.023 0.34 0.068 95% CI of 0.88 >1.4 0.61 0.49 >1.2 0.85 1.2 0.034 0.92 OR Quart 2 5.1 na 3.9 2.4 na 6.0 10 3.2 10 OR Quart 3 0.20 >0 1.0 0.11 >1.0 1.5 0 3.2 0.72 p Value 0.043 <na 1.0 0.0043 <1.00 0.44 na 0.090 0.68 95% CI of 0.041 >na 0.37 0.024 >0.062 0.54 na 0.84 0.16 OR Quart 3 0.95 na 2.7 0.50 na 4.2 na 12 3.4 OR Quart 4 2.6 >6.3 1.9 1.9 >12 3.6 1.4 0 1.8 p Value 0.029 <0.092 0.18 0.099 <0.018 0.0080 0.56 na 0.36 95% CI of 1.1 >0.74 0.75 0.89 >1.5 1.4 0.43 na 0.50 OR Quart 4 6.2 na 4.6 3.9 na 9.1 4.7 na 6.6
TABLE-US-00038 Interleukin-5 0 hr prior to AKI stage 24 hr prior to AKI stage 48 hr prior to AKI stage Cohort 1 Cohort 2 Cohort 1 Cohort 2 Cohort 1 Cohort 2 sCr or UO Median 0.0839 0.101 0.0839 0.0698 0.0839 0.0840 Average 0.575 0.707 0.575 0.280 0.575 0.157 Stdev 1.93 1.78 1.93 0.643 1.93 0.254 p (t-test) 0.58 0.15 0.16 Min 1.00E-9 1.00E-9 1.00E-9 1.00E-9 1.00E-9 1.00E-9 Max 20.2 9.97 20.2 3.54 20.2 1.43 n (Samp) 360 76 360 92 360 43 n (Patient) 190 76 190 92 190 43 sCr only Median 0.0787 0.103 0.0787 0.0642 0.0787 0.0789 Average 0.455 0.496 0.455 0.122 0.455 0.167 Stdev 1.54 1.16 1.54 0.154 1.54 0.236 p (t-test) 0.89 0.19 0.37 Min 1.00E-9 1.00E-9 1.00E-9 1.00E-9 1.00E-9 1.00E-9 Max 20.2 5.00 20.2 0.501 20.2 0.959 n (Samp) 761 29 761 37 761 23 n (Patient) 297 29 297 37 297 23 UO only Median 0.0941 0.111 0.0941 0.0825 0.0941 0.0950 Average 0.719 1.85 0.719 1.27 0.719 0.323 Stdev 2.24 9.81 2.24 8.09 2.24 0.854 p (t-test) 0.065 0.29 0.29 Min 1.00E-9 1.00E-9 1.00E-9 1.00E-9 1.00E-9 1.00E-9 Max 20.2 79.1 20.2 71.8 20.2 5.00 n (Samp) 317 66 317 79 317 36 n (Patient) 136 66 136 79 136 36 0 hr prior to AKI stage 24 hr prior to AKI stage 48 hr prior to AKI stage sCr or UO sCr only UO only sCr or UO sCr only UO only sCr or UO sCr only UO only AUC 0.55 0.55 0.54 0.44 0.44 0.43 0.44 0.47 0.46 SE 0.037 0.056 0.040 0.034 0.050 0.037 0.048 0.062 0.052 p 0.14 0.34 0.37 0.11 0.26 0.071 0.24 0.63 0.49 nCohort 1 360 761 317 360 761 317 360 761 317 nCohort 2 76 29 66 92 37 79 43 23 36 Cutoff 1 0.0585 0.0410 0.0601 0.0148 0.0184 0.0148 0 0 0.0230 Sens 1 71% 72% 71% 71% 70% 71% 100% 100% 72% Spec 1 41% 35% 37% 23% 27% 21% 0% 0% 23% Cutoff 2 0.0438 0.00534 0.0503 0 0 0 0 0 0 Sens 2 80% 83% 80% 100% 100% 100% 100% 100% 100% Spec 2 34% 23% 32% 0% 0% 0% 0% 0% 0% Cutoff 3 0 0 0 0 0 0 0 0 0 Sens 3 100% 100% 100% 100% 100% 100% 100% 100% 100% Spec 3 0% 0% 0% 0% 0% 0% 0% 0% 0% Cutoff 4 0.191 0.157 0.257 0.191 0.157 0.257 0.191 0.157 0.257 Sens 4 34% 48% 32% 23% 30% 20% 26% 26% 19% Spec 4 70% 70% 70% 70% 70% 70% 70% 70% 70% Cutoff 5 0.417 0.318 0.475 0.417 0.318 0.475 0.417 0.318 0.475 Sens 5 21% 21% 21% 15% 14% 15% 9% 22% 14% Spec 5 80% 80% 80% 80% 80% 80% 80% 80% 80% Cutoff 6 1.25 0.995 1.48 1.25 0.995 1.48 1.25 0.995 1.48 Sens 6 12% 14% 12% 5% 0% 9% 2% 0% 3% Spec 6 90% 90% 90% 90% 90% 90% 90% 90% 90% OR Quart 2 1.7 0.56 2.2 1.3 0.89 1.8 2.3 1.0 1.7 p Value 0.18 0.36 0.054 0.40 0.81 0.10 0.077 1.0 0.31 95% CI of 0.78 0.16 0.99 0.68 0.34 0.88 0.91 0.32 0.62 OR Quart 2 3.7 1.9 5.1 2.6 2.4 3.8 6.0 3.2 4.5 OR Quart 3 2.4 1.1 2.2 1.1 1.0 1.1 1.0 0.49 1.0 p Value 0.021 0.79 0.054 0.73 1.0 0.84 1.0 0.32 0.98 95% CI of 1.1 0.41 0.99 0.57 0.39 0.49 0.34 0.12 0.34 OR Quart 3 5.1 3.2 5.1 2.2 2.6 2.4 3.0 2.0 3.0 OR Quart 4 1.8 1.4 1.7 1.6 1.2 2.3 2.2 1.3 1.7 p Value 0.13 0.47 0.22 0.14 0.64 0.025 0.11 0.59 0.31 95% CI of 0.84 0.54 0.73 0.85 0.50 1.1 0.84 0.46 0.62 OR Quart 4 3.9 3.9 4.0 3.1 3.1 4.7 5.7 4.0 4.5
TABLE-US-00039 Interleukin-6 receptor subunit beta 0 hr prior to AKI stage 24 hr prior to AKI stage 48 hr prior to AKI stage Cohort 1 Cohort 2 Cohort 1 Cohort 2 Cohort 1 Cohort 2 sCr or UO Median 9520 15500 9520 14300 9520 11700 Average 12700 16700 12700 24800 12700 15000 Stdev 9630 10400 9630 45500 9630 12300 p (t-test) 0.020 0.0059 0.30 Min 344 577 344 670 344 1280 Max 59000 56200 59000 323000 59000 49700 n (Samp) 121 46 121 53 121 26 n (Patient) 98 46 98 53 98 26 sCr only Median 13200 9670 13200 18900 13200 9650 Average 16200 12700 16200 24300 16200 13100 Stdev 22100 9620 22100 25100 22100 8510 p (t-test) 0.56 0.13 0.62 Min 344 577 344 670 344 2180 Max 323000 33500 323000 110000 323000 31100 n (Samp) 264 14 264 19 264 13 n (Patient) 159 14 159 19 159 13 UO only Median 9650 16200 9650 14200 9650 14200 Average 13000 17700 13000 26000 13000 15600 Stdev 9530 10000 9530 48100 9530 12500 p (t-test) 0.0079 0.0071 0.27 Min 344 2940 344 2050 344 1280 Max 59000 56200 59000 323000 59000 49700 n (Samp) 111 43 111 48 111 23 n (Patient) 86 43 86 48 86 23 0 hr prior to AKI stage 24 hr prior to AKI stage 48 hr prior to AKI stage sCr or UO sCr only UO only sCr or UO sCr only UO only sCr or UO sCr only UO only AUC 0.63 0.45 0.66 0.63 0.62 0.62 0.54 0.47 0.54 SE 0.050 0.081 0.051 0.047 0.071 0.050 0.063 0.083 0.067 p 0.0079 0.52 0.0017 0.0047 0.086 0.016 0.51 0.72 0.51 nCohort 1 121 264 111 121 264 111 121 264 111 nCohort 2 46 14 43 53 19 48 26 13 23 Cutoff 1 9830 6660 11500 10700 12300 9300 6640 7100 6640 Sens 1 72% 79% 72% 72% 74% 71% 73% 77% 74% Spec 1 53% 24% 57% 54% 48% 49% 32% 27% 29% Cutoff 2 8690 2940 8990 8520 5240 8460 5680 5100 5680 Sens 2 80% 86% 81% 81% 84% 81% 81% 85% 83% Spec 2 49% 7% 49% 45% 17% 42% 26% 16% 24% Cutoff 3 5050 2430 6810 4460 3470 5510 2820 4740 2600 Sens 3 91% 93% 91% 91% 95% 92% 92% 92% 91% Spec 3 22% 5% 31% 18% 9% 23% 6% 15% 5% Cutoff 4 16500 17800 17300 16500 17800 17300 16500 17800 17300 Sens 4 43% 29% 47% 40% 53% 31% 35% 31% 35% Spec 4 70% 70% 70% 70% 70% 70% 70% 70% 70% Cutoff 5 19800 22300 20700 19800 22300 20700 19800 22300 20700 Sens 5 33% 14% 30% 26% 32% 23% 19% 15% 22% Spec 5 80% 80% 80% 80% 80% 80% 80% 80% 80% Cutoff 6 23900 28200 25400 23900 28200 25400 23900 28200 25400 Sens 6 24% 7% 21% 21% 26% 19% 19% 8% 22% Spec 6 90% 90% 90% 90% 90% 90% 90% 90% 90% OR Quart 2 1.1 0.49 2.9 1.3 0.48 1.8 1.2 0.49 0.44 p Value 0.82 0.42 0.095 0.64 0.40 0.29 0.78 0.42 0.27 95% CI of 0.37 0.087 0.83 0.45 0.085 0.59 0.33 0.087 0.099 OR Quart 2 3.5 2.8 10 3.7 2.7 5.7 4.3 2.8 1.9 OR Quart 3 2.7 0.74 5.0 3.5 1.2 6.1 1.7 1.0 1.7 p Value 0.059 0.70 0.011 0.013 0.75 9.3E-4 0.39 0.98 0.38 95% CI of 0.96 0.16 1.5 1.3 0.32 2.1 0.50 0.24 0.52 OR Quart 3 7.6 3.4 17 9.2 4.9 18 5.8 4.2 5.4 OR Quart 4 3.0 1.3 5.3 2.5 2.1 2.1 1.4 0.75 0.78 p Value 0.036 0.71 0.0073 0.068 0.25 0.20 0.56 0.71 0.70 95% CI of 1.1 0.33 1.6 0.94 0.60 0.69 0.41 0.16 0.21 OR Quart 4 8.3 5.0 18 6.7 7.3 6.3 5.1 3.5 2.8
TABLE-US-00040 Macrophage metalloelastase 0 hr prior to AKI stage 24 hr prior to AKI stage 48 hr prior to AKI stage Cohort 1 Cohort 2 Cohort 1 Cohort 2 Cohort 1 Cohort 2 sCr or UO Median 1.00E-9 1.00E-9 1.00E-9 0.747 1.00E-9 2.16 Average 3.65 1.78 3.65 3.50 3.65 3.64 Stdev 9.49 2.91 9.49 5.59 9.49 4.76 p (t-test) 0.19 0.92 1.00 Min 1.00E-9 1.00E-9 1.00E-9 1.00E-9 1.00E-9 1.00E-9 Max 69.2 11.7 69.2 22.5 69.2 18.6 n (Samp) 119 46 119 53 119 26 n (Patient) 97 46 97 53 97 26 sCr only Median 1.00E-9 1.00E-9 1.00E-9 0.747 1.00E-9 3.57 Average 3.71 1.69 3.71 4.22 3.71 4.45 Stdev 9.22 3.21 9.22 7.60 9.22 4.49 p (t-test) 0.43 0.82 0.77 Min 1.00E-9 1.00E-9 1.00E-9 1.00E-9 1.00E-9 1.00E-9 Max 84.4 7.33 84.4 29.1 84.4 14.9 n (Samp) 264 13 264 18 264 13 n (Patient) 158 13 158 18 158 13 UO only Median 1.00E-9 1.00E-9 1.00E-9 1.00E-9 1.00E-9 0.747 Average 3.97 2.62 3.97 3.68 3.97 3.28 Stdev 9.95 4.65 9.95 5.86 9.95 4.42 p (t-test) 0.39 0.85 0.75 Min 1.00E-9 1.00E-9 1.00E-9 1.00E-9 1.00E-9 1.00E-9 Max 69.2 24.5 69.2 22.5 69.2 18.6 n (Samp) 108 44 108 49 108 23 n (Patient) 85 44 85 49 85 23 0 hr prior to AKI stage 24 hr prior to AKI stage 48 hr prior to AKI stage sCr or UO sCr only UO only sCr or UO sCr only UO only sCr or UO sCr only UO only AUC 0.47 0.42 0.50 0.56 0.59 0.54 0.60 0.66 0.57 SE 0.051 0.085 0.052 0.048 0.073 0.050 0.064 0.084 0.068 p 0.59 0.33 0.98 0.24 0.24 0.45 0.11 0.056 0.27 nCohort 1 119 264 108 119 264 108 119 264 108 nCohort 2 46 13 44 53 18 49 26 13 23 Cutoff 1 0 0 0 0 0 0 0 1.00E-9 0 Sens 1 100% 100% 100% 100% 100% 100% 100% 77% 100% Spec 1 0% 0% 0% 0% 0% 0% 0% 57% 0% Cutoff 2 0 0 0 0 0 0 0 0 0 Sens 2 100% 100% 100% 100% 100% 100% 100% 100% 100% Spec 2 0% 0% 0% 0% 0% 0% 0% 0% 0% Cutoff 3 0 0 0 0 0 0 0 0 0 Sens 3 100% 100% 100% 100% 100% 100% 100% 100% 100% Spec 3 0% 0% 0% 0% 0% 0% 0% 0% 0% Cutoff 4 2.60 3.57 3.57 2.60 3.57 3.57 2.60 3.57 3.57 Sens 4 30% 23% 30% 36% 33% 33% 50% 46% 43% Spec 4 71% 73% 78% 71% 73% 78% 71% 73% 78% Cutoff 5 4.64 5.00 4.82 4.64 5.00 4.82 4.64 5.00 4.82 Sens 5 22% 23% 16% 32% 17% 31% 42% 31% 43% Spec 5 81% 84% 81% 81% 84% 81% 81% 84% 81% Cutoff 6 12.5 11.7 14.5 12.5 11.7 14.5 12.5 11.7 14.5 Sens 6 0% 0% 2% 8% 11% 8% 8% 8% 4% Spec 6 91% 91% 91% 91% 91% 91% 91% 91% 91% OR Quart 2 0.18 0.33 0.23 0.61 >6.5 0.79 7.0 >3.1 4.8 p Value 0.011 0.34 0.0049 0.32 <0.088 0.62 0.079 <0.33 0.061 95% CI of 0.046 0.033 0.080 0.23 >0.76 0.30 0.80 >0.32 0.93 OR Quart 2 0.68 3.2 0.64 1.6 na 2.1 61 na 25 OR Quart 3 1.6 3.4 0.15 1.1 >7.8 0.60 10 >5.4 1.5 p Value 0.32 0.080 0.0011 0.82 <0.058 0.32 0.035 <0.13 0.67 95% CI of 0.64 0.87 0.049 0.45 >0.93 0.22 1.2 >0.61 0.23 OR Quart 3 3.9 13 0.47 2.8 na 1.6 85 na 9.6 OR Quart 4 1.0 0 0.52 1.5 >5.3 1.3 15 >5.3 6.5 p Value 0.94 na 0.17 0.37 <0.13 0.54 0.012 <0.13 0.023 95% CI of 0.41 na 0.21 0.62 >0.60 0.53 1.8 >0.60 1.3 OR Quart 4 2.6 na 1.3 3.7 na 3.3 120 na 33
TABLE-US-00041 Sex hormone-binding globulin 0 hr prior to AKI stage 24 hr prior to AKI stage 48 hr prior to AKI stage Cohort 1 Cohort 2 Cohort 1 Cohort 2 Cohort 1 Cohort 2 sCr or UO Median 0.0182 0.0284 0.0182 0.0254 0.0182 0.0254 Average 0.0573 0.0592 0.0573 0.329 0.0573 0.0410 Stdev 0.130 0.0843 0.130 1.87 0.130 0.0552 p (t-test) 0.92 0.022 0.52 Min 5.20E-6 0.000295 5.20E-6 0.000362 5.20E-6 0.00142 Max 1.18 0.397 1.18 14.0 1.18 0.226 n (Samp) 255 48 255 57 255 27 n (Patient) 103 48 103 57 103 27 sCr only Median 0.0193 0.0168 0.0193 0.0254 0.0193 0.0135 Average 0.0863 0.0575 0.0863 0.225 0.0863 0.0196 Stdev 0.669 0.100 0.669 0.570 0.669 0.0189 p (t-test) 0.86 0.35 0.72 Min 5.20E-6 0.000599 5.20E-6 0.000362 5.20E-6 0.00142 Max 14.0 0.398 14.0 2.22 14.0 0.0744 n (Samp) 447 16 447 21 447 13 n (Patient) 170 16 170 21 170 13 UO only Median 0.0176 0.0333 0.0176 0.0278 0.0176 0.0292 Average 0.0571 0.0604 0.0571 0.361 0.0571 0.0697 Stdev 0.135 0.0856 0.135 1.97 0.135 0.129 p (t-test) 0.87 0.024 0.66 Min 5.20E-6 0.000295 5.20E-6 0.00126 5.20E-6 0.00274 Max 1.18 0.397 1.18 14.0 1.18 0.626 n (Samp) 218 46 218 51 218 25 n (Patient) 87 46 87 51 87 25 0 hr prior to AKI stage 24 hr prior to AKI stage 48 hr prior to AKI stage sCr or UO sCr only UO only sCr or UO sCr only UO only sCr or UO sCr only UO only AUC 0.56 0.53 0.57 0.56 0.54 0.59 0.54 0.43 0.62 SE 0.046 0.075 0.048 0.043 0.066 0.046 0.060 0.084 0.063 p 0.21 0.66 0.15 0.15 0.52 0.046 0.46 0.42 0.066 nCohort 1 255 447 218 255 447 218 255 447 218 nCohort 2 48 16 46 57 21 51 27 13 25 Cutoff 1 0.0129 0.0129 0.0114 0.0130 0.00935 0.0156 0.0130 0.00681 0.0182 Sens 1 71% 75% 72% 70% 71% 71% 70% 77% 72% Spec 1 40% 38% 39% 40% 33% 47% 40% 28% 52% Cutoff 2 0.00478 0.0104 0.00280 0.00724 0.00443 0.00978 0.00681 0.00621 0.0130 Sens 2 81% 81% 80% 81% 81% 80% 81% 85% 80% Spec 2 25% 35% 18% 31% 23% 36% 30% 27% 42% Cutoff 3 0.000972 0.00817 0.000925 0.00442 0.00338 0.00559 0.00511 0.00511 0.00633 Sens 3 92% 94% 91% 91% 90% 90% 93% 92% 92% Spec 3 9% 31% 9% 24% 19% 29% 27% 25% 31% Cutoff 4 0.0404 0.0441 0.0385 0.0404 0.0441 0.0385 0.0404 0.0441 0.0385 Sens 4 44% 31% 46% 32% 33% 31% 26% 8% 36% Spec 4 71% 70% 70% 71% 70% 70% 71% 70% 70% Cutoff 5 0.0716 0.0735 0.0702 0.0716 0.0735 0.0702 0.0716 0.0735 0.0702 Sens 5 21% 12% 26% 21% 24% 22% 15% 8% 20% Spec 5 80% 80% 80% 80% 80% 80% 80% 80% 80% Cutoff 6 0.126 0.134 0.134 0.126 0.134 0.134 0.126 0.134 0.134 Sens 6 10% 12% 11% 12% 19% 14% 7% 0% 12% Spec 6 90% 90% 90% 90% 90% 90% 90% 90% 90% OR Quart 2 1.1 8.4 0.59 2.8 0.59 3.6 5.6 4.1 7.6 p Value 0.84 0.046 0.31 0.031 0.48 0.020 0.031 0.21 0.061 95% CI of 0.44 1.0 0.21 1.1 0.14 1.2 1.2 0.45 0.91 OR Quart 2 2.8 69 1.6 7.3 2.5 11 26 37 64 OR Quart 3 1.1 3.0 1.2 3.3 1.6 4.6 5.7 6.3 12 p Value 0.84 0.34 0.65 0.013 0.40 0.0050 0.029 0.092 0.022 95% CI of 0.44 0.31 0.51 1.3 0.52 1.6 1.2 0.74 1.4 OR Quart 3 2.8 30 3.0 8.3 5.2 13 27 53 93 OR Quart 4 1.7 4.1 1.5 2.2 1.0 2.9 2.6 2.0 7.6 p Value 0.21 0.21 0.38 0.11 1.0 0.054 0.27 0.57 0.061 95% CI of 0.73 0.45 0.62 0.84 0.28 0.98 0.48 0.18 0.91 OR Quart 4 4.1 37 3.5 5.8 3.6 8.7 14 23 64
TABLE-US-00042 Thrombopoietin 0 hr prior to AKI stage 24 hr prior to AKI stage 48 hr prior to AKI stage Cohort 1 Cohort 2 Cohort 1 Cohort 2 Cohort 1 Cohort 2 sCr or UO Median 0.547 0.678 0.547 0.821 0.547 0.727 Average 0.550 0.743 0.550 0.832 0.550 0.754 Stdev 0.367 0.445 0.367 0.449 0.367 0.494 p (t-test) 0.0014 8.3E-7 0.0086 Min 0.0129 0.0129 0.0129 0.0129 0.0129 0.0129 Max 1.87 1.58 1.87 1.66 1.87 1.91 n (Samp) 255 48 255 57 255 27 n (Patient) 103 48 103 57 103 27 sCr only Median 0.583 0.634 0.583 0.857 0.583 0.903 Average 0.614 0.738 0.614 0.927 0.614 0.786 Stdev 0.419 0.515 0.419 0.440 0.419 0.482 p (t-test) 0.25 8.9E-4 0.15 Min 0.0129 0.0129 0.0129 0.0129 0.0129 0.0129 Max 2.57 1.76 2.57 1.66 2.57 1.70 n (Samp) 447 16 447 21 447 13 n (Patient) 170 16 170 21 170 13 UO only Median 0.540 0.731 0.540 0.828 0.540 0.747 Average 0.560 0.760 0.560 0.833 0.560 0.795 Stdev 0.357 0.441 0.357 0.432 0.357 0.450 p (t-test) 0.0011 4.1E-6 0.0028 Min 0.0129 0.0129 0.0129 0.0129 0.0129 0.0129 Max 1.87 1.58 1.87 1.76 1.87 1.91 n (Samp) 218 46 218 51 218 25 n (Patient) 87 46 87 51 87 25 0 hr prior to AKI stage 24 hr prior to AKI stage 48 hr prior to AKI stage sCr or UO sCr only UO only sCr or UO sCr only UO only sCr or UO sCr only UO only AUC 0.63 0.57 0.64 0.69 0.71 0.69 0.63 0.62 0.67 SE 0.046 0.076 0.047 0.042 0.065 0.044 0.060 0.084 0.062 p 0.0063 0.38 0.0038 6.7E-6 0.0013 1.4E-5 0.030 0.15 0.0064 nCohort 1 255 447 218 255 447 218 255 447 218 nCohort 2 48 16 46 57 21 51 27 13 25 Cutoff 1 0.499 0.499 0.540 0.573 0.657 0.547 0.600 0.462 0.644 Sens 1 73% 75% 72% 70% 71% 71% 70% 77% 72% Spec 1 45% 41% 50% 54% 57% 51% 60% 36% 63% Cutoff 2 0.331 0.278 0.351 0.484 0.636 0.484 0.265 0.351 0.484 Sens 2 81% 81% 83% 82% 81% 80% 81% 85% 80% Spec 2 29% 24% 30% 44% 55% 42% 26% 28% 42% Cutoff 3 0.0994 0 0.0994 0.0767 0.484 0.278 0 0 0.216 Sens 3 92% 100% 91% 91% 90% 90% 100% 100% 92% Spec 3 13% 0% 10% 11% 38% 24% 0% 0% 19% Cutoff 4 0.701 0.807 0.712 0.701 0.807 0.712 0.701 0.807 0.712 Sens 4 50% 44% 52% 63% 57% 67% 59% 54% 60% Spec 4 70% 70% 70% 70% 70% 70% 70% 70% 70% Cutoff 5 0.865 0.929 0.845 0.865 0.929 0.845 0.865 0.929 0.845 Sens 5 38% 38% 39% 44% 48% 47% 37% 46% 36% Spec 5 80% 80% 81% 80% 80% 81% 80% 80% 81% Cutoff 6 1.07 1.14 1.06 1.07 1.14 1.06 1.07 1.14 1.06 Sens 6 25% 25% 28% 30% 33% 33% 22% 23% 24% Spec 6 91% 90% 90% 91% 90% 90% 91% 90% 90% OR Quart 2 1.1 0.74 1.3 1.3 1.0 1.3 0.57 1.0 0.18 p Value 0.82 0.69 0.59 0.62 1.0 0.60 0.46 1.0 0.13 95% CI of 0.41 0.16 0.46 0.48 0.14 0.46 0.13 0.14 0.021 OR Quart 2 3.1 3.4 3.8 3.5 7.2 3.8 2.5 7.2 1.6 OR Quart 3 1.7 0.74 1.7 1.8 3.7 1.7 1.4 1.0 1.7 p Value 0.26 0.69 0.31 0.24 0.11 0.31 0.55 1.0 0.40 95% CI of 0.67 0.16 0.61 0.68 0.74 0.61 0.44 0.14 0.51 OR Quart 3 4.4 3.4 4.7 4.5 18 4.6 4.8 7.2 5.4 OR Quart 4 2.6 1.5 3.4 4.4 5.4 4.7 2.6 3.7 2.4 p Value 0.038 0.53 0.011 8.8E-4 0.032 0.0011 0.084 0.11 0.12 95% CI of 1.1 0.42 1.3 1.8 1.2 1.8 0.88 0.74 0.79 OR Quart 4 6.4 5.5 8.8 10 25 12 8.0 18 7.4
[0158] FIG. 2: Comparison of marker levels in urine samples collected from Cohort 1 (patients that did not progress beyond RIFLE stage 0 or R) and in urine samples collected from subjects at 0, 24 hours, and 48 hours prior to reaching stage I or F in Cohort 2.
TABLE-US-00043 Alpha-2 macroglobulin 0 hr prior to AKI stage 24 hr prior to AKI stage 48 hr prior to AKI stage Cohort 1 Cohort 2 Cohort 1 Cohort 2 Cohort 1 Cohort 2 sCr or UO Median 0.326 0.774 0.326 0.800 0.326 0.480 Average 3.82 4.91 3.82 14.6 3.82 1.50 Stdev 27.8 19.0 27.8 57.7 27.8 3.07 p (t-test) 0.82 0.018 0.66 Min 1.00E-9 1.00E-9 1.00E-9 1.00E-9 1.00E-9 1.00E-9 Max 510 115 510 368 510 15.6 n (Samp) 686 36 686 48 686 27 n (Patient) 280 36 280 48 280 27 sCr only Median 0.352 2.78 0.352 1.19 0.352 1.60 Average 3.89 18.5 3.89 33.0 3.89 4.95 Stdev 27.6 39.3 27.6 70.9 27.6 9.22 p (t-test) 0.14 2.9E-4 0.89 Min 1.00E-9 0.188 1.00E-9 1.00E-9 1.00E-9 0.0773 Max 510 115 510 235 510 34.4 n (Samp) 895 8 895 13 895 13 n (Patient) 336 8 336 13 336 13 UO only Median 0.340 0.766 0.340 0.831 0.340 0.601 Average 2.66 5.00 2.66 16.0 2.66 1.54 Stdev 16.9 19.3 16.9 60.9 16.9 3.21 p (t-test) 0.43 2.3E-4 0.75 Min 1.00E-9 1.00E-9 1.00E-9 1.00E-9 1.00E-9 1.00E-9 Max 235 115 235 368 235 15.6 n (Samp) 577 35 577 43 577 23 n (Patient) 208 35 208 43 208 23 0 hr prior to AKI stage 24 hr prior to AKI stage 48 hr prior to AKI stage sCr or UO sCr only UO only sCr or UO sCr only UO only sCr or UO sCr only UO only AUC 0.64 0.82 0.63 0.67 0.71 0.68 0.59 0.70 0.62 SE 0.051 0.091 0.052 0.044 0.082 0.046 0.059 0.082 0.064 p 0.0070 4.4E-4 0.015 8.1E-5 0.010 9.2E-5 0.11 0.015 0.064 nCohort 1 686 895 577 686 895 577 686 895 577 nCohort 2 36 8 35 48 13 43 27 13 23 Cutoff 1 0.252 1.34 0.272 0.356 0.356 0.382 0.259 0.468 0.312 Sens 1 72% 75% 71% 71% 77% 72% 70% 77% 74% Spec 1 43% 81% 45% 53% 51% 54% 44% 58% 48% Cutoff 2 0.205 1.27 0.213 0.233 0.291 0.259 0.211 0.196 0.233 Sens 2 81% 88% 80% 81% 85% 81% 81% 85% 83% Spec 2 36% 79% 37% 41% 45% 44% 38% 32% 41% Cutoff 3 0.129 0.187 0.129 0.153 0.209 0.185 0.0772 0.0773 0.211 Sens 3 92% 100% 91% 92% 92% 91% 93% 92% 91% Spec 3 25% 31% 24% 28% 35% 33% 18% 17% 37% Cutoff 4 0.683 0.776 0.737 0.683 0.776 0.737 0.683 0.776 0.737 Sens 4 53% 88% 51% 52% 62% 53% 41% 62% 39% Spec 4 70% 70% 70% 70% 70% 70% 70% 70% 70% Cutoff 5 1.04 1.31 1.20 1.04 1.31 1.20 1.04 1.31 1.20 Sens 5 42% 75% 34% 42% 38% 42% 30% 54% 30% Spec 5 80% 80% 80% 80% 80% 80% 80% 80% 80% Cutoff 6 2.87 3.32 2.89 2.87 3.32 2.89 2.87 3.32 2.89 Sens 6 19% 50% 20% 27% 38% 28% 11% 31% 9% Spec 6 90% 90% 90% 90% 90% 90% 90% 90% 90% OR Quart 2 2.3 >1.0 2.3 2.6 2.0 3.1 1.5 0.50 2.6 p Value 0.17 <1.0 0.17 0.12 0.57 0.092 0.52 0.57 0.27 95% CI of 0.70 >0.062 0.70 0.79 0.18 0.83 0.42 0.045 0.49 OR Quart 2 7.6 na 7.7 8.4 22 12 5.5 5.5 13 OR Quart 3 1.8 >0 2.1 3.1 2.0 4.3 2.0 1.5 3.6 p Value 0.36 <na 0.25 0.051 0.57 0.027 0.25 0.66 0.11 95% CI of 0.51 >na 0.61 0.99 0.18 1.2 0.61 0.25 0.74 OR Quart 3 6.2 na 7.0 9.9 22 15 6.9 9.1 18 OR Quart 4 4.3 >7.2 3.8 6.1 8.3 7.1 2.3 3.6 4.7 p Value 0.011 <0.066 0.022 0.0011 0.047 0.0020 0.17 0.11 0.050 95% CI of 1.4 >0.88 1.2 2.1 1.0 2.0 0.70 0.74 1.0 OR Quart 4 13 na 12 18 67 24 7.6 17 22
TABLE-US-00044 Apolipoprotein A-I 0 hr prior to AKI stage 24 hr prior to AKI stage 48 hr prior to AKI stage Cohort 1 Cohort 2 Cohort 1 Cohort 2 Cohort 1 Cohort 2 sCr or UO Median 327 312 327 606 327 330 Average 1240 1240 1240 2470 1240 641 Stdev 2750 2820 2750 4080 2750 805 p (t-test) 1.00 0.0041 0.25 Min 1.00E-9 1.00E-9 1.00E-9 1.00E-9 1.00E-9 1.00E-9 Max 12000 12000 12000 13100 12000 3230 n (Samp) 680 34 680 48 680 28 n (Patient) 279 34 279 48 279 28 sCr only Median 336 187 336 318 336 184 Average 1290 1880 1290 3100 1290 355 Stdev 2800 4150 2800 5100 2800 645 p (t-test) 0.56 0.023 0.23 Min 1.00E-9 16.3 1.00E-9 1.00E-9 1.00E-9 1.00E-9 Max 13100 12000 13100 12000 13100 2370 n (Samp) 881 8 881 13 881 13 n (Patient) 334 8 334 13 334 13 UO only Median 339 378 339 603 339 525 Average 1270 1350 1270 2180 1270 1080 Stdev 2740 2890 2740 3720 2740 2400 p (t-test) 0.87 0.041 0.73 Min 1.00E-9 1.00E-9 1.00E-9 1.00E-9 1.00E-9 1.00E-9 Max 12000 12000 12000 13100 12000 12000 n (Samp) 574 32 574 43 574 25 n (Patient) 207 32 207 43 207 25 0 hr prior to AKI stage 24 hr prior to AKI stage 48 hr prior to AKI stage sCr or UO sCr only UO only sCr or UO sCr only UO only sCr or UO sCr only UO only AUC 0.48 0.41 0.50 0.57 0.54 0.57 0.48 0.31 0.49 SE 0.051 0.11 0.053 0.044 0.082 0.047 0.056 0.082 0.059 p 0.72 0.41 0.96 0.098 0.63 0.14 0.70 0.022 0.88 nCohort 1 680 881 574 680 881 574 680 881 574 nCohort 2 34 8 32 48 13 43 28 13 25 Cutoff 1 179 72.5 179 230 175 230 178 24.9 134 Sens 1 71% 75% 72% 71% 77% 72% 71% 77% 72% Spec 1 34% 14% 34% 39% 33% 39% 34% 6% 25% Cutoff 2 40.3 40.3 68.2 70.7 159 98.3 65.7 17.2 70.7 Sens 2 82% 88% 81% 81% 85% 81% 82% 85% 80% Spec 2 8% 8% 13% 14% 31% 20% 13% 5% 14% Cutoff 3 22.3 16.3 28.3 0 27.1 6.53 33.8 0 42.0 Sens 3 91% 100% 91% 100% 92% 91% 93% 100% 92% Spec 3 5% 4% 6% 0% 6% 4% 7% 0% 9% Cutoff 4 677 711 718 677 711 718 677 711 718 Sens 4 29% 25% 34% 48% 38% 47% 21% 15% 24% Spec 4 70% 70% 70% 70% 70% 70% 70% 70% 70% Cutoff 5 1010 1070 1050 1010 1070 1050 1010 1070 1050 Sens 5 21% 25% 25% 33% 31% 33% 21% 8% 24% Spec 5 80% 80% 80% 80% 80% 80% 80% 80% 80% Cutoff 6 2190 2460 2410 2190 2460 2410 2190 2460 2410 Sens 6 9% 12% 6% 27% 23% 21% 7% 0% 8% Spec 6 90% 90% 90% 90% 90% 90% 90% 90% 90% OR Quart 2 0.69 0.50 0.86 0.57 2.5 0.69 1.3 2.0 1.2 p Value 0.47 0.57 0.78 0.24 0.27 0.46 0.59 0.57 0.78 95% CI of 0.26 0.045 0.30 0.22 0.48 0.25 0.46 0.18 0.39 OR Quart 2 1.9 5.6 2.4 1.5 13 1.9 4.0 22 3.6 OR Quart 3 0.89 1.0 1.0 0.91 1.0 1.1 1.0 4.1 0.83 p Value 0.81 1.00 1.0 0.83 1.0 0.82 1.0 0.21 0.76 95% CI of 0.35 0.14 0.37 0.39 0.14 0.46 0.32 0.45 0.25 OR Quart 3 2.3 7.2 2.7 2.1 7.2 2.7 3.2 37 2.8 OR Quart 4 0.80 1.5 1.1 1.6 2.0 1.5 1.3 6.2 1.2 p Value 0.64 0.65 0.81 0.26 0.42 0.31 0.59 0.093 0.77 95% CI of 0.31 0.25 0.42 0.73 0.36 0.67 0.46 0.74 0.39 OR Quart 4 2.1 9.1 3.0 3.3 11 3.5 4.0 52 3.6
TABLE-US-00045 Apolipoprotein B-100 0 hr prior to AKI stage 24 hr prior to AKI stage 48 hr prior to AKI stage Cohort 1 Cohort 2 Cohort 1 Cohort 2 Cohort 1 Cohort 2 sCr or UO Median 69.3 180 69.3 181 69.3 44.1 Average 211 427 211 368 211 160 Stdev 370 707 370 496 370 246 p (t-test) 0.0012 0.0056 0.47 Min 1.00E-9 1.00E-9 1.00E-9 1.00E-9 1.00E-9 1.00E-9 Max 2570 2890 2570 2780 2570 896 n (Samp) 694 37 694 48 694 28 n (Patient) 280 37 280 48 280 28 sCr only Median 72.3 264 72.3 180 72.3 209 Average 237 403 237 306 237 570 Stdev 433 484 433 382 433 963 p (t-test) 0.25 0.56 0.0072 Min 1.00E-9 1.00E-9 1.00E-9 1.00E-9 1.00E-9 1.00E-9 Max 3580 1230 3580 1450 3580 3510 n (Samp) 904 9 904 13 904 13 n (Patient) 336 9 336 13 336 13 UO only Median 74.8 180 74.8 193 74.8 44.5 Average 210 442 210 389 210 182 Stdev 357 724 357 515 357 255 p (t-test) 6.1E-4 0.0023 0.69 Min 1.00E-9 1.00E-9 1.00E-9 1.00E-9 1.00E-9 1.00E-9 Max 2570 2890 2570 2780 2570 896 n (Samp) 584 35 584 43 584 25 n (Patient) 208 35 208 43 208 25 0 hr prior to AKI stage 24 hr prior to AKI stage 48 hr prior to AKI stage sCr or UO sCr only UO only sCr or UO sCr only UO only sCr or UO sCr only UO only AUC 0.58 0.58 0.58 0.62 0.63 0.63 0.46 0.59 0.50 SE 0.050 0.10 0.052 0.044 0.084 0.047 0.057 0.084 0.059 p 0.12 0.45 0.11 0.0056 0.11 0.0053 0.49 0.28 0.98 nCohort 1 694 904 584 694 904 584 694 904 584 nCohort 2 37 9 35 48 13 43 28 13 25 Cutoff 1 33.9 30.4 38.4 75.2 114 75.2 30.3 26.5 32.0 Sens 1 70% 78% 71% 71% 77% 72% 71% 77% 72% Spec 1 34% 33% 36% 52% 61% 51% 33% 30% 33% Cutoff 2 23.7 4.70 27.2 21.3 44.4 21.2 14.4 14.4 30.3 Sens 2 81% 89% 80% 81% 85% 81% 82% 85% 80% Spec 2 29% 11% 29% 27% 40% 26% 21% 21% 32% Cutoff 3 1.15 0 5.68 4.07 5.68 4.63 3.20 3.29 12.6 Sens 3 92% 100% 91% 92% 92% 91% 93% 92% 92% Spec 3 5% 0% 12% 9% 12% 10% 8% 8% 18% Cutoff 4 165 180 179 165 180 179 165 180 179 Sens 4 51% 56% 51% 52% 54% 53% 25% 54% 28% Spec 4 70% 70% 70% 70% 70% 70% 70% 70% 70% Cutoff 5 289 321 301 289 321 301 289 321 301 Sens 5 30% 33% 29% 40% 31% 40% 18% 38% 20% Spec 5 80% 80% 80% 80% 80% 80% 80% 80% 80% Cutoff 6 596 664 572 596 664 572 596 664 572 Sens 6 22% 33% 23% 23% 8% 28% 11% 31% 12% Spec 6 90% 90% 90% 90% 90% 90% 90% 90% 90% OR Quart 2 1.1 1.0 1.5 0.54 0.50 0.61 0.80 1.0 2.9 p Value 0.80 1.0 0.44 0.28 0.57 0.39 0.74 1.0 0.075 95% CI of 0.41 0.14 0.53 0.18 0.045 0.19 0.21 0.20 0.90 OR Quart 2 3.2 7.2 4.4 1.6 5.5 1.9 3.0 5.0 9.3 OR Quart 3 0.99 0 1.2 1.6 2.0 1.4 2.5 0.33 1.0 p Value 0.99 na 0.79 0.29 0.42 0.49 0.092 0.34 1.0 95% CI of 0.34 na 0.38 0.68 0.37 0.55 0.86 0.034 0.25 OR Quart 3 2.9 na 3.6 3.8 11 3.6 7.2 3.2 4.1 OR Quart 4 2.2 2.5 2.3 2.4 3.0 2.5 1.4 2.0 1.5 p Value 0.088 0.27 0.11 0.039 0.18 0.033 0.55 0.33 0.53 95% CI of 0.89 0.48 0.84 1.0 0.61 1.1 0.44 0.50 0.42 OR Quart 4 5.6 13 6.1 5.3 15 6.0 4.6 8.2 5.5
TABLE-US-00046 Calcitonin 0 hr prior to AKI stage 24 hr prior to AKI stage 48 hr prior to AKI stage Cohort 1 Cohort 2 Cohort 1 Cohort 2 Cohort 1 Cohort 2 sCr or UO Median 85.6 115 85.6 108 85.6 80.5 Average 535 135 535 323 535 93.8 Stdev 3560 120 3560 787 3560 83.2 p (t-test) 0.57 0.73 0.61 Min 1.48 6.13 1.48 5.40 1.48 5.40 Max 38800 610 38800 4480 38800 349 n(Samp) 421 25 421 33 421 17 n (Patient) 165 25 165 33 165 17 sCr only Median nd nd 89.6 123 89.6 89.2 Average nd nd 472 776 472 138 Stdev nd nd 3240 1520 3240 207 p (t-test) nd nd 0.79 0.79 Min nd nd 1.48 21.0 1.48 7.79 Max nd nd 38800 4480 38800 600 n (Samp) nd nd 511 8 511 7 n (Patient) nd nd 198 8 198 7 UO only Median 84.8 114 84.8 98.4 84.8 82.2 Average 600 130 600 185 600 134 Stdev 3860 122 3860 252 3860 155 p (t-test) 0.54 0.56 0.62 Min 2.78 6.13 2.78 5.40 2.78 5.40 Max 38800 610 38800 1250 38800 649 n (Samp) 357 25 357 29 357 17 n (Patient) 135 25 135 29 135 17 0 hr prior to AKI stage 24 hr prior to AKI stage 48 hr prior to AKI stage sCr or UO sCr only UO only sCr or UO sCr only UO only sCr or UO sCr only UO only AUC 0.56 nd 0.55 0.58 0.62 0.57 0.44 0.42 0.51 SE 0.061 nd 0.061 0.054 0.11 0.057 0.073 0.11 0.072 p 0.30 nd 0.45 0.12 0.27 0.20 0.43 0.46 0.84 nCohort 1 421 nd 357 421 511 357 421 511 357 nCohort 2 25 nd 25 33 8 29 17 7 17 Cutoff 1 82.1 nd 56.6 75.3 89.6 74.9 52.0 51.3 55.5 Sens 1 72% nd 72% 73% 75% 72% 71% 71% 71% Spec 1 48% nd 35% 44% 50% 44% 30% 28% 34% Cutoff 2 56.6 nd 48.8 60.2 34.6 60.2 50.4 16.1 52.0 Sens 2 80% nd 80% 82% 88% 83% 82% 86% 82% Spec 2 34% nd 29% 37% 16% 37% 30% 7% 30% Cutoff 3 11.0 nd 11.0 19.0 20.3 18.3 6.00 7.43 6.00 Sens 3 92% nd 92% 91% 100% 93% 94% 100% 94% Spec 3 5% nd 5% 9% 9% 8% 2% 3% 2% Cutoff 4 138 nd 132 138 144 132 138 144 132 Sens 4 40% nd 40% 36% 38% 41% 24% 14% 35% Spec 4 70% nd 70% 70% 70% 70% 70% 70% 70% Cutoff 5 190 nd 180 190 194 180 190 194 180 Sens 5 16% nd 20% 27% 38% 24% 6% 14% 12% Spec 5 80% nd 80% 80% 80% 80% 80% 80% 80% Cutoff 6 302 nd 294 302 316 294 302 316 294 Sens 6 4% nd 4% 18% 38% 14% 6% 14% 12% Spec 6 90% nd 90% 90% 90% 90% 90% 90% 90% OR Quart 2 1.7 nd 1.2 1.2 0.49 1.8 1.4 2.0 3.7 p Value 0.48 nd 0.75 0.77 0.56 0.37 0.69 0.56 0.11 95% CI of 0.39 nd 0.33 0.36 0.044 0.51 0.30 0.18 0.74 OR Quart 2 7.2 nd 4.8 4.1 5.5 6.3 6.2 23 18 OR Quart 3 3.6 nd 1.5 2.6 0.99 2.4 2.4 2.0 2.0 p Value 0.059 nd 0.52 0.087 0.99 0.16 0.21 0.57 0.42 95% CI of 0.95 nd 0.42 0.87 0.14 0.71 0.61 0.18 0.37 OR Quart 3 13 nd 5.6 7.5 7.2 8.0 9.6 23 11 OR Quart 4 2.4 nd 2.6 2.1 1.5 2.4 1.0 2.0 2.0 p Value 0.21 nd 0.11 0.20 0.66 0.17 0.99 0.56 0.42 95% CI of 0.60 nd 0.80 0.69 0.25 0.70 0.20 0.18 0.36 OR Quart 4 9.5 nd 8.8 6.3 9.1 7.9 5.1 23 11
TABLE-US-00047 C-reactive protein 0 hr prior to AKI stage 24 hr prior to AKI stage 48 hr prior to AKI stage Cohort 1 Cohort 2 Cohort 1 Cohort 2 Cohort 1 Cohort 2 sCr or UO Median 8.73 18.4 8.73 30.4 8.73 13.0 Average 18.5 26.9 18.5 27.5 18.5 30.1 Stdev 24.1 32.3 24.1 21.9 24.1 41.5 p (t-test) 0.048 0.012 0.019 Min 1.00E-9 0.00556 1.00E-9 0.0366 1.00E-9 0.0159 Max 259 141 259 87.5 259 162 n (Samp) 687 36 687 48 687 27 n (Patient) 280 36 280 48 280 27 sCr only Median 9.65 30.4 9.65 30.4 9.65 5.22 Average 19.1 37.9 19.1 35.3 19.1 28.6 Stdev 23.7 46.7 23.7 28.7 23.7 39.8 p (t-test) 0.028 0.015 0.16 Min 1.00E-9 0.00556 1.00E-9 0.0442 1.00E-9 0.0806 Max 259 141 259 104 259 142 n (Samp) 896 8 896 13 896 13 n (Patient) 336 8 336 13 336 13 UO only Median 10.3 25.2 10.3 30.4 10.3 24.6 Average 19.0 29.6 19.0 29.8 19.0 29.8 Stdev 23.7 32.6 23.7 22.2 23.7 36.6 p (t-test) 0.012 0.0038 0.036 Min 1.00E-9 0.0124 1.00E-9 0.0366 1.00E-9 0.0108 Max 259 141 259 87.5 259 162 n (Samp) 578 35 578 43 578 23 n (Patient) 208 35 208 43 208 23 0 hr prior to AKI stage 24 hr prior to AKI stage 48 hr prior to AKI stage sCr or UO sCr only UO only sCr or UO sCr only UO only sCr or UO sCr only UO only AUC 0.55 0.57 0.58 0.62 0.66 0.65 0.55 0.54 0.57 SE 0.050 0.11 0.052 0.044 0.083 0.047 0.058 0.083 0.063 p 0.36 0.50 0.11 0.0064 0.051 0.0017 0.39 0.60 0.28 nCohort 1 687 896 578 687 896 578 687 896 578 nCohort 2 36 8 35 48 13 43 27 13 23 Cutoff 1 2.38 1.69 3.54 5.22 21.9 13.2 2.73 4.45 2.57 Sens 1 72% 75% 71% 71% 77% 72% 70% 77% 74% Spec 1 30% 26% 33% 41% 63% 54% 32% 38% 30% Cutoff 2 0.802 0.0106 1.65 2.21 5.26 2.40 0.706 0.623 0.689 Sens 2 81% 88% 80% 81% 85% 81% 81% 85% 83% Spec 2 18% 2% 25% 29% 41% 28% 17% 16% 17% Cutoff 3 0.0124 0.00496 0.401 0.468 0.200 0.731 0.401 0.251 0.401 Sens 3 92% 100% 91% 92% 92% 91% 93% 92% 91% Spec 3 2% 1% 13% 14% 9% 17% 13% 10% 13% Cutoff 4 29.4 30.4 30.4 29.4 30.4 30.4 29.4 30.4 30.4 Sens 4 42% 38% 37% 54% 38% 37% 37% 31% 35% Spec 4 70% 79% 80% 70% 79% 80% 70% 79% 80% Cutoff 5 30.4 32.5 30.7 30.4 32.5 30.7 30.4 32.5 30.7 Sens 5 33% 38% 37% 31% 38% 37% 33% 31% 35% Spec 5 80% 80% 80% 80% 80% 80% 80% 80% 80% Cutoff 6 48.3 51.5 48.0 48.3 51.5 48.0 48.3 51.5 48.0 Sens 6 22% 25% 29% 23% 31% 26% 19% 23% 17% Spec 6 90% 90% 90% 90% 90% 90% 90% 90% 90% OR Quart 2 0.88 0.50 0.87 0.65 0.50 0.70 0.85 1.3 0.49 p Value 0.79 0.57 0.79 0.43 0.57 0.56 0.77 0.70 0.32 95% CI of 0.33 0.045 0.31 0.23 0.045 0.22 0.28 0.30 0.12 OR Quart 2 2.3 5.5 2.5 1.9 5.5 2.3 2.6 6.1 2.0 OR Quart 3 0.43 1.0 0.87 1.6 2.5 1.3 0.71 0.66 1.0 p Value 0.17 1.0 0.79 0.29 0.27 0.61 0.56 0.66 1.0 95% CI of 0.13 0.14 0.31 0.67 0.49 0.47 0.22 0.11 0.32 OR Quart 3 1.4 7.2 2.5 3.8 13 3.6 2.3 4.0 3.2 OR Quart 4 1.7 1.5 1.7 2.2 2.5 3.5 1.3 1.3 1.3 p Value 0.21 0.66 0.27 0.056 0.27 0.0057 0.62 0.71 0.59 95% CI of 0.73 0.25 0.67 0.98 0.48 1.4 0.47 0.30 0.45 OR Quart 4 4.0 9.1 4.2 5.1 13 8.4 3.6 6.0 4.0
TABLE-US-00048 Tissue factor 0 hr prior to AKI stage 24 hr prior to AKI stage 48 hr prior to AKI stage Cohort 1 Cohort 2 Cohort 1 Cohort 2 Cohort 1 Cohort 2 sCr or UO Median 0.00336 0.00336 0.00336 0.00336 0.00336 0.00336 Average 0.0758 0.0582 0.0758 0.106 0.0758 0.0524 Stdev 0.135 0.112 0.135 0.209 0.135 0.0810 p (t-test) 0.52 0.25 0.48 Min 0.00336 0.00336 0.00336 0.00336 0.00336 0.00336 Max 0.917 0.500 0.917 0.896 0.917 0.240 n (Samp) 421 25 421 33 421 17 n (Patient) 165 25 165 33 165 17 sCr only Median nd nd 0.00336 0.0622 0.00336 0.00336 Average nd nd 0.0799 0.229 0.0799 0.0651 Stdev nd nd 0.143 0.381 0.143 0.0807 p (t-test) nd nd 0.0053 0.78 Min nd nd 0.00336 0.00336 0.00336 0.00336 Max nd nd 0.917 1.12 0.917 0.195 n (Samp) nd nd 511 8 511 7 n (Patient) nd nd 198 8 198 7 UO only Median 0.00336 0.00336 0.00336 0.00336 0.00336 0.00336 Average 0.0783 0.0582 0.0783 0.0960 0.0783 0.0712 Stdev 0.137 0.112 0.137 0.217 0.137 0.103 p (t-test) 0.48 0.52 0.84 Min 0.00336 0.00336 0.00336 0.00336 0.00336 0.00336 Max 0.917 0.500 0.917 0.896 0.917 0.324 n (Samp) 357 25 357 29 357 17 n (Patient) 135 25 135 29 135 17 0 hr prior to AKI stage 24 hr prior to AKI stage 48 hr prior to AKI stage sCr or UO sCr only UO only sCr or UO sCr only UO only sCr or UO sCr only UO only AUC 0.47 nd 0.47 0.52 0.62 0.49 0.48 0.52 0.51 SE 0.060 nd 0.061 0.053 0.11 0.056 0.072 0.11 0.072 p 0.66 nd 0.59 0.68 0.28 0.81 0.80 0.87 0.87 nCohort 1 421 nd 357 421 511 357 421 511 357 nCohort 2 25 nd 25 33 8 29 17 7 17 Cutoff 1 0 nd 0 0 0 0 0 0 0 Sens 1 100% nd 100% 100% 100% 100% 100% 100% 100% Spec 1 0% nd 0% 0% 0% 0% 0% 0% 0% Cutoff 2 0 nd 0 0 0 0 0 0 0 Sens 2 100% nd 100% 100% 100% 100% 100% 100% 100% Spec 2 0% nd 0% 0% 0% 0% 0% 0% 0% Cutoff 3 0 nd 0 0 0 0 0 0 0 Sens 3 100% nd 100% 100% 100% 100% 100% 100% 100% Spec 3 0% nd 0% 0% 0% 0% 0% 0% 0% Cutoff 4 0.114 nd 0.115 0.114 0.118 0.115 0.114 0.118 0.115 Sens 4 28% nd 28% 33% 50% 28% 29% 29% 35% Spec 4 70% nd 70% 70% 70% 70% 70% 70% 70% Cutoff 5 0.159 nd 0.160 0.159 0.163 0.160 0.159 0.163 0.160 Sens 5 8% nd 8% 21% 38% 17% 18% 14% 24% Spec 5 80% nd 81% 80% 80% 81% 80% 80% 81% Cutoff 6 0.238 nd 0.243 0.238 0.240 0.243 0.238 0.240 0.243 Sens 6 4% nd 4% 12% 38% 7% 6% 0% 6% Spec 6 90% nd 90% 90% 90% 90% 90% 90% 90% OR Quart 2 2.3 nd 0.16 >26 >4.1 0.27 1.4 >0 >8.7 p Value 0.097 nd 0.092 <0.0017 <0.21 0.11 0.54 <na <0.044 95% CI of 0.86 nd 0.019 >3.4 >0.45 0.055 0.44 >na >1.1 OR Quart 2 6.4 nd 1.4 na na 1.4 4.7 na na OR Quart 3 1.0 nd 3.5 >3.1 >1.0 2.2 1.0 >6.3 >4.2 p Value 1.0 nd 0.012 <0.33 <1.0 0.11 1.0 <0.091 <0.20 95% CI of 0.31 nd 1.3 >0.32 >0.062 0.83 0.28 >0.75 >0.46 OR Quart 3 3.2 nd 9.2 na na 5.6 3.6 na na OR Quart 4 0 nd 0 >9.7 >3.0 0.86 0 >1.0 >5.2 p Value na nd na <0.033 <0.34 0.79 na <1.0 <0.13 95% CI of na nd na >1.2 >0.31 0.28 na >0.062 >0.60 OR Quart 4 na nd na na na 2.7 na na na
TABLE-US-00049 Fibrinogen 0 hr prior to AKI stage 24 hr prior to AKI stage 48 hr prior to AKI stage Cohort 1 Cohort 2 Cohort 1 Cohort 2 Cohort 1 Cohort 2 sCr or UO Median 0.0950 0.0362 0.0950 0.165 0.0950 0.0805 Average 40.5 23.0 40.5 6.27 40.5 0.177 Stdev 733 126 733 31.8 733 0.281 p (t-test) 0.89 0.75 0.78 Min 1.00E-9 1.00E-9 1.00E-9 1.00E-9 1.00E-9 1.00E-9 Max 13600 754 13600 219 13600 1.38 n (Samp) 687 36 687 48 687 27 n (Patient) 280 36 280 48 280 27 sCr only Median 0.103 0.263 0.103 0.314 0.103 0.129 Average 31.6 94.6 31.6 2.53 31.6 0.225 Stdev 642 267 642 6.04 642 0.353 p (t-test) 0.78 0.87 0.86 Min 1.00E-9 1.00E-9 1.00E-9 1.00E-9 1.00E-9 1.00E-9 Max 13600 754 13600 21.2 13600 1.28 n (Samp) 896 8 896 13 896 13 n (Patient) 336 8 336 13 336 13 UO only Median 0.0984 0.0303 0.0984 0.193 0.0984 0.106 Average 24.4 23.7 24.4 6.96 24.4 0.242 Stdev 565 127 565 33.5 565 0.357 p (t-test) 0.99 0.84 0.84 Min 1.00E-9 1.00E-9 1.00E-9 1.00E-9 1.00E-9 1.00E-9 Max 13600 754 13600 219 13600 1.38 n (Samp) 578 35 578 43 578 23 n (Patient) 208 35 208 43 208 23 0 hr prior to AKI stage 24 hr prior to AKI stage 48 hr prior to AKI stage sCr or UO sCr only UO only sCr or UO sCr only UO only sCr or UO sCr only UO only AUC 0.45 0.55 0.44 0.56 0.55 0.57 0.45 0.44 0.50 SE 0.051 0.11 0.052 0.044 0.083 0.047 0.058 0.083 0.061 p 0.33 0.63 0.24 0.19 0.53 0.16 0.39 0.45 0.99 nCohort 1 687 896 578 687 896 578 687 896 578 nCohort 2 36 8 35 48 13 43 27 13 23 Cutoff 1 0 0.0100 0 0.0328 0.00292 0.0463 0.0218 0 0.0267 Sens 1 100% 75% 100% 71% 77% 72% 70% 100% 74% Spec 1 0% 22% 0% 33% 19% 38% 28% 0% 30% Cutoff 2 0 0 0 0 0 0 0 0 0.0174 Sens 2 100% 100% 100% 100% 100% 100% 100% 100% 83% Spec 2 0% 0% 0% 0% 0% 0% 0% 0% 25% Cutoff 3 0 0 0 0 0 0 0 0 0 Sens 3 100% 100% 100% 100% 100% 100% 100% 100% 100% Spec 3 0% 0% 0% 0% 0% 0% 0% 0% 0% Cutoff 4 0.250 0.302 0.288 0.250 0.302 0.288 0.250 0.302 0.288 Sens 4 36% 38% 34% 40% 54% 40% 26% 15% 22% Spec 4 70% 70% 70% 70% 70% 70% 70% 70% 70% Cutoff 5 0.464 0.564 0.551 0.464 0.564 0.551 0.464 0.564 0.551 Sens 5 25% 25% 26% 33% 31% 33% 7% 8% 13% Spec 5 80% 80% 80% 80% 80% 80% 80% 80% 80% Cutoff 6 1.39 1.76 1.49 1.39 1.76 1.49 1.39 1.76 1.49 Sens 6 11% 12% 11% 19% 15% 21% 0% 0% 0% Spec 6 90% 90% 90% 90% 90% 90% 90% 90% 90% OR Quart 2 0.44 0 0.49 0.52 0.50 0.69 2.3 2.5 2.1 p Value 0.13 na 0.20 0.17 0.42 0.46 0.17 0.27 0.24 95% CI of 0.15 na 0.16 0.20 0.090 0.25 0.70 0.49 0.61 OR Quart 2 1.3 na 1.5 1.3 2.7 1.9 7.7 13 7.0 OR Quart 3 0.44 0.66 0.59 0.83 0.25 1.1 1.8 0.50 1.8 p Value 0.13 0.66 0.32 0.66 0.21 0.82 0.36 0.57 0.36 95% CI of 0.15 0.11 0.21 0.36 0.027 0.46 0.51 0.045 0.52 OR Quart 3 1.3 4.0 1.7 1.9 2.2 2.7 6.2 5.6 6.3 OR Quart 4 1.4 1.0 1.5 1.3 1.5 1.5 1.8 2.5 1.0 p Value 0.41 1.0 0.39 0.46 0.53 0.31 0.36 0.27 0.99 95% CI of 0.63 0.20 0.62 0.63 0.42 0.67 0.51 0.49 0.25 OR Quart 4 3.1 5.0 3.4 2.8 5.4 3.5 6.2 13 4.1
TABLE-US-00050 Interleukin-5 0 hr prior to AKI stage 24 hr prior to AKI stage 48 hr prior to AKI stage Cohort 1 Cohort 2 Cohort 1 Cohort 2 Cohort 1 Cohort 2 sCr or UO Median 0.0840 0.0895 0.0840 0.0581 0.0840 0.101 Average 0.530 0.392 0.530 0.222 0.530 0.285 Stdev 1.73 1.47 1.73 0.729 1.73 0.753 p (t-test) 0.63 0.22 0.46 Min 1.00E-9 1.00E-9 1.00E-9 1.00E-9 1.00E-9 1.00E-9 Max 20.2 9.00 20.2 5.03 20.2 4.00 n (Samp) 695 37 695 48 695 28 n (Patient) 281 37 281 48 281 28 sCr only Median 0.0819 0.0559 0.0819 0.0823 0.0819 0.0761 Average 0.478 0.0979 0.478 0.181 0.478 0.123 Stdev 1.58 0.109 1.58 0.328 1.58 0.164 p (t-test) 0.47 0.50 0.42 Min 1.00E-9 1.00E-9 1.00E-9 1.00E-9 1.00E-9 1.00E-9 Max 20.2 0.273 20.2 1.21 20.2 0.535 n (Samp) 905 9 905 13 905 13 n (Patient) 337 9 337 13 337 13 UO only Median 0.0916 0.0895 0.0916 0.0595 0.0916 0.0926 Average 0.989 0.407 0.989 0.237 0.989 0.277 Stdev 5.85 1.51 5.85 0.768 5.85 0.797 p (t-test) 0.56 0.40 0.54 Min 1.00E-9 1.00E-9 1.00E-9 1.00E-9 1.00E-9 1.00E-9 Max 83.3 9.00 83.3 5.03 83.3 4.00 n (Samp) 585 35 585 43 585 25 n (Patient) 209 35 209 43 209 25 0 hr prior to AKI stage 24 hr prior to AKI stage 48 hr prior to AKI stage sCr or UO sCr only UO only sCr or UO sCr only UO only sCr or UO sCr only UO only AUC 0.46 0.41 0.44 0.43 0.46 0.42 0.48 0.44 0.42 SE 0.050 0.10 0.052 0.044 0.082 0.047 0.056 0.083 0.061 p 0.37 0.38 0.25 0.097 0.61 0.073 0.69 0.44 0.18 nCohort 1 695 905 585 695 905 585 695 905 585 nCohort 2 37 9 35 48 13 43 28 13 25 Cutoff 1 0 0 0 0.00916 0.00948 0.00878 0.0204 1.00E-9 0 Sens 1 100% 100% 100% 73% 77% 72% 71% 77% 100% Spec 1 0% 0% 0% 22% 23% 21% 25% 20% 0% Cutoff 2 0 0 0 0 0 0 0 0 0 Sens 2 100% 100% 100% 100% 100% 100% 100% 100% 100% Spec 2 0% 0% 0% 0% 0% 0% 0% 0% 0% Cutoff 3 0 0 0 0 0 0 0 0 0 Sens 3 100% 100% 100% 100% 100% 100% 100% 100% 100% Spec 3 0% 0% 0% 0% 0% 0% 0% 0% 0% Cutoff 4 0.190 0.172 0.215 0.190 0.172 0.215 0.190 0.172 0.215 Sens 4 32% 22% 23% 25% 23% 23% 25% 23% 20% Spec 4 70% 70% 70% 70% 70% 70% 70% 70% 70% Cutoff 5 0.388 0.342 0.437 0.388 0.342 0.437 0.388 0.342 0.437 Sens 5 11% 0% 11% 12% 8% 9% 14% 15% 8% Spec 5 80% 80% 80% 80% 80% 80% 80% 80% 80% Cutoff 6 1.22 0.995 1.43 1.22 0.995 1.43 1.22 0.995 1.43 Sens 6 3% 0% 3% 2% 8% 2% 4% 0% 4% Spec 6 90% 90% 90% 90% 90% 90% 90% 90% 90% OR Quart 2 1.8 3.0 2.5 0.89 1.3 1.2 1.7 0.67 2.3 p Value 0.24 0.34 0.090 0.81 0.70 0.79 0.31 0.66 0.16 95% CI of 0.68 0.31 0.87 0.36 0.30 0.41 0.61 0.11 0.71 OR Quart 2 4.6 29 7.3 2.3 6.1 3.3 4.8 4.0 7.8 OR Quart 3 0.56 1.0 1.0 1.3 0.66 1.8 0.83 1.0 0.49 p Value 0.36 1.0 1.0 0.52 0.66 0.24 0.76 1.0 0.42 95% CI of 0.16 0.062 0.28 0.56 0.11 0.68 0.25 0.20 0.089 OR Quart 3 2.0 16 3.5 3.1 4.0 4.6 2.8 5.0 2.7 OR Quart 4 2.1 4.1 2.7 1.7 1.3 2.4 1.2 1.7 2.6 p Value 0.12 0.21 0.061 0.22 0.70 0.058 0.77 0.48 0.11 95% CI of 0.82 0.45 0.95 0.74 0.30 0.97 0.39 0.40 0.80 OR Quart 4 5.3 37 7.9 3.8 6.1 6.1 3.6 7.2 8.6
TABLE-US-00051 Interleukin-6 receptor subunit beta 0 hr prior to AKI stage 24 hr prior to AKI stage 48 hr prior to AKI stage Cohort 1 Cohort 2 Cohort 1 Cohort 2 Cohort 1 Cohort 2 sCr or UO Median 11900 15200 11900 18700 11900 12200 Average 14000 15200 14000 34800 14000 14900 Stdev 10600 7710 10600 57200 10600 12600 p (t-test) 0.61 5.1E-7 0.76 Min 344 1090 344 1830 344 1290 Max 70000 35600 70000 323000 70000 44000 n (Samp) 249 22 249 32 249 17 n (Patient) 160 22 160 32 160 17 sCr only Median nd nd 12800 14400 12800 13500 Average nd nd 16100 19200 16100 25600 Stdev nd nd 20800 14900 20800 37800 p (t-test) nd nd 0.71 0.24 Min nd nd 344 9280 344 2180 Max nd nd 323000 48600 323000 110000 n (Samp) nd nd 316 6 316 7 n (Patient) nd nd 187 6 187 7 UO only Median 12600 15700 12600 20400 12600 12800 Average 14500 15700 14500 37300 14500 16600 Stdev 10700 7670 10700 59700 10700 12300 p (t-test) 0.61 6.3E-7 0.45 Min 344 1090 344 1830 344 1290 Max 70000 35600 70000 323000 70000 44000 n (Samp) 218 22 218 29 218 16 n (Patient) 134 22 134 29 134 16 0 hr prior to AKI stage 24 hr prior to AKI stage 48 hr prior to AKI stage sCr or UO sCr only UO only sCr or UO sCr only UO only sCr or UO sCr only UO only AUC 0.58 nd 0.59 0.68 0.60 0.69 0.49 0.51 0.55 SE 0.066 nd 0.066 0.055 0.12 0.057 0.073 0.11 0.076 p 0.20 nd 0.20 0.0011 0.42 0.0011 0.93 0.90 0.55 nCohort 1 249 nd 218 249 316 218 249 316 218 nCohort 2 22 nd 22 32 6 29 17 7 16 Cutoff 1 11500 nd 11800 13100 9320 14300 6810 9290 8990 Sens 1 73% nd 73% 72% 83% 72% 71% 71% 75% Spec 1 49% nd 48% 54% 39% 59% 28% 38% 39% Cutoff 2 8990 nd 11200 8990 9320 7850 5250 5250 6860 Sens 2 82% nd 82% 81% 83% 83% 82% 86% 81% Spec 2 41% nd 46% 41% 39% 32% 20% 18% 25% Cutoff 3 6810 nd 6860 5680 8990 5140 2050 2050 2940 Sens 3 91% nd 91% 91% 100% 93% 94% 100% 94% Spec 3 28% nd 25% 22% 38% 16% 4% 4% 7% Cutoff 4 17000 nd 17900 17000 18100 17900 17000 18100 17900 Sens 4 36% nd 27% 53% 33% 59% 29% 43% 38% Spec 4 70% nd 70% 70% 70% 70% 70% 70% 70% Cutoff 5 21100 nd 21900 21100 23100 21900 21100 23100 21900 Sens 5 14% nd 18% 41% 17% 48% 24% 14% 25% Spec 5 80% nd 80% 80% 80% 80% 80% 80% 80% Cutoff 6 27700 nd 27700 27700 29700 27700 27700 29700 27700 Sens 6 5% nd 5% 34% 17% 38% 12% 14% 12% Spec 6 90% nd 90% 90% 90% 90% 90% 90% 90% OR Quart 2 3.1 nd 1.4 1.3 >3.1 0.57 1.3 0.49 1.7 p Value 0.17 nd 0.70 0.73 <0.33 0.46 0.71 0.56 0.48 95% CI of 0.61 nd 0.29 0.33 >0.31 0.13 0.33 0.043 0.39 OR Quart 2 16 nd 6.3 4.9 na 2.5 5.0 5.5 7.5 OR Quart 3 5.0 nd 3.8 2.4 >2.1 1.4 0.74 0.99 1.0 p Value 0.046 nd 0.052 0.16 <0.56 0.56 0.70 0.99 1.0 95% CI of 1.0 nd 0.99 0.71 >0.18 0.43 0.16 0.14 0.19 OR Quart 3 24 nd 15 8.3 na 4.8 3.4 7.2 5.2 OR Quart 4 2.6 nd 1.7 4.1 >1.0 3.3 1.3 0.99 1.7 p Value 0.27 nd 0.47 0.019 <1.0 0.034 0.71 0.99 0.48 95% CI of 0.48 nd 0.39 1.3 >0.061 1.1 0.33 0.14 0.39 OR Quart 4 14 nd 7.6 13 na 9.7 5.0 7.2 7.5
TABLE-US-00052 Macrophage metalloelastase 0 hr prior to AKI stage 24 hr prior to AKI stage 48 hr prior to AKI stage Cohort 1 Cohort 2 Cohort 1 Cohort 2 Cohort 1 Cohort 2 sCr or UO Median 1.00E-9 0.373 1.00E-9 1.67 1.00E-9 3.57 Average 3.58 2.56 3.58 5.41 3.58 4.29 Stdev 9.20 3.80 9.20 9.85 9.20 5.08 p (t-test) 0.60 0.30 0.75 Min 1.00E-9 1.00E-9 1.00E-9 1.00E-9 1.00E-9 1.00E-9 Max 84.4 11.7 84.4 49.5 84.4 18.6 n (Samp) 246 22 246 32 246 17 n (Patient) 159 22 159 32 159 17 sCr only Median nd nd 1.00E-9 1.79 1.00E-9 3.57 Average nd nd 3.71 6.25 3.71 4.49 Stdev nd nd 8.82 11.4 8.82 4.43 p (t-test) nd nd 0.49 0.82 Min nd nd 1.00E-9 1.00E-9 1.00E-9 1.00E-9 Max nd nd 84.4 29.1 84.4 11.7 n (Samp) nd nd 314 6 314 7 n (Patient) nd nd 186 6 186 7 UO only Median 1.00E-9 0.373 1.00E-9 0.747 1.00E-9 2.78 Average 3.71 2.56 3.71 5.68 3.71 4.29 Stdev 9.59 3.80 9.59 10.3 9.59 5.28 p (t-test) 0.58 0.30 0.81 Min 1.00E-9 1.00E-9 1.00E-9 1.00E-9 1.00E-9 1.00E-9 Max 84.4 11.7 84.4 49.5 84.4 18.6 n (Samp) 216 22 216 29 216 16 n (Patient) 133 22 133 29 133 16 0 hr prior to AKI stage 24 hr prior to AKI stage 48 hr prior to AKI stage sCr or UO sCr only UO only sCr or UO sCr only UO only sCr or UO sCr only UO only AUC 0.53 nd 0.53 0.58 0.55 0.58 0.63 0.68 0.60 SE 0.065 nd 0.066 0.056 0.12 0.059 0.075 0.11 0.077 p 0.61 nd 0.66 0.13 0.70 0.18 0.078 0.10 0.18 nCohort 1 246 nd 216 246 314 216 246 314 216 nCohort 2 22 nd 22 32 6 29 17 7 16 Cutoff 1 0 nd 0 0 0 0 0 1.00E-9 0 Sens 1 100% nd 100% 100% 100% 100% 100% 86% 100% Spec 1 0% nd 0% 0% 0% 0% 0% 57% 0% Cutoff 2 0 nd 0 0 0 0 0 1.00E-9 0 Sens 2 100% nd 100% 100% 100% 100% 100% 86% 100% Spec 2 0% nd 0% 0% 0% 0% 0% 57% 0% Cutoff 3 0 nd 0 0 0 0 0 0 0 Sens 3 100% nd 100% 100% 100% 100% 100% 100% 100% Spec 3 0% nd 0% 0% 0% 0% 0% 0% 0% Cutoff 4 3.57 nd 3.57 3.57 3.57 3.57 3.57 3.57 3.57 Sens 4 23% nd 23% 34% 33% 34% 47% 43% 50% Spec 4 75% nd 75% 75% 73% 75% 75% 73% 75% Cutoff 5 5.00 nd 5.00 5.00 5.00 5.00 5.00 5.00 5.00 Sens 5 18% nd 18% 25% 17% 28% 35% 43% 38% Spec 5 86% nd 87% 86% 83% 87% 86% 83% 87% Cutoff 6 12.5 nd 12.5 12.5 11.7 12.5 12.5 11.7 12.5 Sens 6 0% nd 0% 9% 17% 10% 6% 0% 6% Spec 6 90% nd 90% 90% 91% 90% 90% 91% 90% OR Quart 2 0 nd 2.6 0.46 >3.1 0.54 0 >1.0 0 p Value na nd 0.27 0.23 <0.33 0.35 na <0.99 na 95% CI of na nd 0.48 0.13 >0.32 0.15 na >0.062 na OR Quart 2 na nd 14 1.6 na 2.0 na na na OR Quart 3 0.50 nd 5.8 1.1 >2.1 1.2 0.47 >3.1 0.13 p Value 0.20 nd 0.027 0.80 <0.56 0.78 0.30 <0.33 0.058 95% CI of 0.17 nd 1.2 0.41 >0.18 0.39 0.11 >0.32 0.015 OR Quart 3 1.4 nd 28 3.2 na 3.4 2.0 na 1.1 OR Quart 4 0.41 nd 2.6 1.4 >1.0 1.5 1.4 >3.1 1.2 p Value 0.12 nd 0.27 0.48 <0.99 0.46 0.59 <0.33 0.78 95% CI of 0.13 nd 0.48 0.53 >0.062 0.53 0.44 >0.31 0.39 OR Quart 4 1.3 nd 14 3.8 na 4.2 4.2 na 3.5
TABLE-US-00053 Sex hormone-binding globulin 0 hr prior to AKI stage 24 hr prior to AKI stage 48 hr prior to AKI stage Cohort 1 Cohort 2 Cohort 1 Cohort 2 Cohort 1 Cohort 2 sCr or UO Median 0.0182 0.0170 0.0182 0.0238 0.0182 0.0236 Average 0.0552 0.0252 0.0552 0.562 0.0552 0.0711 Stdev 0.132 0.0246 0.132 2.44 0.132 0.147 p (t-test) 0.26 2.8E-5 0.63 Min 5.20E-6 0.000295 5.20E-6 0.00104 5.20E-6 0.00164 Max 1.57 0.0990 1.57 14.0 1.57 0.626 n (Samp) 421 25 421 33 421 17 n (Patient) 165 25 165 33 165 17 sCr only Median nd nd 0.0191 0.0176 0.0191 0.0323 Average nd nd 0.0836 0.0657 0.0836 0.357 Stdev nd nd 0.630 0.0945 0.630 0.824 p (t-test) nd nd 0.94 0.26 Min nd nd 5.20E-6 0.00589 5.20E-6 0.00630 Max nd nd 14.0 0.269 14.0 2.22 n (Samp) nd nd 511 8 511 7 n (Patient) nd nd 198 8 198 7 UO only Median 0.0192 0.0166 0.0192 0.0238 0.0192 0.0236 Average 0.0567 0.0245 0.0567 0.624 0.0567 0.0794 Stdev 0.139 0.0244 0.139 2.61 0.139 0.147 p (t-test) 0.25 5.0E-5 0.51 Min 5.20E-6 0.000295 5.20E-6 0.00104 5.20E-6 0.00164 Max 1.57 0.0990 1.57 14.0 1.57 0.626 n (Samp) 357 25 357 29 357 17 n (Patient) 135 25 135 29 135 17 0 hr prior to AKI stage 24 hr prior to AKI stage 48 hr prior to AKI stage sCr or UO sCr only UO only sCr or UO sCr only UO only sCr or UO sCr only UO only AUC 0.48 nd 0.47 0.60 0.56 0.59 0.58 0.61 0.61 SE 0.060 nd 0.061 0.054 0.11 0.057 0.074 0.11 0.074 p 0.76 nd 0.60 0.052 0.56 0.11 0.30 0.35 0.13 nCohort 1 421 nd 357 421 511 357 421 511 357 nCohort 2 25 nd 25 33 8 29 17 7 17 Cutoff 1 0.00809 nd 0.00769 0.0129 0.00991 0.0130 0.0147 0.0133 0.0186 Sens 1 72% nd 72% 73% 75% 72% 71% 71% 71% Spec 1 33% nd 31% 41% 35% 41% 44% 40% 50% Cutoff 2 0.00693 nd 0.00636 0.00935 0.00935 0.00511 0.00681 0.00681 0.0147 Sens 2 80% nd 80% 82% 88% 83% 82% 86% 82% Spec 2 32% nd 30% 35% 34% 26% 31% 29% 43% Cutoff 3 0.00280 nd 0.00280 0.00356 0.00559 0.00205 0.00559 0.00621 0.00559 Sens 3 92% nd 92% 91% 100% 93% 94% 100% 94% Spec 3 19% nd 18% 21% 27% 15% 29% 28% 28% Cutoff 4 0.0390 nd 0.0390 0.0390 0.0406 0.0390 0.0390 0.0406 0.0390 Sens 4 28% nd 24% 48% 38% 48% 35% 43% 41% Spec 4 70% nd 70% 70% 70% 70% 70% 70% 70% Cutoff 5 0.0697 nd 0.0613 0.0697 0.0715 0.0613 0.0697 0.0715 0.0613 Sens 5 8% nd 8% 36% 25% 38% 24% 29% 35% Spec 5 80% nd 80% 80% 80% 80% 80% 80% 80% Cutoff 6 0.122 nd 0.122 0.122 0.126 0.122 0.122 0.126 0.122 Sens 6 0% nd 0% 18% 25% 14% 12% 29% 18% Spec 6 90% nd 90% 90% 90% 90% 90% 90% 90% OR Quart 2 1.2 nd 1.8 1.9 >4.1 1.4 5.1 >3.0 5.2 p Value 0.75 nd 0.35 0.28 <0.21 0.57 0.14 <0.34 0.14 95% CI of 0.36 nd 0.52 0.60 >0.45 0.43 0.59 >0.31 0.59 OR Quart 2 4.1 nd 6.5 5.7 na 4.6 45 na 45 OR Quart 3 1.9 nd 2.4 1.2 >2.0 1.2 5.2 >2.0 4.1 p Value 0.28 nd 0.16 0.76 <0.57 0.76 0.14 <0.56 0.21 95% CI of 0.61 nd 0.71 0.36 >0.18 0.36 0.60 >0.18 0.45 OR Quart 3 5.8 nd 8.0 4.1 na 4.1 45 na 38 OR Quart 4 1.0 nd 1.3 2.8 >2.0 2.3 6.2 >2.0 7.4 p Value 0.99 nd 0.72 0.060 <0.57 0.13 0.093 <0.57 0.064 95% CI of 0.28 nd 0.33 0.96 >0.18 0.78 0.74 >0.18 0.89 OR Quart 4 3.6 nd 4.9 8.1 na 7.0 53 na 61
TABLE-US-00054 Thrombopoietin 0 hr prior to AKI stage 24 hr prior to AKI stage 48 hr prior to AKI stage Cohort 1 Cohort 2 Cohort 1 Cohort 2 Cohort 1 Cohort 2 sCr or UO Median 0.583 0.726 0.583 0.575 0.583 0.688 Average 0.626 0.622 0.626 0.646 0.626 0.572 Stdev 0.417 0.489 0.417 0.388 0.417 0.366 p (t-test) 0.96 0.78 0.60 Min 0.0129 0.0129 0.0129 0.0129 0.0129 0.0129 Max 2.57 1.58 2.57 1.42 2.57 1.06 n (Samp) 421 25 421 33 421 17 n (Patient) 165 25 165 33 165 17 sCr only Median nd nd 0.583 0.736 0.583 0.958 Average nd nd 0.622 0.762 0.622 0.734 Stdev nd nd 0.419 0.472 0.419 0.505 p (t-test) nd nd 0.35 0.49 Min nd nd 0.0129 0.0129 0.0129 0.0129 Max nd nd 2.57 1.42 2.57 1.19 n (Samp) nd nd 511 8 511 7 n (Patient) nd nd 198 8 198 7 UO only Median 0.599 0.726 0.599 0.575 0.599 0.761 Average 0.642 0.598 0.642 0.669 0.642 0.669 Stdev 0.423 0.461 0.423 0.393 0.423 0.396 p (t-test) 0.62 0.74 0.79 Min 0.0129 0.0129 0.0129 0.0129 0.0129 0.0129 Max 2.57 1.58 2.57 1.41 2.57 1.27 n (Samp) 357 25 357 29 357 17 n (Patient) 135 25 135 29 135 17 0 hr prior to AKI stage 24 hr prior to AKI stage 48 hr prior to AKI stage sCr or UO sCr only UO only sCr or UO sCr only UO only sCr or UO sCr only UO only AUC 0.51 nd 0.49 0.52 0.60 0.52 0.49 0.61 0.55 SE 0.060 nd 0.060 0.053 0.11 0.056 0.072 0.11 0.073 p 0.93 nd 0.86 0.72 0.37 0.69 0.90 0.34 0.53 nCohort 1 421 nd 357 421 511 357 421 511 357 nCohort 2 25 nd 25 33 8 29 17 7 17 Cutoff 1 0.128 nd 0.128 0.462 0.484 0.462 0.484 0.818 0.493 Sens 1 72% nd 72% 73% 75% 72% 71% 71% 71% Spec 1 13% nd 11% 35% 36% 34% 36% 71% 39% Cutoff 2 0 nd 0 0.278 0.373 0.278 0.0994 0 0.265 Sens 2 100% nd 100% 85% 88% 86% 82% 100% 82% Spec 2 0% nd 0% 22% 32% 20% 11% 0% 20% Cutoff 3 0 nd 0 0.127 0 0.127 0 0 0 Sens 3 100% nd 100% 91% 100% 93% 100% 100% 100% Spec 3 0% nd 0% 12% 0% 11% 0% 0% 0% Cutoff 4 0.780 nd 0.797 0.780 0.807 0.797 0.780 0.807 0.797 Sens 4 44% nd 40% 36% 50% 38% 41% 71% 47% Spec 4 70% nd 70% 70% 70% 70% 70% 70% 70% Cutoff 5 0.955 nd 0.968 0.955 0.933 0.968 0.955 0.933 0.968 Sens 5 28% nd 24% 24% 38% 24% 12% 57% 24% Spec 5 80% nd 80% 80% 80% 80% 80% 80% 80% Cutoff 6 1.18 nd 1.25 1.18 1.16 1.25 1.18 1.16 1.25 Sens 6 16% nd 4% 12% 25% 7% 0% 14% 6% Spec 6 90% nd 91% 90% 91% 91% 90% 91% 91% OR Quart 2 0.35 nd 0.74 1.1 2.0 1.1 1.3 0 0.73 p Value 0.13 nd 0.59 0.82 0.57 0.80 0.72 na 0.69 95% CI of 0.091 nd 0.25 0.42 0.18 0.40 0.33 na 0.16 OR Quart 2 1.4 nd 2.2 3.0 22 3.3 4.9 na 3.4 OR Quart 3 0.74 nd 0.23 1.0 2.0 0.85 0.74 0.50 1.3 p Value 0.58 nd 0.071 1.0 0.57 0.77 0.70 0.57 0.73 95% CI of 0.25 nd 0.048 0.36 0.18 0.27 0.16 0.044 0.33 OR Quart 3 2.2 nd 1.1 2.8 22 2.6 3.4 5.5 4.9 OR Quart 4 0.99 nd 1.2 0.99 3.0 1.1 1.3 2.0 1.2 p Value 0.99 nd 0.78 0.99 0.34 0.80 0.72 0.42 0.75 95% CI of 0.36 nd 0.42 0.36 0.31 0.40 0.33 0.36 0.32 OR Quart 4 2.7 nd 3.1 2.7 29 3.3 4.9 11 4.8
[0159] FIG. 3: Comparison of marker levels in urine samples collected within 12 hours of reaching stage R from Cohort 1 (patients that reached, but did not progress beyond, RIFLE stage R) and from Cohort 2 (patients that reached RIFLE stage I or F).
TABLE-US-00055 Alpha-2 macroglobulin sCr or UO sCr only UO only Cohort 1 Cohort 2 Cohort 1 Cohort 2 Cohort 1 Cohort 2 Median 0.311 0.892 0.297 1.43 0.312 0.769 Average 3.22 1.84 1.66 2.47 3.60 1.86 Stdev 17.8 2.38 4.76 2.86 19.9 2.56 p (t-test) 0.66 0.62 0.67 Min 1.00E-9 0.0499 1.00E-9 0.0837 1.00E-9 0.0499 Max 155 10.8 25.6 9.09 155 10.8 n (Samp) 78 34 30 10 61 25 n (Patient) 78 34 30 10 61 25 At Enrollment sCr or UO sCr only UO only AUC 0.67 0.72 0.67 SE 0.058 0.10 0.067 p 0.0026 0.029 0.0099 nCohort 1 78 30 61 nCohort 2 34 10 25 Cutoff 1 0.459 1.01 0.459 Sens 1 71% 70% 72% Spec 1 63% 83% 59% Cutoff 2 0.210 0.528 0.351 Sens 2 82% 80% 80% Spec 2 40% 70% 54% Cutoff 3 0.147 0.156 0.184 Sens 3 91% 90% 92% Spec 3 15% 23% 25% Cutoff 4 0.700 0.528 0.776 Sens 4 53% 80% 48% Spec 4 71% 70% 70% Cutoff 5 1.07 0.835 1.23 Sens 5 47% 70% 44% Spec 5 81% 80% 80% Cutoff 6 2.83 2.79 2.83 Sens 6 18% 30% 16% Spec 6 91% 90% 90% OR Quart 2 0.44 0 1.3 p Value 0.28 na 0.73 95% CI of 0.098 na 0.26 OR Quart 2 2.0 na 6.8 OR Quart 3 2.0 1.7 3.0 p Value 0.24 0.61 0.16 95% CI of 0.62 0.22 0.65 OR Quart 3 6.7 13 14 OR Quart 4 4.2 4.0 6.0 p Value 0.016 0.17 0.018 95% CI of 1.3 0.55 1.4 OR Quart 4 14 29 26
TABLE-US-00056 C-reactive protein sCr or UO sCr only UO only Cohort 1 Cohort 2 Cohort 1 Cohort 2 Cohort 1 Cohort 2 Median 11.2 30.4 10.5 30.4 13.2 30.4 Average 19.1 27.7 19.1 32.8 19.2 31.0 Stdev 20.3 22.1 20.7 31.2 20.2 21.7 p (t-test) 0.045 0.12 0.019 Min 1.00E-9 0.182 1.00E-9 0.0442 1.00E-9 0.416 Max 64.5 87.5 61.4 104 64.5 87.5 n (Samp) 78 34 30 10 61 25 n (Patient) 78 34 30 10 61 25 At Enrollment sCr or UO sCr only UO only AUC 0.62 0.64 0.66 SE 0.059 0.11 0.068 p 0.040 0.20 0.019 nCohort 1 78 30 61 nCohort 2 34 10 25 Cutoff 1 6.36 29.3 27.5 Sens 1 71% 70% 72% Spec 1 46% 67% 67% Cutoff 2 1.09 1.45 6.36 Sens 2 82% 80% 80% Spec 2 26% 37% 46% Cutoff 3 0.731 0.727 1.07 Sens 3 91% 90% 92% Spec 3 23% 27% 25% Cutoff 4 30.4 30.4 30.4 Sens 4 32% 40% 36% Spec 4 76% 77% 74% Cutoff 5 38.2 33.8 38.2 Sens 5 26% 40% 32% Spec 5 81% 80% 80% Cutoff 6 56.0 49.1 48.3 Sens 6 3% 20% 24% Spec 6 94% 90% 90% OR Quart 2 0.65 0.44 0.67 p Value 0.52 0.54 0.63 95% CI of 0.18 0.034 0.13 OR Quart 2 2.4 5.9 3.4 OR Quart 3 1.9 1.7 3.9 p Value 0.26 0.61 0.056 95% CI of 0.62 0.22 0.97 OR Quart 3 6.1 13 15 OR Quart 4 1.9 2.7 2.4 p Value 0.26 0.34 0.21 95% CI of 0.62 0.36 0.60 OR Quart 4 6.1 20 9.8
TABLE-US-00057 Tissue factor sCr or UO sCr only UO only Cohort 1 Cohort 2 Cohort 1 Cohort 2 Cohort 1 Cohort 2 Median 0.00336 0.00336 0.00336 0.132 0.00336 0.00336 Average 0.103 0.0776 0.102 0.110 0.0996 0.0513 Stdev 0.142 0.0998 0.135 0.119 0.138 0.0854 p (t-test) 0.44 0.89 0.20 Min 0.00336 0.00336 0.00336 0.00336 0.00336 0.00336 Max 0.618 0.324 0.472 0.324 0.618 0.307 n (Samp) 52 23 18 7 43 16 n (Patient) 52 23 18 7 43 16 At Enrollment sCr or UO sCr only UO only AUC 0.47 0.54 0.40 SE 0.073 0.13 0.086 p 0.68 0.79 0.25 nCohort 1 52 18 43 nCohort 2 23 7 16 Cutoff 1 0 0 0 Sens 1 100% 100% 100% Spec 1 0% 0% 0% Cutoff 2 0 0 0 Sens 2 100% 100% 100% Spec 2 0% 0% 0% Cutoff 3 0 0 0 Sens 3 100% 100% 100% Spec 3 0% 0% 0% Cutoff 4 0.138 0.164 0.138 Sens 4 22% 29% 6% Spec 4 73% 72% 72% Cutoff 5 0.191 0.204 0.175 Sens 5 9% 14% 6% Spec 5 81% 83% 81% Cutoff 6 0.282 0.307 0.282 Sens 6 9% 14% 6% Spec 6 90% 94% 93% OR Quart 2 1.3 0.40 1.6 p Value 0.72 0.51 0.63 95% CI of 0.32 0.026 0.23 OR Quart 2 5.3 6.2 11 OR Quart 3 1.6 1.0 9.8 p Value 0.49 1.0 0.014 95% CI of 0.41 0.091 1.6 OR Quart 3 6.5 11 60 OR Quart 4 1.1 0.80 1.1 p Value 0.92 0.85 0.94 95% CI of 0.25 0.076 0.13 OR Quart 4 4.6 8.5 8.9
TABLE-US-00058 Fibrinogen sCr or UO sCr only UO only Cohort 1 Cohort 2 Cohort 1 Cohort 2 Cohort 1 Cohort 2 Median 0.0310 0.170 0.0759 0.246 0.0301 0.189 Average 0.768 0.939 0.305 0.364 0.875 1.13 Stdev 2.90 3.07 0.548 0.383 3.26 3.57 p (t-test) 0.78 0.75 0.75 Min 1.00E-9 1.00E-9 1.00E-9 1.00E-9 1.00E-9 1.00E-9 Max 18.0 18.0 2.14 1.17 18.0 18.0 n (Samp) 78 34 30 10 61 25 n (Patient) 78 34 30 10 61 25 At Enrollment sCr or UO sCr only UO only AUC 0.65 0.63 0.66 SE 0.058 0.11 0.067 p 0.0093 0.21 0.014 nCohort 1 78 30 61 nCohort 2 34 10 25 Cutoff 1 0.0582 0.136 0.0539 Sens 1 71% 70% 72% Spec 1 60% 63% 66% Cutoff 2 0.0359 0.0359 0.0456 Sens 2 82% 80% 80% Spec 2 54% 50% 59% Cutoff 3 0 0 0 Sens 3 100% 100% 100% Spec 3 0% 0% 0% Cutoff 4 0.161 0.210 0.143 Sens 4 50% 60% 52% Spec 4 71% 70% 70% Cutoff 5 0.448 0.415 0.340 Sens 5 29% 40% 32% Spec 5 81% 80% 80% Cutoff 6 1.36 0.658 0.833 Sens 6 12% 20% 24% Spec 6 91% 90% 90% OR Quart 2 1.3 2.2 0.95 p Value 0.72 0.54 0.95 95% CI of 0.31 0.17 0.17 OR Quart 2 5.5 30 5.3 OR Quart 3 6.0 3.9 5.5 p Value 0.0066 0.28 0.026 95% CI of 1.6 0.33 1.2 OR Quart 3 22 46 24 OR Quart 4 3.9 6.0 4.2 p Value 0.041 0.15 0.061 95% CI of 1.1 0.53 0.94 OR Quart 4 14 68 18
TABLE-US-00059 Intercellular adhesion molecule 3 sCr or UO sCr only UO only Cohort 1 Cohort 2 Cohort 1 Cohort 2 Cohort 1 Cohort 2 Median 0.00682 0.0112 0.00109 0.0191 0.00867 0.00971 Average 0.0126 0.0136 0.00807 0.0167 0.0150 0.0107 Stdev 0.0222 0.0106 0.0106 0.0116 0.0240 0.00845 p (t-test) 0.82 0.10 0.47 Min 1.00E-9 1.00E-9 1.00E-9 0.00111 1.00E-9 1.00E-9 Max 0.141 0.0391 0.0313 0.0307 0.141 0.0261 n (Samp) 52 24 18 6 43 17 n (Patient) 52 24 18 6 43 17 At Enrollment sCr or UO sCr only UO only AUC 0.62 0.76 0.52 SE 0.071 0.13 0.084 p 0.080 0.039 0.84 nCohort 1 52 18 43 nCohort 2 24 6 17 Cutoff 1 0.00651 0.00218 0.00457 Sens 1 71% 83% 71% Spec 1 50% 56% 40% Cutoff 2 0.00373 0.00218 0.00373 Sens 2 83% 83% 82% Spec 2 42% 56% 35% Cutoff 3 1.00E-9 1.00E-9 1.00E-9 Sens 3 92% 100% 94% Spec 3 23% 50% 14% Cutoff 4 0.0140 0.0134 0.0174 Sens 4 38% 67% 24% Spec 4 71% 72% 72% Cutoff 5 0.0186 0.0219 0.0188 Sens 5 29% 50% 18% Spec 5 83% 83% 81% Cutoff 6 0.0236 0.0236 0.0291 Sens 6 21% 33% 0% Spec 6 90% 94% 91% OR Quart 2 1.9 >3.0 2.0 p Value 0.43 <0.43 0.41 95% CI of 0.38 >0.20 0.38 OR Quart 2 9.4 na 11 OR Quart 3 4.8 >1.2 2.7 p Value 0.044 <0.91 0.24 95% CI of 1.0 >0.059 0.52 OR Quart 3 22 na 14 OR Quart 4 3.1 >6.0 1.0 p Value 0.15 <0.19 1.0 95% CI of 0.66 >0.42 0.17 OR Quart 4 15 na 6.0
TABLE-US-00060 Interleukin-5 sCr or UO sCr only UO only Cohort 1 Cohort 2 Cohort 1 Cohort 2 Cohort 1 Cohort 2 Median 0.0875 0.0752 0.0912 0.0618 0.0975 0.0645 Average 0.400 0.486 0.171 1.07 1.74 0.268 Stdev 1.26 1.24 0.245 1.88 10.1 0.799 p (t-test) 0.74 0.013 0.47 Min 1.00E-9 1.00E-9 1.00E-9 1.00E-9 1.00E-9 1.00E-9 Max 9.97 5.00 1.02 5.00 79.1 4.00 n (Samp) 79 34 30 10 62 25 n (Patient) 79 34 30 10 62 25 At Enrollment sCr or UO sCr only UO only AUC 0.45 0.49 0.37 SE 0.060 0.11 0.068 p 0.39 0.93 0.063 nCohort 1 79 30 62 nCohort 2 34 10 25 Cutoff 1 0.0271 0.00558 1.00E-9 Sens 1 71% 70% 72% Spec 1 18% 13% 13% Cutoff 2 0 1.00E-9 0 Sens 2 100% 80% 100% Spec 2 0% 13% 0% Cutoff 3 0 0 0 Sens 3 100% 100% 100% Spec 3 0% 0% 0% Cutoff 4 0.165 0.165 0.219 Sens 4 26% 40% 16% Spec 4 71% 70% 71% Cutoff 5 0.292 0.190 0.369 Sens 5 15% 40% 12% Spec 5 81% 80% 81% Cutoff 6 0.772 0.381 0.772 Sens 6 12% 30% 8% Spec 6 91% 90% 90% OR Quart 2 0.74 0 1.7 p Value 0.61 na 0.47 95% CI of 0.23 na 0.40 OR Quart 2 2.4 na 7.1 OR Quart 3 0.61 0.38 1.0 p Value 0.41 0.34 1.0 95% CI of 0.18 0.051 0.22 OR Quart 3 2.0 2.8 4.6 OR Quart 4 1.7 1.0 5.0 p Value 0.36 1.0 0.023 95% CI of 0.56 0.17 1.2 OR Quart 4 4.9 6.0 20
TABLE-US-00061 Thrombopoietin sCr or UO sCr only UO only Cohort Cohort Cohort Cohort Cohort Cohort 1 2 1 2 1 2 Median 0.618 0.527 0.566 0.688 0.599 0.594 Average 0.704 0.601 0.614 0.701 0.698 0.695 Stdev 0.487 0.388 0.391 0.306 0.510 0.443 p (t-test) 0.37 0.61 0.98 Min 0.0129 0.0129 0.0129 0.280 0.0129 0.0129 Max 2.57 1.42 1.48 1.08 2.57 1.42 n (Samp) 52 23 18 7 43 16 n (Patient) 52 23 18 7 43 16 At Enrollment sCr or UO sCr only UO only AUC 0.43 0.58 0.51 SE 0.073 0.13 0.086 p 0.37 0.57 0.88 nCohort 1 52 18 43 nCohort 2 23 7 16 Cutoff 1 0.280 0.509 0.468 Sens 1 74% 71% 75% Spec 1 15% 50% 30% Cutoff 2 0.177 0.352 0.177 Sens 2 83% 86% 81% Spec 2 15% 28% 16% Cutoff 3 0.0129 0.174 0.0129 Sens 3 96% 100% 94% Spec 3 12% 17% 12% Cutoff 4 0.845 0.712 0.845 Sens 4 26% 43% 38% Spec 4 71% 72% 72% Cutoff 5 1.07 0.973 1.07 Sens 5 17% 29% 31% Spec 5 81% 83% 81% Cutoff 6 1.24 1.16 1.31 Sens 6 4% 0% 6% Spec 6 90% 94% 91% OR Quart 2 1.0 2.5 0.91 p Value 1.0 0.51 0.91 95% CI of 0.24 0.16 0.18 OR Quart 2 4.2 39 4.6 OR Quart 3 1.3 1.0 0.62 p Value 0.72 1.0 0.59 95% CI of 0.32 0.048 0.11 OR Quart 3 5.3 21 3.5 OR Quart 4 1.8 3.8 1.2 p Value 0.42 0.32 0.78 95% CI of 0.44 0.27 0.26 OR Quart 4 7.2 51 6.1
[0160] FIG. 4: Comparison of the maximum marker levels in urine samples collected from Cohort 1 (patients that did not progress beyond RIFLE stage 0) and the maximum values in urine samples collected from subjects between enrollment and 0, 24 hours, and 48 hours prior to reaching stage F in Cohort 2.
TABLE-US-00062 Alpha-2 macroglobulin 0 hr prior to AKI stage 24 hr prior to AKI stage 48 hr prior to AKI stage Cohort 1 Cohort 2 Cohort 1 Cohort 2 Cohort 1 Cohort 2 sCr or UO Median 0.405 2.44 0.405 1.60 0.405 1.54 Average 7.61 42.7 7.61 42.4 7.61 1.92 Stdev 45.3 95.8 45.3 95.9 45.3 1.61 p (t-test) 0.0040 0.0043 0.68 Min 1.00E-9 0.0346 1.00E-9 0.0346 1.00E-9 0.198 Max 510 368 510 368 510 5.77 n (Samp) 189 21 189 21 189 11 n (Patient) 189 21 189 21 189 11 sCr only Median 0.590 2.44 0.590 1.54 0.590 1.57 Average 8.06 16.0 8.06 14.5 8.06 2.30 Stdev 43.1 39.4 43.1 39.6 43.1 2.45 p (t-test) 0.55 0.63 0.74 Min 1.00E-9 0.0346 1.00E-9 0.0346 1.00E-9 0.198 Max 510 133 510 133 510 6.88 n (Samp) 296 11 296 11 296 6 n (Patient) 296 11 296 11 296 6 UO only Median 0.429 3.05 0.429 3.05 0.429 1.13 Average 6.30 59.0 6.30 58.7 6.30 1.99 Stdev 31.3 110 31.3 110 31.3 1.79 p (t-test) 3.1E-5 3.5E-5 0.68 Min 1.00E-9 0.198 1.00E-9 0.198 1.00E-9 0.198 Max 235 368 235 368 235 5.77 n (Samp) 135 15 135 15 135 9 n (Patient) 135 15 135 15 135 9 0 hr prior to AKI stage 24 hr prior to AKI stage 48 hr prior to AKI stage sCr or UO sCr only UO only sCr or UO sCr only UO only sCr or UO sCr only UO only AUC 0.79 0.70 0.82 0.78 0.66 0.80 0.75 0.64 0.73 SE 0.061 0.090 0.068 0.062 0.091 0.070 0.087 0.12 0.098 p 1.9E-6 0.028 3.0E-6 8.1E-6 0.078 1.5E-5 0.0044 0.25 0.022 nCohort 1 189 296 135 189 296 135 189 296 135 nCohort 2 21 11 15 21 11 15 11 6 9 Cutoff 1 1.17 1.47 1.27 1.06 1.17 0.892 0.849 0.540 0.680 Sens 1 71% 73% 73% 71% 73% 73% 73% 83% 78% Spec 1 76% 72% 76% 75% 65% 71% 72% 47% 66% Cutoff 2 0.897 1.06 0.892 0.849 1.06 0.885 0.680 0.540 0.588 Sens 2 81% 82% 80% 81% 82% 80% 82% 83% 89% Spec 2 73% 64% 71% 72% 64% 71% 67% 47% 60% Cutoff 3 0.600 0.196 0.588 0.540 0.196 0.531 0.600 0.196 0.196 Sens 3 90% 91% 93% 90% 91% 93% 91% 100% 100% Spec 3 63% 23% 60% 58% 23% 55% 63% 23% 31% Cutoff 4 0.821 1.43 0.849 0.821 1.43 0.849 0.821 1.43 0.849 Sens 4 86% 73% 87% 81% 55% 80% 73% 67% 67% Spec 4 70% 70% 70% 70% 70% 70% 70% 70% 70% Cutoff 5 1.44 2.93 1.44 1.44 2.93 1.44 1.44 2.93 1.44 Sens 5 62% 45% 60% 57% 36% 60% 55% 33% 44% Spec 5 80% 80% 80% 80% 80% 80% 80% 80% 80% Cutoff 6 3.98 5.53 3.98 3.98 5.53 3.98 3.98 5.53 3.98 Sens 6 33% 27% 40% 33% 18% 40% 9% 17% 11% Spec 6 90% 90% 90% 90% 90% 90% 90% 90% 90% OR Quart 2 0.98 0 >1.0 0.98 0 >1.0 >1.0 0.99 >1.0 p Value 0.99 na <1.0 0.99 na <1.0 <0.99 0.99 <0.98 95% CI of 0.060 na >0.060 0.060 na >0.060 >0.062 0.061 >0.062 OR Quart 2 16 na na 16 na na na 16 na OR Quart 3 6.7 1.5 >5.8 7.9 2.6 >5.8 >4.3 2.0 >4.5 p Value 0.085 0.66 <0.12 0.057 0.27 <0.12 <0.20 0.57 <0.19 95% CI of 0.77 0.24 >0.64 0.94 0.48 >0.64 >0.47 0.18 >0.48 OR Quart 3 57 9.2 na 67 14 na na 23 na OR Quart 4 17 3.1 >11 15 2.0 >11 >6.8 2.0 >4.5 p Value 0.0080 0.17 <0.024 0.011 0.42 <0.024 <0.081 0.57 <0.19 95% CI of 2.1 0.61 >1.4 1.9 0.36 >1.4 >0.79 0.18 >0.48 OR Quart 4 130 16 na 120 11 na na 23 na
TABLE-US-00063 Apolipoprotein A-I 0 hr prior to AKI stage 24 hr prior to AKI stage 48 hr prior to AKI stage Cohort 1 Cohort 2 Cohort 1 Cohort 2 Cohort 1 Cohort 2 sCr or UO Median 420 798 420 798 420 713 Average 1680 2700 1680 2700 1680 1320 Stdev 3320 4030 3320 4030 3320 1230 p (t-test) 0.19 0.19 0.72 Min 1.00E-9 29.8 1.00E-9 0.194 1.00E-9 29.8 Max 12000 12000 12000 12000 12000 3750 n (Samp) 190 21 190 21 190 11 n (Patient) 190 21 190 21 190 11 sCr only Median 582 985 582 985 582 755 Average 2030 4020 2030 4020 2030 1030 Stdev 3580 5190 3580 5190 3580 951 p (t-test) 0.076 0.076 0.50 Min 1.00E-9 31.6 1.00E-9 0.194 1.00E-9 159 Max 13100 12000 13100 12000 13100 2890 n (Samp) 295 11 295 11 295 6 n (Patient) 295 11 295 11 295 6 UO only Median 571 798 571 798 571 985 Average 1930 1960 1930 1960 1930 1460 Stdev 3600 3020 3600 3020 3600 1330 p (t-test) 0.98 0.98 0.70 Min 1.00E-9 29.8 1.00E-9 29.8 1.00E-9 29.8 Max 12000 12000 12000 12000 12000 3750 n (Samp) 136 15 136 15 136 9 n (Patient) 136 15 136 15 136 9 0 hr prior to AKI stage 24 hr prior to AKI stage 48 hr prior to AKI stage sCr or UO sCr only UO only sCr or UO sCr only UO only sCr or UO sCr only UO only AUC 0.62 0.65 0.57 0.62 0.65 0.57 0.62 0.57 0.58 SE 0.068 0.092 0.081 0.068 0.092 0.081 0.093 0.12 0.10 p 0.076 0.11 0.41 0.079 0.11 0.41 0.21 0.56 0.41 nCohort 1 190 295 136 190 295 136 190 295 136 nCohort 2 21 11 15 21 11 15 11 6 9 Cutoff 1 539 711 500 539 711 500 539 655 500 Sens 1 71% 73% 73% 71% 73% 73% 73% 83% 78% Spec 1 56% 57% 47% 56% 57% 47% 56% 55% 47% Cutoff 2 157 655 151 157 655 151 518 655 93.9 Sens 2 81% 82% 80% 81% 82% 80% 82% 83% 89% Spec 2 24% 55% 20% 24% 55% 20% 55% 55% 12% Cutoff 3 62.6 157 57.3 62.6 157 57.3 93.9 157 16.6 Sens 3 90% 91% 93% 90% 91% 93% 91% 100% 100% Spec 3 11% 20% 8% 11% 20% 8% 15% 20% 4% Cutoff 4 932 1110 1040 932 1110 1040 932 1110 1040 Sens 4 48% 45% 40% 48% 45% 40% 45% 17% 44% Spec 4 70% 70% 71% 70% 70% 71% 70% 70% 71% Cutoff 5 1360 1870 1580 1360 1870 1580 1360 1870 1580 Sens 5 43% 45% 40% 43% 45% 40% 36% 17% 44% Spec 5 80% 80% 80% 80% 80% 80% 80% 80% 80% Cutoff 6 5000 10200 12000 5000 10200 12000 5000 10200 12000 Sens 6 14% 27% 0% 14% 27% 0% 0% 0% 0% Spec 6 90% 90% 100% 90% 90% 100% 90% 90% 100% OR Quart 2 0 0 0.46 0 0 0.46 0 0 1.0 p Value na na 0.39 na na 0.39 na na 1.0 95% CI of na na 0.079 na na 0.079 na na 0.13 OR Quart 2 na na 2.7 na na 2.7 na na 7.5 OR Quart 3 1.4 2.1 0.71 1.4 2.1 0.71 2.7 4.2 0.49 p Value 0.56 0.41 0.67 0.56 0.41 0.67 0.26 0.21 0.56 95% CI of 0.42 0.37 0.15 0.42 0.37 0.15 0.49 0.45 0.042 OR Quart 3 4.8 12 3.4 4.8 12 3.4 14 38 5.6 OR Quart 4 1.9 2.6 1.5 1.9 2.6 1.5 2.0 0.99 2.1 p Value 0.27 0.27 0.53 0.27 0.27 0.53 0.42 0.99 0.42 95% CI of 0.60 0.48 0.40 0.60 0.48 0.40 0.36 0.061 0.35 OR Quart 4 6.2 14 6.0 6.2 14 6.0 12 16 12
TABLE-US-00064 Apolipoprotein B-100 0 hr prior to AKI stage 24 hr prior to AKI stage 48 hr prior to AKI stage Cohort 1 Cohort 2 Cohort 1 Cohort 2 Cohort 1 Cohort 2 sCr or UO Median 74.1 459 74.1 405 74.1 304 Average 264 654 264 634 264 477 Stdev 425 639 425 652 425 427 p (t-test) 2.2E-4 4.7E-4 0.11 Min 1.00E-9 5.00 1.00E-9 2.43 1.00E-9 15.7 Max 2530 2780 2530 2780 2530 1190 n (Samp) 190 21 190 21 190 11 n (Patient) 190 21 190 21 190 11 sCr only Median 126 548 126 391 126 688 Average 378 622 378 564 378 652 Stdev 582 463 582 496 582 451 p (t-test) 0.17 0.30 0.25 Min 1.00E-9 5.00 1.00E-9 2.43 1.00E-9 19.9 Max 3580 1450 3580 1450 3580 1190 n (Samp) 296 11 296 11 296 6 n (Patient) 296 11 296 11 296 6 UO only Median 95.8 581 95.8 581 95.8 304 Average 266 714 266 708 266 378 Stdev 387 716 387 722 387 386 p (t-test) 1.8E-4 2.3E-4 0.40 Min 1.00E-9 15.7 1.00E-9 5.67 1.00E-9 15.7 Max 2530 2780 2530 2780 2530 1150 n (Samp) 136 15 136 15 136 9 n (Patient) 136 15 136 15 136 9 0 hr prior to AKI stage 24 hr prior to AKI stage 48 hr prior to AKI stage sCr or UO sCr only UO only sCr or UO sCr only UO only sCr or UO sCr only UO only AUC 0.74 0.69 0.74 0.71 0.65 0.72 0.68 0.71 0.61 SE 0.064 0.090 0.076 0.066 0.091 0.077 0.091 0.12 0.10 p 1.5E-4 0.035 0.0013 0.0013 0.100 0.0047 0.047 0.076 0.29 nCohort 1 190 296 136 190 296 136 190 296 136 nCohort 2 21 11 15 21 11 15 11 6 9 Cutoff 1 304 388 301 301 257 301 201 257 43.8 Sens 1 71% 73% 73% 71% 73% 73% 73% 83% 78% Spec 1 73% 72% 71% 73% 63% 71% 67% 63% 34% Cutoff 2 251 322 232 109 111 232 43.8 257 15.8 Sens 2 81% 82% 80% 81% 82% 80% 82% 83% 89% Spec 2 71% 68% 68% 59% 49% 68% 41% 63% 19% Cutoff 3 19.2 19.2 15.8 14.7 19.2 13.7 19.2 19.2 13.7 Sens 3 90% 91% 93% 90% 91% 93% 91% 100% 100% Spec 3 25% 20% 19% 23% 20% 18% 25% 20% 18% Cutoff 4 232 364 301 232 364 301 232 364 301 Sens 4 81% 73% 73% 76% 55% 73% 64% 67% 56% Spec 4 70% 70% 71% 70% 70% 71% 70% 70% 71% Cutoff 5 419 613 512 419 613 512 419 613 512 Sens 5 52% 45% 53% 48% 45% 53% 45% 67% 33% Spec 5 80% 80% 80% 80% 80% 80% 80% 80% 80% Cutoff 6 812 1150 765 812 1150 765 812 1150 765 Sens 6 29% 18% 33% 29% 18% 33% 18% 17% 11% Spec 6 90% 90% 90% 90% 90% 90% 90% 90% 90% OR Quart 2 0 0 0.47 0 0.49 0 0.49 0 0.49 p Value na na 0.55 na 0.56 na 0.57 na 0.56 95% CI of na na 0.041 na 0.043 na 0.043 na 0.042 OR Quart 2 na na 5.5 na 5.5 na 5.6 na 5.6 OR Quart 3 2.1 1.5 2.1 1.5 1.5 1.3 1.5 1.0 1.5 p Value 0.32 0.66 0.42 0.53 0.66 0.72 0.65 1.0 0.65 95% CI of 0.49 0.24 0.35 0.41 0.24 0.28 0.24 0.061 0.24 OR Quart 3 8.8 9.2 12 5.8 9.2 6.4 9.6 16 9.9 OR Quart 4 4.8 3.1 4.7 3.1 2.6 3.0 2.6 4.1 1.5 p Value 0.021 0.17 0.063 0.065 0.27 0.13 0.27 0.21 0.67 95% CI of 1.3 0.61 0.92 0.93 0.48 0.73 0.48 0.45 0.24 OR Quart 4 18 16 24 11 14 12 14 38 9.6
TABLE-US-00065 Calcitonin 0 hr prior to AKI stage 24 hr prior to AKI stage 48 hr prior to AKI stage Cohort 1 Cohort 2 Cohort 1 Cohort 2 Cohort 1 Cohort 2 sCr or UO Median 128 128 128 131 128 111 Average 389 542 389 539 389 178 Stdev 1600 1110 1600 1130 1600 271 p (t-test) 0.71 0.73 0.71 Min 1.48 4.07 1.48 4.07 1.48 16.9 Max 15500 4480 15500 4480 15500 836 n (Samp) 103 16 103 15 103 8 n (Patient) 103 16 103 15 103 8 sCr only Median 137 624 137 624 nd nd Average 768 998 768 939 nd nd Stdev 4340 1460 4340 1460 nd nd p (t-test) 0.88 0.91 nd nd Min 1.48 4.07 1.48 4.07 nd nd Max 38800 4480 38800 4480 nd nd n (Samp) 170 8 170 8 nd nd n (Patient) 170 8 170 8 nd nd UO only Median 128 71.6 128 72.7 128 89.1 Average 447 140 447 145 447 82.4 Stdev 1770 174 1770 182 1770 60.0 p (t-test) 0.59 0.61 0.62 Min 2.78 16.9 2.78 16.9 2.78 16.9 Max 15500 600 15500 600 15500 146 n (Samp) 87 10 87 9 87 6 n (Patient) 87 10 87 9 87 6 0 hr prior to AKI stage 24 hr prior to AKI stage 48 hr prior to AKI stage sCr or UO sCr only UO only sCr or UO sCr only UO only sCr or UO sCr only UO only AUC 0.51 0.71 0.38 0.52 0.71 0.39 0.41 nd 0.32 SE 0.078 0.10 0.099 0.081 0.11 0.10 0.11 nd 0.12 p 0.85 0.045 0.23 0.78 0.051 0.29 0.43 nd 0.15 nCohort 1 103 170 87 103 170 87 103 nd 87 nCohort 2 16 8 10 15 8 9 8 nd 6 Cutoff 1 49.9 128 49.9 66.3 128 49.3 48.1 nd 17.7 Sens 1 75% 75% 70% 73% 75% 78% 75% nd 83% Spec 1 21% 48% 20% 24% 48% 20% 21% nd 8% Cutoff 2 48.1 124 49.3 48.1 124 17.7 17.7 nd 17.7 Sens 2 81% 88% 80% 80% 88% 89% 88% nd 83% Spec 2 21% 46% 20% 21% 46% 8% 9% nd 8% Cutoff 3 15.4 2.78 41.4 15.4 2.78 15.4 15.4 nd 15.4 Sens 3 94% 100% 90% 93% 100% 100% 100% nd 100% Spec 3 8% 1% 16% 8% 1% 7% 8% nd 7% Cutoff 4 210 194 189 210 194 189 210 nd 189 Sens 4 38% 62% 20% 40% 62% 22% 12% nd 0% Spec 4 71% 70% 70% 71% 70% 70% 71% nd 70% Cutoff 5 296 291 291 296 291 291 296 nd 291 Sens 5 31% 62% 10% 33% 62% 11% 12% nd 0% Spec 5 81% 80% 80% 81% 80% 80% 81% nd 80% Cutoff 6 426 437 426 426 437 426 426 nd 426 Sens 6 31% 62% 10% 33% 62% 11% 12% nd 0% Spec 6 90% 90% 91% 90% 90% 91% 90% nd 91% OR Quart 2 0.53 2.0 1.0 0.69 2.0 0.48 3.2 nd >2.3 p Value 0.42 0.58 0.97 0.65 0.58 0.56 0.32 nd <0.51 95% CI of 0.12 0.17 0.14 0.14 0.17 0.040 0.32 nd >0.19 OR Quart 2 2.5 23 8.1 3.4 23 5.7 33 nd na OR Quart 3 0.53 0 1.0 0.72 0 1.6 1.0 nd >1.1 p Value 0.42 na 0.97 0.69 na 0.64 1.0 nd <0.95 95% CI of 0.12 na 0.14 0.15 na 0.24 0.059 nd >0.064 OR Quart 3 2.5 na 8.1 3.6 na 10 17 nd na OR Quart 4 0.96 5.4 2.3 1.2 5.4 1.6 3.4 nd >3.6 p Value 0.95 0.13 0.36 0.76 0.13 0.64 0.31 nd <0.28 95% CI of 0.25 0.60 0.38 0.30 0.60 0.24 0.33 nd >0.35 OR Quart 4 3.7 48 14 5.2 48 10 35 nd na
TABLE-US-00066 C-reactive protein 0 hr prior to AKI stage 24 hr prior to AKI stage 48 hr prior to AKI stage Cohort 1 Cohort 2 Cohort 1 Cohort 2 Cohort 1 Cohort 2 sCr or UO Median 11.4 53.9 11.4 30.4 11.4 30.4 Average 22.7 54.6 22.7 45.0 22.7 46.3 Stdev 30.5 54.5 30.5 49.4 30.5 69.0 p (t-test) 5.2E-5 0.0035 0.024 Min 1.00E-9 1.09 1.00E-9 1.09 1.00E-9 1.09 Max 259 243 259 243 259 243 n (Samp) 189 21 189 21 189 11 n (Patient) 189 21 189 21 189 11 sCr only Median 18.8 53.9 18.8 30.4 18.8 42.2 Average 27.6 63.6 27.6 51.3 27.6 67.1 Stdev 29.5 70.4 29.5 66.4 29.5 88.8 p (t-test) 2.5E-4 0.014 0.0024 Min 1.00E-9 1.15 1.00E-9 1.15 1.00E-9 1.15 Max 259 243 259 243 259 243 n (Samp) 296 11 296 11 296 6 n (Patient) 296 11 296 11 296 6 UO only Median 18.2 56.0 18.2 49.5 18.2 43.1 Average 25.8 65.1 25.8 53.3 25.8 54.5 Stdev 30.7 60.3 30.7 55.7 30.7 74.3 p (t-test) 5.3E-5 0.0034 0.018 Min 1.00E-9 1.09 1.00E-9 1.09 1.00E-9 1.09 Max 259 243 259 243 259 243 n (Samp) 135 15 135 15 135 9 n (Patient) 135 15 135 15 135 9 0 hr prior to AKI stage 24 hr prior to AKI stage 48 hr prior to AKI stage sCr or UO sCr only UO only sCr or UO sCr only UO only sCr or UO sCr only UO only AUC 0.74 0.69 0.76 0.70 0.63 0.72 0.61 0.64 0.63 SE 0.064 0.090 0.074 0.066 0.092 0.077 0.093 0.12 0.10 p 2.0E-4 0.037 3.6E-4 0.0019 0.15 0.0039 0.21 0.26 0.19 nCohort 1 189 296 135 189 296 135 189 296 135 nCohort 2 21 11 15 21 11 15 11 6 9 Cutoff 1 28.2 29.4 29.3 28.2 29.4 29.3 4.96 17.7 4.96 Sens 1 76% 73% 87% 76% 73% 87% 73% 83% 78% Spec 1 66% 56% 58% 66% 56% 58% 33% 48% 27% Cutoff 2 17.7 17.7 29.3 17.7 17.7 29.3 4.11 17.7 4.11 Sens 2 81% 82% 87% 81% 82% 87% 82% 83% 89% Spec 2 59% 48% 58% 59% 48% 58% 30% 48% 24% Cutoff 3 4.96 9.34 4.96 4.96 9.34 4.96 1.15 1.15 0.962 Sens 3 90% 91% 93% 90% 91% 93% 91% 100% 100% Spec 3 33% 39% 27% 33% 39% 27% 20% 15% 14% Cutoff 4 30.4 40.3 33.2 30.4 40.3 33.2 30.4 40.3 33.2 Sens 4 57% 55% 67% 48% 36% 60% 45% 50% 56% Spec 4 72% 70% 70% 72% 70% 70% 72% 70% 70% Cutoff 5 38.5 56.0 43.6 38.5 56.0 43.6 38.5 56.0 43.6 Sens 5 57% 27% 67% 48% 18% 53% 45% 17% 44% Spec 5 80% 86% 80% 80% 86% 80% 80% 86% 80% Cutoff 6 56.0 58.6 56.0 56.0 58.6 56.0 56.0 58.6 56.0 Sens 6 29% 27% 40% 14% 18% 20% 18% 17% 22% Spec 6 91% 90% 90% 91% 90% 90% 91% 90% 90% OR Quart 2 0.98 2.0 0.97 0.98 2.0 0.97 1.0 0.99 0.49 p Value 0.98 0.57 0.98 0.98 0.57 0.98 1.0 0.99 0.56 95% CI of 0.13 0.18 0.059 0.13 0.18 0.059 0.14 0.061 0.042 OR Quart 2 7.2 23 16 7.2 23 16 7.4 16 5.6 OR Quart 3 2.7 2.0 3.2 3.9 4.1 4.4 1.0 1.0 0.49 p Value 0.26 0.57 0.33 0.10 0.21 0.20 1.0 1.0 0.56 95% CI of 0.49 0.18 0.31 0.77 0.45 0.46 0.14 0.061 0.042 OR Quart 3 14 23 32 20 38 41 7.4 16 5.6 OR Quart 4 7.3 6.3 13 5.8 4.1 11 2.7 3.0 2.7 p Value 0.012 0.091 0.018 0.028 0.21 0.026 0.26 0.34 0.25 95% CI of 1.5 0.74 1.6 1.2 0.45 1.3 0.49 0.31 0.50 OR Quart 4 35 54 110 28 38 93 14 30 15
TABLE-US-00067 Tissue factor 0 hr prior to AKI stage 24 hr prior to AKI stage 48 hr prior to AKI stage Cohort 1 Cohort 2 Cohort 1 Cohort 2 Cohort 1 Cohort 2 sCr or UO Median 0.00336 0.124 0.00336 0.133 0.00336 0.112 Average 0.0991 0.210 0.0991 0.224 0.0991 0.0845 Stdev 0.137 0.312 0.137 0.318 0.137 0.0694 p (t-test) 0.016 0.0087 0.77 Min 0.00336 0.00336 0.00336 0.00336 0.00336 0.00336 Max 0.593 1.12 0.593 1.12 0.593 0.167 n (Samp) 103 16 103 15 103 8 n (Patient) 103 16 103 15 103 8 sCr only Median 0.00336 0.168 0.00336 0.168 nd nd Average 0.126 0.272 0.126 0.272 nd nd Stdev 0.184 0.360 0.184 0.360 nd nd p (t-test) 0.039 0.039 nd nd Min 0.00336 0.00336 0.00336 0.00336 nd nd Max 0.917 1.12 0.917 1.12 nd nd n (Samp) 170 8 170 8 nd nd n (Patient) 170 8 170 8 nd nd UO only Median 0.00336 0.112 0.00336 0.114 0.00336 0.112 Average 0.104 0.152 0.104 0.168 0.104 0.0885 Stdev 0.138 0.235 0.138 0.243 0.138 0.0689 p (t-test) 0.34 0.22 0.78 Min 0.00336 0.00336 0.00336 0.00336 0.00336 0.00336 Max 0.593 0.787 0.593 0.787 0.593 0.167 n (Samp) 87 10 87 9 87 6 n (Patient) 87 10 87 9 87 6 0 hr prior to AKI stage 24 hr prior to AKI stage 48 hr prior to AKI stage sCr or UO sCr only UO only sCr or UO sCr only UO only sCr or UO sCr only UO only AUC 0.60 0.67 0.53 0.62 0.67 0.56 0.51 nd 0.50 SE 0.080 0.11 0.098 0.082 0.11 0.10 0.11 nd 0.12 p 0.22 0.12 0.73 0.15 0.12 0.55 0.93 nd 0.99 nCohort 1 103 170 87 103 170 87 103 nd 87 nCohort 2 16 8 10 15 8 9 8 nd 6 Cutoff 1 0 0.132 0 0 0.132 0 0 nd 0 Sens 1 100% 75% 100% 100% 75% 100% 100% nd 100% Spec 1 0% 64% 0% 0% 64% 0% 0% nd 0% Cutoff 2 0 0 0 0 0 0 0 nd 0 Sens 2 100% 100% 100% 100% 100% 100% 100% nd 100% Spec 2 0% 0% 0% 0% 0% 0% 0% nd 0% Cutoff 3 0 0 0 0 0 0 0 nd 0 Sens 3 100% 100% 100% 100% 100% 100% 100% nd 100% Spec 3 0% 0% 0% 0% 0% 0% 0% nd 0% Cutoff 4 0.160 0.167 0.164 0.160 0.167 0.164 0.160 nd 0.164 Sens 4 38% 50% 30% 40% 50% 33% 12% nd 17% Spec 4 71% 73% 70% 71% 73% 70% 71% nd 70% Cutoff 5 0.180 0.206 0.207 0.180 0.206 0.207 0.180 nd 0.207 Sens 5 31% 38% 10% 33% 38% 11% 0% nd 0% Spec 5 81% 80% 80% 81% 80% 80% 81% nd 80% Cutoff 6 0.269 0.368 0.282 0.269 0.368 0.282 0.269 nd 0.282 Sens 6 19% 12% 10% 20% 12% 11% 0% nd 0% Spec 6 90% 90% 91% 90% 90% 91% 90% nd 91% OR Quart 2 0.45 0 >3.4 0.62 0 >3.4 0.46 nd >2.2 p Value 0.37 na <0.30 0.61 na <0.30 0.54 nd <0.53 95% CI of 0.075 na >0.33 0.096 na >0.33 0.039 nd >0.18 OR Quart 2 2.6 na na 4.0 na na 5.4 nd na OR Quart 3 1.2 1.0 >6.3 1.8 1.0 >4.8 2.7 nd >4.8 p Value 0.76 1.0 <0.11 0.45 1.0 <0.18 0.26 nd <0.17 95% CI of 0.30 0.13 >0.68 0.39 0.13 >0.50 0.48 nd >0.50 OR Quart 3 5.2 7.4 na 8.4 7.4 na 15 nd na OR Quart 4 1.2 2.0 >2.1 1.7 2.0 >2.2 0 nd >0 p Value 0.76 0.42 <0.56 0.48 0.42 <0.54 na nd <na 95% CI of 0.30 0.36 >0.18 0.37 0.36 >0.18 na nd >na OR Quart 4 5.2 12 na 8.0 12 na na nd na
TABLE-US-00068 Fibrinogen 0 hr prior to AKI stage 24 hr prior to AKI stage 48 hr prior to AKI stage Cohort 1 Cohort 2 Cohort 1 Cohort 2 Cohort 1 Cohort 2 sCr or UO Median 0.125 0.707 0.125 0.643 0.125 0.432 Average 73.1 47.9 73.1 12.8 73.1 0.452 Stdev 989 169 989 47.6 989 0.457 p (t-test) 0.91 0.78 0.81 Min 1.00E-9 1.00E-9 1.00E-9 1.00E-9 1.00E-9 1.00E-9 Max 13600 754 13600 219 13600 1.61 n (Samp) 189 21 189 21 189 11 n (Patient) 189 21 189 21 189 11 sCr only Median 0.172 0.643 0.172 0.643 0.172 0.505 Average 47.9 69.7 47.9 3.03 47.9 0.438 Stdev 790 227 790 6.21 790 0.255 p (t-test) 0.93 0.85 0.88 Min 1.00E-9 1.00E-9 1.00E-9 1.00E-9 1.00E-9 0.0743 Max 13600 754 13600 21.2 13600 0.707 n (Samp) 296 11 296 11 296 6 n (Patient) 296 11 296 11 296 6 UO only Median 0.151 0.753 0.151 0.578 0.151 0.233 Average 102 66.5 102 17.4 102 0.402 Stdev 1170 198 1170 56.2 1170 0.495 p (t-test) 0.91 0.78 0.80 Min 1.00E-9 1.00E-9 1.00E-9 1.00E-9 1.00E-9 1.00E-9 Max 13600 754 13600 219 13600 1.61 n (Samp) 135 15 135 15 135 9 n (Patient) 135 15 135 15 135 9 0 hr prior to AKI stage 24 hr prior to AKI stage 48 hr prior to AKI stage sCr or UO sCr only UO only sCr or UO sCr only UO only sCr or UO sCr only UO only AUC 0.74 0.70 0.74 0.72 0.67 0.71 0.60 0.61 0.53 SE 0.064 0.090 0.076 0.065 0.091 0.078 0.093 0.12 0.10 p 1.9E-4 0.026 0.0017 8.0E-4 0.060 0.0079 0.26 0.37 0.74 nCohort 1 189 296 135 189 296 135 189 296 135 nCohort 2 21 11 15 21 11 15 11 6 9 Cutoff 1 0.430 0.430 0.410 0.311 0.430 0.214 0.155 0.193 0.151 Sens 1 71% 73% 73% 71% 73% 73% 73% 83% 78% Spec 1 74% 65% 67% 68% 65% 61% 54% 53% 50% Cutoff 2 0.222 0.361 0.214 0.193 0.311 0.193 0.151 0.193 0 Sens 2 81% 82% 80% 81% 82% 80% 82% 83% 100% Spec 2 64% 63% 61% 60% 60% 58% 53% 53% 0% Cutoff 3 0.0714 0.311 0.0714 0.0714 0.0717 0.0714 0 0.0717 0 Sens 3 90% 91% 93% 90% 91% 93% 100% 100% 100% Spec 3 40% 60% 38% 40% 34% 38% 0% 34% 0% Cutoff 4 0.336 0.589 0.455 0.336 0.589 0.455 0.336 0.589 0.455 Sens 4 71% 55% 67% 62% 55% 53% 55% 33% 33% Spec 4 70% 70% 70% 70% 70% 70% 70% 70% 70% Cutoff 5 0.737 1.21 0.805 0.737 1.21 0.805 0.737 1.21 0.805 Sens 5 48% 27% 47% 43% 27% 40% 9% 0% 11% Spec 5 80% 80% 80% 80% 80% 80% 80% 80% 80% Cutoff 6 1.96 4.08 2.14 1.96 4.08 2.14 1.96 4.08 2.14 Sens 6 29% 18% 33% 24% 18% 27% 0% 0% 0% Spec 6 90% 90% 90% 90% 90% 90% 90% 90% 90% OR Quart 2 0.98 0 2.0 0.98 0.99 2.0 0 >1.0 1.0 p Value 0.98 na 0.58 0.98 0.99 0.58 na <1.0 1.0 95% CI of 0.13 na 0.17 0.13 0.061 0.17 na >0.061 0.13 OR Quart 2 7.2 na 23 7.2 16 23 na na 7.5 OR Quart 3 2.7 6.3 4.4 2.7 5.2 5.6 2.7 >5.4 1.5 p Value 0.26 0.091 0.20 0.26 0.14 0.12 0.26 <0.13 0.65 95% CI of 0.49 0.74 0.46 0.49 0.59 0.62 0.49 >0.61 0.24 OR Quart 3 14 54 41 14 46 51 14 na 9.9 OR Quart 4 7.3 4.1 9.6 7.3 4.1 8.1 2.1 >0 1.0 p Value 0.012 0.21 0.038 0.012 0.21 0.056 0.41 <na 1.0 95% CI of 1.5 0.45 1.1 1.5 0.45 0.95 0.36 >na 0.13 OR Quart 4 35 38 81 35 38 70 12 na 7.5
TABLE-US-00069 Intercellular adhesion molecule 3 0 hr prior to AKI stage 24 hr prior to AKI stage 48 hr prior to AKI stage Cohort 1 Cohort 2 Cohort 1 Cohort 2 Cohort 1 Cohort 2 sCr or UO Median 0.00885 0.0169 0.00885 0.0169 0.00885 0.0169 Average 0.0125 0.143 0.0125 0.143 0.0125 0.0171 Stdev 0.0128 0.434 0.0128 0.434 0.0128 0.0138 p (t-test) 0.0028 0.0028 0.36 Min 1.00E-9 0.00542 1.00E-9 0.00542 1.00E-9 1.00E-9 Max 0.0590 1.52 0.0590 1.52 0.0590 0.0334 n (Samp) 98 12 98 12 98 7 n (Patient) 98 12 98 12 98 7 sCr only Median 0.0120 0.0109 0.0120 0.0109 nd nd Average 0.0249 0.0160 0.0249 0.0160 nd nd Stdev 0.121 0.0117 0.121 0.0117 nd nd p (t-test) 0.86 0.86 nd nd Min 1.00E-9 0.00542 1.00E-9 0.00542 nd nd Max 1.52 0.0334 1.52 0.0334 nd nd n (Samp) 159 6 159 6 nd nd n (Patient) 159 6 159 6 nd nd UO only Median 0.00890 0.0269 0.00890 0.0269 0.00890 0.0215 Average 0.0125 0.210 0.0125 0.210 0.0125 0.0178 Stdev 0.0127 0.530 0.0127 0.530 0.0127 0.0149 p (t-test) 4.5E-4 4.5E-4 0.33 Min 1.00E-9 0.00543 1.00E-9 0.00543 1.00E-9 1.00E-9 Max 0.0590 1.52 0.0590 1.52 0.0590 0.0334 n (Samp) 86 8 86 8 86 6 n (Patient) 86 8 86 8 86 6 0 hr prior to AKI stage 24 hr prior to AKI stage 48 hr prior to AKI stage sCr or UO sCr only UO only sCr or UO sCr only UO only sCr or UO sCr only UO only AUC 0.69 0.54 0.79 0.69 0.54 0.79 0.60 nd 0.60 SE 0.089 0.12 0.098 0.089 0.12 0.098 0.12 nd 0.13 p 0.037 0.74 0.0028 0.037 0.74 0.0028 0.40 nd 0.45 nCohort 1 98 159 86 98 159 86 98 nd 86 nCohort 2 12 6 8 12 6 8 7 nd 6 Cutoff 1 0.00885 0.00726 0.0169 0.00885 0.00726 0.0169 0.0125 nd 0 Sens 1 75% 83% 75% 75% 83% 75% 71% nd 100% Spec 1 51% 33% 73% 51% 33% 73% 60% nd 0% Cutoff 2 0.00726 0.00726 0.0158 0.00726 0.00726 0.0158 0 nd 0 Sens 2 83% 83% 88% 83% 83% 88% 100% nd 100% Spec 2 44% 33% 73% 44% 33% 73% 0% nd 0% Cutoff 3 0.00542 0.00455 0.00542 0.00542 0.00455 0.00542 0 nd 0 Sens 3 92% 100% 100% 92% 100% 100% 100% nd 100% Spec 3 35% 24% 30% 35% 24% 30% 0% nd 0% Cutoff 4 0.0170 0.0195 0.0149 0.0170 0.0195 0.0149 0.0170 nd 0.0149 Sens 4 50% 33% 88% 50% 33% 88% 43% nd 67% Spec 4 70% 70% 71% 70% 70% 71% 70% nd 71% Cutoff 5 0.0210 0.0237 0.0202 0.0210 0.0237 0.0202 0.0210 nd 0.0202 Sens 5 42% 33% 62% 42% 33% 62% 43% nd 50% Spec 5 81% 81% 80% 81% 81% 80% 81% nd 80% Cutoff 6 0.0307 0.0347 0.0325 0.0307 0.0347 0.0325 0.0307 nd 0.0325 Sens 6 17% 0% 25% 17% 0% 25% 14% nd 17% Spec 6 91% 91% 91% 91% 91% 91% 91% nd 91% OR Quart 2 >4.5 2.1 >1.0 >4.5 2.1 >1.0 0 nd 0 p Value <0.19 0.56 <1.0 <0.19 0.56 <1.0 na nd na 95% CI of >0.47 0.18 >0.059 >0.47 0.18 >0.059 na nd na OR Quart 2 na 24 na na 24 na na nd na OR Quart 3 >3.4 1.0 >2.2 >3.4 1.0 >2.2 1.0 nd 0.48 p Value <0.31 1.0 <0.53 <0.31 1.0 <0.53 1.0 nd 0.56 95% CI of >0.33 0.060 >0.18 >0.33 0.060 >0.18 0.13 nd 0.040 OR Quart 3 na 17 na na 17 na 7.7 nd 5.7 OR Quart 4 >5.9 2.0 >6.1 >5.9 2.0 >6.1 1.5 nd 1.6 p Value <0.12 0.58 <0.11 <0.12 0.58 <0.11 0.67 nd 0.64 95% CI of >0.64 0.17 >0.65 >0.64 0.17 >0.65 0.23 nd 0.24 OR Quart 4 na 23 na na 23 na 9.8 nd 10
TABLE-US-00070 Interleukin-5 0 hr prior to AKI stage 24 hr prior to AKI stage 48 hr prior to AKI stage Cohort 1 Cohort 2 Cohort 1 Cohort 2 Cohort 1 Cohort 2 sCr or UO Median 0.118 0.132 0.118 0.107 0.118 0.169 Average 0.595 0.382 0.595 0.318 0.595 0.548 Stdev 1.85 0.882 1.85 0.868 1.85 1.17 p (t-test) 0.60 0.50 0.93 Min 1.00E-9 1.00E-9 1.00E-9 1.00E-9 1.00E-9 1.00E-9 Max 20.2 4.06 20.2 4.06 20.2 4.06 n (Samp) 190 21 190 21 190 11 n (Patient) 190 21 190 21 190 11 sCr only Median 0.121 0.169 0.121 0.110 0.121 0.226 Average 0.624 0.552 0.624 0.512 0.624 0.854 Stdev 1.80 1.17 1.80 1.19 1.80 1.58 p (t-test) 0.90 0.84 0.76 Min 1.00E-9 1.00E-9 1.00E-9 1.00E-9 1.00E-9 0.00126 Max 20.2 4.06 20.2 4.06 20.2 4.06 n (Samp) 297 11 297 11 297 6 n (Patient) 297 11 297 11 297 6 UO only Median 0.167 0.132 0.167 0.110 0.167 0.165 Average 0.890 0.480 0.890 0.409 0.890 0.620 Stdev 2.51 1.04 2.51 1.02 2.51 1.30 p (t-test) 0.53 0.46 0.75 Min 1.00E-9 1.00E-9 1.00E-9 1.00E-9 1.00E-9 1.00E-9 Max 20.2 4.06 20.2 4.06 20.2 4.06 n (Samp) 136 15 136 15 136 9 n (Patient) 136 15 136 15 136 9 0 hr prior to AKI stage 24 hr prior to AKI stage 48 hr prior to AKI stage sCr or UO sCr only UO only sCr or UO sCr only UO only sCr or UO sCr only UO only AUC 0.52 0.59 0.46 0.44 0.48 0.41 0.60 0.61 0.50 SE 0.067 0.092 0.080 0.068 0.090 0.081 0.093 0.12 0.100 p 0.75 0.32 0.59 0.38 0.86 0.27 0.27 0.36 0.96 nCohort 1 190 297 136 190 297 136 190 297 136 nCohort 2 21 11 15 21 11 15 11 6 9 Cutoff 1 0.103 0.115 0.103 0.0166 0.0821 0.0835 0.128 0.108 0.0911 Sens 1 71% 73% 73% 71% 73% 73% 73% 83% 78% Spec 1 48% 48% 38% 18% 40% 30% 54% 47% 32% Cutoff 2 0.0821 0.103 0.0911 0 0 0.0166 0.0911 0.108 0.0835 Sens 2 81% 82% 80% 100% 100% 80% 82% 83% 89% Spec 2 41% 46% 32% 0% 0% 11% 45% 47% 30% Cutoff 3 0 0.0821 0 0 0 0 0.0840 1.00E-9 0 Sens 3 100% 91% 100% 100% 100% 100% 91% 100% 100% Spec 3 0% 40% 0% 0% 0% 0% 43% 13% 0% Cutoff 4 0.232 0.254 0.377 0.232 0.254 0.377 0.232 0.254 0.377 Sens 4 24% 45% 20% 24% 36% 13% 36% 50% 22% Spec 4 70% 70% 71% 70% 70% 71% 70% 70% 71% Cutoff 5 0.482 0.597 0.789 0.482 0.597 0.789 0.482 0.597 0.789 Sens 5 14% 9% 13% 10% 9% 7% 18% 17% 11% Spec 5 80% 80% 80% 80% 80% 80% 80% 80% 80% Cutoff 6 1.31 1.38 1.54 1.31 1.38 1.54 1.31 1.38 1.54 Sens 6 5% 9% 7% 5% 9% 7% 9% 17% 11% Spec 6 90% 90% 90% 90% 90% 90% 90% 90% 90% OR Quart 2 1.5 3.1 1.4 3.9 1.5 2.1 2.0 0.99 3.2 p Value 0.53 0.33 0.69 0.10 0.65 0.40 0.57 0.99 0.33 95% CI of 0.41 0.31 0.29 0.77 0.25 0.36 0.18 0.061 0.31 OR Quart 2 5.8 30 6.6 20 9.4 12 23 16 32 OR Quart 3 2.1 5.3 1.8 2.7 1.5 2.7 6.7 2.0 3.2 p Value 0.24 0.13 0.46 0.26 0.65 0.25 0.084 0.57 0.33 95% CI of 0.60 0.60 0.39 0.49 0.25 0.49 0.77 0.18 0.31 OR Quart 3 7.6 46 8.0 14 9.4 15 58 23 32 OR Quart 4 0.72 2.0 1.0 4.0 1.5 2.2 2.0 2.0 2.0 p Value 0.68 0.57 0.97 0.096 0.65 0.39 0.58 0.57 0.58 95% CI of 0.15 0.18 0.19 0.78 0.25 0.37 0.18 0.18 0.17 OR Quart 4 3.4 23 5.5 20 9.4 13 23 23 23
TABLE-US-00071 Interleukin-6 receptor subunit beta 0 hr prior to AKI stage 24 hr prior to AKI stage 48 hr prior to AKI stage Cohort 1 Cohort 2 Cohort 1 Cohort 2 Cohort 1 Cohort 2 sCr or UO Median 11200 19400 11200 19400 11200 18600 Average 13700 56000 13700 54400 13700 19700 Stdev 10000 90600 10000 90000 10000 11800 p (t-test) 1.4E-5 2.5E-5 0.13 Min 1140 3520 1140 3520 1140 6010 Max 59000 323000 59000 323000 59000 44000 n (Samp) 98 12 98 12 98 7 n (Patient) 98 12 98 12 98 7 sCr only Median 14700 17500 14700 17200 nd nd Average 18700 37500 18700 36600 nd nd Stdev 27100 44900 27100 45500 nd nd p (t-test) 0.11 0.12 nd nd Min 1140 3520 1140 3520 nd nd Max 323000 124000 323000 124000 nd nd n (Samp) 159 6 159 6 nd nd n (Patient) 159 6 159 6 nd nd UO only Median 11200 20300 11200 20300 11200 19400 Average 14000 73900 14000 72100 14000 20600 Stdev 9790 108000 9790 107000 9790 12700 p (t-test) 1.2E-6 2.0E-6 0.12 Min 1140 6010 1140 6010 1140 6010 Max 59000 323000 59000 323000 59000 44000 n (Samp) 86 8 86 8 86 6 n (Patient) 86 8 86 8 86 6 0 hr prior to AKI stage 24 hr prior to AKI stage 48 hr prior to AKI stage sCr or UO sCr only UO only sCr or UO sCr only UO only sCr or UO sCr only UO only AUC 0.70 0.62 0.75 0.69 0.58 0.75 0.67 nd 0.67 SE 0.088 0.12 0.10 0.089 0.12 0.10 0.12 nd 0.12 p 0.021 0.35 0.014 0.033 0.50 0.014 0.14 nd 0.18 nCohort 1 98 159 86 98 159 86 98 nd 86 nCohort 2 12 6 8 12 6 8 7 nd 6 Cutoff 1 14200 14200 18500 13400 8760 18500 14200 nd 13400 Sens 1 75% 83% 75% 75% 83% 75% 71% nd 83% Spec 1 59% 48% 69% 58% 31% 69% 59% nd 58% Cutoff 2 13400 14200 13400 8760 8760 13400 13400 nd 13400 Sens 2 83% 83% 88% 83% 83% 88% 86% nd 83% Spec 2 58% 48% 58% 45% 31% 58% 58% nd 58% Cutoff 3 5680 3470 5680 5680 3470 5680 5680 nd 5680 Sens 3 92% 100% 100% 92% 100% 100% 100% nd 100% Spec 3 23% 7% 21% 23% 7% 21% 23% nd 21% Cutoff 4 17400 20400 19000 17400 20400 19000 17400 nd 19000 Sens 4 58% 33% 62% 58% 33% 62% 57% nd 50% Spec 4 70% 70% 71% 70% 70% 71% 70% nd 71% Cutoff 5 20700 25000 21100 20700 25000 21100 20700 nd 21100 Sens 5 33% 33% 38% 33% 33% 38% 14% nd 17% Spec 5 81% 81% 80% 81% 81% 80% 81% nd 80% Cutoff 6 26500 30900 26500 26500 30900 26500 26500 nd 26500 Sens 6 33% 33% 38% 33% 33% 38% 14% nd 17% Spec 6 91% 91% 91% 91% 91% 91% 91% nd 91% OR Quart 2 0 1.0 0 0.46 2.1 0 0 nd 0 p Value na 1.0 na 0.54 0.56 na na nd na 95% CI of na 0.060 na 0.039 0.18 na na nd na OR Quart 2 na 17 na 5.4 24 na na nd na OR Quart 3 2.2 2.1 3.3 1.6 1.0 3.3 3.3 nd 2.1 p Value 0.40 0.56 0.32 0.64 1.0 0.32 0.32 nd 0.56 95% CI of 0.36 0.18 0.32 0.24 0.060 0.32 0.32 nd 0.18 OR Quart 3 13 24 34 10 17 34 34 nd 25 OR Quart 4 3.4 2.0 4.4 3.4 2.0 4.4 3.1 nd 3.3 p Value 0.16 0.58 0.20 0.16 0.58 0.20 0.34 nd 0.32 95% CI of 0.62 0.17 0.45 0.62 0.17 0.45 0.30 nd 0.32 OR Quart 4 19 23 43 19 23 43 32 nd 34
TABLE-US-00072 Macrophage metalloelastase 0 hr prior to AKI stage 24 hr prior to AKI stage 48 hr prior to AKI stage Cohort 1 Cohort 2 Cohort 1 Cohort 2 Cohort 1 Cohort 2 sCr or UO Median 1.00E-9 8.60 1.00E-9 7.33 1.00E-9 7.33 Average 4.08 11.9 4.08 9.76 4.08 8.21 Stdev 10.3 8.02 10.3 9.09 10.3 5.39 p (t-test) 0.012 0.070 0.30 Min 1.00E-9 1.00E-9 1.00E-9 1.00E-9 1.00E-9 1.00E-9 Max 69.2 29.1 69.2 29.1 69.2 18.3 n (Samp) 97 12 97 12 97 7 n (Patient) 97 12 97 12 97 7 sCr only Median 0.747 9.53 0.747 7.33 nd nd Average 5.08 12.9 5.08 10.5 nd nd Stdev 11.4 8.49 11.4 9.87 nd nd p (t-test) 0.096 0.26 nd nd Min 1.00E-9 7.33 1.00E-9 1.00E-9 nd nd Max 84.4 29.1 84.4 29.1 nd nd n (Samp) 158 6 158 6 nd nd n (Patient) 158 6 158 6 nd nd UO only Median 1.00E-9 8.60 1.00E-9 7.33 1.00E-9 7.33 Average 4.59 10.5 4.59 9.17 4.59 8.35 Stdev 10.9 7.04 10.9 7.81 10.9 5.89 p (t-test) 0.13 0.25 0.41 Min 1.00E-9 1.00E-9 1.00E-9 1.00E-9 1.00E-9 1.00E-9 Max 69.2 22.5 69.2 22.5 69.2 18.3 n (Samp) 85 8 85 8 85 6 n (Patient) 85 8 85 8 85 6 0 hr prior to AKI stage 24 hr prior to AKI stage 48 hr prior to AKI stage sCr or UO sCr only UO only sCr or UO sCr only UO only sCr or UO sCr only UO only AUC 0.85 0.87 0.81 0.77 0.76 0.77 0.80 nd 0.77 SE 0.072 0.093 0.095 0.083 0.12 0.10 0.10 nd 0.11 p 1.1E-6 6.0E-5 0.0011 0.0012 0.024 0.0073 0.0043 nd 0.017 nCohort 1 97 158 85 97 158 85 97 nd 85 nCohort 2 12 6 8 12 6 8 7 nd 6 Cutoff 1 6.46 6.46 5.00 6.46 6.46 5.00 6.46 nd 5.00 Sens 1 92% 100% 88% 75% 83% 75% 86% nd 83% Spec 1 87% 82% 86% 87% 82% 86% 87% nd 86% Cutoff 2 6.46 6.46 5.00 1.00E-9 6.46 1.00E-9 6.46 nd 5.00 Sens 2 92% 100% 88% 83% 83% 88% 86% nd 83% Spec 2 87% 82% 86% 54% 82% 52% 87% nd 86% Cutoff 3 6.46 6.46 0 0 0 0 0 nd 0 Sens 3 92% 100% 100% 100% 100% 100% 100% nd 100% Spec 3 87% 82% 0% 0% 0% 0% 0% nd 0% Cutoff 4 3.57 4.82 3.57 3.57 4.82 3.57 3.57 nd 3.57 Sens 4 92% 100% 88% 75% 83% 75% 86% nd 83% Spec 4 77% 73% 75% 77% 73% 75% 77% nd 75% Cutoff 5 4.82 5.00 4.82 4.82 5.00 4.82 4.82 nd 4.82 Sens 5 92% 100% 88% 75% 83% 75% 86% nd 83% Spec 5 81% 80% 80% 81% 80% 80% 81% nd 80% Cutoff 6 14.5 14.9 14.9 14.5 14.9 14.9 14.5 nd 14.9 Sens 6 33% 17% 25% 25% 17% 25% 14% nd 17% Spec 6 91% 94% 94% 91% 94% 94% 91% nd 94% OR Quart 2 >1.0 >0 >1.0 >2.2 0 >1.0 0 nd 0 p Value <0.98 <na <0.98 <0.54 na <0.98 na nd na 95% CI of >0.062 >na >0.062 >0.18 na >0.062 na nd na OR Quart 2 na na na na na na na nd na OR Quart 3 >0 >0 >0 >1.0 0 >1.0 0 nd 0 p Value <na <na <na <0.98 na <0.98 na nd na 95% CI of >na >na >na >0.062 na >0.062 na nd na OR Quart 3 na na na na na na na nd na OR Quart 4 >17 >7.0 >9.5 >13 5.6 >7.7 7.5 nd 5.8 p Value <0.0086 <0.077 <0.044 <0.020 0.13 <0.070 0.072 nd 0.12 95% CI of >2.1 >0.81 >1.1 >1.5 0.62 >0.85 0.83 nd 0.62 OR Quart 4 na na na na 50 na 67 nd 55
TABLE-US-00073 Sex hormone-binding globulin 0 hr prior to AKI stage 24 hr prior to AKI stage 48 hr prior to AKI stage Cohort 1 Cohort 2 Cohort 1 Cohort 2 Cohort 1 Cohort 2 sCr or UO Median 0.0328 0.146 0.0328 0.102 0.0328 0.0710 Average 0.0907 1.17 0.0907 1.23 0.0907 0.190 Stdev 0.186 3.47 0.186 3.58 0.186 0.312 p (t-test) 0.0017 0.0014 0.17 Min 5.20E-6 0.00208 5.20E-6 0.00208 5.20E-6 0.0134 Max 1.18 14.0 1.18 14.0 1.18 0.933 n (Samp) 103 16 103 15 103 8 n (Patient) 103 16 103 15 103 8 sCr only Median 0.0384 0.230 0.0384 0.208 nd nd Average 0.173 0.495 0.173 0.488 nd nd Stdev 1.08 0.759 1.08 0.762 nd nd p (t-test) 0.41 0.42 nd nd Min 5.20E-6 0.00208 5.20E-6 0.00208 nd nd Max 14.0 2.22 14.0 2.22 nd nd n (Samp) 170 8 170 8 nd nd n (Patient) 170 8 170 8 nd nd UO only Median 0.0314 0.148 0.0314 0.102 0.0314 0.0710 Average 0.0956 1.73 0.0956 1.89 0.0956 0.0927 Stdev 0.197 4.36 0.197 4.60 0.197 0.0979 p (t-test) 4.8E-4 2.8E-4 0.97 Min 5.20E-6 0.0134 5.20E-6 0.0134 5.20E-6 0.0134 Max 1.18 14.0 1.18 14.0 1.18 0.280 n (Samp) 87 10 87 9 87 6 n (Patient) 87 10 87 9 87 6 0 hr prior to AKI stage 24 hr prior to AKI stage 48 hr prior to AKI stage sCr or UO sCr only UO only sCr or UO sCr only UO only sCr or UO sCr only UO only AUC 0.71 0.71 0.74 0.70 0.70 0.74 0.66 nd 0.63 SE 0.076 0.10 0.093 0.079 0.11 0.098 0.11 nd 0.13 p 0.0062 0.042 0.0084 0.013 0.065 0.013 0.15 nd 0.29 nCohort 1 103 170 87 103 170 87 103 nd 87 nCohort 2 16 8 10 15 8 9 8 nd 6 Cutoff 1 0.0331 0.0331 0.0596 0.0321 0.0321 0.0596 0.0321 nd 0.0186 Sens 1 75% 75% 70% 73% 75% 78% 75% nd 83% Spec 1 51% 47% 69% 50% 45% 69% 50% nd 38% Cutoff 2 0.0321 0.0321 0.0321 0.0229 0.0229 0.0186 0.0186 nd 0.0186 Sens 2 81% 88% 80% 80% 88% 89% 88% nd 83% Spec 2 50% 45% 52% 42% 37% 38% 35% nd 38% Cutoff 3 0.0128 0.00200 0.0186 0.0128 0.00200 0.0128 0.0128 nd 0.0128 Sens 3 94% 100% 90% 93% 100% 100% 100% nd 100% Spec 3 30% 7% 38% 30% 7% 32% 30% nd 32% Cutoff 4 0.0721 0.0767 0.0702 0.0721 0.0767 0.0702 0.0721 nd 0.0702 Sens 4 56% 62% 60% 60% 62% 67% 50% nd 50% Spec 4 71% 70% 70% 71% 70% 70% 71% nd 70% Cutoff 5 0.107 0.113 0.113 0.107 0.113 0.113 0.107 nd 0.113 Sens 5 50% 62% 50% 47% 62% 44% 25% nd 17% Spec 5 82% 80% 80% 82% 80% 80% 82% nd 80% Cutoff 6 0.204 0.218 0.219 0.204 0.218 0.219 0.204 nd 0.219 Sens 6 38% 50% 40% 33% 50% 33% 25% nd 17% Spec 6 90% 90% 91% 90% 90% 91% 90% nd 91% OR Quart 2 5.6 2.0 >3.4 4.3 2.0 >2.2 >3.2 nd >2.2 p Value 0.13 0.58 <0.30 0.20 0.58 <0.54 <0.32 nd <0.53 95% CI of 0.61 0.17 >0.33 0.45 0.17 >0.18 >0.32 nd >0.18 OR Quart 2 51 23 na 41 23 na na nd na OR Quart 3 2.0 0 >2.2 2.1 0 >3.4 >2.1 nd >2.2 p Value 0.58 na <0.54 0.56 na <0.30 <0.56 nd <0.53 95% CI of 0.17 na >0.18 0.18 na >0.33 >0.18 nd >0.18 OR Quart 3 23 na na 24 na na na nd na OR Quart 4 10 5.4 >6.0 10 5.4 >4.8 >3.2 nd >2.1 p Value 0.035 0.13 <0.11 0.035 0.13 <0.18 <0.32 nd <0.56 95% CI of 1.2 0.60 >0.65 1.2 0.60 >0.50 >0.32 nd >0.18 OR Quart 4 88 48 na 88 48 na na nd na
TABLE-US-00074 Thrombopoietin 0 hr prior to AKI stage 24 hr prior to AKI stage 48 hr prior to AKI stage Cohort 1 Cohort 2 Cohort 1 Cohort 2 Cohort 1 Cohort 2 sCr or UO Median 0.724 1.05 0.724 1.00 0.724 0.928 Average 0.736 1.00 0.736 0.940 0.736 0.849 Stdev 0.390 0.383 0.390 0.327 0.390 0.478 p (t-test) 0.012 0.057 0.44 Min 0.0129 0.280 0.0129 0.280 0.0129 0.110 Max 1.87 1.76 1.87 1.58 1.87 1.58 n (Samp) 103 16 103 15 103 8 n (Patient) 103 16 103 15 103 8 sCr only Median 0.772 1.14 0.772 1.07 nd nd Average 0.797 1.21 0.797 1.09 nd nd Stdev 0.449 0.341 0.449 0.257 nd nd p (t-test) 0.011 0.067 nd nd Min 0.0129 0.661 0.0129 0.661 nd nd Max 2.57 1.76 2.57 1.58 nd nd n (Samp) 170 8 170 8 nd nd n (Patient) 170 8 170 8 nd nd UO only Median 0.724 0.884 0.724 0.857 0.724 0.808 Average 0.734 0.905 0.734 0.891 0.734 0.794 Stdev 0.397 0.378 0.397 0.396 0.397 0.553 p (t-test) 0.20 0.26 0.73 Min 0.0129 0.280 0.0129 0.280 0.0129 0.110 Max 1.87 1.58 1.87 1.58 1.87 1.58 n (Samp) 87 10 87 9 87 6 n (Patient) 87 10 87 9 87 6 0 hr prior to AKI stage 24 hr prior to AKI stage 48 hr prior to AKI stage sCr or UO sCr only UO only sCr or UO sCr only UO only sCr or UO sCr only UO only AUC 0.69 0.79 0.62 0.66 0.74 0.61 0.59 nd 0.54 SE 0.078 0.097 0.099 0.081 0.10 0.10 0.11 nd 0.12 p 0.016 0.0030 0.22 0.054 0.020 0.31 0.41 nd 0.72 nCohort 1 103 170 87 103 170 87 103 nd 87 nCohort 2 16 8 10 15 8 9 8 nd 6 Cutoff 1 0.726 1.06 0.726 0.726 1.02 0.683 0.726 nd 0.233 Sens 1 75% 75% 70% 73% 75% 78% 75% nd 83% Spec 1 53% 75% 54% 53% 72% 40% 53% nd 14% Cutoff 2 0.683 1.02 0.683 0.683 0.996 0.487 0.233 nd 0.233 Sens 2 81% 88% 80% 80% 88% 89% 88% nd 83% Spec 2 42% 72% 40% 42% 70% 23% 13% nd 14% Cutoff 3 0.492 0.657 0.487 0.492 0.657 0.233 0.0129 nd 0.0129 Sens 3 94% 100% 90% 93% 100% 100% 100% nd 100% Spec 3 23% 36% 23% 23% 36% 14% 8% nd 8% Cutoff 4 0.947 0.996 0.914 0.947 0.996 0.914 0.947 nd 0.914 Sens 4 56% 88% 40% 60% 88% 44% 50% nd 33% Spec 4 71% 70% 70% 71% 70% 70% 71% nd 70% Cutoff 5 1.07 1.11 1.07 1.07 1.11 1.07 1.07 nd 1.07 Sens 5 44% 50% 40% 27% 25% 33% 25% nd 33% Spec 5 81% 81% 80% 81% 81% 80% 81% nd 80% Cutoff 6 1.18 1.29 1.18 1.18 1.29 1.18 1.18 nd 1.18 Sens 6 38% 25% 30% 27% 12% 33% 25% nd 33% Spec 6 90% 90% 91% 90% 90% 91% 90% nd 91% OR Quart 2 0.96 >1.0 0.48 0.96 >1.0 0.48 0 nd 0 p Value 0.97 <1.0 0.56 0.97 <1.0 0.56 na nd na 95% CI of 0.13 >0.061 0.040 0.13 >0.061 0.040 na nd na OR Quart 2 7.3 na 5.7 7.3 na 5.7 na nd na OR Quart 3 2.1 >2.1 1.6 2.8 >3.2 1.6 1.5 nd 1.0 p Value 0.42 <0.55 0.64 0.24 <0.32 0.64 0.67 nd 1.0 95% CI of 0.35 >0.18 0.24 0.50 >0.32 0.24 0.23 nd 0.13 OR Quart 3 12 na 10 16 na 10 9.8 nd 7.8 OR Quart 4 4.9 >5.5 2.1 3.4 >4.3 1.6 1.5 nd 0.95 p Value 0.059 <0.13 0.42 0.16 <0.20 0.64 0.67 nd 0.96 95% CI of 0.94 >0.62 0.35 0.62 >0.46 0.24 0.23 nd 0.12 OR Quart 4 26 na 13 18 na 10 9.8 nd 7.4
[0161] FIG. 5: Comparison of marker levels in EDTA samples collected from Cohort 1 (patients that did not progress beyond RIFLE stage 0) and in EDTA samples collected from subjects at 0, 24 hours, and 48 hours prior to reaching stage R, I or F in Cohort 2.
TABLE-US-00075 Alpha-2 macroglobulin 0 hr prior to AKI stage 24 hr prior to AKI stage 48 hr prior to AKI stage Cohort 1 Cohort 2 Cohort 1 Cohort 2 Cohort 1 Cohort 2 sCr or UO Median 583 569 583 598 583 563 Average 576 603 576 605 576 581 Stdev 168 225 168 159 168 101 p (t-test) 0.41 0.31 0.89 Min 22.9 245 22.9 307 22.9 437 Max 987 1640 987 1360 987 777 n (Samp) 105 45 105 49 105 25 n (Patient) 97 45 97 49 97 25 sCr only Median 566 606 566 591 566 607 Average 575 567 575 600 575 612 Stdev 179 86.3 179 147 179 105 p (t-test) 0.88 0.59 0.49 Min 22.9 394 22.9 390 22.9 463 Max 1640 675 1640 999 1640 763 n (Samp) 246 13 246 16 246 11 n (Patient) 160 13 160 16 160 11 UO only Median 574 576 574 612 574 563 Average 583 622 583 623 583 572 Stdev 152 237 152 160 152 94.3 p (t-test) 0.25 0.16 0.76 Min 270 245 270 307 270 437 Max 987 1640 987 1360 987 777 n (Samp) 100 39 100 43 100 21 n (Patient) 86 39 86 43 86 21 0 hr prior to AKI stage 24 hr prior to AKI stage 48 hr prior to AKI stage sCr or UO sCr only UO only sCr or UO sCr only UO only sCr or UO sCr only UO only AUC 0.49 0.51 0.52 0.53 0.55 0.56 0.48 0.58 0.47 SE 0.052 0.083 0.055 0.050 0.076 0.053 0.065 0.092 0.070 p 0.87 0.93 0.68 0.59 0.50 0.27 0.81 0.37 0.70 nCohort 1 105 246 100 105 246 100 105 246 100 nCohort 2 45 13 39 49 16 43 25 11 21 Cutoff 1 509 514 522 547 547 561 495 562 518 Sens 1 71% 77% 72% 71% 75% 72% 72% 73% 71% Spec 1 30% 33% 36% 41% 44% 47% 28% 48% 35% Cutoff 2 454 502 454 494 495 518 494 502 485 Sens 2 80% 85% 82% 82% 81% 81% 80% 82% 81% Spec 2 22% 29% 21% 28% 28% 35% 28% 29% 26% Cutoff 3 364 429 362 420 394 467 467 494 468 Sens 3 91% 92% 92% 92% 94% 91% 92% 91% 90% Spec 3 14% 16% 11% 19% 13% 23% 23% 28% 24% Cutoff 4 672 636 674 672 636 674 672 636 674 Sens 4 24% 23% 28% 22% 38% 23% 24% 36% 19% Spec 4 70% 70% 70% 70% 70% 70% 70% 70% 70% Cutoff 5 709 700 711 709 700 711 709 700 711 Sens 5 20% 0% 26% 18% 12% 23% 20% 27% 14% Spec 5 80% 80% 80% 80% 80% 80% 80% 80% 80% Cutoff 6 775 775 769 775 775 769 775 775 769 Sens 6 18% 0% 21% 4% 6% 5% 4% 0% 5% Spec 6 90% 90% 90% 90% 90% 90% 90% 90% 90% OR Quart 2 1.5 1.5 0.83 1.6 0.98 2.1 1.3 3.1 1.7 p Value 0.40 0.66 0.73 0.35 0.98 0.19 0.70 0.33 0.46 95% CI of 0.56 0.24 0.29 0.59 0.19 0.69 0.35 0.31 0.42 OR Quart 2 4.3 9.3 2.4 4.4 5.1 6.6 4.7 31 6.7 OR Quart 3 1.5 3.7 0.96 2.9 1.7 3.9 2.1 4.2 2.1 p Value 0.44 0.11 0.94 0.034 0.47 0.016 0.23 0.21 0.30 95% CI of 0.54 0.75 0.34 1.1 0.39 1.3 0.62 0.46 0.53 OR Quart 3 4.1 19 2.7 7.7 7.5 12 7.1 39 7.9 OR Quart 4 1.5 0.48 0.96 0.97 1.7 1.9 1.0 3.0 1.0 p Value 0.40 0.56 0.94 0.95 0.48 0.29 0.96 0.34 0.96 95% CI of 0.56 0.043 0.34 0.34 0.39 0.59 0.27 0.31 0.23 OR Quart 4 4.3 5.5 2.7 2.8 7.4 5.8 4.0 30 4.6
TABLE-US-00076 Apolipoprotein A-I 0 hr prior to AKI stage 24 hr prior to AKI stage 48 hr prior to AKI stage Cohort 1 Cohort 2 Cohort 1 Cohort 2 Cohort 1 Cohort 2 sCr or UO Median 591000 637000 591000 705000 591000 1640000 Average 838000 1080000 838000 1350000 838000 1730000 Stdev 768000 1270000 768000 1510000 768000 1180000 p (t-test) 0.16 0.0064 7.2E-6 Min 133000 248000 133000 162000 133000 174000 Max 5190000 7360000 5190000 9190000 5190000 5130000 n (Samp) 105 45 105 49 105 25 n (Patient) 97 45 97 49 97 25 sCr only Median 676000 844000 676000 618000 676000 942000 Average 1060000 1550000 1060000 1460000 1060000 2010000 Stdev 1040000 1890000 1040000 2180000 1040000 2520000 p (t-test) 0.12 0.18 0.0071 Min 6920 316000 6920 257000 6920 301000 Max 9190000 7360000 9190000 9190000 9190000 8110000 n (Samp) 246 13 246 16 246 11 n (Patient) 160 13 160 16 160 11 UO only Median 561000 637000 561000 748000 561000 2040000 Average 743000 926000 743000 1400000 743000 2190000 Stdev 514000 844000 514000 1580000 514000 1680000 p (t-test) 0.12 3.0E-4 4.6E-11 Min 154000 248000 154000 162000 154000 174000 Max 2560000 4900000 2560000 9190000 2560000 7360000 n (Samp) 100 39 100 43 100 21 n (Patient) 86 39 86 43 86 21 0 hr prior to AKI stage 24 hr prior to AKI stage 48 hr prior to AKI stage sCr or UO sCr only UO only sCr or UO sCr only UO only sCr or UO sCr only UO only AUC 0.56 0.58 0.56 0.60 0.53 0.61 0.75 0.55 0.82 SE 0.052 0.085 0.055 0.050 0.076 0.053 0.060 0.091 0.059 p 0.23 0.35 0.25 0.041 0.69 0.039 3.8E-5 0.59 5.8E-8 nCohort 1 105 246 100 105 246 100 105 246 100 nCohort 2 45 13 39 49 16 43 25 11 21 Cutoff 1 456000 464000 470000 477000 478000 427000 907000 373000 1140000 Sens 1 71% 77% 72% 71% 75% 72% 72% 73% 71% Spec 1 37% 32% 39% 38% 33% 33% 71% 20% 82% Cutoff 2 407000 408000 402000 407000 476000 395000 565000 363000 817000 Sens 2 80% 85% 82% 82% 81% 81% 80% 82% 81% Spec 2 29% 25% 24% 29% 33% 23% 50% 17% 69% Cutoff 3 316000 374000 316000 353000 358000 353000 363000 358000 504000 Sens 3 91% 92% 92% 92% 94% 91% 92% 91% 90% Spec 3 17% 20% 12% 23% 17% 19% 23% 17% 45% Cutoff 4 876000 1110000 861000 876000 1110000 861000 876000 1110000 861000 Sens 4 36% 38% 36% 39% 31% 42% 72% 45% 76% Spec 4 70% 70% 70% 70% 70% 70% 70% 70% 70% Cutoff 5 1160000 1690000 1120000 1160000 1690000 1120000 1160000 1690000 1120000 Sens 5 24% 38% 23% 35% 19% 37% 60% 27% 71% Spec 5 80% 80% 80% 80% 80% 80% 80% 80% 80% Cutoff 6 1740000 2560000 1330000 1740000 2560000 1330000 1740000 2560000 1330000 Sens 6 18% 8% 21% 29% 6% 35% 48% 27% 67% Spec 6 90% 96% 90% 90% 96% 90% 90% 96% 90% OR Quart 2 1.9 0.65 1.3 1.4 3.7 0.44 0.97 0 1.0 p Value 0.23 0.64 0.63 0.49 0.11 0.15 0.97 na 1.0 95% CI of 0.67 0.10 0.44 0.52 0.75 0.14 0.18 na 0.13 OR Quart 2 5.3 4.0 3.8 3.9 19 1.4 5.2 na 7.6 OR Quart 3 1.7 0.98 1.5 1.3 1.0 0.84 1.4 0.19 1.6 p Value 0.30 0.98 0.46 0.60 1.0 0.74 0.69 0.13 0.64 95% CI of 0.61 0.19 0.51 0.47 0.14 0.30 0.28 0.021 0.24 OR Quart 3 4.9 5.1 4.3 3.7 7.3 2.3 6.7 1.7 10 OR Quart 4 1.7 1.7 1.3 2.5 2.6 1.7 8.1 0.98 12 p Value 0.33 0.48 0.63 0.068 0.27 0.26 0.0029 0.98 0.0027 95% CI of 0.59 0.39 0.44 0.93 0.48 0.66 2.0 0.27 2.3 OR Quart 4 4.7 7.4 3.8 6.6 14 4.6 32 3.6 57
TABLE-US-00077 Apolipoprotein B-100 0 hr prior to AKI stage 24 hr prior to AKI stage 48 hr prior to AKI stage Cohort 1 Cohort 2 Cohort 1 Cohort 2 Cohort 1 Cohort 2 sCr or UO Median 145000 152000 145000 182000 145000 184000 Average 149000 154000 149000 176000 149000 179000 Stdev 43900 51300 43900 43300 43900 51600 p (t-test) 0.57 4.8E-4 0.0035 Min 71000 72200 71000 67300 71000 50900 Max 245000 255000 245000 252000 245000 274000 n (Samp) 105 45 105 49 105 25 n (Patient) 97 45 97 49 97 25 sCr only Median 160000 175000 160000 165000 160000 164000 Average 156000 159000 156000 165000 156000 146000 Stdev 48400 54400 48400 49900 48400 59400 p (t-test) 0.85 0.51 0.50 Min 2920 72200 2920 81400 2920 51300 Max 274000 255000 274000 252000 274000 215000 n (Samp) 246 13 246 16 246 11 n (Patient) 160 13 160 16 160 11 UO only Median 149000 152000 149000 182000 149000 186000 Average 147000 155000 147000 176000 147000 189000 Stdev 43000 50200 43000 43000 43000 49800 p (t-test) 0.38 4.0E-4 1.3E-4 Min 71000 74400 71000 67300 71000 50900 Max 245000 251000 245000 244000 245000 274000 n (Samp) 100 39 100 43 100 21 n (Patient) 86 39 86 43 86 21 0 hr prior to AKI stage 24 hr prior to AKI stage 48 hr prior to AKI stage sCr or UO sCr only UO only sCr or UO sCr only UO only sCr or UO sCr only UO only AUC 0.52 0.51 0.54 0.67 0.54 0.69 0.69 0.46 0.75 SE 0.052 0.083 0.055 0.048 0.076 0.051 0.063 0.091 0.065 p 0.73 0.88 0.48 3.7E-4 0.64 2.5E-4 0.0031 0.69 9.7E-5 nCohort 1 105 246 100 105 246 100 105 246 100 nCohort 2 45 13 39 49 16 43 25 11 21 Cutoff 1 111000 113000 110000 163000 138000 160000 166000 106000 174000 Sens 1 71% 77% 72% 71% 75% 72% 72% 73% 71% Spec 1 23% 24% 26% 64% 37% 63% 65% 20% 71% Cutoff 2 107000 111000 103000 139000 124000 145000 156000 83900 166000 Sens 2 80% 85% 82% 82% 81% 81% 80% 82% 81% Spec 2 21% 22% 23% 46% 29% 48% 60% 6% 67% Cutoff 3 87500 87000 90000 99300 99300 103000 103000 74400 126000 Sens 3 91% 92% 92% 92% 94% 91% 92% 91% 90% Spec 3 6% 7% 8% 18% 17% 23% 20% 2% 35% Cutoff 4 181000 186000 169000 181000 186000 169000 181000 186000 169000 Sens 4 33% 31% 41% 55% 25% 67% 52% 36% 76% Spec 4 70% 70% 70% 70% 70% 70% 70% 70% 70% Cutoff 5 193000 200000 192000 193000 200000 192000 193000 200000 192000 Sens 5 22% 23% 26% 37% 19% 40% 44% 36% 48% Spec 5 80% 80% 80% 80% 80% 80% 80% 80% 80% Cutoff 6 205000 217000 204000 205000 217000 204000 205000 217000 204000 Sens 6 18% 15% 23% 18% 19% 19% 24% 0% 38% Spec 6 90% 90% 90% 90% 90% 90% 90% 90% 90% OR Quart 2 0.57 0.48 0.83 0.97 1.3 0.78 0.62 0.49 2.1 p Value 0.28 0.40 0.73 0.96 0.71 0.71 0.62 0.42 0.56 95% CI of 0.21 0.084 0.29 0.28 0.29 0.21 0.097 0.087 0.18 OR Quart 2 1.6 2.7 2.4 3.3 6.2 2.8 4.0 2.8 24 OR Quart 3 0.78 0.98 0.71 5.3 1.7 3.5 3.8 0.24 11 p Value 0.62 0.98 0.54 0.0024 0.47 0.027 0.066 0.21 0.032 95% CI of 0.29 0.24 0.24 1.8 0.39 1.1 0.92 0.026 1.2 OR Quart 3 2.1 4.1 2.1 16 7.5 10 16 2.2 91 OR Quart 4 0.85 0.73 1.3 4.6 1.3 4.3 4.8 1.0 14 p Value 0.74 0.68 0.66 0.0056 0.71 0.0088 0.026 0.98 0.016 95% CI of 0.33 0.16 0.45 1.6 0.29 1.4 1.2 0.24 1.6 OR Quart 4 2.2 3.4 3.5 13 6.2 13 19 4.3 120
TABLE-US-00078 Calcitonin 0 hr prior to AKI stage 24 hr prior to AKI stage 48 hr prior to AKI stage Cohort 1 Cohort 2 Cohort 1 Cohort 2 Cohort 1 Cohort 2 sCr or UO Median 29.0 51.3 29.0 54.0 29.0 91.0 Average 297 452 297 374 297 454 Stdev 848 970 848 794 848 912 p (t-test) 0.24 0.54 0.37 Min 0.0604 0.0604 0.0604 0.0604 0.0604 0.0604 Max 6590 3580 6590 3880 6590 3880 n (Samp) 262 51 262 56 262 26 n (Patient) 110 51 110 56 110 26 sCr only Median 26.1 77.9 26.1 71.7 26.1 42.7 Average 278 630 278 600 278 429 Stdev 749 1250 749 1150 749 1060 p (t-test) 0.059 0.061 0.48 Min 0.0604 0.0604 0.0604 0.0604 0.0604 2.07 Max 6590 3580 6590 3880 6590 3880 n (Samp) 466 18 466 21 466 13 n (Patient) 180 18 180 21 180 13 UO only Median 39.3 72.6 39.3 58.4 39.3 75.0 Average 374 445 374 325 374 353 Stdev 986 867 986 599 986 649 p (t-test) 0.64 0.73 0.92 Min 0.0604 2.07 0.0604 0.0604 0.0604 0.0604 Max 6590 3580 6590 2390 6590 2440 n (Samp) 221 50 221 52 221 23 n (Patient) 91 50 91 52 91 23 0 hr prior to AKI stage 24 hr prior to AKI stage 48 hr prior to AKI stage sCr or UO sCr only UO only sCr or UO sCr only UO only sCr or UO sCr only UO only AUC 0.56 0.60 0.56 0.57 0.58 0.55 0.57 0.56 0.52 SE 0.045 0.072 0.046 0.043 0.066 0.045 0.061 0.083 0.064 p 0.17 0.18 0.20 0.095 0.23 0.26 0.23 0.50 0.78 nCohort 1 262 466 221 262 466 221 262 466 221 nCohort 2 51 18 50 56 21 52 26 13 23 Cutoff 1 12.3 40.0 20.0 23.5 13.9 23.5 12.6 11.9 6.45 Sens 1 71% 72% 70% 71% 71% 75% 73% 77% 74% Spec 1 34% 57% 39% 48% 37% 43% 35% 34% 14% Cutoff 2 9.62 4.98 11.8 8.19 8.19 8.73 6.45 7.09 5.33 Sens 2 82% 83% 80% 80% 81% 81% 81% 85% 83% Spec 2 27% 13% 27% 24% 24% 18% 18% 20% 11% Cutoff 3 4.37 0 9.43 3.33 3.27 6.45 4.44 6.38 0 Sens 3 90% 100% 90% 91% 90% 90% 92% 92% 100% Spec 3 13% 0% 19% 12% 10% 14% 13% 17% 0% Cutoff 4 90.4 98.8 123 90.4 98.8 123 90.4 98.8 123 Sens 4 37% 44% 40% 38% 38% 35% 50% 38% 43% Spec 4 70% 70% 71% 70% 70% 71% 70% 70% 71% Cutoff 5 177 190 225 177 190 225 177 190 225 Sens 5 25% 33% 24% 30% 33% 27% 35% 31% 26% Spec 5 80% 80% 80% 80% 80% 80% 80% 80% 80% Cutoff 6 665 762 805 665 762 805 665 762 805 Sens 6 18% 17% 18% 16% 19% 13% 15% 8% 13% Spec 6 90% 90% 90% 90% 90% 90% 90% 90% 90% OR Quart 2 1.4 0.24 1.1 0.52 0.39 1.0 0.55 0.99 0.26 p Value 0.48 0.21 0.84 0.16 0.26 1.0 0.35 0.99 0.10 95% CI of 0.55 0.027 0.43 0.20 0.074 0.40 0.15 0.20 0.052 OR Quart 2 3.5 2.2 2.8 1.3 2.0 2.5 2.0 5.0 1.3 OR Quart 3 1.5 1.5 1.3 1.2 1.2 1.3 0.55 0.66 1.0 p Value 0.36 0.52 0.52 0.69 0.77 0.51 0.35 0.65 1.0 95% CI of 0.61 0.42 0.55 0.53 0.36 0.56 0.15 0.11 0.33 OR Quart 3 3.8 5.5 3.3 2.6 4.0 3.2 2.0 4.0 3.0 OR Quart 4 2.1 1.8 1.8 1.3 1.6 1.6 1.7 1.7 1.0 p Value 0.097 0.36 0.21 0.45 0.40 0.30 0.32 0.48 1.0 95% CI of 0.87 0.51 0.73 0.62 0.52 0.67 0.61 0.39 0.33 OR Quart 4 5.1 6.3 4.2 2.9 5.1 3.7 4.6 7.2 3.0
TABLE-US-00079 C-reactive protein 0 hr prior to AKI stage 24 hr prior to AKI stage 48 hr prior to AKI stage Cohort 1 Cohort 2 Cohort 1 Cohort 2 Cohort 1 Cohort 2 sCr or UO Median 59500 50400 59500 40800 59500 45900 Average 54800 51700 54800 74700 54800 52700 Stdev 32400 32500 32400 118000 32400 34800 p (t-test) 0.59 0.11 0.78 Min 1.00E-9 2360 1.00E-9 3810 1.00E-9 12800 Max 251000 154000 251000 573000 251000 187000 n (Samp) 105 45 105 49 105 25 n (Patient) 97 45 97 49 97 25 sCr only Median 47700 37200 47700 65800 47700 55400 Average 56100 42300 56100 75500 56100 49600 Stdev 56500 30000 56500 100000 56500 21200 p (t-test) 0.38 0.21 0.71 Min 1.00E-9 5230 1.00E-9 10600 1.00E-9 19400 Max 573000 119000 573000 444000 573000 77100 n (Samp) 246 13 246 16 246 11 n (Patient) 160 13 160 16 160 11 UO only Median 61300 56600 61300 41100 61300 45900 Average 55200 55700 55200 69900 55200 55900 Stdev 31500 32600 31500 111000 31500 36400 p (t-test) 0.93 0.23 0.93 Min 5830 2360 5830 3810 5830 12800 Max 251000 154000 251000 573000 251000 187000 n (Samp) 100 39 100 43 100 21 n (Patient) 86 39 86 43 86 21 0 hr prior to AKI stage 24 hr prior to AKI stage 48 hr prior to AKI stage sCr or UO sCr only UO only sCr or UO sCr only UO only sCr or UO sCr only UO only AUC 0.47 0.40 0.50 0.45 0.56 0.44 0.44 0.49 0.47 SE 0.052 0.085 0.055 0.050 0.076 0.053 0.065 0.089 0.070 p 0.55 0.22 0.95 0.35 0.46 0.23 0.32 0.95 0.62 nCohort 1 105 246 100 105 246 100 105 246 100 nCohort 2 45 13 39 49 16 43 25 11 21 Cutoff 1 28100 25800 31900 31000 36800 31000 33200 34200 36300 Sens 1 71% 77% 72% 71% 75% 72% 72% 73% 71% Spec 1 20% 19% 24% 23% 39% 22% 27% 31% 29% Cutoff 2 23500 23500 23800 26700 32800 27000 30200 27900 31900 Sens 2 80% 85% 82% 82% 81% 81% 80% 82% 81% Spec 2 17% 16% 15% 18% 30% 16% 22% 22% 24% Cutoff 3 9490 8650 10600 19700 24800 23800 22200 22200 26600 Sens 3 91% 92% 92% 92% 94% 91% 92% 91% 90% Spec 3 3% 5% 3% 13% 18% 15% 16% 15% 15% Cutoff 4 70000 70000 70000 70000 70000 70000 70000 70000 70000 Sens 4 13% 8% 15% 8% 6% 7% 16% 9% 19% Spec 4 92% 90% 94% 92% 90% 94% 92% 90% 94% Cutoff 5 70000 70000 70000 70000 70000 70000 70000 70000 70000 Sens 5 13% 8% 15% 8% 6% 7% 16% 9% 19% Spec 5 92% 90% 94% 92% 90% 94% 92% 90% 94% Cutoff 6 70000 72800 70000 70000 72800 70000 70000 72800 70000 Sens 6 13% 8% 15% 8% 6% 7% 16% 9% 19% Spec 6 92% 90% 94% 92% 90% 94% 92% 90% 94% OR Quart 2 1.8 2.0 0.96 0.91 1.3 7.9 1.3 5.4 0.75 p Value 0.27 0.57 0.94 0.85 0.71 0.0029 0.68 0.13 0.72 95% CI of 0.64 0.18 0.34 0.33 0.29 2.0 0.33 0.62 0.15 OR Quart 2 5.1 23 2.7 2.5 6.2 30 5.5 48 3.7 OR Quart 3 1.5 4.2 1.4 1.4 2.5 5.5 3.2 2.1 2.9 p Value 0.43 0.21 0.50 0.47 0.20 0.015 0.079 0.56 0.11 95% CI of 0.54 0.46 0.52 0.55 0.62 1.4 0.87 0.18 0.78 OR Quart 3 4.4 39 3.9 3.7 10 22 11 23 11 OR Quart 4 2.3 6.6 0.50 1.5 0.65 6.5 1.7 3.1 1.4 p Value 0.11 0.084 0.23 0.42 0.64 0.0073 0.46 0.33 0.68 95% CI of 0.82 0.77 0.16 0.57 0.10 1.7 0.42 0.32 0.33 OR Quart 4 6.4 57 1.6 3.9 4.0 25 6.6 31 5.6
TABLE-US-00080 Tissue factor 0 hr prior to AKI stage 24 hr prior to AKI stage 48 hr prior to AKI stage Cohort 1 Cohort 2 Cohort 1 Cohort 2 Cohort 1 Cohort 2 sCr or UO Median 0.510 0.00841 0.510 0.461 0.510 0.464 Average 0.694 0.399 0.694 0.561 0.694 0.546 Stdev 0.813 0.635 0.813 0.584 0.813 0.507 p (t-test) 0.015 0.25 0.36 Min 0.00841 0.00841 0.00841 0.00841 0.00841 0.00841 Max 7.23 3.31 7.23 2.44 7.23 1.98 n (Samp) 262 51 262 56 262 26 n (Patient) 110 51 110 56 110 26 sCr only Median 0.475 0.426 0.475 0.483 0.475 0.482 Average 0.613 0.579 0.613 0.662 0.613 0.555 Stdev 0.703 0.828 0.703 0.751 0.703 0.604 p (t-test) 0.84 0.76 0.77 Min 0.00841 0.00841 0.00841 0.00841 0.00841 0.00841 Max 7.23 3.31 7.23 2.44 7.23 1.98 n (Samp) 466 18 466 21 466 13 n (Patient) 180 18 180 21 180 13 UO only Median 0.483 0.265 0.483 0.448 0.483 0.420 Average 0.669 0.462 0.669 0.568 0.669 0.421 Stdev 0.831 0.642 0.831 0.597 0.831 0.387 p (t-test) 0.099 0.41 0.16 Min 0.00841 0.00841 0.00841 0.00841 0.00841 0.00841 Max 7.23 3.31 7.23 2.78 7.23 1.42 n (Samp) 221 50 221 52 221 23 n (Patient) 91 50 91 52 91 23 0 hr prior to AKI stage 24 hr prior to AKI stage 48 hr prior to AKI stage sCr or UO sCr only UO only sCr or UO sCr only UO only sCr or UO sCr only UO only AUC 0.34 0.45 0.40 0.46 0.50 0.47 0.47 0.48 0.42 SE 0.044 0.071 0.046 0.043 0.064 0.045 0.060 0.082 0.065 p 4.3E-4 0.45 0.030 0.31 0.99 0.54 0.58 0.78 0.24 nCohort 1 262 466 221 262 466 221 262 466 221 nCohort 2 51 18 50 56 21 52 26 13 23 Cutoff 1 0 0 0 0 0 0.286 0.00841 0 0 Sens 1 100% 100% 100% 100% 100% 71% 73% 100% 100% Spec 1 0% 0% 0% 0% 0% 33% 24% 0% 0% Cutoff 2 0 0 0 0 0 0 0 0 0 Sens 2 100% 100% 100% 100% 100% 100% 100% 100% 100% Spec 2 0% 0% 0% 0% 0% 0% 0% 0% 0% Cutoff 3 0 0 0 0 0 0 0 0 0 Sens 3 100% 100% 100% 100% 100% 100% 100% 100% 100% Spec 3 0% 0% 0% 0% 0% 0% 0% 0% 0% Cutoff 4 0.828 0.758 0.758 0.828 0.758 0.758 0.828 0.758 0.758 Sens 4 18% 17% 24% 23% 29% 25% 19% 38% 9% Spec 4 71% 70% 70% 71% 70% 70% 71% 70% 70% Cutoff 5 1.06 1.01 1.04 1.06 1.01 1.04 1.06 1.01 1.04 Sens 5 12% 17% 14% 18% 24% 17% 15% 15% 9% Spec 5 80% 81% 81% 80% 81% 81% 80% 81% 81% Cutoff 6 1.52 1.35 1.49 1.52 1.35 1.49 1.52 1.35 1.49 Sens 6 6% 11% 6% 5% 19% 6% 4% 8% 0% Spec 6 90% 90% 90% 90% 90% 90% 90% 90% 90% OR Quart 2 1.3 1.3 0.88 0.75 0.99 0.72 1.4 1.3 3.2 p Value 0.58 0.70 0.80 0.52 0.99 0.50 0.55 0.70 0.16 95% CI of 0.47 0.29 0.34 0.31 0.28 0.28 0.44 0.29 0.62 OR Quart 2 3.8 6.1 2.3 1.8 3.5 1.9 4.8 6.1 17 OR Quart 3 2.4 2.1 1.4 1.3 1.2 1.6 1.2 1.0 4.5 p Value 0.067 0.32 0.49 0.54 0.77 0.28 0.75 1.0 0.066 95% CI of 0.94 0.50 0.56 0.57 0.36 0.69 0.35 0.20 0.91 OR Quart 3 6.4 8.4 3.4 2.9 4.0 3.6 4.2 5.1 22 OR Quart 4 3.5 1.7 2.1 1.4 0.99 1.2 1.7 1.0 3.8 p Value 0.0075 0.48 0.085 0.40 0.99 0.63 0.39 0.99 0.10 95% CI of 1.4 0.40 0.90 0.63 0.28 0.52 0.52 0.20 0.76 OR Quart 4 9.0 7.3 5.0 3.1 3.5 2.9 5.4 5.1 19
TABLE-US-00081 Interleukin-5 0 hr prior to AKI stage 24 hr prior to AKI stage 48 hr prior to AKI stage Cohort 1 Cohort 2 Cohort 1 Cohort 2 Cohort 1 Cohort 2 sCr or UO Median 0.855 0.739 0.855 0.862 0.855 0.899 Average 2.11 3.71 2.11 5.81 2.11 8.75 Stdev 4.54 8.54 4.54 15.3 4.54 23.0 p (t-test) 0.14 0.024 0.0064 Min 1.00E-9 1.00E-9 1.00E-9 1.00E-9 1.00E-9 1.00E-9 Max 39.5 39.8 39.5 74.3 39.5 112 n (Samp) 105 45 105 49 105 25 n (Patient) 97 45 97 49 97 25 sCr only Median 0.815 0.911 0.815 0.400 0.815 0.862 Average 2.73 2.82 2.73 5.92 2.73 14.2 Stdev 7.43 5.37 7.43 18.5 7.43 33.1 p (t-test) 0.96 0.15 1.8E-4 Min 1.00E-9 0.310 1.00E-9 1.00E-9 1.00E-9 1.00E-9 Max 64.3 20.2 64.3 74.3 64.3 112 n (Samp) 246 13 246 16 246 11 n (Patient) 160 13 160 16 160 11 UO only Median 0.906 0.617 0.906 0.983 0.906 0.899 Average 4.64 3.49 4.64 4.71 4.64 3.51 Stdev 16.7 8.75 16.7 12.2 16.7 7.84 p (t-test) 0.68 0.98 0.76 Min 1.00E-9 1.00E-9 1.00E-9 1.00E-9 1.00E-9 1.00E-9 Max 120 39.8 120 64.3 120 32.9 n (Samp) 100 39 100 43 100 21 n (Patient) 86 39 86 43 86 21 0 hr prior to AKI stage 24 hr prior to AKI stage 48 hr prior to AKI stage sCr or UO sCr only UO only sCr or UO sCr only UO only sCr or UO sCr only UO only AUC 0.50 0.56 0.45 0.46 0.37 0.47 0.53 0.59 0.49 SE 0.052 0.084 0.055 0.050 0.077 0.053 0.065 0.092 0.070 p 0.95 0.49 0.33 0.43 0.10 0.57 0.66 0.32 0.83 nCohort 1 105 246 100 105 246 100 105 246 100 nCohort 2 45 13 39 49 16 43 25 11 21 Cutoff 1 0.442 0.510 0.360 0.225 0.136 0.292 0.442 0.567 0.553 Sens 1 71% 77% 72% 71% 75% 72% 72% 73% 71% Spec 1 30% 35% 21% 16% 13% 19% 30% 38% 35% Cutoff 2 0.330 0.444 0.232 0.143 0.0826 0.190 0.225 0.427 0.225 Sens 2 80% 85% 82% 82% 81% 81% 80% 82% 81% Spec 2 22% 31% 16% 12% 8% 12% 16% 30% 15% Cutoff 3 0.115 0.435 0 0.0524 0 0.100 0.0524 0.119 0.0760 Sens 3 91% 92% 100% 92% 100% 91% 92% 91% 90% Spec 3 12% 30% 0% 6% 0% 9% 6% 13% 6% Cutoff 4 1.76 1.61 1.96 1.76 1.61 1.96 1.76 1.61 1.96 Sens 4 33% 31% 31% 29% 19% 30% 36% 45% 33% Spec 4 70% 70% 70% 70% 70% 70% 70% 70% 70% Cutoff 5 2.25 2.41 2.84 2.25 2.41 2.84 2.25 2.41 2.84 Sens 5 29% 23% 21% 27% 19% 23% 36% 45% 19% Spec 5 80% 80% 80% 80% 80% 80% 80% 80% 80% Cutoff 6 4.90 4.90 6.30 4.90 4.90 6.30 4.90 4.90 6.30 Sens 6 11% 8% 10% 16% 12% 9% 20% 27% 10% Spec 6 90% 90% 90% 90% 90% 90% 90% 90% 90% OR Quart 2 1.2 5.2 0.42 0.92 1.0 0.88 0.96 1.0 0.64 p Value 0.69 0.14 0.15 0.87 0.98 0.80 0.95 1.0 0.53 95% CI of 0.47 0.60 0.13 0.36 0.20 0.33 0.28 0.14 0.16 OR Quart 2 3.2 46 1.4 2.4 5.2 2.4 3.4 7.3 2.5 OR Quart 3 0.33 3.0 1.3 0.52 1.0 0.40 0.62 1.0 1.0 p Value 0.059 0.34 0.61 0.21 1.0 0.11 0.49 1.0 0.95 95% CI of 0.10 0.31 0.47 0.19 0.19 0.13 0.16 0.14 0.29 OR Quart 3 1.0 30 3.6 1.4 5.1 1.2 2.4 7.3 3.7 OR Quart 4 1.2 4.1 1.4 1.5 2.5 1.3 1.6 2.6 0.83 p Value 0.69 0.21 0.55 0.43 0.19 0.56 0.42 0.27 0.79 95% CI of 0.47 0.45 0.49 0.58 0.63 0.51 0.50 0.48 0.22 OR Quart 4 3.2 38 3.8 3.7 10 3.5 5.2 14 3.1
TABLE-US-00082 Interleukin-6 receptor subunit beta 0 hr prior to AKI stage 24 hr prior to AKI stage 48 hr prior to AKI stage Cohort 1 Cohort 2 Cohort 1 Cohort 2 Cohort 1 Cohort 2 sCr or UO Median 122000 127000 122000 139000 122000 137000 Average 127000 134000 127000 137000 127000 130000 Stdev 32000 44100 32000 44400 32000 37500 p (t-test) 0.41 0.25 0.76 Min 40800 41200 40800 11900 40800 38400 Max 203000 212000 203000 224000 203000 200000 n (Samp) 53 29 53 34 53 18 n (Patient) 51 29 51 34 51 18 sCr only Median 130000 122000 130000 122000 130000 130000 Average 129000 126000 129000 127000 129000 132000 Stdev 40000 40200 40000 37800 40000 26700 p (t-test) 0.83 0.79 0.85 Min 11900 55400 11900 51200 11900 99900 Max 231000 195000 231000 189000 231000 177000 n (Samp) 133 10 133 17 133 8 n (Patient) 101 10 101 17 101 8 UO only Median 131000 139000 131000 140000 131000 142000 Average 132000 138000 132000 145000 132000 133000 Stdev 33400 45700 33400 49500 33400 42200 p (t-test) 0.52 0.15 0.96 Min 40800 41200 40800 11900 40800 38400 Max 203000 212000 203000 275000 203000 200000 n (Samp) 54 23 54 30 54 13 n (Patient) 47 23 47 30 47 13 0 hr prior to AKI stage 24 hr prior to AKI stage 48 hr prior to AKI stage sCr or UO sCr only UO only sCr or UO sCr only UO only sCr or UO sCr only UO only AUC 0.55 0.49 0.54 0.59 0.49 0.60 0.53 0.52 0.50 SE 0.067 0.096 0.073 0.063 0.075 0.066 0.080 0.11 0.090 p 0.44 0.89 0.63 0.14 0.86 0.15 0.72 0.83 0.97 nCohort 1 53 133 54 53 133 54 53 133 54 nCohort 2 29 10 23 34 17 30 18 8 13 Cutoff 1 107000 115000 104000 120000 108000 129000 119000 119000 129000 Sens 1 72% 70% 74% 71% 71% 70% 72% 75% 77% Spec 1 26% 41% 20% 49% 30% 50% 45% 44% 50% Cutoff 2 96800 107000 91600 108000 101000 120000 99300 101000 91600 Sens 2 83% 80% 83% 82% 82% 80% 83% 88% 85% Spec 2 17% 29% 11% 28% 23% 46% 21% 23% 11% Cutoff 3 75500 88100 80400 91600 75500 92600 75500 99300 75500 Sens 3 93% 90% 91% 91% 94% 90% 94% 100% 92% Spec 3 4% 14% 4% 15% 7% 11% 4% 22% 4% Cutoff 4 150000 150000 154000 150000 150000 154000 150000 150000 154000 Sens 4 41% 30% 43% 32% 29% 33% 17% 25% 15% Spec 4 72% 71% 70% 72% 71% 70% 72% 71% 70% Cutoff 5 156000 162000 166000 156000 162000 166000 156000 162000 166000 Sens 5 38% 20% 26% 32% 29% 30% 11% 12% 15% Spec 5 81% 80% 81% 81% 80% 81% 81% 80% 81% Cutoff 6 169000 179000 173000 169000 179000 173000 169000 179000 173000 Sens 6 24% 10% 26% 21% 6% 30% 11% 0% 15% Spec 6 91% 90% 91% 91% 90% 91% 91% 90% 91% OR Quart 2 0.93 0.31 0.46 1.2 0.58 3.2 0.14 1.0 0.58 p Value 0.91 0.33 0.29 0.82 0.48 0.10 0.091 1.0 0.58 95% CI of 0.26 0.031 0.11 0.32 0.13 0.79 0.015 0.13 0.083 OR Quart 2 3.4 3.2 1.9 4.3 2.6 13 1.4 7.5 4.0 OR Quart 3 0.46 1.4 0.79 2.1 0.78 2.1 2.4 1.5 2.4 p Value 0.29 0.69 0.73 0.26 0.72 0.30 0.22 0.64 0.29 95% CI of 0.11 0.28 0.21 0.59 0.19 0.51 0.60 0.24 0.48 OR Quart 3 1.9 6.6 3.0 7.4 3.1 8.8 9.7 9.9 12 OR Quart 4 2.0 0.67 0.73 2.5 1.0 3.9 0.48 0.47 0.58 p Value 0.26 0.67 0.65 0.15 0.96 0.056 0.37 0.55 0.58 95% CI of 0.58 0.10 0.19 0.71 0.27 0.97 0.095 0.041 0.083 OR Quart 4 7.2 4.3 2.8 8.8 3.9 15 2.4 5.4 4.0
TABLE-US-00083 Macrophage metalloelastase 0 hr prior to AKI stage 24 hr prior to AKI stage 48 hr prior to AKI stage Cohort 1 Cohort 2 Cohort 1 Cohort 2 Cohort 1 Cohort 2 sCr or UO Median 36.8 1.00E-9 36.8 36.8 nd nd Average 25.7 16.9 25.7 22.7 nd nd Stdev 19.9 24.5 19.9 22.9 nd nd p (t-test) 0.30 0.67 nd nd Min 1.00E-9 1.00E-9 1.00E-9 1.00E-9 nd nd Max 61.3 61.3 61.3 61.3 nd nd n (Samp) 27 8 27 13 nd nd n (Patient) 26 8 26 13 nd nd sCr only Median nd nd 36.8 36.8 nd nd Average nd nd 25.4 26.4 nd nd Stdev nd nd 21.1 26.1 nd nd p (t-test) nd nd 0.91 nd nd Min nd nd 1.00E-9 1.00E-9 nd nd Max nd nd 61.3 61.3 nd nd n (Samp) nd nd 47 7 nd nd n (Patient) nd nd 44 7 nd nd UO only Median 36.8 1.00E-9 36.8 36.8 nd nd Average 24.8 19.3 24.8 24.5 nd nd Stdev 20.2 25.4 20.2 22.4 nd nd p (t-test) 0.54 0.97 nd nd Min 1.00E-9 1.00E-9 1.00E-9 1.00E-9 nd nd Max 61.3 61.3 61.3 61.3 nd nd n (Samp) 28 7 28 10 nd nd n (Patient) 26 7 26 10 nd nd 0 hr prior to AKI stage 24 hr prior to AKI stage 48 hr prior to AKI stage sCr or UO sCr only UO only sCr or UO sCr only UO only sCr or UO sCr only UO only AUC 0.39 nd 0.43 0.47 0.53 0.50 nd nd nd SE 0.12 nd 0.13 0.099 0.12 0.11 nd nd nd p 0.34 nd 0.57 0.77 0.83 0.99 nd nd nd nCohort 1 27 nd 28 27 47 28 nd nd nd nCohort 2 8 nd 7 13 7 10 nd nd nd Cutoff 1 0 nd 0 0 0 0 nd nd nd Sens 1 100% nd 100% 100% 100% 100% nd nd nd Spec 1 0% nd 0% 0% 0% 0% nd nd nd Cutoff 2 0 nd 0 0 0 0 nd nd nd Sens 2 100% nd 100% 100% 100% 100% nd nd nd Spec 2 0% nd 0% 0% 0% 0% nd nd nd Cutoff 3 0 nd 0 0 0 0 nd nd nd Sens 3 100% nd 100% 100% 100% 100% nd nd nd Spec 3 0% nd 0% 0% 0% 0% nd nd nd Cutoff 4 36.8 nd 36.8 36.8 36.8 36.8 nd nd nd Sens 4 12% nd 14% 15% 29% 10% nd nd nd Spec 4 93% nd 93% 93% 89% 93% nd nd nd Cutoff 5 36.8 nd 36.8 36.8 36.8 36.8 nd nd nd Sens 5 12% nd 14% 15% 29% 10% nd nd nd Spec 5 93% nd 93% 93% 89% 93% nd nd nd Cutoff 6 36.8 nd 36.8 36.8 61.3 36.8 nd nd nd Sens 6 12% nd 14% 15% 0% 10% nd nd nd Spec 6 93% nd 93% 93% 100% 93% nd nd nd OR Quart 2 1.0 nd 2.3 2.7 0 1.1 nd nd nd p Value 1.0 nd 0.53 0.34 na 0.94 nd nd nd 95% CI of 0.053 nd 0.17 0.36 na 0.060 nd nd nd OR Quart 2 19 nd 31 20 na 21 nd nd nd OR Quart 3 4.0 nd 4.0 1.0 0.61 9.0 nd nd nd p Value 0.28 nd 0.28 1.0 0.62 0.074 nd nd nd 95% CI of 0.33 nd 0.33 0.11 0.083 0.81 nd nd nd OR Quart 3 49 nd 49 8.9 4.4 100 nd nd nd OR Quart 4 4.8 nd 1.1 4.0 0.56 4.5 nd nd nd p Value 0.22 nd 0.93 0.17 0.56 0.24 nd nd nd 95% CI of 0.38 nd 0.060 0.55 0.077 0.37 nd nd nd OR Quart 4 60 nd 22 29 4.0 54 nd nd nd
TABLE-US-00084 Sex hormone-binding globulin 0 hr prior to AKI stage 24 hr prior to AKI stage 48 hr prior to AKI stage Cohort 1 Cohort 2 Cohort 1 Cohort 2 Cohort 1 Cohort 2 sCr or UO Median 35.0 36.7 35.0 35.6 35.0 37.1 Average 40.0 39.2 40.0 38.4 40.0 37.1 Stdev 19.3 16.1 19.3 15.6 19.3 11.7 p (t-test) 0.78 0.54 0.45 Min 7.91 15.3 7.91 14.6 7.91 17.0 Max 142 86.6 142 91.5 142 65.4 n (Samp) 262 51 262 56 262 26 n (Patient) 110 51 110 56 110 26 sCr only Median 35.0 32.0 35.0 30.6 35.0 32.1 Average 38.5 39.1 38.5 39.6 38.5 37.9 Stdev 17.8 21.3 17.8 22.0 17.8 20.5 p (t-test) 0.89 0.78 0.91 Min 7.56 15.3 7.56 14.6 7.56 16.7 Max 142 86.6 142 91.3 142 79.0 n (Samp) 466 18 466 21 466 13 n (Patient) 180 18 180 21 180 13 UO only Median 34.4 36.8 34.4 37.5 34.4 37.8 Average 40.6 39.2 40.6 40.2 40.6 40.0 Stdev 19.8 14.8 19.8 15.1 19.8 13.0 p (t-test) 0.63 0.87 0.88 Min 9.10 18.5 9.10 19.2 9.10 23.0 Max 142 82.6 142 91.5 142 73.4 n (Samp) 221 50 221 52 221 23 n (Patient) 91 50 91 52 91 23 0 hr prior to AKI stage 24 hr prior to AKI stage 48 hr prior to AKI stage sCr or UO sCr only UO only sCr or UO sCr only UO only sCr or UO sCr only UO only AUC 0.50 0.47 0.50 0.49 0.46 0.53 0.49 0.46 0.54 SE 0.044 0.071 0.045 0.043 0.066 0.045 0.060 0.083 0.064 p 0.94 0.64 0.99 0.75 0.59 0.56 0.83 0.63 0.58 nCohort 1 262 466 221 262 466 221 262 466 221 nCohort 2 51 18 50 56 21 52 26 13 23 Cutoff 1 29.5 24.0 29.2 29.1 24.7 31.9 28.5 20.3 35.0 Sens 1 71% 72% 70% 71% 71% 71% 73% 77% 74% Spec 1 29% 15% 27% 27% 17% 40% 25% 8% 52% Cutoff 2 26.9 22.6 26.9 24.7 24.2 28.8 26.7 19.6 27.7 Sens 2 80% 83% 80% 80% 81% 81% 81% 85% 83% Spec 2 19% 12% 18% 14% 15% 24% 18% 8% 21% Cutoff 3 22.7 17.3 24.4 21.3 19.6 24.2 22.7 16.7 23.8 Sens 3 90% 94% 90% 91% 90% 90% 92% 92% 91% Spec 3 10% 5% 11% 8% 8% 10% 10% 5% 9% Cutoff 4 45.1 42.8 45.4 45.1 42.8 45.4 45.1 42.8 45.4 Sens 4 24% 33% 26% 21% 33% 25% 23% 31% 26% Spec 4 70% 70% 71% 70% 70% 71% 70% 70% 71% Cutoff 5 50.0 48.2 50.9 50.0 48.2 50.9 50.0 48.2 50.9 Sens 5 20% 22% 22% 16% 19% 19% 15% 31% 17% Spec 5 80% 80% 80% 80% 80% 80% 80% 80% 80% Cutoff 6 62.6 58.1 63.4 62.6 58.1 63.4 62.6 58.1 63.4 Sens 6 12% 17% 10% 7% 19% 8% 4% 15% 9% Spec 6 90% 90% 90% 90% 90% 90% 90% 90% 90% OR Quart 2 1.5 0.59 1.5 1.7 0.79 0.89 1.6 0.49 0.15 p Value 0.37 0.48 0.38 0.21 0.73 0.81 0.42 0.42 0.087 95% CI of 0.63 0.14 0.62 0.75 0.21 0.35 0.53 0.088 0.018 OR Quart 2 3.4 2.5 3.5 3.8 3.0 2.3 4.7 2.7 1.3 OR Quart 3 1.2 0.79 0.89 1.0 0.59 2.0 0.65 0.49 1.8 p Value 0.63 0.73 0.81 1.0 0.48 0.10 0.51 0.42 0.29 95% CI of 0.52 0.21 0.35 0.42 0.14 0.87 0.17 0.088 0.61 OR Quart 3 3.0 3.0 2.3 2.4 2.5 4.6 2.4 2.7 5.3 OR Quart 4 1.1 1.2 1.4 1.2 1.9 1.1 1.2 1.3 1.0 p Value 0.80 0.76 0.48 0.64 0.27 0.85 0.77 0.72 1.0 95% CI of 0.46 0.36 0.57 0.53 0.61 0.44 0.38 0.33 0.30 OR Quart 4 2.7 4.1 3.3 2.8 5.8 2.7 3.7 4.9 3.3
TABLE-US-00085 Thrombopoietin 0 hr prior to AKI stage 24 hr prior to AKI stage 48 hr prior to AKI stage Cohort 1 Cohort 2 Cohort 1 Cohort 2 Cohort 1 Cohort 2 sCr or UO Median 1.94 2.16 1.94 1.98 1.94 2.78 Average 2.17 2.21 2.17 2.26 2.17 2.78 Stdev 1.12 1.09 1.12 1.58 1.12 1.18 p (t-test) 0.81 0.59 0.0080 Min 0.0323 0.492 0.0323 0.0323 0.0323 1.11 Max 5.87 5.08 5.87 6.89 5.87 5.24 n (Samp) 262 51 262 56 262 26 n (Patient) 110 51 110 56 110 26 sCr only Median 1.94 2.53 1.94 1.87 1.94 2.37 Average 2.16 2.35 2.16 2.37 2.16 2.50 Stdev 1.14 1.13 1.14 1.58 1.14 1.28 p (t-test) 0.49 0.41 0.28 Min 0.0323 0.492 0.0323 0.563 0.0323 0.941 Max 6.89 4.43 6.89 5.71 6.89 5.24 n (Samp) 466 18 466 21 466 13 n (Patient) 180 18 180 21 180 13 UO only Median 1.87 1.86 1.87 1.98 1.87 2.45 Average 2.12 2.05 2.12 2.23 2.12 2.62 Stdev 1.14 1.08 1.14 1.56 1.14 1.13 p (t-test) 0.67 0.57 0.050 Min 0.0323 0.396 0.0323 0.0323 0.0323 1.11 Max 5.87 5.08 5.87 6.89 5.87 4.91 n (Samp) 221 50 221 52 221 23 n (Patient) 91 50 91 52 91 23 0 hr prior to AKI stage 24 hr prior to AKI stage 48 hr prior to AKI stage sCr or UO sCr only UO only sCr or UO sCr only UO only sCr or UO sCr only UO only AUC 0.52 0.56 0.48 0.50 0.51 0.50 0.65 0.58 0.63 SE 0.045 0.071 0.046 0.043 0.065 0.045 0.061 0.084 0.065 p 0.71 0.40 0.69 0.93 0.92 0.95 0.011 0.36 0.046 nCohort 1 262 466 221 262 466 221 262 466 221 nCohort 2 51 18 50 56 21 52 26 13 23 Cutoff 1 1.46 1.66 1.35 1.17 1.18 1.40 1.77 1.65 1.76 Sens 1 73% 72% 70% 73% 71% 71% 73% 77% 74% Spec 1 27% 39% 27% 17% 20% 29% 44% 38% 47% Cutoff 2 1.17 1.29 1.08 0.970 0.885 0.848 1.65 1.11 1.54 Sens 2 80% 83% 82% 80% 81% 81% 85% 85% 83% Spec 2 17% 23% 16% 10% 12% 10% 38% 16% 37% Cutoff 3 0.790 0.532 0.790 0.338 0.822 0.338 1.16 0.974 1.16 Sens 3 90% 94% 90% 91% 90% 90% 92% 92% 91% Spec 3 7% 3% 7% 2% 11% 2% 17% 13% 20% Cutoff 4 2.56 2.66 2.64 2.56 2.66 2.64 2.56 2.66 2.64 Sens 4 35% 44% 26% 41% 33% 42% 54% 38% 48% Spec 4 71% 71% 70% 71% 71% 70% 71% 71% 70% Cutoff 5 3.10 3.15 3.10 3.10 3.15 3.10 3.10 3.15 3.10 Sens 5 24% 22% 18% 27% 29% 25% 38% 31% 35% Spec 5 81% 82% 81% 81% 82% 81% 81% 82% 81% Cutoff 6 3.73 3.70 3.66 3.73 3.70 3.66 3.73 3.70 3.66 Sens 6 12% 11% 10% 12% 24% 15% 23% 15% 22% Spec 6 90% 90% 90% 90% 90% 90% 90% 90% 90% OR Quart 2 1.0 1.0 1.1 0.60 0.55 0.61 2.1 0.66 2.1 p Value 1.0 1.0 0.82 0.23 0.35 0.27 0.31 0.65 0.31 95% CI of 0.42 0.24 0.46 0.26 0.16 0.25 0.50 0.11 0.50 OR Quart 2 2.4 4.1 2.6 1.4 1.9 1.5 8.7 4.0 8.9 OR Quart 3 0.90 0.49 0.80 0.59 0.41 0.76 1.4 0.99 1.7 p Value 0.82 0.42 0.64 0.21 0.21 0.52 0.70 0.99 0.47 95% CI of 0.37 0.088 0.32 0.26 0.10 0.32 0.29 0.20 0.39 OR Quart 3 2.2 2.7 2.0 1.4 1.6 1.8 6.3 5.0 7.6 OR Quart 4 1.4 2.1 1.3 1.0 0.99 0.98 5.1 1.7 3.3 p Value 0.43 0.25 0.49 0.97 0.99 0.96 0.015 0.48 0.082 95% CI of 0.61 0.61 0.58 0.48 0.34 0.44 1.4 0.39 0.86 OR Quart 4 3.2 7.1 3.1 2.2 2.9 2.2 19 7.2 13
[0162] FIG. 6: Comparison of marker levels in EDTA samples collected from Cohort 1 (patients that did not progress beyond RIFLE stage 0 or R) and in EDTA samples collected from subjects at 0, 24 hours, and 48 hours prior to reaching stage I or F in Cohort 2.
TABLE-US-00086 Alpha-2 macroglobulin 0 hr prior to AKI stage 24 hr prior to AKI stage 48 hr prior to AKI stage Cohort 1 Cohort 2 Cohort 1 Cohort 2 Cohort 1 Cohort 2 sCr or UO Median 566 582 566 586 566 567 Average 585 557 585 548 585 549 Stdev 177 128 177 148 177 122 p (t-test) 0.51 0.31 0.44 Min 22.9 283 22.9 211 22.9 195 Max 1640 806 1640 763 1640 731 n (Samp) 231 18 231 26 231 15 n (Patient) 159 18 159 26 159 15 UO only Median 571 559 571 562 571 565 Average 594 551 594 542 594 543 Stdev 176 127 176 145 176 124 p (t-test) 0.32 0.15 0.29 Min 242 283 242 211 242 195 Max 1640 806 1640 763 1640 731 n (Samp) 203 18 203 26 203 14 n (Patient) 135 18 135 26 135 14 0 hr prior to AKI stage 24 hr prior to AKI stage 48 hr prior to AKI stage sCr or UO sCr only UO only sCr or UO sCr only UO only sCr or UO sCr only UO only AUC 0.47 nd 0.45 0.47 nd 0.44 0.46 nd 0.44 SE 0.072 nd 0.073 0.061 nd 0.062 0.078 nd 0.082 p 0.68 nd 0.47 0.60 nd 0.35 0.65 nd 0.47 nCohort 1 231 nd 203 231 nd 203 231 nd 203 nCohort 2 18 nd 18 26 nd 26 15 nd 14 Cutoff 1 525 nd 525 459 nd 459 525 nd 525 Sens 1 72% nd 72% 73% nd 73% 73% nd 71% Spec 1 37% nd 37% 20% nd 18% 37% nd 37% Cutoff 2 454 nd 454 437 nd 437 486 nd 463 Sens 2 83% nd 83% 81% nd 81% 80% nd 86% Spec 2 19% nd 17% 17% nd 15% 25% nd 20% Cutoff 3 320 nd 320 305 nd 305 459 nd 459 Sens 3 94% nd 94% 92% nd 92% 93% nd 93% Spec 3 6% nd 4% 5% nd 3% 20% nd 18% Cutoff 4 661 nd 664 661 nd 664 661 nd 664 Sens 4 11% nd 11% 23% nd 15% 13% nd 7% Spec 4 70% nd 70% 70% nd 70% 70% nd 70% Cutoff 5 715 nd 726 715 nd 726 715 nd 726 Sens 5 6% nd 6% 12% nd 12% 7% nd 7% Spec 5 80% nd 80% 80% nd 80% 80% nd 80% Cutoff 6 777 nd 791 777 nd 791 777 nd 791 Sens 6 6% nd 6% 0% nd 0% 0% nd 0% Spec 6 90% nd 90% 90% nd 90% 90% nd 90% OR Quart 2 4.5 nd 3.9 2.8 nd 3.9 7.9 nd 6.8 p Value 0.063 nd 0.097 0.094 nd 0.048 0.057 nd 0.082 95% CI of 0.92 nd 0.78 0.84 nd 1.0 0.94 nd 0.78 OR Quart 2 22 nd 20 9.5 nd 15 66 nd 58 OR Quart 3 2.1 nd 2.7 1.0 nd 1.8 4.2 nd 3.2 p Value 0.40 nd 0.25 0.98 nd 0.45 0.20 nd 0.32 95% CI of 0.37 nd 0.50 0.24 nd 0.40 0.46 nd 0.32 OR Quart 3 12 nd 15 4.3 nd 7.7 39 nd 32 OR Quart 4 2.1 nd 2.1 2.2 nd 3.0 3.2 nd 4.3 p Value 0.40 nd 0.40 0.22 nd 0.12 0.33 nd 0.20 95% CI of 0.37 nd 0.37 0.62 nd 0.75 0.32 nd 0.47 OR Quart 4 12 nd 12 7.6 nd 12 31 nd 40
TABLE-US-00087 Apolipoprotein A-I 0 hr prior to AKI stage 24 hr prior to AKI stage 48 hr prior to AKI stage Cohort 1 Cohort 2 Cohort 1 Cohort 2 Cohort 1 Cohort 2 sCr or UO Median 648000 1340000 648000 509000 648000 758000 Average 1080000 2130000 1080000 1050000 1080000 1290000 Stdev 1100000 2200000 1100000 1710000 1100000 1110000 p (t-test) 4.8E-4 0.90 0.47 Min 133000 347000 133000 171000 133000 6920 Max 9190000 9190000 9190000 8110000 9190000 3320000 n (Samp) 231 18 231 26 231 15 n (Patient) 159 18 159 26 159 15 UO only Median 646000 1090000 646000 470000 646000 948000 Average 1060000 2060000 1060000 1070000 1060000 1270000 Stdev 1090000 2220000 1090000 1710000 1090000 1020000 p (t-test) 9.7E-4 0.97 0.49 Min 154000 347000 154000 171000 154000 6920 Max 9190000 9190000 9190000 8110000 9190000 3320000 n (Samp) 203 18 203 26 203 14 n (Patient) 135 18 135 26 135 14 0 hr prior to AKI stage 24 hr prior to AKI stage 48 hr prior to AKI stage sCr or UO sCr only UO only sCr or UO sCr only UO only sCr or UO sCr only UO only AUC 0.69 nd 0.68 0.41 nd 0.42 0.55 nd 0.57 SE 0.071 nd 0.072 0.061 nd 0.062 0.079 nd 0.082 p 0.0072 nd 0.013 0.13 nd 0.17 0.54 nd 0.38 nCohort 1 231 nd 203 231 nd 203 231 nd 203 nCohort 2 18 nd 18 26 nd 26 15 nd 14 Cutoff 1 881000 nd 861000 395000 nd 395000 402000 nd 659000 Sens 1 72% nd 72% 73% nd 73% 73% nd 71% Spec 1 64% nd 61% 19% nd 20% 21% nd 52% Cutoff 2 494000 nd 494000 363000 nd 367000 382000 nd 382000 Sens 2 83% nd 83% 81% nd 81% 80% nd 86% Spec 2 33% nd 34% 16% nd 16% 18% nd 19% Cutoff 3 414000 nd 414000 248000 nd 248000 162000 nd 162000 Sens 3 94% nd 94% 92% nd 92% 93% nd 93% Spec 3 23% nd 24% 6% nd 4% 1% nd 1% Cutoff 4 1070000 nd 1110000 1070000 nd 1110000 1070000 nd 1110000 Sens 4 56% nd 50% 15% nd 19% 47% nd 50% Spec 4 70% nd 70% 70% nd 70% 70% nd 70% Cutoff 5 1740000 nd 1540000 1740000 nd 1540000 1740000 nd 1540000 Sens 5 44% nd 39% 8% nd 8% 27% nd 43% Spec 5 80% nd 80% 80% nd 80% 80% nd 80% Cutoff 6 2560000 nd 2560000 2560000 nd 2560000 2560000 nd 2560000 Sens 6 22% nd 22% 8% nd 8% 13% nd 7% Spec 6 96% nd 97% 96% nd 97% 96% nd 97% OR Quart 2 1.0 nd 1.0 3.0 nd 2.2 0 nd 0 p Value 1.0 nd 1.0 0.12 nd 0.22 na nd na 95% CI of 0.14 nd 0.14 0.75 nd 0.62 na nd na OR Quart 2 7.3 nd 7.4 12 nd 7.8 na nd na OR Quart 3 3.2 nd 3.2 2.1 nd 1.3 0.79 nd 1.0 p Value 0.16 nd 0.16 0.30 nd 0.71 0.73 nd 1.0 95% CI of 0.62 nd 0.63 0.51 nd 0.33 0.20 nd 0.24 OR Quart 3 17 nd 17 8.9 nd 5.1 3.1 nd 4.2 OR Quart 4 4.4 nd 4.4 3.4 nd 2.5 1.2 nd 1.5 p Value 0.070 nd 0.068 0.078 nd 0.14 0.77 nd 0.53 95% CI of 0.89 nd 0.89 0.87 nd 0.73 0.35 nd 0.41 OR Quart 4 21 nd 22 13 nd 8.7 4.2 nd 5.8
TABLE-US-00088 Apolipoprotein B-100 0 hr prior to AKI stage 24 hr prior to AKI stage 48 hr prior to AKI stage Cohort 1 Cohort 2 Cohort 1 Cohort 2 Cohort 1 Cohort 2 sCr or UO Median 156000 188000 156000 150000 156000 198000 Average 152000 171000 152000 148000 152000 175000 Stdev 46900 50500 46900 47200 46900 66900 p (t-test) 0.10 0.67 0.076 Min 50900 78200 50900 51300 50900 2920 Max 274000 245000 274000 239000 274000 255000 n (Samp) 231 18 231 26 231 15 n (Patient) 159 18 159 26 159 15 UO only Median 159000 188000 159000 152000 159000 193000 Average 155000 173000 155000 152000 155000 179000 Stdev 47300 52000 47300 46700 47300 66300 p (t-test) 0.11 0.76 0.072 Min 50900 78200 50900 51300 50900 2920 Max 274000 245000 274000 239000 274000 255000 n (Samp) 203 18 203 26 203 14 n (Patient) 135 18 135 26 135 14 0 hr prior to AKI stage 24 hr prior to AKI stage 48 hr prior to AKI stage sCr or UO sCr only UO only sCr or UO sCr only UO only sCr or UO sCr only UO only AUC 0.63 nd 0.63 0.48 nd 0.49 0.67 nd 0.69 SE 0.073 nd 0.073 0.060 nd 0.061 0.078 nd 0.081 p 0.066 nd 0.073 0.74 nd 0.84 0.027 nd 0.021 nCohort 1 231 nd 203 231 nd 203 231 nd 203 nCohort 2 18 nd 18 26 nd 26 15 nd 14 Cutoff 1 152000 nd 152000 121000 nd 124000 175000 nd 186000 Sens 1 72% nd 72% 73% nd 73% 73% nd 71% Spec 1 48% nd 46% 30% nd 30% 63% nd 73% Cutoff 2 107000 nd 107000 100000 nd 118000 126000 nd 126000 Sens 2 83% nd 83% 81% nd 81% 80% nd 86% Spec 2 23% nd 22% 20% nd 28% 34% nd 32% Cutoff 3 96500 nd 96500 85900 nd 85900 88100 nd 88100 Sens 3 94% nd 94% 92% nd 92% 93% nd 93% Spec 3 17% nd 17% 7% nd 7% 9% nd 9% Cutoff 4 182000 nd 183000 182000 nd 183000 182000 nd 183000 Sens 4 61% nd 61% 31% nd 31% 67% nd 71% Spec 4 70% nd 70% 70% nd 70% 70% nd 70% Cutoff 5 193000 nd 197000 193000 nd 197000 193000 nd 197000 Sens 5 39% nd 44% 15% nd 15% 53% nd 50% Spec 5 80% nd 80% 80% nd 80% 80% nd 80% Cutoff 6 205000 nd 208000 205000 nd 208000 205000 nd 208000 Sens 6 33% nd 39% 12% nd 12% 33% nd 36% Spec 6 90% nd 90% 90% nd 90% 90% nd 90% OR Quart 2 0.48 nd 0.48 1.0 nd 1.2 0.32 nd 0.49 p Value 0.41 nd 0.41 0.98 nd 0.73 0.33 nd 0.57 95% CI of 0.085 nd 0.084 0.28 nd 0.36 0.032 nd 0.043 OR Quart 2 2.7 nd 2.7 3.7 nd 4.3 3.1 nd 5.6 OR Quart 3 0.74 nd 1.0 2.2 nd 2.3 1.0 nd 2.1 p Value 0.70 nd 1.0 0.17 nd 0.16 1.0 nd 0.41 95% CI of 0.16 nd 0.24 0.71 nd 0.72 0.19 nd 0.36 OR Quart 3 3.4 nd 4.2 6.9 nd 7.1 5.2 nd 12 OR Quart 4 2.4 nd 2.1 1.2 nd 1.0 2.9 nd 3.8 p Value 0.16 nd 0.24 0.73 nd 0.98 0.13 nd 0.11 95% CI of 0.70 nd 0.60 0.36 nd 0.28 0.72 nd 0.75 OR Quart 4 8.3 nd 7.5 4.3 nd 3.7 11 nd 19
TABLE-US-00089 Calcitonin 0 hr prior to AKI stage 24 hr prior to AKI stage 48 hr prior to AKI stage Cohort 1 Cohort 2 Cohort 1 Cohort 2 Cohort 1 Cohort 2 sCr or UO Median 31.2 57.3 31.2 41.3 31.2 31.8 Average 316 439 316 407 316 214 Stdev 833 859 833 682 833 396 p (t-test) 0.46 0.54 0.61 Min 0.0604 0.0604 0.0604 0.0604 0.0604 0.0604 Max 6590.0000 3470 6590 2390 6590 1310 n (Samp) 437 26 437 33 437 17 n (Patient) 174 26 174 33 174 17 sCr only Median 31.2 173 31.2 121 31.2 180 Average 297 541 297 812 297 445 Stdev 775 982 775 1230 775 862 p (t-test) 0.45 0.051 0.62 Min 0.0604 64.1 0.0604 8.23 0.0604 12.1 Max 6590 2540 6590 3470 6590 2390 n (Samp) 535 6 535 9 535 7 n (Patient) 207 6 207 9 207 7 UO only Median 35.0 48.4 35.0 42.6 35.0 33.3 Average 340 462 340 467 340 325 Stdev 877 831 877 785 877 595 p (t-test) 0.49 0.44 0.94 Min 0.0604 0.0604 0.0604 0.0604 0.0604 0.0604 Max 6590 3470 6590 2540 6590 2050 n (Samp) 363 26 363 31 363 17 n (Patient) 141 26 141 31 141 17 0 hr prior to AKI stage 24 hr prior to AKI stage 48 hr prior to AKI stage sCr or UO sCr only UO only sCr or UO sCr only UO only sCr or UO sCr only UO only AUC 0.59 0.76 0.57 0.55 0.67 0.54 0.52 0.68 0.52 SE 0.060 0.12 0.060 0.053 0.100 0.055 0.072 0.11 0.072 p 0.15 0.026 0.23 0.33 0.079 0.48 0.80 0.10 0.79 nCohort 1 437 535 363 437 535 363 437 535 363 nCohort 2 26 6 26 33 9 31 17 7 17 Cutoff 1 12.9 66.5 12.9 9.43 36.9 13.4 12.6 81.7 12.6 Sens 1 73% 83% 73% 73% 78% 71% 71% 71% 71% Spec 1 36% 62% 34% 27% 53% 34% 35% 66% 33% Cutoff 2 11.0 66.5 11.0 7.79 10.0 7.79 7.88 23.6 7.88 Sens 2 81% 83% 81% 85% 89% 84% 82% 86% 82% Spec 2 32% 62% 29% 23% 29% 20% 24% 46% 20% Cutoff 3 5.33 63.4 5.33 6.01 8.19 6.01 3.33 11.9 3.23 Sens 3 92% 100% 92% 91% 100% 90% 94% 100% 94% Spec 3 16% 61% 13% 17% 23% 14% 11% 32% 9% Cutoff 4 107 107 122 107 107 122 107 107 122 Sens 4 42% 67% 42% 39% 56% 39% 35% 57% 35% Spec 4 70% 70% 70% 70% 70% 70% 70% 70% 70% Cutoff 5 196 207 219 196 207 219 196 207 219 Sens 5 31% 50% 31% 36% 44% 35% 29% 43% 29% Spec 5 80% 80% 80% 80% 80% 80% 80% 80% 80% Cutoff 6 847 832 847 847 832 847 847 832 847 Sens 6 19% 17% 23% 15% 33% 16% 12% 14% 18% Spec 6 90% 90% 90% 90% 90% 90% 90% 90% 90% OR Quart 2 2.4 >0 1.8 0.86 1.0 0.53 0.99 >2.0 1.3 p Value 0.21 <na 0.36 0.78 1.0 0.27 0.99 <0.57 0.73 95% CI of 0.60 >na 0.51 0.30 0.062 0.17 0.24 >0.18 0.33 OR Quart 2 9.5 na 6.4 2.5 16 1.6 4.1 na 4.9 OR Quart 3 1.7 >3.1 1.3 0.74 3.0 0.64 1.0 >1.0 0.74 p Value 0.48 <0.33 0.73 0.58 0.34 0.42 1.0 <1.00 0.70 95% CI of 0.39 >0.32 0.33 0.25 0.31 0.22 0.24 >0.062 0.16 OR Quart 3 7.2 na 4.9 2.2 30 1.9 4.1 na 3.4 OR Quart 4 3.9 >3.0 2.6 1.5 4.1 1.2 1.2 >4.1 1.3 p Value 0.040 <0.34 0.11 0.36 0.21 0.65 0.74 <0.21 0.73 95% CI of 1.1 >0.31 0.80 0.61 0.45 0.49 0.33 >0.45 0.33 OR Quart 4 14 na 8.7 3.9 37 3.1 4.8 na 4.9
TABLE-US-00090 C-reactive protein 0 hr prior to AKI stage 24 hr prior to AKI stage 48 hr prior to AKI stage Cohort 1 Cohort 2 Cohort 1 Cohort 2 Cohort 1 Cohort 2 sCr or UO Median 50400 39800 50400 58900 50400 41500 Average 55300 61400 55300 69800 55300 47000 Stdev 52400 45300 52400 105000 52400 24500 p (t-test) 0.63 0.24 0.54 Min 1.00E-9 5570 1.00E-9 7200 1.00E-9 3380 Max 546000 159000 546000 573000 546000 96500 n (Samp) 231 18 231 26 231 15 n (Patient) 159 18 159 26 159 15 UO only Median 51000 46700 51000 70000 51000 34500 Average 57100 62600 57100 71700 57100 45500 Stdev 54600 44700 54600 104000 54600 25700 p (t-test) 0.68 0.26 0.43 Min 2360 5570 2360 7200 2360 3380 Max 546000 159000 546000 573000 546000 96500 n (Samp) 203 18 203 26 203 14 n (Patient) 135 18 135 26 135 14 0 hr prior to AKI stage 24 hr prior to AKI stage 48 hr prior to AKI stage sCr or UO sCr only UO only sCr or UO sCr only UO only sCr or UO sCr only UO only AUC 0.52 nd 0.52 0.53 nd 0.54 0.48 nd 0.44 SE 0.071 nd 0.072 0.061 nd 0.061 0.078 nd 0.082 p 0.80 nd 0.82 0.59 nd 0.49 0.78 nd 0.50 nCohort 1 231 nd 203 231 nd 203 231 nd 203 nCohort 2 18 nd 18 26 nd 26 15 nd 14 Cutoff 1 31900 nd 34300 33200 nd 36700 31000 nd 30400 Sens 1 72% nd 72% 73% nd 73% 73% nd 71% Spec 1 29% nd 28% 30% nd 34% 27% nd 24% Cutoff 2 30000 nd 31000 32800 nd 32800 30400 nd 26500 Sens 2 83% nd 83% 81% nd 81% 80% nd 86% Spec 2 26% nd 25% 29% nd 27% 26% nd 18% Cutoff 3 21000 nd 19500 21000 nd 20600 25800 nd 25800 Sens 3 94% nd 94% 92% nd 92% 93% nd 93% Spec 3 14% nd 12% 14% nd 12% 20% nd 18% Cutoff 4 70000 nd 70000 70000 nd 70000 70000 nd 70000 Sens 4 28% nd 28% 4% nd 4% 20% nd 21% Spec 4 92% nd 91% 92% nd 91% 92% nd 91% Cutoff 5 70000 nd 70000 70000 nd 70000 70000 nd 70000 Sens 5 28% nd 28% 4% nd 4% 20% nd 21% Spec 5 92% nd 91% 92% nd 91% 92% nd 91% Cutoff 6 70000 nd 70000 70000 nd 70000 70000 nd 70000 Sens 6 28% nd 28% 4% nd 4% 20% nd 21% Spec 6 92% nd 91% 92% nd 91% 92% nd 91% OR Quart 2 2.5 nd 1.3 1.7 nd 2.2 1.0 nd 0.67 p Value 0.20 nd 0.73 0.38 nd 0.23 0.98 nd 0.66 95% CI of 0.62 nd 0.32 0.52 nd 0.61 0.20 nd 0.11 OR Quart 2 10 nd 5.0 5.5 nd 7.6 5.2 nd 4.2 OR Quart 3 1.0 nd 1.0 1.0 nd 3.9 2.1 nd 1.4 p Value 1.0 nd 1.0 1.0 nd 0.025 0.31 nd 0.68 95% CI of 0.19 nd 0.24 0.27 nd 1.2 0.50 nd 0.30 OR Quart 3 5.2 nd 4.2 3.6 nd 13 8.8 nd 6.5 OR Quart 4 1.7 nd 1.2 1.7 nd 0.23 1.0 nd 1.8 p Value 0.48 nd 0.75 0.40 nd 0.20 0.98 nd 0.45 95% CI of 0.39 nd 0.32 0.51 nd 0.025 0.20 nd 0.40 OR Quart 4 7.4 nd 4.9 5.4 nd 2.1 5.2 nd 7.8
TABLE-US-00091 Tissue factor 0 hr prior to AKI stage 24 hr prior to AKI stage 48 hr prior to AKI stage Cohort 1 Cohort 2 Cohort 1 Cohort 2 Cohort 1 Cohort 2 sCr or UO Median 0.468 0.662 0.468 0.233 0.468 0.376 Average 0.612 0.836 0.612 0.459 0.612 0.327 Stdev 0.725 0.783 0.725 0.645 0.725 0.276 p (t-test) 0.13 0.24 0.11 Min 0.00841 000.00841 0.00841 0.00841 0.00841 0.00841 Max 7.23 3.31 7.23 2.44 7.23 0.740 n (Samp) 437 26 437 33 437 17 n (Patient) 174 26 174 33 174 17 sCr only Median 0.466 0.938 0.466 0.540 0.466 0.423 Average 0.590 1.16 0.590 0.944 0.590 0.637 Stdev 0.689 0.613 0.689 1.15 0.689 0.807 p (t-test) 0.046 0.13 0.86 Min 0.00841 0.596 0.00841 0.00841 0.00841 0.00841 Max 7.23 2.03 7.23 3.31 7.23 2.43 n (Samp) 535 6 535 9 535 7 n (Patient) 207 6 207 9 207 7 UO only Median 0.466 0.540 0.466 0.299 0.466 0.376 Average 0.606 0.780 0.606 0.448 0.606 0.435 Stdev 0.735 0.765 0.735 0.558 0.735 0.435 p (t-test) 0.25 0.25 0.34 Min 0.00841 0.00841 0.00841 0.00841 0.00841 0.00841 Max 7.23 3.31 7.23 2.43 7.23 1.75 n (Samp) 363 26 363 31 363 17 n (Patient) 141 26 141 31 141 17 0 hr prior to AKI stage 24 hr prior to AKI stage 48 hr prior to AKI stage sCr or UO sCr only UO only sCr or UO sCr only UO only sCr or UO sCr only UO only AUC 0.60 0.79 0.58 0.41 0.56 0.43 0.39 0.49 0.45 SE 0.060 0.11 0.060 0.054 0.100 0.055 0.074 0.11 0.073 p 0.086 0.0085 0.16 0.10 0.54 0.22 0.15 0.92 0.48 nCohort 1 437 535 363 437 535 363 437 535 363 nCohort 2 26 6 26 33 9 31 17 7 17 Cutoff 1 0.406 0.677 0.406 0 0.336 0 0 0.406 0.238 Sens 1 73% 83% 73% 100% 78% 100% 100% 71% 71% Spec 1 45% 67% 46% 0% 40% 0% 0% 46% 32% Cutoff 2 0.345 0.677 0.345 0 0 0 0 0.238 0 Sens 2 81% 83% 81% 100% 100% 100% 100% 86% 100% Spec 2 41% 67% 40% 0% 0% 0% 0% 33% 0% Cutoff 3 0 0.595 0 0 0 0 0 0 0 Sens 3 100% 100% 100% 100% 100% 100% 100% 100% 100% Spec 3 0% 61% 0% 0% 0% 0% 0% 0% 0% Cutoff 4 0.740 0.727 0.702 0.740 0.727 0.702 0.740 0.727 0.702 Sens 4 42% 50% 38% 21% 33% 23% 0% 14% 18% Spec 4 70% 70% 71% 70% 70% 71% 70% 70% 71% Cutoff 5 1.03 0.970 1.01 1.03 0.970 1.01 1.03 0.970 1.01 Sens 5 27% 50% 23% 12% 22% 10% 0% 14% 6% Spec 5 81% 80% 80% 81% 80% 80% 81% 80% 80% Cutoff 6 1.40 1.35 1.35 1.40 1.35 1.35 1.40 1.35 1.35 Sens 6 15% 33% 15% 9% 22% 6% 0% 14% 6% Spec 6 90% 90% 90% 90% 90% 90% 90% 90% 90% OR Quart 2 1.8 >0 1.8 1.2 1.0 1.4 >6.4 1.0 6.3 p Value 0.37 <na 0.36 0.75 1.0 0.54 <0.088 1.00 0.090 95% CI of 0.51 >na 0.51 0.36 0.14 0.44 >0.76 0.062 0.75 OR Quart 2 6.3 na 6.4 4.1 7.2 4.7 na 16 54 OR Quart 3 1.8 >3.1 2.1 4.1 1.0 1.9 >9.8 4.1 6.3 p Value 0.37 <0.33 0.24 0.0074 1.0 0.27 <0.032 0.21 0.090 95% CI of 0.51 >0.32 0.61 1.5 0.14 0.61 >1.2 0.45 0.75 OR Quart 3 6.3 na 7.2 11 7.2 5.8 na 37 54 OR Quart 4 2.1 >3.0 1.8 0.80 1.5 2.1 >2.1 1.0 4.1 p Value 0.25 <0.34 0.37 0.74 0.65 0.18 <0.56 1.00 0.21 95% CI of 0.60 >0.31 0.51 0.21 0.25 0.70 >0.18 0.062 0.45 OR Quart 4 7.0 na 6.3 3.1 9.2 6.5 na 16 38
TABLE-US-00092 Fibrinogen 0 hr prior to AKI stage 24 hr prior to AKI stage 48 hr prior to AKI stage Cohort 1 Cohort 2 Cohort 1 Cohort 2 Cohort 1 Cohort 2 sCr or UO Median 1470 1780 1470 1450 1470 1380 Average 1780 2050 1780 1510 1780 1540 Stdev 2080 1230 2080 697 2080 754 p (t-test) 0.58 0.51 0.66 Min 16.3 797 16.3 256 16.3 418 Max 22500 6200 22500 3370 22500 2560 n (Samp) 231 18 231 26 231 15 n (Patient) 159 18 159 26 159 15 UO only Median 1490 1810 1490 1410 1490 1290 Average 1800 2060 1800 1450 1800 1460 Stdev 2180 1230 2180 685 2180 727 p (t-test) 0.61 0.43 0.57 Min 391 797 391 256 391 418 Max 22500 6200 22500 3370 22500 2560 n (Samp) 203 18 203 26 203 14 n (Patient) 135 18 135 26 135 14 0 hr prior to AKI stage 24 hr prior to AKI stage 48 hr prior to AKI stage sCr or UO sCr only UO only sCr or UO sCr only UO only sCr or UO sCr only UO only AUC 0.62 nd 0.63 0.46 nd 0.42 0.48 nd 0.44 SE 0.073 nd 0.073 0.061 nd 0.062 0.078 nd 0.082 p 0.088 nd 0.080 0.53 nd 0.21 0.81 nd 0.45 nCohort 1 231 nd 203 231 nd 203 231 nd 203 nCohort 2 18 nd 18 26 nd 26 15 nd 14 Cutoff 1 1470 nd 1470 1120 nd 1120 1010 nd 1010 Sens 1 72% nd 72% 73% nd 73% 73% nd 71% Spec 1 51% nd 50% 26% nd 24% 19% nd 17% Cutoff 2 1280 nd 1290 1020 nd 1020 990 nd 667 Sens 2 83% nd 83% 81% nd 81% 80% nd 86% Spec 2 40% nd 40% 19% nd 17% 18% nd 3% Cutoff 3 879 nd 879 790 nd 784 661 nd 661 Sens 3 94% nd 94% 92% nd 92% 93% nd 93% Spec 3 10% nd 7% 6% nd 5% 3% nd 2% Cutoff 4 1820 nd 1820 1820 nd 1820 1820 nd 1820 Sens 4 39% nd 44% 23% nd 15% 40% nd 29% Spec 4 70% nd 70% 70% nd 70% 70% nd 70% Cutoff 5 2070 nd 2050 2070 nd 2050 2070 nd 2050 Sens 5 33% nd 33% 12% nd 12% 33% nd 29% Spec 5 80% nd 80% 80% nd 80% 80% nd 80% Cutoff 6 2460 nd 2450 2460 nd 2450 2460 nd 2450 Sens 6 22% nd 22% 8% nd 8% 20% nd 14% Spec 6 90% nd 90% 90% nd 90% 90% nd 90% OR Quart 2 2.1 nd 1.0 1.7 nd 3.0 0.39 nd 0.49 p Value 0.41 nd 1.0 0.37 nd 0.12 0.27 nd 0.42 95% CI of 0.36 nd 0.19 0.53 nd 0.75 0.072 nd 0.086 OR Quart 2 12 nd 5.2 5.6 nd 12 2.1 nd 2.8 OR Quart 3 2.6 nd 1.4 1.2 nd 2.6 0.38 nd 0.49 p Value 0.26 nd 0.70 0.73 nd 0.19 0.26 nd 0.42 95% CI of 0.49 nd 0.29 0.36 nd 0.63 0.071 nd 0.086 OR Quart 3 14 nd 6.4 4.3 nd 10 2.0 nd 2.8 OR Quart 4 3.8 nd 2.9 1.5 nd 3.0 1.2 nd 1.6 p Value 0.11 nd 0.13 0.53 nd 0.12 0.73 nd 0.49 95% CI of 0.75 nd 0.72 0.44 nd 0.75 0.36 nd 0.42 OR Quart 4 19 nd 12 4.9 nd 12 4.3 nd 6.0
TABLE-US-00093 Interleukin-5 0 hr prior to AKI stage 24 hr prior to AKI stage 48 hr prior to AKI stage Cohort 1 Cohort 2 Cohort 1 Cohort 2 Cohort 1 Cohort 2 sCr or UO Median 0.832 1.01 0.832 0.785 0.832 0.775 Average 3.85 3.62 3.85 3.49 3.85 1.98 Stdev 13.0 8.92 13.0 9.04 13.0 4.75 p (t-test) 0.94 0.89 0.58 Min 1.00E-9 1.00E-9 1.00E-9 1.00E-9 1.00E-9 0.0602 Max 120 38.8 120 43.4 120 19.0 n (Samp) 231 18 231 26 231 15 n (Patient) 159 18 159 26 159 15 UO only Median 0.867 1.11 0.867 0.809 0.867 0.782 Average 4.50 3.74 4.50 3.52 4.50 2.08 Stdev 14.7 8.89 14.7 9.03 14.7 4.91 p (t-test) 0.83 0.74 0.54 Min 1.00E-9 0.207 1.00E-9 1.00E-9 1.00E-9 0.0602 Max 120 38.8 120 43.4 120 19.0 n (Samp) 203 18 203 26 203 14 n (Patient) 135 18 135 26 135 14 0 hr prior to AKI stage 24 hr prior to AKI stage 48 hr prior to AKI stage sCr or UO sCr only UO only sCr or UO sCr only UO only sCr or UO sCr only UO only AUC 0.54 nd 0.56 0.44 nd 0.45 0.45 nd 0.44 SE 0.072 nd 0.073 0.061 nd 0.061 0.079 nd 0.082 p 0.58 nd 0.44 0.35 nd 0.40 0.49 nd 0.46 nCohort 1 231 nd 203 231 nd 203 231 nd 203 nCohort 2 18 nd 18 26 nd 26 15 nd 14 Cutoff 1 0.533 nd 0.533 0.310 nd 0.331 0.503 nd 0.503 Sens 1 72% nd 72% 73% nd 73% 73% nd 71% Spec 1 36% nd 35% 23% nd 22% 34% nd 33% Cutoff 2 0.331 nd 0.398 0.119 nd 0.119 0.398 nd 0.360 Sens 2 83% nd 83% 81% nd 81% 80% nd 86% Spec 2 23% nd 26% 12% nd 10% 27% nd 24% Cutoff 3 0.206 nd 0.276 0 nd 0 0.0866 nd 0.0866 Sens 3 94% nd 94% 100% nd 100% 93% nd 93% Spec 3 16% nd 20% 0% nd 0% 9% nd 8% Cutoff 4 1.76 nd 1.89 1.76 nd 1.89 1.76 nd 1.89 Sens 4 33% nd 39% 23% nd 23% 13% nd 14% Spec 4 70% nd 70% 70% nd 70% 70% nd 70% Cutoff 5 2.61 nd 2.80 2.61 nd 2.80 2.61 nd 2.80 Sens 5 28% nd 28% 19% nd 19% 7% nd 7% Spec 5 80% nd 80% 80% nd 80% 80% nd 80% Cutoff 6 5.09 nd 6.30 5.09 nd 6.30 5.09 nd 6.30 Sens 6 11% nd 6% 12% nd 8% 7% nd 7% Spec 6 90% nd 90% 90% nd 90% 90% nd 90% OR Quart 2 1.0 nd 1.7 1.5 nd 1.5 2.1 nd 2.1 p Value 1.0 nd 0.47 0.53 nd 0.52 0.40 nd 0.40 95% CI of 0.24 nd 0.39 0.44 nd 0.44 0.37 nd 0.37 OR Quart 2 4.2 nd 7.6 4.9 nd 5.0 12 nd 12 OR Quart 3 1.0 nd 1.4 1.0 nd 1.0 3.8 nd 2.7 p Value 1.0 nd 0.70 0.98 nd 0.98 0.10 nd 0.25 95% CI of 0.24 nd 0.29 0.28 nd 0.28 0.76 nd 0.50 OR Quart 3 4.2 nd 6.4 3.7 nd 3.7 19 nd 15 OR Quart 4 1.5 nd 2.1 2.0 nd 2.0 1.0 nd 1.6 p Value 0.53 nd 0.32 0.25 nd 0.25 0.99 nd 0.63 95% CI of 0.41 nd 0.49 0.62 nd 0.62 0.14 nd 0.25 OR Quart 4 5.7 nd 8.8 6.2 nd 6.3 7.5 nd 9.7
TABLE-US-00094 Interleukin-6 receptor subunit beta 0 hr prior to AKI stage 24 hr prior to AKI stage 48 hr prior to AKI stage Cohort 1 Cohort 2 Cohort 1 Cohort 2 Cohort 1 Cohort 2 sCr or UO Median 135000 147000 135000 133000 135000 121000 Average 134000 146000 134000 135000 134000 121000 Stdev 38200 38100 38200 49200 38200 41000 p (t-test) 0.39 0.85 0.25 Min 11900 90400 11900 51400 11900 38400 Max 231000 204000 231000 275000 231000 187000 n (Samp) 131 7 131 21 131 13 n (Patient) 103 7 103 21 103 13 UO only Median nd nd 139000 139000 139000 145000 Average nd nd 136000 139000 136000 132000 Stdev nd nd 39400 50400 39400 42300 p (t-test) nd nd 0.79 0.71 Min nd nd 11900 51400 11900 38400 Max nd nd 231000 275000 231000 187000 n (Samp) nd nd 113 21 113 11 n (Patient) nd nd 88 21 88 11 0 hr prior to AKI stage 24 hr prior to AKI stage 48 hr prior to AKI stage sCr or UO sCr only UO only sCr or UO sCr only UO only sCr or UO sCr only UO only AUC 0.60 nd nd 0.48 nd 0.49 0.44 nd 0.48 SE 0.12 nd nd 0.069 nd 0.069 0.086 nd 0.092 p 0.41 nd nd 0.81 nd 0.84 0.46 nd 0.86 nCohort 1 131 nd nd 131 nd 113 131 nd 113 nCohort 2 7 nd nd 21 nd 21 13 nd 11 Cutoff 1 132000 nd nd 114000 nd 114000 114000 nd 116000 Sens 1 71% nd nd 71% nd 71% 77% nd 73% Spec 1 47% nd nd 32% nd 30% 32% nd 35% Cutoff 2 116000 nd nd 96800 nd 92600 91600 nd 114000 Sens 2 86% nd nd 81% nd 81% 85% nd 82% Spec 2 37% nd nd 12% nd 11% 11% nd 30% Cutoff 3 88100 nd nd 82600 nd 82300 47000 nd 91600 Sens 3 100% nd nd 90% nd 90% 92% nd 91% Spec 3 11% nd nd 8% nd 7% 4% nd 11% Cutoff 4 154000 nd nd 154000 nd 161000 154000 nd 161000 Sens 4 43% nd nd 29% nd 29% 8% nd 18% Spec 4 70% nd nd 70% nd 71% 70% nd 71% Cutoff 5 166000 nd nd 166000 nd 167000 166000 nd 167000 Sens 5 29% nd nd 24% nd 24% 8% nd 18% Spec 5 80% nd nd 80% nd 81% 80% nd 81% Cutoff 6 179000 nd nd 179000 nd 182000 179000 nd 182000 Sens 6 14% nd nd 19% nd 14% 8% nd 18% Spec 6 90% nd nd 90% nd 90% 90% nd 90% OR Quart 2 2.0 nd nd 1.0 nd 0.64 5.6 nd 2.1 p Value 0.58 nd nd 1.0 nd 0.53 0.12 nd 0.40 95% CI of 0.17 nd nd 0.26 nd 0.16 0.62 nd 0.36 OR Quart 2 23 nd nd 3.8 nd 2.5 51 nd 13 OR Quart 3 2.1 nd nd 1.0 nd 0.80 4.4 nd 1.6 p Value 0.56 nd nd 1.0 nd 0.74 0.20 nd 0.64 95% CI of 0.18 nd nd 0.26 nd 0.22 0.46 nd 0.24 OR Quart 3 24 nd nd 3.8 nd 2.9 41 nd 10 OR Quart 4 2.0 nd nd 1.2 nd 1.0 3.2 nd 1.0 p Value 0.58 nd nd 0.74 nd 0.95 0.33 nd 1.0 95% CI of 0.17 nd nd 0.34 nd 0.30 0.31 nd 0.13 OR Quart 4 23 nd nd 4.5 nd 3.6 32 nd 7.6
TABLE-US-00095 Macrophage metalloelastase 0 hr prior to AKI stage 24 hr prior to AKI stage 48 hr prior to AKI stage Cohort 1 Cohort 2 Cohort 1 Cohort 2 Cohort 1 Cohort 2 sCr or UO Median nd nd 36.8 21.1 nd nd Average nd nd 23.9 20.9 nd nd Stdev nd nd 20.5 20.9 nd nd p (t-test) nd nd 0.65 nd nd Min nd nd 1.00E-9 1.00E-9 nd nd Max nd nd 61.3 61.3 nd nd n (Samp) nd nd 46 12 nd nd n (Patient) nd nd 43 12 nd nd UO only Median nd nd 36.8 21.1 nd nd Average nd nd 24.4 20.9 nd nd Stdev nd nd 20.4 20.1 nd nd p (t-test) nd nd 0.59 nd nd Min nd nd 1.00E-9 1.00E-9 nd nd Max nd nd 61.3 61.3 nd nd n (Samp) nd nd 40 13 nd nd n (Patient) nd nd 37 13 nd nd 0 hr prior to AKI stage 24 hr prior to AKI stage 48 hr prior to AKI stage sCr or UO sCr only UO only sCr or UO sCr only UO only sCr or UO sCr only UO only AUC nd nd nd 0.45 nd 0.44 nd nd nd SE nd nd nd 0.096 nd 0.094 nd nd nd p nd nd nd 0.60 nd 0.52 nd nd nd nCohort 1 nd nd nd 46 nd 40 nd nd nd nCohort 2 nd nd nd 12 nd 13 nd nd nd Cutoff 1 nd nd nd 0 nd 0 nd nd nd Sens 1 nd nd nd 100% nd 100% nd nd nd Spec 1 nd nd nd 0% nd 0% nd nd nd Cutoff 2 nd nd nd 0 nd 0 nd nd nd Sens 2 nd nd nd 100% nd 100% nd nd nd Spec 2 nd nd nd 0% nd 0% nd nd nd Cutoff 3 nd nd nd 0 nd 0 nd nd nd Sens 3 nd nd nd 100% nd 100% nd nd nd Spec 3 nd nd nd 0% nd 0% nd nd nd Cutoff 4 nd nd nd 36.8 nd 36.8 nd nd nd Sens 4 nd nd nd 8% nd 8% nd nd nd Spec 4 nd nd nd 91% nd 92% nd nd nd Cutoff 5 nd nd nd 36.8 nd 36.8 nd nd nd Sens 5 nd nd nd 8% nd 8% nd nd nd Spec 5 nd nd nd 91% nd 92% nd nd nd Cutoff 6 nd nd nd 36.8 nd 36.8 nd nd nd Sens 6 nd nd nd 8% nd 8% nd nd nd Spec 6 nd nd nd 91% nd 92% nd nd nd OR Quart 2 nd nd nd 5.6 nd 2.4 nd nd nd p Value nd nd nd 0.15 nd 0.51 nd nd nd 95% CI of nd nd nd 0.54 nd 0.19 nd nd nd OR Quart 2 nd nd nd 58 nd 30 nd nd nd OR Quart 3 nd nd nd 5.1 nd 15 nd nd nd p Value nd nd nd 0.17 nd 0.021 nd nd nd 95% CI of nd nd nd 0.50 nd 1.5 nd nd nd OR Quart 3 nd nd nd 52 nd 150 nd nd nd OR Quart 4 nd nd nd 3.8 nd 3.9 nd nd nd p Value nd nd nd 0.27 nd 0.27 nd nd nd 95% CI of nd nd nd 0.35 nd 0.35 nd nd nd OR Quart 4 nd nd nd 42 nd 43 nd nd nd
TABLE-US-00096 Sex hormone-binding globulin 0 hr prior to AKI stage 24 hr prior to AKI stage 48 hr prior to AKI stage Cohort 1 Cohort 2 Cohort 1 Cohort 2 Cohort 1 Cohort 2 sCr or UO Median 35.0 35.5 35.0 37.9 35.0 35.9 Average 39.4 39.2 39.4 39.2 39.4 38.6 Stdev 18.4 19.7 18.4 14.7 18.4 15.5 p (t-test) 0.95 0.95 0.86 Min 7.91 13.0 7.91 15.7 7.91 13.0 Max 142 82.6 142 79.0 142 74.9 n (Samp) 437 26 437 33 437 17 n (Patient) 174 26 174 33 174 17 sCr only Median 34.8 36.2 34.8 32.9 34.8 40.0 Average 38.5 35.6 38.5 37.6 38.5 41.9 Stdev 18.0 16.2 18.0 16.4 18.0 17.9 p (t-test) 0.69 0.88 0.62 Min 7.56 17.7 7.56 22.8 7.56 22.0 Max 142 62.8 142 75.5 142 74.9 n (Samp) 535 6 535 9 535 7 n (Patient) 207 6 207 9 207 7 UO only Median 35.2 35.8 35.2 37.5 35.2 35.2 Average 40.3 39.4 40.3 39.2 40.3 37.8 Stdev 19.1 19.5 19.1 14.9 19.1 15.5 p (t-test) 0.82 0.75 0.60 Min 9.10 13.0 9.10 15.7 9.10 13.0 Max 142 82.6 142 79.0 142 74.9 n (Samp) 363 26 363 31 363 17 n (Patient) 141 26 141 31 141 17 0 hr prior to AKI stage 24 hr prior to AKI stage 48 hr prior to AKI stage sCr or UO sCr only UO only sCr or UO sCr only UO only sCr or UO sCr only UO only AUC 0.48 0.46 0.48 0.53 0.48 0.51 0.52 0.57 0.49 SE 0.059 0.12 0.059 0.053 0.099 0.054 0.072 0.11 0.072 p 0.79 0.76 0.72 0.61 0.80 0.80 0.82 0.55 0.91 nCohort 1 437 535 363 437 535 363 437 535 363 nCohort 2 26 6 26 33 9 31 17 7 17 Cutoff 1 25.7 20.3 25.8 32.1 26.1 32.1 32.0 35.8 31.9 Sens 1 73% 83% 73% 73% 78% 71% 71% 71% 71% Spec 1 17% 8% 16% 41% 22% 40% 41% 53% 40% Cutoff 2 21.8 20.3 22.5 24.5 24.7 25.6 24.2 24.2 23.7 Sens 2 81% 83% 81% 82% 89% 81% 82% 86% 82% Spec 2 8% 8% 7% 14% 18% 16% 12% 16% 10% Cutoff 3 16.5 17.3 16.2 21.3 22.7 21.3 19.1 21.8 18.8 Sens 3 92% 100% 92% 91% 100% 90% 94% 100% 94% Spec 3 3% 5% 2% 7% 12% 5% 5% 10% 3% Cutoff 4 43.5 43.2 43.9 43.5 43.2 43.9 43.5 43.2 43.9 Sens 4 31% 17% 27% 30% 22% 29% 35% 43% 29% Spec 4 70% 70% 71% 70% 70% 71% 70% 70% 71% Cutoff 5 48.7 48.7 50.0 48.7 48.7 50.0 48.7 48.7 50.0 Sens 5 23% 17% 23% 24% 11% 26% 24% 29% 12% Spec 5 80% 80% 80% 80% 80% 80% 80% 80% 80% Cutoff 6 60.5 58.7 63.8 60.5 58.7 63.8 60.5 58.7 63.8 Sens 6 19% 17% 19% 9% 11% 6% 6% 14% 6% Spec 6 90% 90% 90% 90% 90% 90% 90% 90% 90% OR Quart 2 1.0 3.1 1.2 0.31 3.0 0.60 0.39 0 0.79 p Value 1.0 0.33 0.77 0.088 0.34 0.38 0.26 na 0.73 95% CI of 0.34 0.32 0.41 0.083 0.31 0.19 0.073 na 0.21 OR Quart 2 2.9 30 3.4 1.2 30 1.9 2.0 na 3.0 OR Quart 3 0.56 0 0.27 1.5 1.0 1.3 0.79 1.5 0.59 p Value 0.36 na 0.11 0.37 1.0 0.62 0.73 0.65 0.47 95% CI of 0.16 na 0.055 0.62 0.062 0.48 0.21 0.25 0.14 OR Quart 3 2.0 na 1.4 3.7 16 3.4 3.0 9.2 2.5 OR Quart 4 1.2 2.0 1.3 0.87 4.1 0.99 1.2 0.99 1.0 p Value 0.78 0.57 0.59 0.79 0.21 0.98 0.77 0.99 1.0 95% CI of 0.41 0.18 0.47 0.32 0.45 0.36 0.36 0.14 0.28 OR Quart 4 3.3 23 3.7 2.3 37 2.7 4.1 7.2 3.6
TABLE-US-00097 Thrombopoietin 0 hr prior to AKI stage 24 hr prior to AKI stage 48 hr prior to AKI stage Cohort 1 Cohort 2 Cohort 1 Cohort 2 Cohort 1 Cohort 2 sCr or UO Median 1.94 1.82 1.94 1.87 1.94 2.30 Average 2.20 1.97 2.20 1.86 2.20 2.37 Stdev 1.15 1.23 1.15 1.08 1.15 1.25 p (t-test) 0.33 0.11 0.54 Min 0.0323 0.396 0.0323 0.0323 0.0323 0.0323 Max 6.89 4.43 6.89 3.73 6.89 4.38 n (Samp) 437 26 437 33 437 17 n (Patient) 174 26 174 33 174 17 sCr only Median 1.94 2.18 1.94 1.67 1.94 2.10 Average 2.15 2.27 2.15 1.96 2.15 2.20 Stdev 1.15 1.27 1.15 0.860 1.15 1.01 p (t-test) 0.79 0.64 0.91 Min 0.0323 0.822 0.0323 0.836 0.0323 0.790 Max 6.89 4.43 6.89 3.19 6.89 3.38 n (Samp) 535 6 535 9 535 7 n (Patient) 207 6 207 9 207 7 UO only Median 1.94 1.28 1.94 1.87 1.94 2.57 Average 2.19 1.78 2.19 1.85 2.19 2.58 Stdev 1.19 1.12 1.19 1.16 1.19 1.26 p (t-test) 0.086 0.13 0.19 Min 0.0323 0.396 0.0323 0.0323 0.0323 0.0323 Max 6.89 4.00 6.89 3.97 6.89 4.43 n (Samp) 363 26 363 31 363 17 n (Patient) 141 26 141 31 141 17 0 hr prior to AKI stage 24 hr prior to AKI stage 48 hr prior to AKI stage sCr or UO sCr only UO only sCr or UO sCr only UO only sCr or UO sCr only UO only AUC 0.44 0.53 0.39 0.44 0.48 0.44 0.56 0.53 0.61 SE 0.060 0.12 0.060 0.053 0.098 0.055 0.073 0.11 0.074 p 0.28 0.81 0.061 0.29 0.82 0.24 0.42 0.76 0.13 nCohort 1 437 535 363 437 535 363 437 535 363 nCohort 2 26 6 26 33 9 31 17 7 17 Cutoff 1 0.885 1.29 0.885 1.17 1.52 1.08 1.65 1.88 1.77 Sens 1 77% 83% 77% 73% 78% 71% 71% 71% 71% Spec 1 9% 24% 10% 18% 33% 14% 38% 49% 45% Cutoff 2 0.709 1.29 0.709 0.822 0.822 0.822 1.46 1.08 1.54 Sens 2 85% 83% 85% 82% 100% 81% 82% 86% 82% Spec 2 6% 24% 6% 8% 11% 8% 28% 16% 36% Cutoff 3 0.532 0.790 0.532 0.338 0.822 0.338 0.778 0.778 0.752 Sens 3 96% 100% 96% 91% 100% 90% 94% 100% 94% Spec 3 3% 10% 4% 1% 11% 1% 7% 10% 7% Cutoff 4 2.64 2.66 2.69 2.64 2.66 2.69 2.64 2.66 2.69 Sens 4 35% 33% 27% 30% 22% 32% 41% 43% 47% Spec 4 70% 71% 70% 70% 71% 70% 70% 71% 70% Cutoff 5 3.15 3.10 3.15 3.15 3.10 3.15 3.15 3.10 3.15 Sens 5 19% 17% 15% 12% 11% 13% 29% 29% 29% Spec 5 82% 80% 82% 82% 80% 82% 82% 80% 82% Cutoff 6 3.80 3.73 3.83 3.80 3.73 3.83 3.80 3.73 3.83 Sens 6 8% 17% 4% 0% 0% 3% 18% 0% 18% Spec 6 90% 90% 90% 90% 90% 90% 90% 90% 90% OR Quart 2 0.70 0.50 0.83 1.0 1.0 1.0 1.3 0.49 2.0 p Value 0.56 0.57 0.77 0.99 1.0 0.98 0.71 0.57 0.42 95% CI of 0.22 0.044 0.25 0.34 0.14 0.34 0.29 0.044 0.37 OR Quart 2 2.3 5.5 2.8 3.0 7.2 3.0 6.1 5.5 11 OR Quart 3 0.41 1.0 0.32 1.2 1.5 0.85 1.0 0.50 2.0 p Value 0.21 1.0 0.17 0.79 0.65 0.77 1.0 0.57 0.42 95% CI of 0.10 0.14 0.064 0.40 0.25 0.27 0.20 0.044 0.37 OR Quart 3 1.6 7.2 1.6 3.3 9.2 2.6 5.1 5.5 11 OR Quart 4 1.6 0.49 2.4 1.6 1.0 1.7 2.4 1.5 3.7 p Value 0.32 0.57 0.094 0.32 1.0 0.32 0.21 0.66 0.11 95% CI of 0.62 0.044 0.86 0.61 0.14 0.62 0.60 0.25 0.75 OR Quart 4 4.4 5.5 6.5 4.4 7.2 4.5 9.5 9.1 18
[0163] FIG. 7: Comparison of marker levels in EDTA samples collected within 12 hours of reaching stage R from Cohort 1 (patients that reached, but did not progress beyond, RIFLE stage R) and from Cohort 2 (patients that reached RIFLE stage I or F).
TABLE-US-00098 Alpha-2 macroglobulin sCr or UO sCr only UO only Cohort Cohort Cohort Cohort Cohort Cohort 1 2 1 2 1 2 Median 555 576 nd nd 565 571 Average 595 567 nd nd 616 530 Stdev 235 163 nd nd 261 152 p (t-test) 0.63 nd nd 0.25 Min 242 211 nd nd 242 211 Max 1640 877 nd nd 1640 748 n (Samp) 51 19 nd nd 41 14 n (Patient) 51 19 nd nd 41 14 At Enrollment sCr or UO sCr only UO only AUC 0.52 nd 0.45 SE 0.079 nd 0.091 p 0.79 nd 0.57 nCohort 1 51 nd 41 nCohort 2 19 nd 14 Cutoff 1 529 nd 525 Sens 1 74% nd 71% Spec 1 43% nd 41% Cutoff 2 455 nd 372 Sens 2 84% nd 86% Spec 2 27% nd 20% Cutoff 3 242 nd 242 Sens 3 95% nd 93% Spec 3 2% nd 2% Cutoff 4 652 nd 727 Sens 4 26% nd 7% Spec 4 71% nd 71% Cutoff 5 734 nd 824 Sens 5 11% nd 0% Spec 5 80% nd 80% Cutoff 6 881 nd 917 Sens 6 0% nd 0% Spec 6 90% nd 90% OR Quart 2 1.8 nd 13 p Value 0.48 nd 0.028 95% CI of 0.36 nd 1.3 OR Quart 2 9.1 nd 130 OR Quart 3 3.3 nd 3.5 p Value 0.14 nd 0.30 95% CI of 0.67 nd 0.32 OR Quart 3 16 nd 39 OR Quart 4 1.3 nd 3.9 p Value 0.74 nd 0.27 95% CI of 0.25 nd 0.35 OR Quart 4 7.1 nd 43
TABLE-US-00099 C-reactive protein sCr only sCr or UO Co- Co- UO only Cohort 1 Cohort 2 hort 1 hort 2 Cohort 1 Cohort 2 Median 45300 53200 nd nd 50400 54600 Average 49800 49500 nd nd 52800 49600 Stdev 37600 22200 nd nd 40500 23200 p (t-test) 0.98 nd nd 0.78 Min 2360 10400 nd nd 2360 10400 Max 219000 77000 nd nd 219000 77000 n (Samp) 51 19 nd nd 41 14 n (Patient) 51 19 nd nd 41 14 At Enrollment sCr or UO sCr only UO only AUC 0.54 nd 0.53 SE 0.079 nd 0.091 p 0.59 nd 0.77 nCohort 1 51 nd 41 nCohort 2 19 nd 14 Cutoff 1 29900 nd 29900 Sens 1 74% nd 71% Spec 1 31% nd 32% Cutoff 2 24900 nd 24900 Sens 2 84% nd 86% Spec 2 25% nd 27% Cutoff 3 14700 nd 14700 Sens 3 95% nd 93% Spec 3 18% nd 17% Cutoff 4 70000 nd 70000 Sens 4 5% nd 7% Spec 4 90% nd 88% Cutoff 5 70000 nd 70000 Sens 5 5% nd 7% Spec 5 90% nd 88% Cutoff 6 70000 nd 72800 Sens 6 5% nd 7% Spec 6 90% nd 90% OR Quart 2 1.2 nd 3.1 p Value 0.77 nd 0.24 95% CI of 0.27 nd 0.47 OR Quart 2 5.7 nd 20 OR Quart 3 2.3 nd 4.1 p Value 0.28 nd 0.13 95% CI of 0.52 nd 0.65 OR Quart 3 10.0 nd 26 OR Quart 4 0.65 nd 0.42 p Value 0.61 nd 0.51 95% CI of 0.12 nd 0.034 OR Quart 4 3.5 nd 5.3
TABLE-US-00100 Tissue factor sCr or UO sCr only UO only Cohort 1 Cohort 2 Cohort 1 Cohort 2 Cohort 1 Cohort 2 Median 0.00841 0.00841 0.00841 0.443 0.00841 0.00841 Average 0.340 0.250 0.168 1.16 0.378 0.226 Stdev 0.525 0.356 0.241 1.11 0.561 0.284 p (t-test) 0.46 0.0013 0.30 Min 0.00841 0.00841 0.00841 0.340 0.00841 0.00841 Max 1.95 1.44 0.662 3.31 1.95 0.702 n (Samp) 55 22 18 7 46 16 n (Patient) 55 22 18 7 46 16 At Enrollment sCr or UO sCr only UO only AUC 0.50 0.86 0.47 SE 0.073 0.097 0.085 p 0.97 2.2E-4 0.76 nCohort 1 55 18 46 nCohort 2 22 7 16 Cutoff 1 0 0.389 0 Sens 1 100% 71% 100% Spec 1 0% 78% 0% Cutoff 2 0 0.380 0 Sens 2 100% 86% 100% Spec 2 0% 78% 0% Cutoff 3 0 0.00841 0 Sens 3 100% 100% 100% Spec 3 0% 67% 0% Cutoff 4 0.466 0.351 0.525 Sens 4 18% 86% 25% Spec 4 71% 72% 72% Cutoff 5 0.662 0.466 0.864 Sens 5 14% 43% 0% Spec 5 80% 83% 80% Cutoff 6 1.23 0.579 1.31 Sens 6 5% 43% 0% Spec 6 91% 94% 91% OR Quart 2 4.4 >0 2.6 p Value 0.039 <na 0.21 95% CI of 1.1 >na 0.57 OR Quart 2 18 na 12 OR Quart 3 1.4 >12 1.4 p Value 0.64 <0.073 0.69 95% CI of 0.32 >0.80 0.29 OR Quart 3 6.4 na 6.4 OR Quart 4 0.75 >4.5 0 p Value 0.73 <0.26 na 95% CI of 0.14 >0.34 na OR Quart 4 3.9 na na
TABLE-US-00101 Fibrinogen sCr or UO sCr only UO only Cohort Cohort Cohort Cohort Cohort Cohort 1 2 1 2 1 2 Median 1350 1380 nd nd 1360 1380 Average 1960 1480 nd nd 2080 1490 Stdev 3040 677 nd nd 3380 717 p (t-test) 0.50 nd nd 0.52 Min 391 438 nd nd 391 438 Max 22500 3290 nd nd 22500 3290 n (Samp) 51 19 nd nd 41 14 n (Patient) 51 19 nd nd 41 14 At Enrollment sCr or UO sCr only UO only AUC 0.49 nd 0.49 SE 0.078 nd 0.090 p 0.93 nd 0.94 nCohort 1 51 nd 41 nCohort 2 19 nd 14 Cutoff 1 1020 nd 1110 Sens 1 74% nd 71% Spec 1 27% nd 37% Cutoff 2 1010 nd 1010 Sens 2 84% nd 86% Spec 2 27% nd 32% Cutoff 3 709 nd 888 Sens 3 95% nd 93% Spec 3 12% nd 15% Cutoff 4 1800 nd 1750 Sens 4 21% nd 21% Spec 4 71% nd 71% Cutoff 5 2210 nd 2160 Sens 5 16% nd 14% Spec 5 80% nd 80% Cutoff 6 2460 nd 2910 Sens 6 11% nd 7% Spec 6 90% nd 90% OR Quart 2 4.4 nd 2.0 p Value 0.061 nd 0.41 95% CI of 0.93 nd 0.38 OR Quart 2 21 nd 11 OR Quart 3 1.9 nd 1.5 p Value 0.43 nd 0.66 95% CI of 0.38 nd 0.26 OR Quart 3 9.6 nd 8.2 OR Quart 4 1.1 nd 0.67 p Value 0.94 nd 0.69 95% CI of 0.18 nd 0.093 OR Quart 4 6.2 nd 4.8
TABLE-US-00102 Interleukin-5 sCr or UO sCr only UO only Cohort Cohort Co- Cohort Cohort Cohort 1 2 hort 1 2 1 2 Median 0.618 0.787 nd nd 0.617 0.539 Average 2.58 1.20 nd nd 2.28 0.902 Stdev 6.32 1.31 nd nd 6.41 1.48 p (t-test) 0.35 nd nd 0.43 Min 1.00E-9 0.0915 nd nd 1.00E-9 1.00E-9 Max 39.8 5.83 nd nd 39.8 5.83 n 51 19 nd nd 41 14 (Samp) n (Patient) 51 19 nd nd 41 14 At Enrollment sCr or UO sCr only UO only AUC 0.51 nd 0.41 SE 0.078 nd 0.091 P 0.87 nd 0.33 nCohort 1 51 nd 41 nCohort 2 19 nd 14 Cutoff 1 0.449 nd 0.119 Sens 1 74% nd 71% Spec 1 33% nd 15% Cutoff 2 0.126 nd 0.0915 Sens 2 84% nd 86% Spec 2 14% nd 12% Cutoff 3 0.0915 nd 0.0866 Sens 3 95% nd 93% Spec 3 10% nd 12% Cutoff 4 1.42 nd 1.17 Sens 4 26% nd 21% Spec 4 71% nd 71% Cutoff 5 2.12 nd 1.67 Sens 5 11% nd 7% Spec 5 80% nd 80% Cutoff 6 4.68 nd 2.80 Sens 6 5% nd 7% Spec 6 90% nd 90% OR Quart 2 0.30 nd 3.3 p Value 0.19 nd 0.20 95% CI of 0.049 nd 0.52 OR Quart 2 1.8 nd 21 OR Quart 3 2.1 nd 1.0 p Value 0.29 nd 1.0 95% CI of 0.52 nd 0.12 OR Quart 3 8.8 nd 8.3 OR Quart 4 0.69 nd 3.8 p Value 0.63 nd 0.17 95% CI of 0.15 nd 0.58 OR Quart 4 3.1 nd 24
TABLE-US-00103 Thrombopoietin sCr or UO sCr only UO only Cohort Cohort Cohort Cohort Cohort Cohort 1 2 1 2 1 2 Median 2.33 1.84 1.90 2.45 2.24 1.89 Average 2.33 1.79 1.96 2.16 2.34 1.80 Stdev 1.16 0.669 1.05 0.955 1.15 0.706 p (t-test) 0.046 0.67 0.085 Min 0.367 0.367 0.367 0.890 0.563 0.367 Max 5.08 2.91 3.98 3.38 5.08 2.91 n (Samp) 55 22 18 7 46 16 n (Patient) 55 22 18 7 46 16 At Enrollment sCr or UO sCr only UO only AUC 0.37 0.57 0.38 SE 0.073 0.13 0.085 p 0.081 0.61 0.16 nCohort 1 55 18 46 nCohort 2 22 7 16 Cutoff 1 1.43 1.55 1.29 Sens 1 73% 71% 75% Spec 1 25% 44% 20% Cutoff 2 1.17 0.890 1.17 Sens 2 82% 86% 81% Spec 2 18% 22% 15% Cutoff 3 0.885 0.885 0.822 Sens 3 91% 100% 94% Spec 3 13% 22% 9% Cutoff 4 2.97 2.66 2.91 Sens 4 0% 43% 0% Spec 4 71% 72% 72% Cutoff 5 3.19 2.97 3.37 Sens 5 0% 14% 0% Spec 5 80% 83% 80% Cutoff 6 3.89 3.18 3.89 Sens 6 0% 14% 0% Spec 6 91% 94% 91% OR Quart 2 11 0.40 7.5 p Value 0.033 0.51 0.085 95% CI of 1.2 0.026 0.76 OR Quart 2 100 6.2 74 OR Quart 3 14 1.0 6.8 p Value 0.020 1.0 0.099 95% CI of 1.5 0.091 0.69 OR Quart 3 130 11 67 OR Quart 4 8.8 0.80 7.5 p Value 0.057 0.85 0.085 95% CI of 0.94 0.076 0.76 OR Quart 4 82 8.5 74
[0164] FIG. 8: Comparison of the maximum marker levels in EDTA samples collected from Cohort 1 (patients that did not progress beyond RIFLE stage 0) and the maximum values in EDTA samples collected from subjects between enrollment and 0, 24 hours, and 48 hours prior to reaching stage F in Cohort 2.
TABLE-US-00104 Alpha-2 macroglobulin 0 hr prior to AKI stage 24 hr prior to AKI stage 48 hr prior to AKI stage Cohort 1 Cohort 2 Cohort 1 Cohort 2 Cohort 1 Cohort 2 sCr or UO Median 582 628 582 619 582 697 Average 572 632 572 632 572 677 Stdev 170 173 170 183 170 111 p (t-test) 0.28 0.30 0.14 Min 22.9 307 22.9 307 22.9 518 Max 987 999 987 999 987 806 n (Samp) 97 11 97 10 97 6 n (Patient) 97 11 97 10 97 6 UO only Median 579 655 579 655 579 697 Average 586 656 586 656 586 677 Stdev 153 198 153 198 153 111 p (t-test) 0.23 0.23 0.15 Min 270 307 270 307 270 518 Max 987 999 987 999 987 806 n (Samp) 86 8 86 8 86 6 n (Patient) 86 8 86 8 86 6 0 hr prior to AKI stage 24 hr prior to AKI stage 48 hr prior to AKI stage sCr or UO sCr only UO only sCr or UO sCr only UO only sCr or UO sCr only UO only AUC 0.58 nd 0.61 0.58 nd 0.61 0.69 nd 0.68 SE 0.095 nd 0.11 0.099 nd 0.11 0.12 nd 0.12 p 0.38 nd 0.30 0.40 nd 0.30 0.11 nd 0.14 nCohort 1 97 nd 86 97 nd 86 97 nd 86 nCohort 2 11 nd 8 10 nd 8 6 nd 6 Cutoff 1 583 nd 583 583 nd 583 583 nd 583 Sens 1 73% nd 75% 70% nd 75% 83% nd 83% Spec 1 52% nd 51% 52% nd 51% 52% nd 51% Cutoff 2 545 nd 545 545 nd 545 583 nd 583 Sens 2 82% nd 88% 80% nd 88% 83% nd 83% Spec 2 41% nd 41% 41% nd 41% 52% nd 51% Cutoff 3 485 nd 305 485 nd 305 516 nd 514 Sens 3 91% nd 100% 90% nd 100% 100% nd 100% Spec 3 26% nd 5% 26% nd 5% 33% nd 31% Cutoff 4 664 nd 676 664 nd 676 664 nd 676 Sens 4 27% nd 38% 30% nd 38% 50% nd 50% Spec 4 70% nd 71% 70% nd 71% 70% nd 71% Cutoff 5 709 nd 711 709 nd 711 709 nd 711 Sens 5 27% nd 38% 30% nd 38% 50% nd 50% Spec 5 80% nd 80% 80% nd 80% 80% nd 80% Cutoff 6 775 nd 773 775 nd 773 775 nd 773 Sens 6 9% nd 12% 10% nd 12% 17% nd 17% Spec 6 91% nd 91% 91% nd 91% 91% nd 91% OR Quart 2 1.0 nd 2.0 2.0 nd 2.0 >1.0 nd >2.2 p Value 1.0 nd 0.58 0.58 nd 0.58 <1.0 nd <0.53 95% CI of 0.13 nd 0.17 0.17 nd 0.17 >0.059 nd >0.18 OR Quart 2 7.7 nd 24 23 nd 24 na nd na OR Quart 3 2.2 nd 2.1 4.3 nd 2.1 >2.1 nd >1.0 p Value 0.40 nd 0.56 0.20 nd 0.56 <0.56 nd <0.98 95% CI of 0.36 nd 0.18 0.45 nd 0.18 >0.18 nd >0.062 OR Quart 3 13 nd 25 42 nd 25 na nd na OR Quart 4 1.6 nd 3.1 3.1 nd 3.1 >3.3 nd >3.4 p Value 0.64 nd 0.34 0.34 nd 0.34 <0.32 nd <0.30 95% CI of 0.24 nd 0.30 0.30 nd 0.30 >0.32 nd >0.33 OR Quart 4 10 nd 33 32 nd 33 na nd na
TABLE-US-00105 Apolipoprotein A-I 0 hr prior to AKI stage 24 hr prior to AKI stage 48 hr prior to AKI stage Cohort 1 Cohort 2 Cohort 1 Cohort 2 Cohort 1 Cohort 2 sCr or UO Median 591000 1140000 591000 782000 591000 1260000 Average 851000 1870000 851000 1890000 851000 2680000 Stdev 790000 2460000 790000 2590000 790000 3160000 p (t-test) 0.0035 0.0043 6.3E-5 Min 133000 253000 133000 253000 133000 174000 Max 5190000 8110000 5190000 8110000 5190000 8110000 n (Samp) 97 11 97 10 97 6 n (Patient) 97 11 97 10 97 6 UO only Median 587000 1260000 587000 1260000 587000 1260000 Average 771000 2300000 771000 2260000 771000 2680000 Stdev 534000 2790000 534000 2800000 534000 3160000 p (t-test) 2.1E-5 3.5E-5 2.9E-6 Min 154000 253000 154000 253000 154000 174000 Max 2560000 8110000 2560000 8110000 2560000 8110000 n (Samp) 86 8 86 8 86 6 n (Patient) 86 8 86 8 86 6 0 hr prior to AKI stage 24 hr prior to AKI stage 48 hr prior to AKI stage sCr or UO sCr only UO only sCr or UO sCr only UO only sCr or UO sCr only UO only AUC 0.60 nd 0.65 0.57 nd 0.64 0.66 nd 0.66 SE 0.095 nd 0.11 0.099 nd 0.11 0.13 nd 0.13 p 0.30 nd 0.18 0.46 nd 0.19 0.21 nd 0.20 nCohort 1 97 nd 86 97 nd 86 97 nd 86 nCohort 2 11 nd 8 10 nd 8 6 nd 6 Cutoff 1 407000 nd 398000 407000 nd 398000 392000 nd 392000 Sens 1 73% nd 75% 70% nd 75% 83% nd 83% Spec 1 29% nd 24% 29% nd 24% 27% nd 23% Cutoff 2 392000 nd 392000 392000 nd 392000 392000 nd 392000 Sens 2 82% nd 88% 80% nd 88% 83% nd 83% Spec 2 27% nd 23% 27% nd 23% 27% nd 23% Cutoff 3 353000 nd 230000 353000 nd 230000 154000 nd 154000 Sens 3 91% nd 100% 90% nd 100% 100% nd 100% Spec 3 23% nd 5% 23% nd 5% 2% nd 1% Cutoff 4 876000 nd 949000 876000 nd 949000 876000 nd 949000 Sens 4 55% nd 62% 50% nd 62% 67% nd 67% Spec 4 70% nd 71% 70% nd 71% 70% nd 71% Cutoff 5 1160000 nd 1130000 1160000 nd 1130000 1160000 nd 1130000 Sens 5 45% nd 62% 40% nd 62% 50% nd 67% Spec 5 80% nd 80% 80% nd 80% 80% nd 80% Cutoff 6 1760000 nd 1440000 1760000 nd 1440000 1760000 nd 1440000 Sens 6 27% nd 38% 20% nd 38% 33% nd 33% Spec 6 91% nd 91% 91% nd 91% 91% nd 91% OR Quart 2 1.6 nd 0.46 1.5 nd 0.46 0.96 nd 0 p Value 0.64 nd 0.53 0.67 nd 0.53 0.98 nd na 95% CI of 0.24 nd 0.039 0.23 nd 0.039 0.057 nd na OR Quart 2 10 nd 5.4 9.8 nd 5.4 16 nd na OR Quart 3 0 nd 0 0 nd 0 0 nd 0 p Value na nd na na nd na na nd na 95% CI of na nd na na nd na na nd na OR Quart 3 na nd na na nd na na nd na OR Quart 4 3.6 nd 2.8 2.7 nd 2.8 4.4 nd 2.2 p Value 0.14 nd 0.26 0.26 nd 0.26 0.20 nd 0.39 95% CI of 0.65 nd 0.48 0.48 nd 0.48 0.45 nd 0.36 OR Quart 4 20 nd 16 16 nd 16 42 nd 13
TABLE-US-00106 Apolipoprotein B-100 0 hr prior to AKI stage 24 hr prior to AKI stage 48 hr prior to AKI stage Cohort 1 Cohort 2 Cohort 1 Cohort 2 Cohort 1 Cohort 2 sCr or UO Median 145000 184000 145000 175000 145000 164000 Average 149000 179000 149000 177000 149000 181000 Stdev 44100 48500 44100 50700 44100 47800 p (t-test) 0.035 0.057 0.086 Min 71000 81400 71000 81400 71000 126000 Max 245000 245000 245000 245000 245000 245000 n (Samp) 97 11 97 10 97 6 n (Patient) 97 11 97 10 97 6 UO only Median 149000 175000 149000 175000 149000 164000 Average 148000 187000 148000 186000 148000 181000 Stdev 43800 42900 43800 42700 43800 47800 p (t-test) 0.019 0.019 0.078 Min 71000 126000 71000 126000 71000 126000 Max 245000 245000 245000 245000 245000 245000 n (Samp) 86 8 86 8 86 6 n (Patient) 86 8 86 8 86 6 0 hr prior to AKI stage 24 hr prior to AKI stage 48 hr prior to AKI stage sCr or UO sCr only UO only sCr or UO sCr only UO only sCr or UO sCr only UO only AUC 0.69 nd 0.73 0.68 nd 0.73 0.70 nd 0.69 SE 0.093 nd 0.11 0.097 nd 0.11 0.12 nd 0.12 p 0.044 nd 0.031 0.072 nd 0.031 0.10 nd 0.12 nCohort 1 97 nd 86 97 nd 86 97 nd 86 nCohort 2 11 nd 8 10 nd 8 6 nd 6 Cutoff 1 160000 nd 159000 160000 nd 159000 152000 nd 152000 Sens 1 73% nd 75% 70% nd 75% 83% nd 83% Spec 1 64% nd 63% 64% nd 63% 56% nd 53% Cutoff 2 152000 nd 152000 152000 nd 152000 152000 nd 152000 Sens 2 82% nd 88% 80% nd 88% 83% nd 83% Spec 2 56% nd 53% 56% nd 53% 56% nd 53% Cutoff 3 125000 nd 125000 125000 nd 125000 125000 nd 125000 Sens 3 91% nd 100% 90% nd 100% 100% nd 100% Spec 3 38% nd 36% 38% nd 36% 38% nd 36% Cutoff 4 177000 nd 173000 177000 nd 173000 177000 nd 173000 Sens 4 55% nd 50% 50% nd 50% 33% nd 33% Spec 4 70% nd 71% 70% nd 71% 70% nd 71% Cutoff 5 194000 nd 193000 194000 nd 193000 194000 nd 193000 Sens 5 36% nd 38% 40% nd 38% 33% nd 33% Spec 5 80% nd 80% 80% nd 80% 80% nd 80% Cutoff 6 207000 nd 205000 207000 nd 205000 207000 nd 205000 Sens 6 27% nd 38% 30% nd 38% 33% nd 33% Spec 6 91% nd 91% 91% nd 91% 91% nd 91% OR Quart 2 1.0 nd >1.0 0.96 nd >1.0 >1.0 nd >1.0 p Value 1.0 nd <1.0 0.98 nd <1.0 <1.0 nd <0.98 95% CI of 0.059 nd >0.059 0.057 nd >0.059 >0.059 nd >0.062 OR Quart 2 17 nd na 16 nd na na nd na OR Quart 3 4.5 nd >4.8 4.3 nd >4.8 >3.3 nd >3.4 p Value 0.19 nd <0.17 0.20 nd <0.17 <0.32 nd <0.30 95% CI of 0.47 nd >0.50 0.45 nd >0.50 >0.32 nd >0.33 OR Quart 3 43 nd na 42 nd na na nd na OR Quart 4 5.9 nd >3.3 4.3 nd >3.3 >2.1 nd >2.2 p Value 0.12 nd <0.32 0.20 nd <0.32 <0.56 nd <0.53 95% CI of 0.64 nd >0.32 0.45 nd >0.32 >0.18 nd >0.18 OR Quart 4 54 nd na 42 nd na na nd na
TABLE-US-00107 Calcitonin 0 hr prior to AKI stage 24 hr prior to AKI stage 48 hr prior to AKI stage Cohort 1 Cohort 2 Cohort 1 Cohort 2 Cohort 1 Cohort 2 sCr or UO Median 39.6 298 39.6 298 39.6 105 Average 361 834 361 726 361 186 Stdev 1020 1060 1020 860 1020 210 p (t-test) 0.088 0.18 0.63 Min 0.0604 2.07 0.0604 2.07 0.0604 2.07 Max 6590 3470 6590 2390 6590 570 n (Samp) 110 16 110 16 110 8 n (Patient) 110 16 110 16 110 8 sCr only Median 41.6 935 41.6 935 nd nd Average 374 1260 374 1180 nd nd Stdev 950 1240 950 1190 nd nd p (t-test) 0.012 0.021 nd nd Min 0.0604 82.4 0.0604 71.7 nd nd Max 6590 3470 6590 3470 nd nd n (Samp) 180 8 180 8 nd nd n (Patient) 180 8 180 8 nd nd UO only Median 41.8 146 41.8 146 41.8 65.4 Average 422 681 422 571 422 119 Stdev 1160 1160 1160 894 1160 164 p(t-test) 0.50 0.70 0.52 Min 2.02 2.07 2.02 2.07 2.02 2.07 Max 6590 3470 6590 2390 6590 439 n (Samp) 91 10 91 10 91 6 n (Patient) 91 10 91 10 91 6 0 hr prior to AKI stage 24 hr prior to AKI stage 48 hr prior to AKI stage sCr or UO sCr only UO only sCr or UO sCr only UO only sCr or UO sCr only UO only AUC 0.74 0.85 0.63 0.73 0.82 0.63 0.59 nd 0.48 SE 0.074 0.086 0.099 0.075 0.092 0.099 0.11 nd 0.12 p 0.0011 5.4E-5 0.18 0.0025 4.2E-4 0.20 0.42 nd 0.86 nCohort 1 110 180 91 110 180 91 110 nd 91 nCohort 2 16 8 10 16 8 10 8 nd 6 Cutoff 1 143 228 74.2 75.8 228 74.2 47.1 nd 12.6 Sens 1 75% 75% 70% 75% 75% 70% 75% nd 83% Spec 1 72% 79% 60% 63% 79% 60% 56% nd 19% Cutoff 2 75.8 207 59.4 66.5 79.9 44.2 12.6 nd 12.6 Sens 2 81% 88% 80% 81% 88% 80% 88% nd 83% Spec 2 63% 78% 58% 62% 59% 54% 25% nd 19% Cutoff 3 12.6 79.9 12.6 12.6 66.5 12.6 2.02 nd 2.02 Sens 3 94% 100% 90% 94% 100% 90% 100% nd 100% Spec 3 25% 59% 19% 25% 58% 19% 4% nd 1% Cutoff 4 110 151 149 110 151 149 110 nd 149 Sens 4 75% 88% 40% 69% 75% 40% 50% nd 17% Spec 4 70% 70% 71% 70% 70% 71% 70% nd 71% Cutoff 5 179 304 304 179 304 304 179 nd 304 Sens 5 62% 62% 40% 56% 62% 40% 38% nd 17% Spec 5 80% 80% 80% 80% 80% 80% 80% nd 80% Cutoff 6 762 847 762 762 847 762 762 nd 762 Sens 6 31% 50% 20% 31% 50% 20% 0% nd 0% Spec 6 90% 90% 90% 90% 90% 90% 90% nd 90% OR Quart 2 0 >0 0 0 >0 0 0.97 nd 3.4 p Value na <na na na <na na 0.98 nd 0.30 95% CI of na >na na na >na na 0.058 nd 0.33 OR Quart 2 na na na na na na 16 nd 36 OR Quart 3 2.1 >1.0 2.2 2.8 >2.1 2.2 3.2 nd 0 p Value 0.40 <0.99 0.39 0.24 <0.55 0.39 0.32 nd na 95% CI of 0.36 >0.062 0.36 0.50 >0.18 0.36 0.32 nd na OR Quart 3 13 na 13 16 na 13 33 nd na OR Quart 4 6.6 >8.2 2.1 5.7 >6.9 2.1 3.1 nd 2.2 p Value 0.022 <0.053 0.42 0.037 <0.080 0.42 0.34 nd 0.54 95% CI of 1.3 >0.97 0.35 1.1 >0.79 0.35 0.30 nd 0.18 OR Quart 4 33 na 13 29 na 13 32 nd 26
TABLE-US-00108 C-reactive protein 0 hr prior to AKI stage 24 hr prior to AKI stage 48 hr prior to AKI stage Cohort 1 Cohort 2 Cohort 1 Cohort 2 Cohort 1 Cohort 2 sCr or UO Median 60700 70000 60700 70000 60700 70000 Average 55700 116000 55700 115000 55700 63900 Stdev 32900 153000 32900 162000 32900 22200 p (t-test) 0.0010 0.0022 0.55 Min 1.00E-9 39300 1.00E-9 37500 1.00E-9 31900 Max 251000 573000 251000 573000 251000 95500 n (Samp) 97 11 97 10 97 6 n (Patient) 97 11 97 10 97 6 UO only Median 70000 70000 70000 70000 70000 70000 Average 57500 138000 57500 126000 57500 63900 Stdev 32200 177000 32200 181000 32200 22200 p (t-test) 3.1E-4 0.0021 0.63 Min 7000 47700 7000 37500 7000 31900 Max 251000 573000 251000 573000 251000 95500 n (Samp) 86 8 86 8 86 6 n (Patient) 86 8 86 8 86 6 0 hr prior to AKI stage 24 hr prior to AKI stage 48 hr prior to AKI stage sCr or UO sCr only UO only sCr or UO sCr only UO only sCr or UO sCr only UO only AUC 0.70 nd 0.73 0.67 nd 0.64 0.63 nd 0.61 SE 0.092 nd 0.10 0.097 nd 0.11 0.13 nd 0.13 p 0.025 nd 0.026 0.077 nd 0.20 0.30 nd 0.37 nCohort 1 97 nd 86 97 nd 86 97 nd 86 nCohort 2 11 nd 8 10 nd 8 6 nd 6 Cutoff 1 62700 nd 62700 62700 nd 45900 45600 nd 45600 Sens 1 73% nd 75% 70% nd 75% 83% nd 83% Spec 1 53% nd 48% 53% nd 40% 42% nd 40% Cutoff 2 55400 nd 55400 45900 nd 45600 45600 nd 45600 Sens 2 82% nd 88% 80% nd 88% 83% nd 83% Spec 2 47% nd 44% 42% nd 40% 42% nd 40% Cutoff 3 45600 nd 45600 45600 nd 36700 31900 nd 31900 Sens 3 91% nd 100% 90% nd 100% 100% nd 100% Spec 3 42% nd 40% 42% nd 28% 25% nd 22% Cutoff 4 70000 nd 70000 70000 nd 70000 70000 nd 70000 Sens 4 27% nd 38% 20% nd 25% 17% nd 17% Spec 4 92% nd 93% 92% nd 93% 92% nd 93% Cutoff 5 70000 nd 70000 70000 nd 70000 70000 nd 70000 Sens 5 27% nd 38% 20% nd 25% 17% nd 17% Spec 5 92% nd 93% 92% nd 93% 92% nd 93% Cutoff 6 70000 nd 70000 70000 nd 70000 70000 nd 70000 Sens 6 27% nd 38% 20% nd 25% 17% nd 17% Spec 6 92% nd 93% 92% nd 93% 92% nd 93% OR Quart 2 >3.4 nd >4.6 >3.2 nd >3.3 0.96 nd 2.1 p Value <0.31 nd <0.19 <0.32 nd <0.32 0.98 nd 0.56 95% CI of >0.33 nd >0.47 >0.32 nd >0.32 0.057 nd 0.18 OR Quart 2 na nd na na nd na 16 nd 25 OR Quart 3 >6.1 nd >1.0 >5.9 nd >3.4 3.1 nd 2.1 p Value <0.11 nd <0.98 <0.12 nd <0.30 0.34 nd 0.56 95% CI of >0.67 nd >0.062 >0.64 nd >0.33 0.30 nd 0.18 OR Quart 3 na nd na na nd na 32 nd 25 OR Quart 4 >3.4 nd >3.3 >2.1 nd >2.1 0.96 nd 1.0 p Value <0.31 nd <0.32 <0.56 nd <0.56 0.98 nd 1.0 95% CI of >0.33 nd >0.32 >0.18 nd >0.18 0.057 nd 0.059 OR Quart 4 na nd na na nd na 16 nd 17
TABLE-US-00109 Tissue factor 0 hr prior to AKI stage 24 hr prior to AKI stage 48 hr prior to AKI stage Cohort 1 Cohort 2 Cohort 1 Cohort 2 Cohort 1 Cohort 2 sCr or UO Median 0.644 1.04 0.644 0.783 0.644 0.714 Average 0.836 1.26 0.836 0.941 0.836 0.799 Stdev 0.997 0.805 0.997 0.713 0.997 0.450 p (t-test) 0.11 0.69 0.92 Min 0.00841 0.376 0.00841 0.00841 0.00841 0.376 Max 7.23 3.31 7.23 2.44 7.23 1.52 n (Samp) 110 16 110 16 110 8 n (Patient) 110 16 110 16 110 8 sCr only Median 0.641 1.12 0.641 0.824 nd nd Average 0.778 1.45 0.778 1.24 nd nd Stdev 0.876 0.993 0.876 1.11 nd nd p (t-test) 0.036 0.15 nd nd Min 0.00841 0.386 0.00841 0.299 nd nd Max 7.23 3.31 7.23 3.31 nd nd n (Samp) 180 8 180 8 nd nd n (Patient) 180 8 180 8 nd nd UO only Median 0.592 0.958 0.592 0.783 0.592 0.714 Average 0.784 1.27 0.784 0.920 0.784 0.748 Stdev 1.03 0.879 1.03 0.663 1.03 0.377 p (t-test) 0.15 0.68 0.93 Min 0.00841 0.376 0.00841 0.00841 0.00841 0.376 Max 7.23 3.31 7.23 2.43 7.23 1.44 n (Samp) 91 10 91 10 91 6 n (Patient) 91 10 91 10 91 6 0 hr prior to AKI stage 24 hr prior to AKI stage 48 hr prior to AKI stage sCr or UO sCr only UO only sCr or UO sCr only UO only sCr or UO sCr only UO only AUC 0.68 0.73 0.70 0.57 0.63 0.61 0.54 nd 0.57 SE 0.078 0.10 0.096 0.079 0.11 0.099 0.11 nd 0.13 p 0.020 0.025 0.033 0.36 0.23 0.25 0.70 nd 0.56 nCohort 1 110 180 91 110 180 91 110 nd 91 nCohort 2 16 8 10 16 8 10 8 nd 6 Cutoff 1 0.708 0.771 0.771 0.378 0.378 0.688 0.437 nd 0.437 Sens 1 75% 75% 70% 75% 75% 70% 75% nd 83% Spec 1 55% 58% 62% 35% 37% 62% 37% nd 42% Cutoff 2 0.678 0.678 0.688 0.375 0.336 0.525 0.378 nd 0.437 Sens 2 81% 88% 80% 81% 88% 80% 88% nd 83% Spec 2 53% 55% 62% 34% 33% 46% 35% nd 42% Cutoff 3 0.378 0.378 0.592 0.297 0.298 0.375 0.375 nd 0.375 Sens 3 94% 100% 90% 94% 100% 90% 100% nd 100% Spec 3 35% 37% 51% 32% 32% 37% 34% nd 37% Cutoff 4 1.03 0.987 0.945 1.03 0.987 0.945 1.03 nd 0.945 Sens 4 50% 62% 50% 31% 38% 40% 25% nd 17% Spec 4 70% 70% 70% 70% 70% 70% 70% nd 70% Cutoff 5 1.25 1.29 1.20 1.25 1.29 1.20 1.25 nd 1.20 Sens 5 31% 38% 30% 25% 38% 20% 25% nd 17% Spec 5 80% 80% 80% 80% 80% 80% 80% nd 80% Cutoff 6 1.77 1.69 1.80 1.77 1.69 1.80 1.77 nd 1.80 Sens 6 19% 38% 20% 12% 25% 10% 0% nd 0% Spec 6 90% 90% 90% 90% 90% 90% 90% nd 90% OR Quart 2 >4.4 >1.0 >2.2 >7.2 >3.2 >3.4 >3.2 nd >2.2 p Value <0.19 <0.99 <0.54 <0.077 <0.32 <0.30 <0.32 nd <0.54 95% CI of >0.47 >0.062 >0.18 >0.81 >0.32 >0.33 >0.32 nd >0.18 OR Quart 2 na na na na na na na nd na OR Quart 3 >7.4 >3.2 >4.8 >7.4 >2.1 >4.8 >3.3 nd >3.4 p Value <0.071 <0.32 <0.18 <0.071 <0.55 <0.18 <0.31 nd <0.30 95% CI of >0.84 >0.32 >0.49 >0.84 >0.18 >0.49 >0.33 nd >0.33 OR Quart 3 na na na na na na na nd na OR Quart 4 >7.2 >4.4 >4.5 >4.4 >3.2 >3.3 >2.1 nd >1.0 p Value <0.077 <0.19 <0.19 <0.19 <0.32 <0.32 <0.56 nd <1.0 95% CI of >0.81 >0.47 >0.47 >0.47 >0.32 >0.32 >0.18 nd >0.059 OR Quart 4 na na na na na na na nd na
TABLE-US-00110 Fibrinogen 0 hr prior to AKI stage 24 hr prior to AKI stage 48 hr prior to AKI stage Cohort 1 Cohort 2 Cohort 1 Cohort 2 Cohort 1 Cohort 2 sCr or UO Median 1460 1570 1460 1610 1460 1540 Average 1630 1770 1630 1800 1630 1580 Stdev 828 936 828 958 828 441 p (t-test) 0.60 0.53 0.90 Min 16.3 256 16.3 256 16.3 938 Max 5850 3430 5850 3370 5850 2260 n (Samp) 97 11 97 10 97 6 n (Patient) 97 11 97 10 97 6 UO only Median 1510 1540 1510 1540 1510 1540 Average 1640 1660 1640 1640 1640 1580 Stdev 671 940 671 918 671 441 p (t-test) 0.94 0.99 0.85 Min 504 256 504 256 504 938 Max 5390 3430 5390 3370 5390 2260 n (Samp) 86 8 86 8 86 6 n (Patient) 86 8 86 8 86 6 0 hr prior to AKI stage 24 hr prior to AKI stage 48 hr prior to AKI stage sCr or UO sCr only UO only sCr or UO sCr only UO only sCr or UO sCr only UO only AUC 0.56 nd 0.50 0.58 nd 0.50 0.54 nd 0.51 SE 0.094 nd 0.11 0.099 nd 0.11 0.12 nd 0.12 p 0.52 nd 0.98 0.41 nd 0.98 0.74 nd 0.96 nCohort 1 97 nd 86 97 nd 86 97 nd 86 nCohort 2 11 nd 8 10 nd 8 6 nd 6 Cutoff 1 1390 nd 1390 1510 nd 1390 1390 nd 1390 Sens 1 73% nd 75% 70% nd 75% 83% nd 83% Spec 1 43% nd 38% 55% nd 38% 43% nd 38% Cutoff 2 1270 nd 909 1390 nd 909 1390 nd 1390 Sens 2 82% nd 88% 80% nd 88% 83% nd 83% Spec 2 35% nd 7% 43% nd 7% 43% nd 38% Cutoff 3 913 nd 0 913 nd 0 913 nd 909 Sens 3 91% nd 100% 90% nd 100% 100% nd 100% Spec 3 12% nd 0% 12% nd 0% 12% nd 7% Cutoff 4 1790 nd 1830 1790 nd 1830 1790 nd 1830 Sens 4 36% nd 25% 40% nd 25% 33% nd 17% Spec 4 70% nd 71% 70% nd 71% 70% nd 71% Cutoff 5 2010 nd 2010 2010 nd 2010 2010 nd 2010 Sens 5 27% nd 25% 30% nd 25% 17% nd 17% Spec 5 80% nd 80% 80% nd 80% 80% nd 80% Cutoff 6 2450 nd 2380 2450 nd 2380 2450 nd 2380 Sens 6 18% nd 12% 20% nd 12% 0% nd 0% Spec 6 91% nd 91% 91% nd 91% 91% nd 91% OR Quart 2 1.0 nd 0.46 0.46 nd 0.46 0.96 nd 1.0 p Value 1.0 nd 0.53 0.54 nd 0.53 0.98 nd 1.0 95% CI of 0.13 nd 0.039 0.039 nd 0.039 0.057 nd 0.059 OR Quart 2 7.7 nd 5.4 5.4 nd 5.4 16 nd 17 OR Quart 3 2.2 nd 1.6 2.1 nd 1.6 3.1 nd 3.3 p Value 0.40 nd 0.64 0.42 nd 0.64 0.34 nd 0.32 95% CI of 0.36 nd 0.24 0.35 nd 0.24 0.30 nd 0.32 OR Quart 3 13 nd 10 13 nd 10 32 nd 34 OR Quart 4 1.6 nd 0.95 1.5 nd 0.95 0.96 nd 1.0 p Value 0.64 nd 0.96 0.67 nd 0.96 0.98 nd 1.0 95% CI of 0.24 nd 0.12 0.23 nd 0.12 0.057 nd 0.059 OR Quart 4 10 nd 7.4 9.8 nd 7.4 16 nd 17
TABLE-US-00111 Intercellular adhesion molecule 3 0 hr prior to AKI stage 24 hr prior to AKI stage 48 hr prior to AKI stage sCr or UO Cohort 1 Cohort 2 Cohort 1 Cohort 2 Cohort 1 Cohort 2 Median 0.466 0.532 0.466 0.532 nd nd Average 0.523 0.515 0.523 0.515 nd nd Stdev 0.290 0.203 0.290 0.203 nd nd p (t-test) 0.95 0.95 nd nd Min 0.229 0.273 0.229 0.273 nd nd Max 1.56 0.774 1.56 0.774 nd nd n (Samp) 26 6 26 6 nd nd n (Patient) 26 6 26 6 nd nd 0 hr prior to AKI stage 24 hr prior to AKI stage 48 hr prior to AKI stage sCr or UO sCr only UO only sCr or UO sCr only UO only sCr or UO sCr only UO only AUC 0.57 nd nd 0.57 nd nd nd nd nd SE 0.13 nd nd 0.13 nd nd nd nd nd p 0.60 nd nd 0.60 nd nd nd nd nd nCohort 1 26 nd nd 26 nd nd nd nd nd nCohort 2 6 nd nd 6 nd nd nd nd nd Cutoff 1 0.309 nd nd 0.309 nd nd nd nd nd Sens 1 83% nd nd 83% nd nd nd nd nd Spec 1 27% nd nd 27% nd nd nd nd nd Cutoff 2 0.309 nd nd 0.309 nd nd nd nd nd Sens 2 83% nd nd 83% nd nd nd nd nd Spec 2 27% nd nd 27% nd nd nd nd nd Cutoff 3 0.270 nd nd 0.270 nd nd nd nd nd Sens 3 100% nd nd 100% nd nd nd nd nd Spec 3 15% nd nd 15% nd nd nd nd nd Cutoff 4 0.601 nd nd 0.601 nd nd nd nd nd Sens 4 50% nd nd 50% nd nd nd nd nd Spec 4 73% nd nd 73% nd nd nd nd nd Cutoff 5 0.605 nd nd 0.605 nd nd nd nd nd Sens 5 50% nd nd 50% nd nd nd nd nd Spec 5 81% nd nd 81% nd nd nd nd nd Cutoff 6 0.772 nd nd 0.772 nd nd nd nd nd Sens 6 17% nd nd 17% nd nd nd nd nd Spec 6 92% nd nd 92% nd nd nd nd nd OR Quart 2 2.3 nd nd 2.3 nd nd nd nd nd p Value 0.53 nd nd 0.53 nd nd nd nd nd 95% CI of 0.17 nd nd 0.17 nd nd nd nd nd OR Quart 2 33 nd nd 33 nd nd nd nd nd OR Quart 3 0 nd nd 0 nd nd nd nd nd p Value na nd nd na nd nd nd nd nd 95% CI of na nd nd na nd nd nd nd nd OR Quart 3 na nd nd na nd nd nd nd nd OR Quart 4 4.2 nd nd 4.2 nd nd nd nd nd p Value 0.27 nd nd 0.27 nd nd nd nd nd 95% CI of 0.33 nd nd 0.33 nd nd nd nd nd OR Quart 4 53 nd nd 53 nd nd nd nd nd
TABLE-US-00112 Interleukin-5 0 hr prior to AKI stage 24 hr prior to AKI stage 48 hr prior to AKI stage Cohort 1 Cohort 2 Cohort 1 Cohort 2 Cohort 1 Cohort 2 sCr or UO Median 0.885 0.291 0.885 0.117 0.885 0.761 Average 2.23 2.63 2.23 2.51 2.23 4.05 Stdev 4.69 5.80 4.69 6.12 4.69 7.46 p (t-test) 0.79 0.86 0.38 Min 1.00E-9 1.00E-9 1.00E-9 1.00E-9 1.00E-9 0.0602 Max 39.5 19.6 39.5 19.6 39.5 19.0 n (Samp) 97 11 97 10 97 6 n (Patient) 97 11 97 10 97 6 UO only Median 0.926 0.875 0.926 0.219 0.926 0.761 Average 3.74 3.60 3.74 3.12 3.74 4.05 Stdev 13.6 6.64 13.6 6.79 13.6 7.46 p (t-test) 0.98 0.90 0.96 Min 0.0133 1.00E-9 0.0133 1.00E-9 0.0133 0.0602 Max 120 19.6 120 19.6 120 19.0 n (Samp) 86 8 86 8 86 6 n (Patient) 86 8 86 8 86 6 0 hr prior to AKI stage 24 hr prior to AKI stage 48 hr prior to AKI stage sCr or UO sCr only UO only sCr or UO sCr only UO only sCr or UO sCr only UO only AUC 0.36 nd 0.45 0.29 nd 0.33 0.45 nd 0.43 SE 0.094 nd 0.11 0.095 nd 0.11 0.12 nd 0.13 p 0.12 nd 0.68 0.024 nd 0.11 0.71 nd 0.58 nCohort 1 97 nd 86 97 nd 86 97 nd 86 nCohort 2 11 nd 8 10 nd 8 6 nd 6 Cutoff 1 0.0760 nd 0.253 0.0512 nd 0.0422 0.115 nd 0.126 Sens 1 73% nd 75% 70% nd 75% 83% nd 83% Spec 1 6% nd 14% 5% nd 2% 10% nd 8% Cutoff 2 0.0309 nd 0.126 0.0309 nd 0 0.115 nd 0.126 Sens 2 82% nd 88% 80% nd 100% 83% nd 83% Spec 2 3% nd 8% 3% nd 0% 10% nd 8% Cutoff 3 0 nd 0 0 nd 0 0.0512 nd 0.0422 Sens 3 100% nd 100% 100% nd 100% 100% nd 100% Spec 3 0% nd 0% 0% nd 0% 5% nd 2% Cutoff 4 1.86 nd 1.97 1.86 nd 1.97 1.86 nd 1.97 Sens 4 27% nd 38% 20% nd 25% 33% nd 33% Spec 4 70% nd 71% 70% nd 71% 70% nd 71% Cutoff 5 2.38 nd 2.84 2.38 nd 2.84 2.38 nd 2.84 Sens 5 27% nd 38% 20% nd 25% 33% nd 33% Spec 5 80% nd 80% 80% nd 80% 80% nd 80% Cutoff 6 4.99 nd 6.30 4.99 nd 6.30 4.99 nd 6.30 Sens 6 9% nd 12% 10% nd 12% 17% nd 17% Spec 6 91% nd 91% 91% nd 91% 91% nd 91% OR Quart 2 0.31 nd 0.32 0.48 nd 0.50 0.48 nd 0.48 p Value 0.32 nd 0.34 0.56 nd 0.58 0.56 nd 0.56 95% CI of 0.030 nd 0.031 0.041 nd 0.042 0.041 nd 0.040 OR Quart 2 3.2 nd 3.3 5.6 nd 5.9 5.6 nd 5.7 OR Quart 3 0.31 nd 0.30 0 nd 0 0 nd 0 p Value 0.32 nd 0.32 na nd na na nd na 95% CI of 0.030 nd 0.029 na nd na na nd na OR Quart 3 3.2 nd 3.2 na nd na na nd na OR Quart 4 2.3 nd 1.0 4.6 nd 3.1 1.6 nd 1.6 p Value 0.28 nd 0.96 0.075 nd 0.21 0.61 nd 0.64 95% CI of 0.51 nd 0.19 0.86 nd 0.53 0.25 nd 0.24 OR Quart 4 10 nd 5.8 25 nd 18 11 nd 10
TABLE-US-00113 Interleukin-6 receptor subunit beta 0 hr prior to AKI stage 24 hr prior to AKI stage 48 hr prior to AKI stage Cohort 1 Cohort 2 Cohort 1 Cohort 2 Cohort 1 Cohort 2 sCr or UO Median 122000 119000 122000 119000 122000 118000 Average 127000 123000 127000 122000 127000 115000 Stdev 32500 48600 32500 46000 32500 61600 p (t-test) 0.74 0.63 0.43 Min 40800 51400 40800 51400 40800 38400 Max 203000 204000 203000 186000 203000 181000 n (Samp) 51 12 51 12 51 6 n (Patient) 51 12 51 12 51 6 sCr only Median 136000 119000 136000 119000 nd nd Average 133000 126000 133000 123000 nd nd Stdev 39300 48300 39300 42500 nd nd p (t-test) 0.66 0.53 nd nd Min 11900 55400 11900 55400 nd nd Max 231000 204000 231000 186000 nd nd n (Samp) 101 6 101 6 nd nd n (Patient) 101 6 101 6 nd nd UO only Median 138000 115000 138000 115000 138000 118000 Average 135000 115000 135000 115000 135000 115000 Stdev 33800 51800 33800 51800 33800 61600 p (t-test) 0.17 0.17 0.23 Min 40800 51400 40800 51400 40800 38400 Max 203000 181000 203000 181000 203000 181000 n (Samp) 47 8 47 8 47 6 n (Patient) 47 8 47 8 47 6 0 hr prior to AKI stage 24 hr prior to AKI stage 48 hr prior to AKI stage sCr or UO sCr only UO only sCr or UO sCr only UO only sCr or UO sCr only UO only AUC 0.48 0.46 0.39 0.48 0.45 0.39 0.46 nd 0.43 SE 0.094 0.12 0.11 0.094 0.12 0.11 0.13 nd 0.13 p 0.83 0.72 0.34 0.82 0.66 0.34 0.78 nd 0.58 nCohort 1 51 101 47 51 101 47 51 nd 47 nCohort 2 12 6 8 12 6 8 6 nd 6 Cutoff 1 91600 114000 75500 91600 114000 75500 40800 nd 40800 Sens 1 75% 83% 75% 75% 83% 75% 83% nd 83% Spec 1 16% 34% 4% 16% 34% 4% 2% nd 2% Cutoff 2 75500 114000 51400 75500 114000 51400 40800 nd 40800 Sens 2 83% 83% 88% 83% 83% 88% 83% nd 83% Spec 2 4% 34% 2% 4% 34% 2% 2% nd 2% Cutoff 3 51400 51400 40800 51400 51400 40800 0 nd 0 Sens 3 92% 100% 100% 92% 100% 100% 100% nd 100% Spec 3 2% 4% 2% 2% 4% 2% 0% nd 0% Cutoff 4 150000 154000 156000 150000 154000 156000 150000 nd 156000 Sens 4 25% 17% 25% 25% 17% 25% 33% nd 33% Spec 4 71% 70% 70% 71% 70% 70% 71% nd 70% Cutoff 5 156000 163000 166000 156000 163000 166000 156000 nd 166000 Sens 5 25% 17% 25% 25% 17% 25% 33% nd 33% Spec 5 80% 80% 81% 80% 80% 81% 80% nd 81% Cutoff 6 169000 181000 173000 169000 181000 173000 169000 nd 173000 Sens 6 25% 17% 25% 25% 17% 25% 33% nd 33% Spec 6 90% 90% 91% 90% 90% 91% 90% nd 91% OR Quart 2 1.0 1.0 1.0 1.0 1.0 1.0 0.50 nd 0.50 p Value 1.0 1.0 1.0 1.0 1.0 1.0 0.59 nd 0.59 95% CI of 0.17 0.059 0.12 0.17 0.059 0.12 0.040 nd 0.040 OR Quart 2 5.9 17 8.3 5.9 17 8.3 6.2 nd 6.3 OR Quart 3 0.62 3.2 0 0.62 3.2 0 0 nd 0 p Value 0.63 0.32 na 0.63 0.32 na na nd na 95% CI of 0.089 0.32 na 0.089 0.32 na na nd na OR Quart 3 4.3 33 na 4.3 33 na na nd na OR Quart 4 1.6 1.0 2.7 1.6 1.0 2.7 1.8 nd 1.8 p Value 0.60 0.98 0.31 0.60 0.98 0.31 0.57 nd 0.56 95% CI of 0.29 0.062 0.40 0.29 0.062 0.40 0.25 nd 0.25 OR Quart 4 8.6 18 18 8.6 18 18 13 nd 13
TABLE-US-00114 Macrophage metalloelastase 0 hr prior to AKI stage 24 hr prior to AKI stage 48 hr prior to AKI stage sCr or UO Cohort 1 Cohort 2 Cohort 1 Cohort 2 Cohort 1 Cohort 2 Median 36.8 36.8 36.8 36.8 nd nd Average 26.7 38.2 26.7 38.2 nd nd Stdev 19.6 12.9 19.6 12.9 nd nd p (t-test) 0.18 0.18 nd nd Min 1.00E-9 21.1 1.00E-9 21.1 nd nd Max 61.3 61.3 61.3 61.3 nd nd n (Samp) 26 6 26 6 nd nd n (Patient) 26 6 26 6 nd nd 0 hr prior to AKI stage 24 hr prior to AKI stage 48 hr prior to AKI stage sCr or UO sCr only UO only sCr or UO sCr only UO only sCr or UO sCr only UO only AUC 0.64 nd nd 0.64 nd nd nd nd nd SE 0.13 nd nd 0.13 nd nd nd nd nd p 0.30 nd nd 0.30 nd nd nd nd nd nCohort 1 26 nd nd 26 nd nd nd nd nd nCohort 2 6 nd nd 6 nd nd nd nd nd Cutoff 1 21.1 nd nd 21.1 nd nd nd nd nd Sens 1 83% nd nd 83% nd nd nd nd nd Spec 1 35% nd nd 35% nd nd nd nd nd Cutoff 2 21.1 nd nd 21.1 nd nd nd nd nd Sens 2 83% nd nd 83% nd nd nd nd nd Spec 2 35% nd nd 35% nd nd nd nd nd Cutoff 3 1.00E-9 nd nd 1.00E-9 nd nd nd nd nd Sens 3 100% nd nd 100% nd nd nd nd nd Spec 3 31% nd nd 31% nd nd nd nd nd Cutoff 4 36.8 nd nd 36.8 nd nd nd nd nd Sens 4 17% nd nd 17% nd nd nd nd nd Spec 4 92% nd nd 92% nd nd nd nd nd Cutoff 5 36.8 nd nd 36.8 nd nd nd nd nd Sens 5 17% nd nd 17% nd nd nd nd nd Spec 5 92% nd nd 92% nd nd nd nd nd Cutoff 6 36.8 nd nd 36.8 nd nd nd nd nd Sens 6 17% nd nd 17% nd nd nd nd nd Spec 6 92% nd nd 92% nd nd nd nd nd OR Quart 2 >13 nd nd >13 nd nd nd nd nd p Value <0.044 nd nd <0.044 nd nd nd nd nd 95% CI of >1.1 nd nd >1.1 nd nd nd nd nd OR Quart 2 na nd nd na nd nd nd nd nd OR Quart 3 >0 nd nd >0 nd nd nd nd nd p Value <na nd nd <na nd nd nd nd nd 95% CI of >na nd nd >na nd nd nd nd nd OR Quart 3 na nd nd na nd nd nd nd nd OR Quart 4 >1.1 nd nd >1.1 nd nd nd nd nd p Value <0.93 nd nd <0.93 nd nd nd nd nd 95% CI of >0.060 nd nd >0.060 nd nd nd nd nd OR Quart 4 na nd nd na nd nd nd nd nd
TABLE-US-00115 Sex hormone-binding globulin 0 hr prior to AKI stage 24 hr prior to AKI stage 48 hr prior to AKI stage Cohort 1 Cohort 2 Cohort 1 Cohort 2 Cohort 1 Cohort 2 sCr or UO Median 37.5 33.1 37.5 31.2 37.5 35.2 Average 42.5 38.4 42.5 37.7 42.5 43.5 Stdev 20.3 18.1 20.3 17.3 20.3 21.9 p (t-test) 0.44 0.38 0.89 Min 14.0 24.3 14.0 24.3 14.0 24.3 Max 142 86.4 142 81.5 142 79.0 n (Samp) 110 16 110 16 110 8 n (Patient) 110 16 110 16 110 8 sCr only Median 37.3 27.4 37.3 27.4 nd nd Average 41.6 32.3 41.6 32.3 nd nd Stdev 19.7 8.71 19.7 8.68 nd nd p (t-test) 0.19 0.19 nd nd Min 14.0 24.3 14.0 24.3 nd nd Max 142 46.1 142 46.1 nd nd n (Samp) 180 8 180 8 nd nd n (Patient) 180 8 180 8 nd nd UO only Median 37.2 37.7 37.2 37.0 37.2 42.1 Average 42.5 44.1 42.5 43.2 42.5 49.3 Stdev 20.8 20.5 20.8 19.7 20.8 22.5 p (t-test) 0.81 0.92 0.44 Min 14.0 25.6 14.0 25.6 14.0 25.6 Max 142 86.4 142 81.5 142 79.0 n (Samp) 91 10 91 10 91 6 n (Patient) 91 10 91 10 91 6 0 hr prior to AKI stage 24 hr prior to AKI stage 48 hr prior to AKI stage sCr or UO sCr only UO only sCr or UO sCr only UO only sCr or UO sCr only UO only AUC 0.40 0.32 0.52 0.39 0.32 0.51 0.48 nd 0.60 SE 0.079 0.11 0.098 0.079 0.11 0.097 0.11 nd 0.13 p 0.20 0.098 0.83 0.17 0.097 0.95 0.84 nd 0.43 nCohort 1 110 180 91 110 180 91 110 nd 91 nCohort 2 16 8 10 16 8 10 8 nd 6 Cutoff 1 26.9 26.9 35.2 26.9 26.9 31.9 27.2 nd 31.9 Sens 1 75% 75% 70% 75% 75% 70% 75% nd 83% Spec 1 15% 16% 47% 15% 16% 36% 15% nd 36% Cutoff 2 25.6 24.6 29.7 25.6 24.6 29.7 25.3 nd 31.9 Sens 2 81% 88% 80% 81% 88% 80% 88% nd 83% Spec 2 12% 11% 26% 12% 11% 26% 12% nd 36% Cutoff 3 24.6 24.2 26.0 24.6 24.2 26.0 24.2 nd 25.3 Sens 3 94% 100% 90% 94% 100% 90% 100% nd 100% Spec 3 11% 8% 12% 11% 8% 12% 8% nd 11% Cutoff 4 47.7 45.1 47.7 47.7 45.1 47.7 47.7 nd 47.7 Sens 4 12% 12% 20% 12% 12% 20% 25% nd 33% Spec 4 70% 70% 70% 70% 70% 70% 70% nd 70% Cutoff 5 53.9 51.6 54.6 53.9 51.6 54.6 53.9 nd 54.6 Sens 5 12% 0% 20% 12% 0% 20% 25% nd 33% Spec 5 80% 80% 80% 80% 80% 80% 80% nd 80% Cutoff 6 60.5 60.5 60.5 60.5 60.5 60.5 60.5 nd 60.5 Sens 6 12% 0% 20% 12% 0% 20% 25% nd 33% Spec 6 90% 90% 90% 90% 90% 90% 90% nd 90% OR Quart 2 2.9 >3.2 1.0 2.2 >3.2 1.6 1.0 nd 1.0 p Value 0.23 <0.32 1.0 0.38 <0.32 0.64 0.97 nd 1.0 95% CI of 0.52 >0.32 0.13 0.38 >0.32 0.24 0.14 nd 0.059 OR Quart 2 16 na 7.7 13 na 10 7.9 nd 17 OR Quart 3 1.0 >0 2.2 1.6 >0 1.6 0.48 nd 2.1 p Value 1.0 <na 0.39 0.64 <na 0.64 0.56 nd 0.56 95% CI of 0.13 >na 0.36 0.24 >na 0.24 0.041 nd 0.18 OR Quart 3 7.6 na 13 10.0 na 10 5.6 nd 25 OR Quart 4 4.4 >5.6 0.96 4.4 >5.6 0.96 1.6 nd 2.0 p Value 0.082 <0.12 0.97 0.082 <0.12 0.97 0.61 nd 0.58 95% CI of 0.83 >0.63 0.12 0.83 >0.63 0.12 0.25 nd 0.17 OR Quart 4 23 na 7.4 23 na 7.4 10 nd 24
TABLE-US-00116 Thrombopoietin 0 hr prior to AKI stage 24 hr prior to AKI stage 48 hr prior to AKI stage Cohort 1 Cohort 2 Cohort 1 Cohort 2 Cohort 1 Cohort 2 sCr or UO Median 2.45 2.84 2.45 2.84 2.45 3.92 Average 2.56 3.02 2.56 2.85 2.56 3.55 Stdev 1.30 1.15 1.30 1.22 1.30 0.873 p (t-test) 0.19 0.40 0.037 Min 0.0323 1.18 0.0323 0.492 0.0323 2.16 Max 5.87 4.38 5.87 4.38 5.87 4.38 n (Samp) 110 16 110 16 110 8 n (Patient) 110 16 110 16 110 8 sCr only Median 2.57 2.61 2.57 2.61 nd nd Average 2.63 2.71 2.63 2.65 nd nd Stdev 1.27 1.11 1.27 1.20 nd nd p (t-test) 0.85 0.96 nd nd Min 0.0323 1.32 0.0323 0.836 nd nd Max 6.89 4.35 6.89 4.35 nd nd n (Samp) 180 8 180 8 nd nd n (Patient) 180 8 180 8 nd nd UO only Median 2.45 3.84 2.45 3.30 2.45 3.92 Average 2.52 3.37 2.52 3.16 2.52 3.55 Stdev 1.33 1.08 1.33 1.20 1.33 0.904 p (t-test) 0.054 0.15 0.065 Min 0.0323 1.18 0.0323 0.492 0.0323 2.16 Max 5.87 4.38 5.87 4.38 5.87 4.38 n (Samp) 91 10 91 10 91 6 n (Patient) 91 10 91 10 91 6 0 hr prior to AKI stage 24 hr prior to AKI stage 48 hr prior to AKI stage sCr or UO sCr only UO only sCr or UO sCr only UO only sCr or UO sCr only UO only AUC 0.61 0.52 0.70 0.58 0.51 0.66 0.74 nd 0.74 SE 0.079 0.11 0.096 0.079 0.11 0.098 0.10 nd 0.12 p 0.16 0.84 0.040 0.31 0.92 0.11 0.019 nd 0.041 nCohort 1 110 180 91 110 180 91 110 nd 91 nCohort 2 16 8 10 16 8 10 8 nd 6 Cutoff 1 2.15 2.15 2.87 2.15 2.15 2.87 2.72 nd 2.69 Sens 1 81% 75% 70% 81% 75% 70% 75% nd 83% Spec 1 42% 39% 62% 42% 39% 62% 58% nd 56% Cutoff 2 2.15 1.50 2.69 2.15 1.50 2.69 2.69 nd 2.69 Sens 2 81% 88% 80% 81% 88% 80% 88% nd 83% Spec 2 42% 22% 56% 42% 22% 56% 57% nd 56% Cutoff 3 1.18 1.18 2.14 0.563 0.709 2.14 2.15 nd 2.14 Sens 3 94% 100% 90% 94% 100% 90% 100% nd 100% Spec 3 16% 14% 43% 6% 6% 43% 42% nd 43% Cutoff 4 3.15 3.16 3.15 3.15 3.16 3.15 3.15 nd 3.15 Sens 4 44% 25% 60% 38% 25% 50% 62% nd 67% Spec 4 73% 70% 74% 73% 70% 74% 73% nd 74% Cutoff 5 3.58 3.54 3.58 3.58 3.54 3.58 3.58 nd 3.58 Sens 5 44% 25% 60% 38% 25% 50% 62% nd 67% Spec 5 80% 80% 80% 80% 80% 80% 80% nd 80% Cutoff 6 4.34 4.20 4.34 4.34 4.20 4.34 4.34 nd 4.34 Sens 6 12% 12% 10% 12% 12% 10% 25% nd 17% Spec 6 91% 90% 90% 91% 90% 90% 91% nd 90% OR Quart 2 0.97 1.0 1.0 0.97 1.0 1.0 >1.0 nd >1.0 p Value 0.97 1.0 1.0 0.97 1.0 1.0 <1.0 nd <0.98 95% CI of 0.18 0.13 0.059 0.18 0.13 0.059 >0.060 nd >0.062 OR Quart 2 5.2 7.4 17 5.2 7.4 17 na nd na OR Quart 3 1.0 1.0 2.1 1.4 1.0 3.3 >2.1 nd >1.0 p Value 1.0 1.0 0.56 0.69 1.0 0.32 <0.54 nd <0.98 95% CI of 0.19 0.13 0.18 0.28 0.13 0.32 >0.18 nd >0.062 OR Quart 3 5.4 7.4 25 6.8 7.4 34 na nd na OR Quart 4 2.6 1.0 7.2 2.2 1.0 5.7 >5.8 nd >4.6 p Value 0.20 1.0 0.078 0.31 1.0 0.12 <0.12 nd <0.19 95% CI of 0.61 0.13 0.80 0.49 0.13 0.62 >0.63 nd >0.47 OR Quart 4 11 7.4 65 9.5 7.4 53 na nd na
[0165] FIG. 9: Comparison of marker levels in urine samples collected from Cohort 1 (patients that did not progress beyond RIFLE stage 0, R, or I) and in urine samples collected from Cohort 2 (subjects who progress to RIFLE stage F) at 0, 24 hours, and 48 hours prior to the subject reaching RIFLE stage I.
TABLE-US-00117 Alpha-2 macroglobulin 0 hr prior to AKI stage 24 hr prior to AKI stage 48 hr prior to AKI stage Cohort 1 Cohort 2 Cohort 1 Cohort 2 Cohort 1 Cohort 2 sCr or UO Median 0.354 1.27 0.354 1.27 0.354 0.601 Average 3.44 10.7 3.44 40.4 3.44 0.697 Stdev 24.3 31.3 24.3 96.7 24.3 0.509 p (t-test) 0.29 7.3E-8 0.77 Min 1.00E-9 0.0346 1.00E-9 1.00E-9 1.00E-9 0.198 Max 510 115 510 368 510 1.60 n (Samp) 927 13 927 16 927 7 n (Patient) 344 13 344 16 344 7 sCr only Median 0.369 1.69 nd nd nd nd Average 4.37 20.7 nd nd nd nd Stdev 28.1 42.0 nd nd nd nd p (t-test) 0.13 nd nd nd nd Min 1.00E-9 0.0346 nd nd nd nd Max 510 115 nd nd nd nd n (Samp) 964 7 nd nd nd nd n (Patient) 354 7 nd nd nd nd UO only Median 0.370 1.13 0.370 2.25 nd nd Average 2.58 16.2 2.58 46.0 nd nd Stdev 15.1 39.8 15.1 103 nd nd p (t-test) 0.014 1.9E-15 nd nd Min 1.00E-9 0.130 1.00E-9 1.00E-9 nd nd Max 235 115 235 368 nd nd n (Samp) 795 8 795 14 nd nd n (Patient) 263 8 263 14 nd nd 0 hr prior to AKI stage 24 hr prior to AKI stage 48 hr prior to AKI stage sCr or UO sCr only UO only sCr or UO sCr only UO only sCr or UO sCr only UO only AUC 0.69 0.77 0.68 0.74 nd 0.73 0.59 nd nd SE 0.082 0.10 0.11 0.072 nd 0.077 0.11 nd nd p 0.020 0.0096 0.082 7.5E-4 nd 0.0028 0.42 nd nd nCohort 1 927 964 795 927 nd 795 927 nd nd nCohort 2 13 7 8 16 nd 14 7 nd nd Cutoff 1 0.406 1.34 0.405 0.540 nd 0.539 0.448 nd nd Sens 1 77% 71% 75% 75% nd 71% 71% nd nd Spec 1 54% 79% 52% 61% nd 58% 56% nd nd Cutoff 2 0.213 1.27 0.213 0.525 nd 0.284 0.211 nd nd Sens 2 85% 86% 88% 81% nd 86% 86% nd nd Spec 2 35% 78% 35% 60% nd 44% 35% nd nd Cutoff 3 0.129 0.0328 0.129 0.204 nd 0.204 0.196 nd nd Sens 3 92% 100% 100% 94% nd 93% 100% nd nd Spec 3 23% 12% 22% 34% nd 33% 32% nd nd Cutoff 4 0.776 0.831 0.839 0.776 nd 0.839 0.776 nd nd Sens 4 69% 86% 62% 69% nd 64% 29% nd nd Spec 4 70% 70% 70% 70% nd 70% 70% nd nd Cutoff 5 1.32 1.43 1.36 1.32 nd 1.36 1.32 nd nd Sens 5 46% 57% 38% 50% nd 50% 14% nd nd Spec 5 80% 80% 80% 80% nd 80% 80% nd nd Cutoff 6 3.24 3.71 3.24 3.24 nd 3.24 3.24 nd nd Sens 6 23% 43% 25% 38% nd 43% 0% nd nd Spec 6 90% 90% 90% 90% nd 90% 90% nd nd OR Quart 2 0.50 0 1.00 2.0 nd 2.0 >2.0 nd nd p Value 0.57 na 1.00 0.57 nd 0.57 <0.57 nd nd 95% CI of 0.045 na 0.062 0.18 nd 0.18 >0.18 nd nd OR Quart 2 5.5 na 16 22 nd 22 na nd nd OR Quart 3 1.0 0 2.0 3.0 nd 3.0 >3.0 nd nd p Value 1.0 na 0.57 0.34 nd 0.34 <0.34 nd nd 95% CI of 0.14 na 0.18 0.31 nd 0.31 >0.31 nd nd OR Quart 3 7.2 na 22 29 nd 29 na nd nd OR Quart 4 4.1 6.1 4.0 10 nd 8.2 >2.0 nd nd p Value 0.076 0.095 0.21 0.026 nd 0.048 <0.57 nd nd 95% CI of 0.86 0.73 0.45 1.3 nd 1.0 >0.18 nd nd OR Quart 4 20 51 36 82 nd 67 na nd nd
TABLE-US-00118 Apolipoprotein B-100 0 hr prior to AKI stage 24 hr prior to AKI stage 48 hr prior to AKI stage Cohort 1 Cohort 2 Cohort 1 Cohort 2 Cohort 1 Cohort 2 sCr or UO Median 71.9 192 71.9 355 71.9 44.5 Average 239 317 239 628 239 69.5 Stdev 482 388 482 729 482 71.3 p (t-test) 0.56 0.0016 0.35 Min 1.00E-9 2.43 1.00E-9 1.00E-9 1.00E-9 14.5 Max 7440 1230 7440 2780 7440 202 n (Samp) 937 13 937 16 937 7 n (Patient) 344 13 344 16 344 7 sCr only Median 73.6 289 nd nd nd nd Average 261 402 nd nd nd nd Stdev 579 427 nd nd nd nd p (t-test) 0.52 nd nd nd nd Min 1.00E-9 2.43 nd nd nd nd Max 8120 1230 nd nd nd nd n (Samp) 974 7 nd nd nd nd n (Patient) 354 7 nd nd nd nd UO only Median 76.6 138 76.6 493 nd nd Average 244 355 244 698 nd nd Stdev 490 491 490 756 nd nd p (t-test) 0.52 6.9E-4 nd nd Min 1.00E-9 23.9 1.00E-9 1.00E-9 nd nd Max 7440 1230 7440 2780 nd nd n (Samp) 804 8 804 14 nd nd n (Patient) 263 8 263 14 nd nd 0 hr prior to AKI stage 24 hr prior to AKI stage 48 hr prior to AKI stage sCr or UO sCr only UO only sCr or UO sCr only UO only sCr or UO sCr only UO only AUC 0.63 0.66 0.60 0.70 nd 0.71 0.42 nd nd SE 0.084 0.11 0.11 0.074 nd 0.079 0.11 nd nd p 0.13 0.17 0.34 0.0063 nd 0.0086 0.47 nd nd nCohort 1 937 974 804 937 nd 804 937 nd nd nCohort 2 13 7 8 16 nd 14 7 nd nd Cutoff 1 38.4 257 38.4 157 nd 257 30.4 nd nd Sens 1 77% 71% 75% 75% nd 71% 71% nd nd Spec 1 36% 76% 35% 67% nd 76% 33% nd nd Cutoff 2 30.4 30.5 30.4 114 nd 5.62 15.4 nd nd Sens 2 85% 86% 88% 81% nd 86% 86% nd nd Spec 2 33% 33% 32% 62% nd 11% 22% nd nd Cutoff 3 23.7 2.42 23.7 1.90 nd 1.74 14.4 nd nd Sens 3 92% 100% 100% 94% nd 93% 100% nd nd Spec 3 29% 7% 28% 7% nd 6% 21% nd nd Cutoff 4 179 188 190 179 nd 190 179 nd nd Sens 4 62% 71% 38% 69% nd 79% 14% nd nd Spec 4 70% 70% 70% 70% nd 70% 70% nd nd Cutoff 5 320 332 329 320 nd 329 320 nd nd Sens 5 31% 29% 25% 50% nd 57% 0% nd nd Spec 5 80% 80% 80% 80% nd 80% 80% nd nd Cutoff 6 645 689 642 645 nd 642 645 nd nd Sens 6 15% 14% 25% 31% nd 36% 0% nd nd Spec 6 90% 90% 90% 90% nd 90% 90% nd nd OR Quart 2 3.0 1.0 >3.0 0 nd 0 >2.0 nd nd p Value 0.34 1.0 <0.34 na nd na <0.57 nd nd 95% CI of 0.31 0.062 >0.31 na nd na >0.18 nd nd OR Quart 2 29 16 na na nd na na nd nd OR Quart 3 3.0 0 >3.0 1.0 nd 0.33 >3.0 nd nd p Value 0.34 na <0.34 1.0 nd 0.34 <0.34 nd nd 95% CI of 0.31 na >0.31 0.20 nd 0.034 >0.31 nd nd OR Quart 3 29 na na 5.0 nd 3.2 na nd nd OR Quart 4 6.1 5.1 >2.0 3.4 nd 3.4 >2.0 nd nd p Value 0.095 0.14 <0.57 0.064 nd 0.064 <0.57 nd nd 95% CI of 0.73 0.59 >0.18 0.93 nd 0.93 >0.18 nd nd OR Quart 4 51 44 na 13 nd 13 na nd nd
TABLE-US-00119 Calcitonin 0 hr prior to AKI stage 24 hr prior to AKI stage 48 hr prior to AKI stage sCr or UO Cohort 1 Cohort 2 Cohort 1 Cohort 2 Cohort 1 Cohort 2 Median 87.9 87.3 87.9 131 nd nd Average 463 140 463 580 nd nd Stdev 3170 204 3170 1310 nd nd p(t-test) 0.75 0.90 nd nd Min 1.48 4.07 1.48 5.40 nd nd Max 38800 685 38800 4480 nd nd n (Samp) 534 10 534 11 nd nd n (Patient) 204 10 204 11 nd nd 0 hr prior to AKI stage 24 hr prior to AKI stage 48 hr prior to AKI stage UO only Cohort 1 Cohort 2 Cohort 1 Cohort 2 Cohort 1 Cohort 2 Median 89.2 49.9 89.2 63.2 nd nd Average 508 75.8 508 140 nd nd Stdev 3430 79.2 3430 199 nd nd p(t-test) 0.74 0.76 nd nd Min 2.78 6.13 2.78 5.40 nd nd Max 38800 239 38800 600 nd nd n (Samp) 454 7 454 8 nd nd n (Patient) 168 7 168 8 nd nd 0 hr prior to AKI stage 24 hr prior to AKI stage 48 hr prior to AKI stage sCr or UO sCr only UO only sCr or UO sCr only UO only sCr or UO sCr only UO only AUC 0.44 nd 0.35 0.54 nd 0.42 nd nd nd SE 0.095 nd 0.11 0.090 nd 0.11 nd nd nd p 0.51 nd 0.18 0.63 nd 0.44 nd nd nd nCohort 1 534 nd 454 534 nd 454 nd nd nd nCohort 2 10 nd 7 11 nd 8 nd nd nd Cutoff 1 48.8 nd 48.8 55.6 nd 18.4 nd nd nd Sens 1 70% nd 71% 73% nd 75% nd nd nd Spec 1 28% nd 26% 32% nd 8% nd nd nd Cutoff 2 11.0 nd 11.0 19.0 nd 18.3 nd nd nd Sens 2 80% nd 86% 82% nd 88% nd nd nd Spec 2 4% nd 4% 9% nd 8% nd nd nd Cutoff 3 6.00 nd 6.00 18.3 nd 4.98 nd nd nd Sens 3 90% nd 100% 91% nd 100% nd nd nd Spec 3 2% nd 2% 8% nd 2% nd nd nd Cutoff 4 141 nd 141 141 nd 141 nd nd nd Sens 4 20% nd 14% 36% nd 25% nd nd nd Spec 4 70% nd 70% 70% nd 70% nd nd nd Cutoff 5 191 nd 186 191 nd 186 nd nd nd Sens 5 20% nd 14% 36% nd 25% nd nd nd Spec 5 80% nd 80% 80% nd 80% nd nd nd Cutoff 6 326 nd 326 326 nd 326 nd nd nd Sens 6 10% nd 0% 27% nd 12% nd nd nd Spec 6 90% nd 90% 90% nd 90% nd nd nd OR Quart 2 1.5 nd 1.0 0.66 nd 0.50 nd nd nd p Value 0.65 nd 1.00 0.65 nd 0.57 nd nd nd 95% CI of 0.25 nd 0.062 0.11 nd 0.045 nd nd nd OR Quart2 9.2 nd 16 4.0 nd 5.6 nd nd nd OR Quart 3 1.0 nd 3.1 0.66 nd 1.0 nd nd nd p Value 1.0 nd 0.33 0.65 nd 1.0 nd nd nd 95% CI of 0.14 nd 0.32 0.11 nd 0.14 nd nd nd OR Quart3 7.2 nd 30 4.0 nd 7.2 nd nd nd OR Quart 4 1.5 nd 2.0 1.3 nd 1.5 nd nd nd p Value 0.65 nd 0.56 0.71 nd 0.65 nd nd nd 95% CI of 0.25 nd 0.18 0.29 nd 0.25 nd nd nd OR Quart4 9.2 nd 23 6.1 nd 9.3 nd nd nd
TABLE-US-00120 C-reactive protein 0 hr prior to AKI stage 24 hr prior to AKI stage 48 hr prior to AKI stage sCr or UO Cohort 1 Cohort 2 Cohort 1 Cohort 2 Cohort 1 Cohort 2 Median 10.2 30.4 10.2 30.4 10.2 4.85 Average 19.6 39.0 19.6 28.9 19.6 21.4 Stdev 24.4 42.6 24.4 22.0 24.4 24.4 p(t-test) 0.0051 0.13 0.85 Min 1.00E-9 0.0108 1.00E-9 0.0366 1.00E-9 0.636 Max 259 141 259 56.8 259 57.6 n (Samp) 928 13 928 16 928 7 n (Patient) 344 13 344 16 344 7 0 hr prior to AKI stage 24 hr prior to AKI stage 48 hr prior to AKI stage sCr only Cohort 1 Cohort 2 Cohort 1 Cohort 2 Cohort 1 Cohort 2 Median 10.5 30.4 nd nd nd nd Average 20.0 40.4 nd nd nd nd Stdev 24.5 46.4 nd nd nd nd p(t-test) 0.030 nd nd nd nd Min 1.00E-9 0.0108 nd nd nd nd Max 259 141 nd nd nd nd n (Samp) 965 7 nd nd nd nd n (Patient) 354 7 nd nd nd nd 0 hr prior to AKI stage 24 hr prior to AKI stage 48 hr prior to AKI stage UO only Cohort 1 Cohort 2 Cohort 1 Cohort 2 Cohort 1 Cohort 2 Median 11.7 30.4 11.7 30.4 nd nd Average 20.3 46.2 20.3 30.9 nd nd Stdev 24.4 51.6 24.4 22.1 nd nd p(t-test) 0.0033 0.11 nd nd Min 1.00E-9 0.410 1.00E-9 0.0366 nd nd Max 259 141 259 56.8 nd nd n (Samp) 796 8 796 14 nd nd n (Patient) 263 8 263 14 nd nd 0 hr prior to AKI stage 24 hr prior to AKI stage 48 hr prior to AKI stage sCr or UO sCr only UO only sCr or UO sCr only UO only sCr or UO sCr only UO only AUC 0.63 0.65 0.64 0.61 nd 0.63 0.53 nd nd SE 0.084 0.11 0.11 0.076 nd 0.081 0.11 nd nd p 0.12 0.20 0.20 0.16 nd 0.10 0.78 nd nd nCohort 1 928 965 796 928 nd 796 928 nd nd nCohort 2 13 7 8 16 nd 14 7 nd nd Cutoff 1 5.99 30.1 5.99 2.40 nd 30.1 2.73 nd nd Sens 1 77% 71% 75% 75% nd 71% 71% nd nd Spec 1 42% 67% 40% 29% nd 67% 31% nd nd Cutoff 2 1.34 9.72 1.34 0.734 nd 0.731 1.07 nd nd Sens 2 85% 86% 88% 81% nd 86% 86% nd nd Spec 2 23% 49% 22% 18% nd 17% 21% nd nd Cutoff 3 0.401 0.0106 0.401 0.0435 nd 0.186 0.623 nd nd Sens 3 92% 100% 100% 94% nd 93% 100% nd nd Spec 3 13% 2% 12% 5% nd 9% 16% nd nd Cutoff 4 30.4 30.4 30.4 30.4 nd 30.4 30.4 nd nd Sens 4 38% 29% 38% 38% nd 43% 43% nd nd Spec 4 79% 78% 78% 79% nd 78% 79% nd nd Cutoff 5 32.9 33.5 33.5 32.9 nd 33.5 32.9 nd nd Sens 5 38% 29% 38% 38% nd 43% 43% nd nd Spec 5 80% 80% 80% 80% nd 80% 80% nd nd Cutoff 6 54.7 56.0 55.5 54.7 nd 55.5 54.7 nd nd Sens 6 31% 14% 38% 19% nd 21% 14% nd nd Spec 6 90% 94% 90% 90% nd 90% 90% nd nd OR Quart 2 0.66 1.0 0.50 0.25 nd 0.33 1.00 nd nd p Value 0.66 1.0 0.57 0.21 nd 0.34 1.00 nd nd 0 hr prior to AKI stage 24 hr prior to AKI stage 48 hr prior to AKI stage sCr or UO sCr only UO only sCr or UO sCr only UO only sCr or UO sCr only UO only 95% CI of 0.11 0.062 0.045 0.027 nd 0.034 0.14 nd nd OR Quart2 4.0 16 5.5 2.2 nd 3.2 7.1 nd nd OR Quart 3 0.33 3.0 1.0 1.3 nd 1.3 0 nd nd p Value 0.34 0.34 1.0 0.74 nd 0.70 na nd nd 95% CI of 0.034 0.31 0.14 0.33 nd 0.30 na nd nd OR Quart3 3.2 29 7.2 4.7 nd 6.1 na nd nd OR Quart 4 2.4 2.0 1.5 1.5 nd 2.0 1.5 nd nd p Value 0.22 0.57 0.65 0.53 nd 0.32 0.66 nd nd 95% CI of 0.60 0.18 0.25 0.42 nd 0.50 0.25 nd nd OR Quart4 9.3 22 9.1 5.4 nd 8.2 9.1 nd nd
TABLE-US-00121 Tissue factor 0 hr prior to AKI stage 24 hr prior to AKI stage 48 hr prior to AKI stage sCr or UO Cohort 1 Cohort 2 Cohort 1 Cohort 2 Cohort 1 Cohort 2 Median 0.00336 0.00336 0.00336 0.00336 nd nd Average 0.0814 0.115 0.0814 0.159 nd nd Stdev 0.147 0.353 0.147 0.240 nd nd p(t-test) 0.49 0.090 nd nd Min 0.00336 0.00336 0.00336 0.00336 nd nd Max 1.16 1.12 1.16 0.787 nd nd n (Samp) 534 10 534 11 nd nd n (Patient) 204 10 204 11 nd nd 0 hr prior to AKI stage 24 hr prior to AKI stage 48 hr prior to AKI stage UO only Cohort 1 Cohort 2 Cohort 1 Cohort 2 Cohort 1 Cohort 2 Median 0.00336 0.00336 0.00336 0.00336 nd nd Average 0.0798 0.00336 0.0798 0.146 nd nd Stdev 0.142 0 0.142 0.271 nd nd p(t-test) 0.15 0.20 nd nd Min 0.00336 0.00336 0.00336 0.00336 nd nd Max 0.917 0.00336 0.917 0.787 nd nd n (Samp) 454 7 454 8 nd nd n (Patient) 168 7 168 8 nd nd 0 hr prior to AKI stage 24 hr prior to AKI stage 48 hr prior to AKI stage sCr or UO sCr only UO only sCr or UO sCr only UO only sCr or UO sCr only UO only AUC 0.40 nd 0.33 0.59 nd 0.54 nd nd nd SE 0.096 nd 0.11 0.091 nd 0.11 nd nd nd p 0.30 nd 0.14 0.31 nd 0.69 nd nd nd nCohort 1 534 nd 454 534 nd 454 nd nd nd nCohort 2 10 nd 7 11 nd 8 nd nd nd Cutoff 1 0 nd 0 0 nd 0 nd nd nd Sens 1 100% nd 100% 100% nd 100% nd nd nd Spec 1 0% nd 0% 0% nd 0% nd nd nd Cutoff 2 0 nd 0 0 nd 0 nd nd nd Sens 2 100% nd 100% 100% nd 100% nd nd nd Spec 2 0% nd 0% 0% nd 0% nd nd nd Cutoff 3 0 nd 0 0 nd 0 nd nd nd Sens 3 100% nd 100% 100% nd 100% nd nd nd Spec 3 0% nd 0% 0% nd 0% nd nd nd Cutoff 4 0.120 nd 0.119 0.120 nd 0.119 nd nd nd Sens 4 10% nd 0% 45% nd 38% nd nd nd Spec 4 71% nd 70% 71% nd 70% nd nd nd Cutoff 5 0.164 nd 0.160 0.164 nd 0.160 nd nd nd Sens 5 10% nd 0% 45% nd 38% nd nd nd Spec 5 80% nd 80% 80% nd 80% nd nd nd Cutoff 6 0.240 nd 0.240 0.240 nd 0.240 nd nd nd Sens 6 10% nd 0% 27% nd 12% nd nd nd Spec 6 90% nd 90% 90% nd 90% nd nd nd OR Quart 2 0 nd >0 >6.3 nd >5.2 nd nd nd p Value na nd <na <0.091 nd <0.14 nd nd nd 95% CI of na nd >na >0.75 nd >0.60 nd nd nd OR Quart2 na nd na na nd na nd nd nd OR Quart 3 8.4 nd >7.5 >0 nd >0 nd nd nd p Value 0.046 nd <0.061 <na nd <na nd nd nd 95% CI of 1.0 nd >0.91 >na nd >na nd nd nd OR Quart3 68 nd na na nd na nd nd nd OR Quart 4 1.0 nd >0 >5.2 nd >3.1 nd nd nd p Value 1.0 nd <na <0.14 nd <0.34 nd nd nd 95% CI of 0.062 nd >na >0.59 nd >0.31 nd nd nd OR Quart4 16 nd na na nd na nd nd nd
TABLE-US-00122 Fibrinogen 0 hr prior to AKI stage 24 hr prior to AKI stage 48 hr prior to AKI stage sCr or UO Cohort 1 Cohort 2 Cohort 1 Cohort 2 Cohort 1 Cohort 2 Median 0.102 0.250 0.102 0.394 0.102 0.0178 Average 30.2 58.6 30.2 15.8 30.2 0.0944 Stdev 631 209 631 54.6 631 0.120 p(t-test) 0.87 0.93 0.90 Min 1.00E-9 1.00E-9 1.00E-9 1.00E-9 1.00E-9 1.00E-9 Max 13600 754 13600 219 13600 0.299 n (Samp) 928 13 928 16 928 7 n (Patient) 344 13 344 16 344 7 0 hr prior to AKI stage 24 hr prior to AKI stage 48 hr prior to AKI stage sCr only Cohort 1 Cohort 2 Cohort 1 Cohort 2 Cohort 1 Cohort 2 Median 0.103 0.250 nd nd nd nd Average 29.4 109 nd nd nd nd Stdev 619 285 nd nd nd nd p(t-test) 0.74 nd nd nd nd Min 1.00E-9 1.00E-9 nd nd nd nd Max 13600 754 nd nd nd nd n (Samp) 965 7 nd nd nd nd n (Patient) 354 7 nd nd nd nd 0 hr prior to AKI stage 24 hr prior to AKI stage 48 hr prior to AKI stage UO only Cohort 1 Cohort 2 Cohort 1 Cohort 2 Cohort 1 Cohort 2 Median 0.107 0.276 0.107 0.394 nd nd Average 18.1 94.6 18.1 18.0 nd nd Stdev 482 267 482 58.3 nd nd p(t-test) 0.65 1.00 nd nd Min 1.00E-9 1.00E-9 1.00E-9 1.00E-9 nd nd Max 13600 754 13600 219 nd nd n (Samp) 796 8 796 14 nd nd n (Patient) 263 8 263 14 nd nd 0 hr prior to AKI stage 24 hr prior to AKI stage 48 hr prior to AKI stage sCr or UO sCr only UO only sCr or UO sCr only UO only sCr or UO sCr only UO only AUC 0.49 0.53 0.47 0.63 nd 0.65 0.35 nd nd SE 0.081 0.11 0.10 0.076 nd 0.081 0.11 nd nd p 0.91 0.78 0.80 0.080 nd 0.071 0.19 nd nd nCohort 1 928 965 796 928 nd 796 928 nd nd nCohort 2 13 7 8 16 nd 14 7 nd nd Cutoff 1 0 0 0 0.0734 nd 0.193 0 nd nd Sens 1 100% 100% 100% 75% nd 71% 100% nd nd Spec 1 0% 0% 0% 45% nd 62% 0% nd nd Cutoff 2 0 0 0 0 nd 0 0 nd nd Sens 2 100% 100% 100% 100% nd 100% 100% nd nd Spec 2 0% 0% 0% 0% nd 0% 0% nd nd Cutoff 3 0 0 0 0 nd 0 0 nd nd Sens 3 100% 100% 100% 100% nd 100% 100% nd nd Spec 3 0% 0% 0% 0% nd 0% 0% nd nd Cutoff 4 0.291 0.302 0.322 0.291 nd 0.322 0.291 nd nd Sens 4 46% 43% 50% 56% nd 57% 14% nd nd Spec 4 70% 70% 70% 70% nd 70% 70% nd nd Cutoff 5 0.533 0.558 0.591 0.533 nd 0.591 0.533 nd nd Sens 5 38% 29% 25% 44% nd 43% 0% nd nd Spec 5 80% 80% 80% 80% nd 80% 80% nd nd Cutoff 6 1.49 1.63 1.77 1.49 nd 1.77 1.49 nd nd Sens 6 15% 29% 12% 25% nd 21% 0% nd nd Spec 6 90% 90% 90% 90% nd 90% 90% nd nd OR Quart 2 0.40 0 0 0.25 nd 0.33 >3.0 nd nd p Value 0.27 na na 0.21 nd 0.34 <0.34 nd nd 95% CI of 0.076 na na 0.027 nd 0.034 >0.31 nd nd OR Quart2 2.1 na na 2.2 nd 3.2 na nd nd OR Quart 3 0 0.33 0 0.75 nd 1.0 >1.0 nd nd p Value na 0.34 na 0.70 nd 1.0 <1.00 nd nd 95% CI of na 0.034 na 0.17 nd 0.20 >0.062 nd nd OR Quart3 na 3.2 na 3.4 nd 5.0 na nd nd OR Quart 4 1.2 1.0 1.0 2.0 nd 2.4 >3.1 nd nd p Value 0.76 1.0 1.0 0.25 nd 0.22 <0.34 nd nd 95% CI of 0.36 0.20 0.25 0.60 nd 0.60 >0.32 nd nd OR Quart4 4.0 5.0 4.1 6.9 nd 9.3 na nd nd
TABLE-US-00123 Intercellular adhesion molecule 3 0 hr prior to AKI stage 24 hr prior to AKI stage 48 hr prior to AKI stage sCr or UO Cohort 1 Cohort 2 Cohort 1 Cohort 2 Cohort 1 Cohort 2 Median 0.00886 0.00895 0.00886 0.0216 nd nd Average 0.0134 0.0113 0.0134 0.168 nd nd Stdev 0.0199 0.00850 0.0199 0.476 nd nd p(t-test) 0.78 3.8E-9 nd nd Min 1.00E-9 1.00E-9 1.00E-9 0.00111 nd nd Max 0.255 0.0249 0.255 1.52 nd nd n (Samp) 334 7 334 10 nd nd n (Patient) 191 7 191 10 nd nd 0 hr prior to AKI stage 24 hr prior to AKI stage 48 hr prior to AKI stage UO only Cohort 1 Cohort 2 Cohort 1 Cohort 2 Cohort 1 Cohort 2 Median nd nd 0.00885 0.0269 nd nd Average nd nd 0.0132 0.209 nd nd Stdev nd nd 0.0200 0.530 nd nd p(t-test) nd nd 2.5E-10 nd nd Min nd nd 1.00E-9 0.00543 nd nd Max nd nd 0.255 1.52 nd nd n (Samp) nd nd 293 8 nd nd n (Patient) nd nd 161 8 nd nd 0 hr prior to AKI stage 24 hr prior to AKI stage 48 hr prior to AKI stage sCr or UO sCr only UO only sCr or UO sCr only UO only sCr or UO sCr only UO only AUC 0.52 nd nd 0.68 nd 0.79 nd nd nd SE 0.11 nd nd 0.095 nd 0.097 nd nd nd p 0.87 nd nd 0.054 nd 0.0031 nd nd nd nCohort 1 334 nd nd 334 nd 293 nd nd nd nCohort 2 7 nd nd 10 nd 8 nd nd nd Cutoff 1 0.00759 nd nd 0.0114 nd 0.0170 nd nd nd Sens 1 71% nd nd 70% nd 75% nd nd nd Spec 1 44% nd nd 59% nd 72% nd nd nd Cutoff 2 0.00457 nd nd 0.00542 nd 0.0114 nd nd nd Sens 2 86% nd nd 80% nd 88% nd nd nd Spec 2 34% nd nd 36% nd 60% nd nd nd Cutoff 3 0 nd nd 0.00485 nd 0.00542 nd nd nd Sens 3 100% nd nd 90% nd 100% nd nd nd Spec 3 0% nd nd 35% nd 37% nd nd nd Cutoff 4 0.0163 nd nd 0.0163 nd 0.0158 nd nd nd Sens 4 29% nd nd 60% nd 75% nd nd nd Spec 4 70% nd nd 70% nd 70% nd nd nd Cutoff 5 0.0210 nd nd 0.0210 nd 0.0209 nd nd nd Sens 5 14% nd nd 50% nd 62% nd nd nd Spec 5 80% nd nd 80% nd 81% nd nd nd Cutoff 6 0.0291 nd nd 0.0291 nd 0.0291 nd nd nd Sens 6 0% nd nd 30% nd 38% nd nd nd Spec 6 90% nd nd 90% nd 90% nd nd nd 0 hr prior to AKI stage 24 hr prior to AKI stage 48 hr prior to AKI stage sCr or UO sCr only UO only sCr or UO sCr only UO only sCr or UO sCr only UO only OR Quart 2 2.0 nd nd 2.0 nd >1.0 nd nd nd p Value 0.57 nd nd 0.57 nd <0.99 nd nd nd 95% CI of 0.18 nd nd 0.18 nd >0.062 nd nd nd OR Quart2 23 nd nd 23 nd na nd nd nd OR Quart 3 3.1 nd nd 2.0 nd >2.1 nd nd nd p Value 0.34 nd nd 0.57 nd <0.56 nd nd nd 95% CI of 0.31 nd nd 0.18 nd >0.18 nd nd nd OR Quart3 30 nd nd 23 nd na nd nd nd OR Quart 4 0.99 nd nd 5.2 nd >5.3 nd nd nd p Value 0.99 nd nd 0.13 nd <0.13 nd nd nd 95% CI of 0.061 nd nd 0.60 nd >0.60 nd nd nd OR Quart4 16 nd nd 46 nd na nd nd nd
TABLE-US-00124 Interleukin-5 0 hr prior to AKI stage 24 hr prior to AKI stage 48 hr prior to AKI stage sCr or UO Cohort 1 Cohort 2 Cohort 1 Cohort 2 Cohort 1 Cohort 2 Median 0.0823 1.00E-9 0.0823 0.0261 0.0823 0.0926 Average 0.714 0.148 0.714 0.0617 0.714 0.167 Stdev 4.66 0.332 4.66 0.0869 4.66 0.205 p(t-test) 0.66 0.58 0.76 Min 1.00E-9 1.00E-9 1.00E-9 1.00E-9 1.00E-9 1.00E-9 Max 83.3 1.21 83.3 0.318 83.3 0.535 n (Samp) 938 13 938 16 938 7 n (Patient) 345 13 345 16 345 7 0 hr prior to AKI stage 24 hr prior to AKI stage 48 hr prior to AKI stage sCr only Cohort 1 Cohort 2 Cohort 1 Cohort 2 Cohort 1 Cohort 2 Median 0.0817 1.00E-9 nd nd nd nd Average 0.696 0.0469 nd nd nd nd Stdev 4.57 0.102 nd nd nd nd p(t-test) 0.71 nd nd nd nd Min 1.00E-9 1.00E-9 nd nd nd nd Max 83.3 0.273 nd nd nd nd n (Samp) 975 7 nd nd nd nd n (Patient) 355 7 nd nd nd nd 0 hr prior to AKI stage 24 hr prior to AKI stage 48 hr prior to AKI stage UO only Cohort 1 Cohort 2 Cohort 1 Cohort 2 Cohort 1 Cohort 2 Median 0.0853 0.0824 0.0853 0.0447 nd nd Average 0.795 0.230 0.795 0.0697 nd nd Stdev 5.02 0.410 5.02 0.0903 nd nd p(t-test) 0.75 0.59 nd nd Min 1.00E-9 1.00E-9 1.00E-9 1.00E-9 nd nd Max 83.3 1.21 83.3 0.318 nd nd n (Samp) 805 8 805 14 nd nd n (Patient) 264 8 264 14 nd nd 0 hr prior to AKI stage 24 hr prior to AKI stage 48 hr prior to AKI stage sCr or UO sCr only UO only sCr or UO sCr only UO only sCr or UO sCr only UO only AUC 0.34 0.24 0.43 0.35 nd 0.37 0.46 nd nd SE 0.083 0.11 0.11 0.075 nd 0.081 0.11 nd nd P 0.052 0.015 0.52 0.042 nd 0.095 0.74 nd nd nCohort 1 938 975 805 938 nd 805 938 nd nd nCohort 2 13 7 8 16 nd 14 7 nd nd Cutoff 1 0 0 0 1.00E-9 nd 0.00264 0 nd nd Sens 1 100% 100% 100% 75% nd 71% 100% nd nd Spec 1 0% 0% 0% 20% nd 21% 0% nd nd Cutoff 2 0 0 0 0 nd 0 0 nd nd Sens 2 100% 100% 100% 100% nd 100% 100% nd nd Spec 2 0% 0% 0% 0% nd 0% 0% nd nd Cutoff 3 0 0 0 0 nd 0 0 nd nd Sens 3 100% 100% 100% 100% nd 100% 100% nd nd Spec 3 0% 0% 0% 0% nd 0% 0% nd nd Cutoff 4 0.169 0.165 0.190 0.169 nd 0.190 0.169 nd nd Sens 4 23% 14% 38% 12% nd 7% 43% nd nd Spec 4 70% 70% 70% 70% nd 70% 70% nd nd Cutoff 5 0.341 0.325 0.369 0.341 nd 0.369 0.341 nd nd Sens 5 8% 0% 12% 0% nd 0% 14% nd nd Spec 5 80% 80% 80% 80% nd 80% 80% nd nd Cutoff 6 0.986 0.980 1.14 0.986 nd 1.14 0.986 nd nd Sens 6 8% 0% 12% 0% nd 0% 0% nd nd Spec 6 90% 90% 90% 90% nd 90% 90% nd nd OR Quart 2 1.5 0 1.0 4.1 nd 4.1 0.33 nd nd p Value 0.66 na 1.00 0.21 nd 0.21 0.34 nd nd 95% CI of 0.25 na 0.14 0.45 nd 0.45 0.034 nd nd OR Quart2 9.1 na 7.2 37 nd 37 3.2 nd nd OR Quart 3 0 1.0 0 4.1 nd 3.0 0 nd nd p Value na 1.0 na 0.21 nd 0.34 na nd nd 95% CI of na 0.062 na 0.45 nd 0.31 na nd nd OR Quart3 na 16 na 37 nd 29 na nd nd OR Quart 4 4.1 5.1 2.0 7.2 nd 6.2 1.0 nd nd p Value 0.075 0.14 0.42 0.066 nd 0.093 1.00 nd nd 95% CI of 0.87 0.59 0.37 0.88 nd 0.74 0.20 nd nd OR Quart4 20 44 11 59 nd 52 5.0 nd nd
TABLE-US-00125 Thrombopoietin 0 hr prior to AKI stage 24 hr prior to AKI stage 48 hr prior to AKI stage sCr or UO Cohort 1 Cohort 2 Cohort 1 Cohort 2 Cohort 1 Cohort 2 Median 0.597 1.01 0.597 0.688 nd nd Average 0.635 0.892 0.635 0.750 nd nd Stdev 0.423 0.525 0.423 0.297 nd nd p(t-test) 0.059 0.37 nd nd Min 0.0129 0.0129 0.0129 0.280 nd nd Max 2.57 1.58 2.57 1.21 nd nd n (Samp) 534 10 534 11 nd nd n (Patient) 204 10 204 11 nd nd 0 hr prior to AKI stage 24 hr prior to AKI stage 48 hr prior to AKI stage UO only Cohort 1 Cohort 2 Cohort 1 Cohort 2 Cohort 1 Cohort 2 Median 0.613 0.857 0.613 0.614 nd nd Average 0.649 0.716 0.649 0.714 nd nd Stdev 0.425 0.555 0.425 0.329 nd nd p(t-test) 0.68 0.67 nd nd Min 0.0129 0.0129 0.0129 0.280 nd nd Max 2.57 1.58 2.57 1.21 nd nd n (Samp) 454 7 454 8 nd nd n (Patient) 168 7 168 8 nd nd 0 hr prior to AKI stage 24 hr prior to AKI stage 48 hr prior to AKI stage sCr or UO sCr only UO only sCr or UO sCr only UO only sCr or UO sCr only UO only AUC 0.68 nd 0.56 0.60 nd 0.56 nd nd nd SE 0.095 nd 0.11 0.091 nd 0.11 nd nd nd p 0.059 nd 0.61 0.26 nd 0.60 nd nd nd nCohort 1 534 nd 454 534 nd 454 nd nd nd nCohort 2 10 nd 7 11 nd 8 nd nd nd Cutoff 1 0.846 nd 0.683 0.540 nd 0.493 nd nd nd Sens 1 70% nd 71% 73% nd 75% nd nd nd Spec 1 73% nd 56% 43% nd 38% nd nd nd Cutoff 2 0.683 nd 0 0.493 nd 0.462 nd nd nd Sens 2 80% nd 100% 82% nd 88% nd nd nd Spec 2 58% nd 0% 39% nd 33% nd nd nd Cutoff 3 0 nd 0 0.462 nd 0.278 nd nd nd Sens 3 100% nd 100% 91% nd 100% nd nd nd Spec 3 0% nd 0% 34% nd 20% nd nd nd Cutoff 4 0.821 nd 0.821 0.821 nd 0.821 nd nd nd Sens 4 70% nd 57% 36% nd 38% nd nd nd Spec 4 71% nd 70% 71% nd 70% nd nd nd Cutoff 5 0.973 nd 0.979 0.973 nd 0.979 nd nd nd Sens 5 50% nd 14% 27% nd 25% nd nd nd Spec 5 80% nd 80% 80% nd 80% nd nd nd Cutoff 6 1.19 nd 1.24 1.19 nd 1.24 nd nd nd Sens 6 40% nd 14% 9% nd 0% nd nd nd Spec 6 90% nd 91% 90% nd 91% nd nd nd OR Quart 2 0 nd 0 3.0 nd 3.0 nd nd nd p Value na nd na 0.34 nd 0.34 nd nd nd 95% CI of na nd na 0.31 nd 0.31 nd nd nd OR Quart2 na nd na 30 nd 30 nd nd nd OR Quart 3 1.0 nd 1.0 3.0 nd 1.0 nd nd nd p Value 1.0 nd 1.0 0.34 nd 1.0 nd nd nd 95% CI of 0.14 nd 0.14 0.31 nd 0.062 nd nd nd OR Quart3 7.2 nd 7.2 30 nd 16 nd nd nd OR Quart 4 3.1 nd 1.5 4.1 nd 3.0 nd nd nd p Value 0.17 nd 0.66 0.21 nd 0.34 nd nd nd 95% CI of 0.61 nd 0.25 0.45 nd 0.31 nd nd nd OR Quart4 16 nd 9.1 37 nd 30 nd nd nd
[0166] FIG. 10: Comparison of marker levels in EDTA samples collected from Cohort 1 (patients that did not progress beyond RIFLE stage 0, R, or I) and in EDTA samples collected from Cohort 2 (subjects who progress to RIFLE stage F) at 0, 24 hours, and 48 hours prior to the subject reaching RIFLE stage I.
TABLE-US-00126 Alpha-2 macroglobulin 0 hr prior to AKI stage 24 hr prior to AKI stage 48 hr prior to AKI stage sCr or UO Cohort 1 Cohort 2 Cohort 1 Cohort 2 Cohort 1 Cohort 2 Median 566 621 566 655 nd nd Average 575 620 575 610 nd nd Stdev 168 96.7 168 166 nd nd p(t-test) 0.48 0.61 nd nd Min 22.9 489 22.9 307 nd nd Max 1640 806 1640 763 nd nd n (Samp) 306 7 306 6 nd nd n (Patient) 190 7 190 6 nd nd 0 hr prior to AKI stage 24 hr prior to AKI stage 48 hr prior to AKI stage UO only Cohort 1 Cohort 2 Cohort 1 Cohort 2 Cohort 1 Cohort 2 Median nd nd 565 655 nd nd Average nd nd 579 610 nd nd Stdev nd nd 166 166 nd nd p(t-test) nd nd 0.65 nd nd Min nd nd 195 307 nd nd Max nd nd 1640 763 nd nd n (Samp) nd nd 270 6 nd nd n (Patient) nd nd 162 6 nd nd 0 hr prior to AKI stage 24 hr prior to AKI stage 48 hr prior to AKI stage sCr or UO sCr only UO only sCr or UO sCr only UO only sCr or UO sCr only UO only AUC 0.61 nd nd 0.62 nd 0.62 nd nd nd SE 0.11 nd nd 0.12 nd 0.12 nd nd nd p 0.34 nd nd 0.34 nd 0.35 nd nd nd nCohort 1 306 nd nd 306 nd 270 nd nd nd nCohort 2 7 nd nd 6 nd 6 nd nd nd Cutoff 1 586 nd nd 548 nd 548 nd nd nd Sens 1 71% nd nd 83% nd 83% nd nd nd Spec 1 56% nd nd 44% nd 44% nd nd nd Cutoff 2 567 nd nd 548 nd 548 nd nd nd Sens 2 86% nd nd 83% nd 83% nd nd nd Spec 2 51% nd nd 44% nd 44% nd nd nd Cutoff 3 486 nd nd 305 nd 305 nd nd nd Sens 3 100% nd nd 100% nd 100% nd nd nd Spec 3 25% nd nd 6% nd 5% nd nd nd Cutoff 4 638 nd nd 638 nd 636 nd nd nd Sens 4 29% nd nd 67% nd 67% nd nd nd 0 hr prior to AKI stage 24 hr prior to AKI stage 48 hr prior to AKI stage sCr or UO sCr only UO only sCr or UO sCr only UO only sCr or UO sCr only UO only Spec 4 70% nd nd 70% nd 70% nd nd nd Cutoff 5 689 nd nd 689 nd 685 nd nd nd Sens 5 14% nd nd 33% nd 33% nd nd nd Spec 5 80% nd nd 80% nd 80% nd nd nd Cutoff 6 767 nd nd 767 nd 768 nd nd nd Sens 6 14% nd nd 0% nd 0% nd nd nd Spec 6 90% nd nd 90% nd 90% nd nd nd OR Quart 2 0 nd nd 1.0 nd 1.0 nd nd nd p Value na nd nd 1.0 nd 1.0 nd nd nd 95% CI of na nd nd 0.061 nd 0.061 nd nd nd OR Quart2 na nd nd 16 nd 16 nd nd nd OR Quart 3 5.3 nd nd 2.0 nd 2.0 nd nd nd p Value 0.13 nd nd 0.57 nd 0.57 nd nd nd 95% CI of 0.60 nd nd 0.18 nd 0.18 nd nd nd OR Quart3 46 nd nd 23 nd 23 nd nd nd OR Quart 4 0.99 nd nd 2.0 nd 2.0 nd nd nd p Value 0.99 nd nd 0.57 nd 0.57 nd nd nd 95% CI of 0.061 nd nd 0.18 nd 0.18 nd nd nd OR Quart4 16 nd nd 23 nd 23 nd nd nd
TABLE-US-00127 Apolipoprotein B-100 0 hr prior to AKI stage 24 hr prior to AKI stage 48 hr prior to AKI stage sCr or UO Cohort 1 Cohort 2 Cohort 1 Cohort 2 Cohort 1 Cohort 2 Median 159000 200000 159000 169000 nd nd Average 155000 187000 155000 158000 nd nd Stdev 48700 53400 48700 63400 nd nd p(t-test) 0.087 0.90 nd nd Min 2920 81400 2920 51300 nd nd Max 274000 245000 274000 221000 nd nd n (Samp) 306 7 306 6 nd nd n (Patient) 190 7 190 6 nd nd 0 hr prior to AKI stage 24 hr prior to AKI stage 48 hr prior to AKI stage UO only Cohort 1 Cohort 2 Cohort 1 Cohort 2 Cohort 1 Cohort 2 Median nd nd 164000 169000 nd nd Average nd nd 158000 158000 nd nd Stdev nd nd 48900 63400 nd nd p(t-test) nd nd 1.00 nd nd Min nd nd 2920 51300 nd nd Max nd nd 274000 221000 nd nd n (Samp) nd nd 270 6 nd nd n (Patient) nd nd 162 6 nd nd 0 hr prior to AKI stage 24 hr prior to AKI stage 48 hr prior to AKI stage sCr or UO sCr only UO only sCr or UO sCr only UO only sCr or UO sCr only UO only AUC 0.70 nd nd 0.55 nd 0.53 nd nd nd SE 0.11 nd nd 0.12 nd 0.12 nd nd nd p 0.075 nd nd 0.71 nd 0.80 nd nd nd nCohort 1 306 nd nd 306 nd 270 nd nd nd nCohort 2 7 nd nd 6 nd 6 nd nd nd Cutoff 1 188000 nd nd 124000 nd 124000 nd nd nd Sens 1 71% nd nd 83% nd 83% nd nd nd Spec 1 74% nd nd 31% nd 29% nd nd nd Cutoff 2 162000 nd nd 124000 nd 124000 nd nd nd Sens 2 86% nd nd 83% nd 83% nd nd nd Spec 2 52% nd nd 31% nd 29% nd nd nd Cutoff 3 80900 nd nd 50900 nd 50900 nd nd nd Sens 3 100% nd nd 100% nd 100% nd nd nd Spec 3 5% nd nd 1% nd 1% nd nd nd Cutoff 4 186000 nd nd 186000 nd 187000 nd nd nd Sens 4 71% nd nd 33% nd 33% nd nd nd Spec 4 70% nd nd 70% nd 70% nd nd nd Cutoff 5 197000 nd nd 197000 nd 200000 nd nd nd Sens 5 57% nd nd 33% nd 33% nd nd nd Spec 5 80% nd nd 80% nd 80% nd nd nd Cutoff 6 216000 nd nd 216000 nd 218000 nd nd nd Sens 6 29% nd nd 17% nd 17% nd nd nd Spec 6 90% nd nd 90% nd 90% nd nd nd OR Quart 2 0 nd nd 2.0 nd 2.0 nd nd nd p Value na nd nd 0.57 nd 0.57 nd nd nd 95% CI of na nd nd 0.18 nd 0.18 nd nd nd OR Quart2 na nd nd 23 nd 23 nd nd nd OR Quart 3 2.0 nd nd 1.0 nd 1.0 nd nd nd p Value 0.57 nd nd 1.0 nd 1.0 nd nd nd 95% CI of 0.18 nd nd 0.061 nd 0.061 nd nd nd OR Quart3 23 nd nd 16 nd 16 nd nd nd OR Quart 4 4.1 nd nd 2.0 nd 2.0 nd nd nd p Value 0.21 nd nd 0.57 nd 0.57 nd nd nd 95% CI of 0.45 nd nd 0.18 nd 0.18 nd nd nd OR Quart4 38 nd nd 23 nd 23 nd nd nd
TABLE-US-00128 Calcitonin 0 hr prior to AKI stage 24 hr prior to AKI stage 48 hr prior to AKI stage sCr or UO Cohort 1 Cohort 2 Cohort 1 Cohort 2 Cohort 1 Cohort 2 Median 32.8 162 32.8 239 nd nd Average 299 874 299 640 nd nd Stdev 769 1230 769 866 nd nd p(t-test) 0.012 0.15 nd nd Min 0.0604 0.0604 0.0604 2.07 nd nd Max 6590 3470 6590 2390 nd nd n (Samp) 551 12 551 11 nd nd n (Patient) 213 12 213 11 nd nd 0 hr prior to AKI stage 24 hr prior to AKI stage 48 hr prior to AKI stage UO only Cohort 1 Cohort 2 Cohort 1 Cohort 2 Cohort 1 Cohort 2 Median 34.9 98.2 34.9 147 nd nd Average 330 667 330 615 nd nd Stdev 820 1230 820 937 nd nd p(t-test) 0.25 0.30 nd nd Min 0.0604 0.0604 0.0604 2.07 nd nd Max 6590 3470 6590 2390 nd nd n (Samp) 465 8 465 9 nd nd n (Patient) 174 8 174 9 nd nd 0 hr prior to AKI stage 24 hr prior to AKI stage 48 hr prior to AKI stage sCr or UO sCr only UO only sCr or UO sCr only UO only sCr or UO sCr only UO only AUC 0.69 nd 0.60 0.69 nd 0.63 nd nd nd SE 0.086 nd 0.11 0.090 nd 0.10 nd nd nd p 0.030 nd 0.37 0.036 nd 0.18 nd nd nd nCohort 1 551 nd 465 551 nd 465 nd nd nd nCohort 2 12 nd 8 11 nd 9 nd nd nd Cutoff 1 50.7 nd 35.0 55.7 nd 47.8 nd nd nd Sens 1 75% nd 75% 73% nd 78% nd nd nd Spec 1 58% nd 50% 59% nd 56% nd nd nd Cutoff 2 36.7 nd 11.0 48.0 nd 7.79 nd nd nd Sens 2 83% nd 88% 82% nd 89% nd nd nd Spec 2 51% nd 28% 57% nd 18% nd nd nd Cutoff 3 11.0 nd 0 7.79 nd 2.02 nd nd nd Sens 3 92% nd 100% 91% nd 100% nd nd nd Spec 3 30% nd 0% 21% nd 5% nd nd nd Cutoff 4 107 nd 122 107 nd 122 nd nd nd Sens 4 58% nd 50% 64% nd 56% nd nd nd Spec 4 70% nd 70% 70% nd 70% nd nd nd Cutoff 5 211 nd 228 211 nd 228 nd nd nd Sens 5 42% nd 25% 55% nd 44% nd nd nd Spec 5 80% nd 80% 80% nd 80% nd nd nd Cutoff 6 832 nd 1130 832 nd 1130 nd nd nd Sens 6 33% nd 25% 27% nd 22% nd nd nd Spec 6 90% nd 90% 90% nd 90% nd nd nd OR Quart 2 0.99 nd 1.0 0 nd 0 nd nd nd p Value 1.00 nd 1.0 na nd na nd nd nd 95% CI of 0.061 nd 0.062 na nd na nd nd nd OR Quart2 16 nd 16 na nd na nd nd nd OR Quart 3 4.1 nd 3.1 1.5 nd 1.5 nd nd nd p Value 0.21 nd 0.34 0.65 nd 0.65 nd nd nd 95% CI of 0.45 nd 0.31 0.25 nd 0.25 nd nd nd OR Quart3 37 nd 30 9.2 nd 9.2 nd nd nd OR Quart 4 6.2 nd 3.0 3.1 nd 2.0 nd nd nd p Value 0.094 nd 0.34 0.17 nd 0.42 nd nd nd 95% CI of 0.73 nd 0.31 0.61 nd 0.36 nd nd nd OR Quart4 52 nd 30 15 nd 11 nd nd nd
TABLE-US-00129 C-reactive protein 0 hr prior to AKI stage 24 hr prior to AKI stage 48 hr prior to AKI stage sCr or UO Cohort 1 Cohort 2 Cohort 1 Cohort 2 Cohort 1 Cohort 2 Median 44900 70000 44900 70000 nd nd Average 53600 68900 53600 145000 nd nd Stdev 47800 30600 47800 210000 nd nd p(t-test) 0.40 6.3E-5 nd nd Min 1.00E-9 31900 1.00E-9 37500 nd nd Max 546000 119000 546000 573000 nd nd n (Samp) 306 7 306 6 nd nd n (Patient) 190 7 190 6 nd nd 0 hr prior to AKI stage 24 hr prior to AKI stage 48 hr prior to AKI stage UO only Cohort 1 Cohort 2 Cohort 1 Cohort 2 Cohort 1 Cohort 2 Median nd nd 46900 70000 nd nd Average nd nd 55100 145000 nd nd Stdev nd nd 49700 210000 nd nd p(t-test) nd nd 1.7E-4 nd nd Min nd nd 2360 37500 nd nd Max nd nd 546000 573000 nd nd n (Samp) nd nd 270 6 nd nd n (Patient) nd nd 162 6 nd nd 0 hr prior to AKI stage 24 hr prior to AKI stage 48 hr prior to AKI stage sCr or UO sCr only UO only sCr or UO sCr only UO only sCr or UO sCr only UO only AUC 0.68 nd nd 0.71 nd 0.70 nd nd nd SE 0.11 nd nd 0.12 nd 0.12 nd nd nd p 0.12 nd nd 0.088 nd 0.11 nd nd nd nCohort 1 306 nd nd 306 nd 270 nd nd nd nCohort 2 7 nd nd 6 nd 6 nd nd nd Cutoff 1 56100 nd nd 46200 nd 46200 nd nd nd Sens 1 71% nd nd 83% nd 83% nd nd nd Spec 1 58% nd nd 51% nd 50% nd nd nd Cutoff 2 39000 nd nd 46200 nd 46200 nd nd nd Sens 2 86% nd nd 83% nd 83% nd nd nd Spec 2 42% nd nd 51% nd 50% nd nd nd Cutoff 3 31900 nd nd 37400 nd 37400 nd nd nd Sens 3 100% nd nd 100% nd 100% nd nd nd Spec 3 29% nd nd 40% nd 37% nd nd nd Cutoff 4 70000 nd nd 70000 nd 70000 nd nd nd Sens 4 29% nd nd 17% nd 17% nd nd nd Spec 4 91% nd nd 91% nd 91% nd nd nd Cutoff 5 70000 nd nd 70000 nd 70000 nd nd nd Sens 5 29% nd nd 17% nd 17% nd nd nd Spec 5 91% nd nd 91% nd 91% nd nd nd Cutoff 6 70000 nd nd 70000 nd 70000 nd nd nd Sens 6 29% nd nd 17% nd 17% nd nd nd Spec 6 91% nd nd 91% nd 91% nd nd nd OR Quart 2 >2.1 nd nd >1.0 nd >2.1 nd nd nd 0 hr prior to AKI stage 24 hr prior to AKI stage 48 hr prior to AKI stage sCr or UO sCr only UO only sCr or UO sCr only UO only sCr or UO sCr only UO only p Value <0.56 nd nd <0.99 nd <0.56 nd nd nd 95% CI of >0.18 nd nd >0.062 nd >0.18 nd nd nd OR Quart2 na nd nd na nd na nd nd nd OR Quart 3 >3.1 nd nd >1.0 nd >3.1 nd nd nd p Value <0.33 nd nd <0.99 nd <0.33 nd nd nd 95% CI of >0.32 nd nd >0.062 nd >0.32 nd nd nd OR Quart3 na nd nd na nd na nd nd nd OR Quart 4 >2.0 nd nd >4.2 nd >1.0 nd nd nd p Value <0.57 nd nd <0.20 nd <0.99 nd nd nd 95% CI of >0.18 nd nd >0.46 nd >0.062 nd nd nd OR Quart4 na nd nd na nd na nd nd nd
TABLE-US-00130 Tissue factor 0 hr prior to AKI stage 24 hr prior to AKI stage 48 hr prior to AKI stage sCr or UO Cohort 1 Cohort 2 Cohort 1 Cohort 2 Cohort 1 Cohort 2 Median 0.466 0.729 0.466 0.702 nd nd Average 0.596 0.949 0.596 0.894 nd nd Stdev 0.691 0.854 0.691 0.859 nd nd p(t-test) 0.082 0.16 nd nd Min 0.00841 0.299 0.00841 0.00841 nd nd Max 7.23 3.31 7.23 2.44 nd nd n (Samp) 551 12 551 11 nd nd n (Patient) 213 12 213 11 nd nd 0 hr prior to AKI stage 24 hr prior to AKI stage 48 hr prior to AKI stage UO only Cohort 1 Cohort 2 Cohort 1 Cohort 2 Cohort 1 Cohort 2 Median 0.464 0.426 0.464 0.783 nd nd Average 0.583 0.901 0.583 0.847 nd nd Stdev 0.687 1.01 0.687 0.747 nd nd p(t-test) 0.20 0.25 nd nd Min 0.00841 0.351 0.00841 0.00841 nd nd Max 7.23 3.31 7.23 2.43 nd nd n (Samp) 465 8 465 9 nd nd n (Patient) 174 8 174 9 nd nd 0 hr prior to AKI stage 24 hr prior to AKI stage 48 hr prior to AKI stage sCr or UO sCr only UO only sCr or UO sCr only UO only sCr or UO sCr only UO only AUC 0.66 nd 0.61 0.61 nd 0.64 nd nd nd SE 0.087 nd 0.11 0.091 nd 0.10 nd nd nd p 0.066 nd 0.30 0.23 nd 0.18 nd nd nd nCohort 1 551 nd 465 551 nd 465 nd nd nd nCohort 2 12 nd 8 11 nd 9 nd nd nd Cutoff 1 0.406 nd 0.406 0.437 nd 0.437 nd nd nd Sens 1 75% nd 75% 73% nd 78% nd nd nd Spec 1 46% nd 46% 49% nd 49% nd nd nd Cutoff 2 0.380 nd 0.380 0.336 nd 0 nd nd nd Sens 2 83% nd 88% 82% nd 100% nd nd nd 0 hr prior to AKI stage 24 hr prior to AKI stage 48 hr prior to AKI stage sCr or UO sCr only UO only sCr or UO sCr only UO only sCr or UO sCr only UO only Spec 2 45% nd 45% 40% nd 0% nd nd nd Cutoff 3 0.345 nd 0.345 0 nd 0 nd nd nd Sens 3 92% nd 100% 100% nd 100% nd nd nd Spec 3 41% nd 41% 0% nd 0% nd nd nd Cutoff 4 0.728 nd 0.701 0.728 nd 0.701 nd nd nd Sens 4 50% nd 38% 45% nd 67% nd nd nd Spec 4 70% nd 70% 70% nd 70% nd nd nd Cutoff 5 0.987 nd 0.963 0.987 nd 0.963 nd nd nd Sens 5 33% nd 25% 27% nd 33% nd nd nd Spec 5 80% nd 80% 80% nd 80% nd nd nd Cutoff 6 1.35 nd 1.31 1.35 nd 1.31 nd nd nd Sens 6 17% nd 12% 27% nd 22% nd nd nd Spec 6 90% nd 90% 90% nd 90% nd nd nd OR Quart 2 >5.1 nd >5.2 >5.1 nd 0.49 nd nd nd p Value <0.14 nd <0.13 <0.14 nd 0.56 nd nd nd 95% CI of >0.59 nd >0.60 >0.59 nd 0.044 nd nd nd OR Quart2 na nd na na nd 5.5 nd nd nd OR Quart 3 >3.0 nd >1.0 >3.1 nd 1.5 nd nd nd p Value <0.34 nd <1.00 <0.33 nd 0.65 nd nd nd 95% CI of >0.31 nd >0.062 >0.32 nd 0.25 nd nd nd OR Quart3 na nd na na nd 9.2 nd nd nd OR Quart 4 >4.1 nd >2.0 >3.0 nd 1.5 nd nd nd p Value <0.21 nd <0.57 <0.34 nd 0.66 nd nd nd 95% CI of >0.45 nd >0.18 >0.31 nd 0.25 nd nd nd OR Quart4 na nd na na nd 9.1 nd nd nd
TABLE-US-00131 Fibrinogen 0 hr prior to AKI stage 24 hr prior to AKI stage 48 hr prior to AKI stage sCr or UO Cohort 1 Cohort 2 Cohort 1 Cohort 2 Cohort 1 Cohort 2 Median 1470 1810 1470 1430 nd nd Average 1760 2170 1760 1540 nd nd Stdev 1870 876 1870 1050 nd nd p(t-test) 0.57 0.77 nd nd Min 16.3 1140 16.3 256 nd nd Max 22500 3430 22500 3370 nd nd n (Samp) 306 7 306 6 nd nd n (Patient) 190 7 190 6 nd nd 0 hr prior to AKI stage 24 hr prior to AKI stage 48 hr prior to AKI stage UO only Cohort 1 Cohort 2 Cohort 1 Cohort 2 Cohort 1 Cohort 2 Median nd nd 1470 1430 nd nd Average nd nd 1760 1540 nd nd Stdev nd nd 1950 1050 nd nd p(t-test) nd nd 0.78 nd nd Min nd nd 390 256 nd nd Max nd nd 22500 3370 nd nd n (Samp) nd nd 270 6 nd nd n (Patient) nd nd 162 6 nd nd 0 hr prior to AKI stage 24 hr prior to AKI stage 48 hr prior to AKI stage sCr or UO sCr only UO only sCr or UO sCr only UO only sCr or UO sCr only UO only AUC 0.69 nd nd 0.46 nd 0.46 nd nd nd SE 0.11 nd nd 0.12 nd 0.12 nd nd nd p 0.083 nd nd 0.72 nd 0.73 nd nd nd nCohort 1 306 nd nd 306 nd 270 nd nd nd nCohort 2 7 nd nd 6 nd 6 nd nd nd Cutoff 1 1650 nd nd 931 nd 931 nd nd nd Sens 1 71% nd nd 83% nd 83% nd nd nd Spec 1 60% nd nd 15% nd 13% nd nd nd Cutoff 2 1570 nd nd 931 nd 931 nd nd nd Sens 2 86% nd nd 83% nd 83% nd nd nd Spec 2 56% nd nd 15% nd 13% nd nd nd Cutoff 3 1140 nd nd 16.3 nd 0 nd nd nd Sens 3 100% nd nd 100% nd 100% nd nd nd Spec 3 28% nd nd 0% nd 0% nd nd nd Cutoff 4 1850 nd nd 1850 nd 1820 nd nd nd Sens 4 43% nd nd 17% nd 17% nd nd nd Spec 4 70% nd nd 70% nd 70% nd nd nd Cutoff 5 2160 nd nd 2160 nd 2090 nd nd nd Sens 5 43% nd nd 17% nd 17% nd nd nd Spec 5 80% nd nd 80% nd 80% nd nd nd Cutoff 6 2550 nd nd 2550 nd 2490 nd nd nd Sens 6 29% nd nd 17% nd 17% nd nd nd Spec 6 90% nd nd 90% nd 90% nd nd nd OR Quart 2 >1.0 nd nd 2.0 nd 2.0 nd nd nd p Value <0.99 nd nd 0.57 nd 0.57 nd nd nd 95% CI of >0.062 nd nd 0.18 nd 0.18 nd nd nd OR Quart 2 na nd nd 23 nd 23 nd nd nd OR Quart 3 >3.1 nd nd 1.0 nd 1.0 nd nd nd p Value <0.33 nd nd 1.0 nd 1.0 nd nd nd 95% CI of >0.32 nd nd 0.061 nd 0.061 nd nd nd OR Quart 3 na nd nd 16 nd 16 nd nd nd OR Quart 4 >3.1 nd nd 2.0 nd 2.0 nd nd nd p Value <0.33 nd nd 0.57 nd 0.57 nd nd nd 95% CI of >0.31 nd nd 0.18 nd 0.18 nd nd nd OR Quart 4 na nd nd 23 nd 23 nd nd nd
TABLE-US-00132 Interleukin-5 0 hr prior to AKI stage 24 hr prior to AKI stage 48 hr prior to AKI stage sCr or UO Cohort 1 Cohort 2 Cohort 1 Cohort 2 Cohort 1 Cohort 2 Median 0.852 0.207 0.852 0.570 nd nd Average 3.79 1.08 3.79 3.68 nd nd Stdev 12.5 1.60 12.5 7.84 nd nd p(t-test) 0.57 0.98 nd nd Min 1.00E-9 1.00E-9 1.00E-9 1.00E-9 nd nd Max 120 3.48 120 19.6 nd nd n (Samp) 306 7 306 6 nd nd n (Patient) 190 7 190 6 nd nd 0 hr prior to AKI stage 24 hr prior to AKI stage 48 hr prior to AKI stage UO only Cohort 1 Cohort 2 Cohort 1 Cohort 2 Cohort 1 Cohort 2 Median nd nd 0.864 0.570 nd nd Average nd nd 3.98 3.68 nd nd Stdev nd nd 13.2 7.84 nd nd p(t-test) nd nd 0.96 nd nd Min nd nd 1.00E-9 1.00E-9 nd nd Max nd nd 120 19.6 nd nd n (Samp) nd nd 270 6 nd nd n (Patient) nd nd 162 6 nd nd 0 hr prior to AKI stage 24 hr prior to AKI stage 48 hr prior to AKI stage sCr or UO sCr only UO only sCr or UO sCr only UO only sCr or UO sCr only UO only AUC 0.32 nd nd 0.38 nd 0.38 nd nd nd SE 0.11 nd nd 0.12 nd 0.12 nd nd nd p 0.12 nd nd 0.34 nd 0.32 nd nd nd nCohort 1 306 nd nd 306 nd 270 nd nd nd nCohort 2 7 nd nd 6 nd 6 nd nd nd Cutoff 1 0.0826 nd nd 0 nd 0 nd nd nd Sens 1 71% nd nd 100% nd 100% nd nd nd Spec 1 7% nd nd 0% nd 0% nd nd nd Cutoff 2 0.0309 nd nd 0 nd 0 nd nd nd Sens 2 86% nd nd 100% nd 100% nd nd nd Spec 2 4% nd nd 0% nd 0% nd nd nd Cutoff 3 0 nd nd 0 nd 0 nd nd nd Sens 3 100% nd nd 100% nd 100% nd nd nd Spec 3 0% nd nd 0% nd 0% nd nd nd Cutoff 4 1.65 nd nd 1.65 nd 1.65 nd nd nd Sens 4 29% nd nd 17% nd 17% nd nd nd Spec 4 70% nd nd 70% nd 70% nd nd nd Cutoff 5 2.58 nd nd 2.58 nd 2.59 nd nd nd Sens 5 29% nd nd 17% nd 17% nd nd nd Spec 5 80% nd nd 80% nd 80% nd nd nd Cutoff 6 5.09 nd nd 5.09 nd 4.99 nd nd nd Sens 6 0% nd nd 17% nd 17% nd nd nd Spec 6 90% nd nd 90% nd 90% nd nd nd OR Quart 2 0 nd nd 2.0 nd 2.0 nd nd nd p Value na nd nd 0.57 nd 0.57 nd nd nd 95% CI of na nd nd 0.18 nd 0.18 nd nd nd OR Quart 2 na nd nd 23 nd 23 nd nd nd OR Quart 3 0.50 nd nd 0 nd 0 nd nd nd p Value 0.57 nd nd na nd na nd nd nd 0 hr prior to AKI stage 24 hr prior to AKI stage 48 hr prior to AKI stage sCr or UO sCr only UO only sCr or UO sCr only UO only sCr or UO sCr only UO only 95% CI of 0.044 nd nd na nd na nd nd nd OR Quart 3 5.6 nd nd na nd na nd nd nd OR Quart 4 2.1 nd nd 3.1 nd 3.1 nd nd nd p Value 0.41 nd nd 0.33 nd 0.33 nd nd nd 95% CI of 0.37 nd nd 0.31 nd 0.31 nd nd nd OR Quart 4 12 nd nd 30 nd 30 nd nd nd
TABLE-US-00133 Thrombopoietin 0 hr prior to AKI stage 24 hr prior to AKI stage 48 hr prior to AKI stage sCr or UO Cohort 1 Cohort 2 Cohort 1 Cohort 2 Cohort 1 Cohort 2 Median 1.94 2.58 1.94 2.72 nd nd Average 2.15 2.47 2.15 2.40 nd nd Stdev 1.16 1.01 1.16 1.09 nd nd p(t-test) 0.35 0.48 nd nd Min 0.0323 0.836 0.0323 0.492 nd nd Max 6.89 3.97 6.89 3.73 nd nd n (Samp) 551 12 551 11 nd nd n (Patient) 213 12 213 11 nd nd 0 hr prior to AKI stage 24 hr prior to AKI stage 48 hr prior to AKI stage UO only Cohort 1 Cohort 2 Cohort 1 Cohort 2 Cohort 1 Cohort 2 Median 1.88 2.60 1.88 2.91 nd nd Average 2.12 2.47 2.12 2.75 nd nd Stdev 1.17 0.946 1.17 1.22 nd nd p(t-test) 0.40 0.11 nd nd Min 0.0323 1.11 0.0323 0.492 nd nd Max 6.89 3.80 6.89 3.97 nd nd n (Samp) 465 8 465 9 nd nd n (Patient) 174 8 174 9 nd nd 0 hr prior to AKI stage 24 hr prior to AKI stage 48 hr prior to AKI stage sCr or UO sCr only UO only sCr or UO sCr only UO only sCr or UO sCr only UO only AUC 0.60 nd 0.61 0.59 nd 0.67 nd nd nd SE 0.087 nd 0.11 0.091 nd 0.10 nd nd nd p 0.25 nd 0.29 0.34 nd 0.093 nd nd nd nCohort 1 551 nd 465 551 nd 465 nd nd nd nCohort 2 12 nd 8 11 nd 9 nd nd nd Cutoff 1 1.94 nd 1.94 1.66 nd 2.71 nd nd nd Sens 1 75% nd 75% 73% nd 78% nd nd nd Spec 1 51% nd 52% 39% nd 72% nd nd nd Cutoff 2 1.39 nd 1.39 1.52 nd 0.974 nd nd nd Sens 2 83% nd 88% 82% nd 89% nd nd nd Spec 2 26% nd 29% 33% nd 15% nd nd nd Cutoff 3 1.08 nd 1.08 0.974 nd 0.396 nd nd nd Sens 3 92% nd 100% 91% nd 100% nd nd nd Spec 3 16% nd 17% 14% nd 3% nd nd nd Cutoff 4 2.66 nd 2.66 2.66 nd 2.66 nd nd nd 0 hr prior to AKI stage 24 hr prior to AKI stage 48 hr prior to AKI stage sCr or UO sCr only UO only sCr or UO sCr only UO only sCr or UO sCr only UO only Sens 4 50% nd 50% 55% nd 78% nd nd nd Spec 4 71% nd 71% 71% nd 71% nd nd nd Cutoff 5 3.10 nd 3.05 3.10 nd 3.05 nd nd nd Sens 5 25% nd 25% 27% nd 44% nd nd nd Spec 5 80% nd 80% 80% nd 80% nd nd nd Cutoff 6 3.70 nd 3.66 3.70 nd 3.66 nd nd nd Sens 6 17% nd 12% 9% nd 33% nd nd nd Spec 6 90% nd 90% 90% nd 90% nd nd nd OR Quart 2 0.49 nd 1.0 0.99 nd 0 nd nd nd p Value 0.57 nd 1.0 0.99 nd na nd nd nd 95% CI of 0.044 nd 0.062 0.14 nd na nd nd nd OR Quart 2 5.5 nd 16 7.1 nd na nd nd nd OR Quart 3 2.0 nd 2.0 1.5 nd 1.0 nd nd nd p Value 0.42 nd 0.57 0.65 nd 1.0 nd nd nd 95% CI of 0.36 nd 0.18 0.25 nd 0.14 nd nd nd OR Quart 3 11 nd 23 9.2 nd 7.2 nd nd nd OR Quart 4 2.5 nd 4.1 2.0 nd 2.5 nd nd nd p Value 0.27 nd 0.21 0.42 nd 0.27 nd nd nd 95% CI of 0.48 nd 0.45 0.36 nd 0.48 nd nd nd OR Quart 4 13 nd 37 11 nd 13 nd nd nd
[0167] FIG. 11: Comparison of marker levels in enroll urine samples collected from Cohort 1 (patients that did not progress beyond RIFLE stage 0 or R within 48 hrs) and in enroll urine samples collected from Cohort 2 (subjects reaching RIFLE stage I or F within 48 hrs). Enroll samples from patients already at RIFLE stage I or F were included in Cohort 2.
TABLE-US-00134 Alpha-2 macroglobulin sCr or UO sCr only UO only Cohort 1 Cohort 2 Cohort 1 Cohort 2 Cohort 1 Cohort 2 Median 0.344 1.20 0.370 3.09 0.364 1.28 Average 4.40 15.4 5.63 26.5 2.01 16.6 Stdev 33.7 52.8 37.6 46.3 10.9 55.5 p(t-test) 0.038 0.061 3.6E-4 Min 1.00E-9 1.00E-9 1.00E-9 0.0346 1.00E-9 1.00E-9 Max 510 368 510 133 155 368 n (Samp) 294 61 340 12 215 55 n (Patient) 294 61 340 12 215 55 At Enrollment sCr or UO sCr only UO only AUC 0.68 0.70 0.69 SE 0.040 0.086 0.043 p 5.8E-6 0.021 6.6E-6 nCohort 1 294 340 215 nCohort 2 61 12 55 Cutoff 1 0.411 0.540 0.448 Sens 1 70% 75% 71% Spec 1 56% 58% 56% Cutoff 2 0.259 0.222 0.276 Sens 2 80% 83% 80% Spec 2 44% 36% 44% Cutoff 3 0.150 0.0708 0.155 Sens 3 90% 92% 91% Spec 3 27% 14% 26% Cutoff 4 0.766 0.944 0.864 Sens 4 56% 67% 56% Spec 4 70% 70% 70% Cutoff 5 1.43 1.81 1.43 Sens 5 43% 50% 44% Spec 5 80% 80% 80% Cutoff 6 3.98 4.50 3.85 Sens 6 30% 50% 29% Spec 6 90% 90% 90% OR Quart 2 1.3 0.49 1.8 p Value 0.64 0.57 0.31 95% CI of 0.47 0.044 0.60 OR Quart 2 3.4 5.6 5.1 OR Quart 3 2.0 1.5 2.9 p Value 0.13 0.65 0.038 95% CI of 0.81 0.25 1.1 OR Quart 3 5.1 9.3 8.1 OR Quart 4 4.6 3.1 5.5 p Value 4.7E-4 0.17 5.7E-4 95% CI of 2.0 0.62 2.1 OR Quart 4 11 16 15
TABLE-US-00135 Apolipoprotein A-I sCr or UO sCr only UO only Cohort 1 Cohort 2 Cohort 1 Cohort 2 Cohort 1 Cohort 2 Median 331 519 360 878 361 551 Average 1220 2070 1270 4070 1190 2050 Stdev 2750 3670 2800 5330 2680 3580 p(t-test) 0.041 0.0012 0.052 Min 1.00E-9 1.00E-9 1.00E-9 0.194 1.00E-9 1.00E-9 Max 12000 12000 12000 12000 12000 12000 n (Samp) 290 60 335 12 212 54 n (Patient) 290 60 335 12 212 54 At Enrollment sCr or UO sCr only UO only AUC 0.57 0.60 0.58 SE 0.042 0.088 0.045 P 0.085 0.27 0.063 nCohort 1 290 335 212 nCohort 2 60 12 54 Cutoff 1 168 158 216 Sens 1 70% 75% 70% Spec 1 33% 31% 38% Cutoff 2 125 125 130 Sens 2 80% 83% 81% Spec 2 24% 24% 26% Cutoff 3 63.6 31.0 68.2 Sens 3 90% 92% 91% Spec 3 15% 7% 14% Cutoff 4 643 720 720 Sens 4 42% 50% 43% Spec 4 70% 70% 70% Cutoff 5 1040 1070 1040 Sens 5 32% 50% 31% Spec 5 80% 80% 80% Cutoff 6 1960 2290 1870 Sens 6 22% 33% 22% Spec 6 90% 90% 90% OR Quart 2 0.81 0.65 0.88 p Value 0.64 0.64 0.78 95% CI of 0.34 0.11 0.35 OR Quart 2 1.9 4.0 2.2 OR Quart 3 1.4 0.32 1.6 p Value 0.42 0.33 0.28 95% CI of 0.63 0.033 0.68 OR Quart 3 3.1 3.2 3.8 OR Quart 4 1.6 2.0 1.7 p Value 0.26 0.32 0.22 95% CI of 0.72 0.50 0.73 OR Quart 4 3.4 8.5 4.0
TABLE-US-00136 Apolipoprotein B-100 sCr or UO sCr only UO only Cohort 1 Cohort 2 Cohort 1 Cohort 2 Cohort 1 Cohort 2 Median 58.7 193 63.3 295 64.4 211 Average 214 518 257 568 201 537 Stdev 375 736 461 681 334 738 p(t-test) 3.3E-6 0.025 1.1E-6 Min 1.00E-9 1.00E-9 1.00E-9 2.43 1.00E-9 1.00E-9 Max 2490 3580 3580 1900 2130 3580 n (Samp) 295 61 341 12 216 55 n (Patient) 295 61 341 12 216 55 At Enrollment sCr or UO sCr only UO only AUC 0.64 0.63 0.66 SE 0.041 0.088 0.044 P 8.8E-4 0.14 2.9E-4 nCohort 1 295 341 216 nCohort 2 61 12 55 Cutoff 1 45.9 45.5 47.8 Sens 1 70% 75% 71% Spec 1 46% 43% 45% Cutoff 2 21.3 10.1 30.4 Sens 2 80% 83% 80% Spec 2 30% 19% 34% Cutoff 3 7.46 3.20 9.72 Sens 3 90% 92% 91% Spec 3 17% 9% 18% Cutoff 4 164 192 172 Sens 4 52% 58% 56% Spec 4 70% 70% 70% Cutoff 5 321 409 318 Sens 5 41% 33% 44% Spec 5 80% 80% 80% Cutoff 6 653 756 598 Sens 6 28% 33% 33% Spec 6 90% 90% 90% OR Quart 2 1.1 0.33 1.6 p Value 0.82 0.34 0.35 95% CI of 0.46 0.033 0.60 OR Quart 2 2.7 3.2 4.2 OR Quart 3 1.2 0.66 1.4 p Value 0.66 0.65 0.48 95% CI of 0.51 0.11 0.53 OR Quart 3 2.9 4.0 3.8 OR Quart 4 2.8 2.0 4.0 p Value 0.011 0.32 0.0022 95% CI of 1.3 0.50 1.7 OR Quart 4 6.1 8.5 9.8
TABLE-US-00137 Calcitonin sCr or UO sCr only UO only Cohort Cohort Cohort Cohort Cohort Cohort 1 2 1 2 1 2 Median 90.7 135 94.2 392 91.4 119 Average 596 351 528 973 706 180 Stdev 3910 787 3590 1530 4350 179 p(t-test) 0.71 0.73 0.51 Min 1.48 4.07 1.48 4.07 2.78 5.40 Max 38800 4480 38800 4480 38800 685 n (Samp) 139 35 165 8 112 30 n (Patient) 139 35 165 8 112 30 At Enrollment sCr or UO sCr only UO only AUC 0.61 0.65 0.60 SE 0.055 0.11 0.060 P 0.049 0.17 0.11 nCohort 1 139 165 112 nCohort 2 35 8 30 Cutoff 1 73.0 71.5 76.0 Sens 1 71% 75% 70% Spec 1 45% 42% 44% Cutoff 2 70.3 40.2 70.5 Sens 2 80% 88% 80% Spec 2 45% 20% 43% Cutoff 3 40.2 3.42 55.6 Sens 3 91% 100% 90% Spec 3 22% 2% 34% Cutoff 4 147 150 147 Sens 4 40% 50% 37% Spec 4 71% 70% 71% Cutoff 5 197 194 197 Sens 5 26% 50% 20% Spec 5 81% 80% 80% Cutoff 6 354 354 341 Sens 6 20% 50% 13% Spec 6 91% 90% 90% OR Quart 2 2.9 0.49 7.3 p Value 0.098 0.56 0.015 95% CI of 0.82 0.043 1.5 OR Quart 2 10.0 5.6 36 OR Quart 3 3.0 0.49 5.7 p Value 0.089 0.56 0.035 95% CI of 0.85 0.043 1.1 OR Quart 3 10 5.6 29 OR Quart 4 3.2 2.0 4.7 p Value 0.061 0.42 0.062 95% CI of 0.95 0.36 0.92 OR Quart 4 11 12 24
TABLE-US-00138 C-reactive protein sCr or UO sCr only UO only Cohort 1 Cohort 2 Cohort 1 Cohort 2 Cohort 1 Cohort 2 Median 8.19 30.4 10.4 30.4 9.32 30.4 Average 19.7 31.1 21.2 34.4 20.8 32.4 Stdev 26.5 22.1 26.3 21.3 27.6 22.6 p(t-test) 0.0018 0.087 0.0041 Min 1.00E-9 0.0159 1.00E-9 0.0806 1.00E-9 0.0159 Max 228 83.0 228 71.2 228 83.0 n (Samp) 295 61 341 12 216 55 n (Patient) 295 61 341 12 216 55 At Enrollment sCr or UO sCr only UO only AUC 0.67 0.68 0.67 SE 0.041 0.086 0.043 P 2.7E-5 0.033 7.1E-5 nCohort 1 295 341 216 nCohort 2 61 12 55 Cutoff 1 13.4 30.1 19.0 Sens 1 70% 75% 71% Spec 1 57% 64% 59% Cutoff 2 5.89 13.1 5.84 Sens 2 80% 83% 80% Spec 2 44% 52% 42% Cutoff 3 2.07 9.72 2.02 Sens 3 90% 92% 91% Spec 3 32% 50% 31% Cutoff 4 30.4 30.4 30.4 Sens 4 36% 33% 40% Spec 4 78% 76% 77% Cutoff 5 32.6 38.1 33.8 Sens 5 36% 33% 38% Spec 5 80% 80% 80% Cutoff 6 54.7 56.0 50.5 Sens 6 23% 8% 27% Spec 6 90% 93% 90% OR Quart 2 2.1 1.0 2.4 p Value 0.19 1.0 0.13 95% CI of 0.70 0.062 0.78 OR Quart 2 6.5 16 7.3 OR Quart 3 6.2 6.4 4.1 p Value 4.3E-4 0.090 0.0089 95% CI of 2.2 0.75 1.4 OR Quart 3 17 54 12 OR Quart 4 5.5 4.1 5.9 p Value 0.0011 0.21 8.2E-4 95% CI of 2.0 0.45 2.1 OR Quart 4 15 37 17
TABLE-US-00139 Tissue factor sCr or UO sCr only UO only Cohort 1 Cohort 2 Cohort 1 Cohort 2 Cohort 1 Cohort 2 Median 0.00336 0.00336 0.00336 0.230 0.00336 0.00336 Average 0.0776 0.114 0.0749 0.300 0.0849 0.0902 Stdev 0.135 0.243 0.139 0.374 0.141 0.247 p(t-test) 0.24 1.0E-4 0.88 Min 0.00336 0.00336 0.00336 0.00336 0.00336 0.00336 Max 0.917 1.12 0.917 1.12 0.917 1.12 n (Samp) 139 35 165 8 112 30 n (Patient) 139 35 165 8 112 30 At Enrollment sCr or UO sCr only UO only AUC 0.50 0.72 0.43 SE 0.055 0.10 0.060 P 0.93 0.034 0.23 nCohort 1 139 165 112 nCohort 2 35 8 30 Cutoff 1 0 0 0 Sens 1 100% 100% 100% Spec 1 0% 0% 0% Cutoff 2 0 0 0 Sens 2 100% 100% 100% Spec 2 0% 0% 0% Cutoff 3 0 0 0 Sens 3 100% 100% 100% Spec 3 0% 0% 0% Cutoff 4 0.130 0.110 0.130 Sens 4 26% 62% 17% Spec 4 73% 70% 71% Cutoff 5 0.164 0.159 0.167 Sens 5 23% 62% 13% Spec 5 81% 80% 81% Cutoff 6 0.232 0.217 0.232 Sens 6 17% 50% 10% Spec 6 91% 90% 90% OR Quart 2 0.51 >1.0 1.3 p Value 0.27 <0.99 0.71 95% CI of 0.16 >0.062 0.35 OR Quart 2 1.7 na 4.7 OR Quart 3 1.3 >2.1 2.7 p Value 0.61 <0.55 0.096 95% CI of 0.48 >0.18 0.84 OR Quart 3 3.5 na 8.9 OR Quart 4 1.2 >5.5 1.8 p Value 0.75 <0.13 0.33 95% CI of 0.43 >0.62 0.54 OR Quart 4 3.3 na 6.3
TABLE-US-00140 Fibrinogen sCr or UO sCr only UO only Cohort 1 Cohort 2 Cohort 1 Cohort 2 Cohort 1 Cohort 2 Median 0.102 0.193 0.104 0.929 0.112 0.193 Average 46.8 5.46 41.3 4.87 0.724 5.97 Stdev 791 28.2 736 7.23 2.76 29.7 p(t-test) 0.68 0.86 0.011 Min 1.00E-9 1.00E-9 1.00E-9 1.00E-9 1.00E-9 1.00E-9 Max 13600 219 13600 21.2 34.1 219 n (Samp) 295 61 341 12 216 55 n (Patient) 295 61 341 12 216 55 At Enrollment sCr or UO sCr only UO only AUC 0.61 0.70 0.60 SE 0.041 0.086 0.044 P 0.011 0.023 0.023 nCohort 1 295 341 216 nCohort 2 61 12 55 Cutoff 1 0.0696 0.0734 0.0706 Sens 1 70% 75% 71% Spec 1 43% 44% 42% Cutoff 2 0.0395 0.0328 0.0472 Sens 2 80% 83% 80% Spec 2 34% 31% 36% Cutoff 3 0 0.0173 0 Sens 3 100% 92% 100% Spec 3 0% 23% 0% Cutoff 4 0.285 0.300 0.318 Sens 4 46% 67% 40% Spec 4 70% 70% 70% Cutoff 5 0.467 0.551 0.551 Sens 5 34% 58% 33% Spec 5 80% 80% 80% Cutoff 6 1.76 1.90 1.82 Sens 6 23% 42% 24% Spec 6 90% 90% 90% OR Quart 2 1.9 1.0 2.6 p Value 0.14 1.0 0.048 95% CI of 0.81 0.14 1.0 OR Quart 2 4.7 7.3 6.9 OR Quart 3 1.5 0.49 2.2 p Value 0.36 0.57 0.11 95% CI of 0.61 0.044 0.83 OR Quart 3 3.8 5.6 5.9 OR Quart 4 3.1 3.7 3.1 p Value 0.0081 0.11 0.020 95% CI of 1.3 0.74 1.2 OR Quart 4 7.2 18 8.0
TABLE-US-00141 Interleukin-5 sCr or UO sCr only UO only Cohort 1 Cohort 2 Cohort 1 Cohort 2 Cohort 1 Cohort 2 Median 0.0774 0.0204 0.0635 0.0726 0.0825 0.0204 Average 0.401 0.0825 0.357 0.0780 0.454 0.0873 Stdev 1.61 0.147 1.50 0.0884 1.79 0.153 p(t-test) 012 0.52 0.13 Min 1.00E-9 1.00E-9 1.00E-9 1.00E-9 1.00E-9 1.00E-9 Max 18.8 0.801 18.8 0.318 18.8 0.801 n (Samp) 296 61 342 12 217 55 n (Patient) 296 61 342 12 217 55 At Enrollment sCr or UO sCr only UO only AUC 0.37 0.45 0.36 SE 0.041 0.087 0.044 P 0.0013 0.58 0.0014 nCohort 1 296 342 217 nCohort 2 61 12 55 Cutoff 1 0 0 0 Sens 1 100% 100% 100% Spec 1 0% 0% 0% Cutoff 2 0 0 0 Sens 2 100% 100% 100% Spec 2 0% 0% 0% Cutoff 3 0 0 0 Sens 3 100% 100% 100% Spec 3 0% 0% 0% Cutoff 4 0.144 0.127 0.148 Sens 4 13% 17% 15% Spec 4 71% 70% 70% Cutoff 5 0.219 0.207 0.237 Sens 5 13% 8% 13% Spec 5 80% 80% 80% Cutoff 6 0.595 0.495 0.829 Sens 6 2% 0% 0% Spec 6 90% 90% 90% OR Quart 2 1.8 6.4 1.3 p Value 0.24 0.088 0.61 95% CI of 0.69 0.76 0.48 OR Quart 2 4.5 55 3.5 OR Quart 3 2.2 1.0 2.3 p Value 0.080 1.0 0.077 95% CI of 0.91 0.062 0.91 OR Quart 3 5.6 16 5.8 OR Quart 4 3.8 4.2 3.4 p Value 0.0025 0.20 0.0084 95% CI of 1.6 0.46 1.4 OR Quart 4 9.0 38 8.2
TABLE-US-00142 Interleukin-6 receptor subunit beta sCr or UO sCr only UO only Cohort Cohort Cohort Cohort Cohort Cohort 1 2 1 2 1 2 Median 11800 19400 nd nd 11500 26400 Average 13500 40900 nd nd 13100 43900 Stdev 9150 63400 nd nd 8500 65300 p(t-test) 2.1E-5 nd nd 1.9E-5 Min 670 3520 nd nd 670 4200 Max 55300 323000 nd nd 55300 323000 n (Samp) 111 25 nd nd 93 23 n (Patient) 111 25 nd nd 93 23 At Enrollment sCr or UO sCr only UO only AUC 0.73 nd 0.78 SE 0.061 nd 0.060 P 2.1E-4 nd 3.1E-6 nCohort 1 111 nd 93 nCohort 2 25 nd 23 Cutoff 1 14300 nd 14300 Sens 1 72% nd 74% Spec 1 61% nd 63% Cutoff 2 12300 nd 12700 Sens 2 80% nd 83% Spec 2 51% nd 54% Cutoff 3 5680 nd 11800 Sens 3 92% nd 91% Spec 3 21% nd 52% Cutoff 4 16600 nd 16200 Sens 4 60% nd 70% Spec 4 70% nd 71% Cutoff 5 19400 nd 19000 Sens 5 52% nd 57% Spec 5 80% nd 81% Cutoff 6 25300 nd 23700 Sens 6 48% nd 52% Spec 6 90% nd 90% OR Quart 2 1.4 nd 1.6 p Value 0.69 nd 0.64 95% CI of 0.28 nd 0.24 OR Quart 2 6.7 nd 10 OR Quart 3 2.2 nd 2.8 p Value 0.29 nd 0.24 95% CI of 0.51 nd 0.50 OR Quart 3 9.7 nd 16 OR Quart 4 5.6 nd 11 p Value 0.014 nd 0.0036 95% CI of 1.4 nd 2.2 OR Quart 4 22 nd 55
TABLE-US-00143 Macrophage metalloelastase sCr or UO sCr only UO only Cohort 1 Cohort 2 Cohort 1 Cohort 2 Cohort 1 Cohort 2 Median 1.00E-9 4.82 nd nd 1.00E-9 4.82 Average 2.84 8.44 nd nd 3.11 8.85 Stdev 7.68 11.6 nd nd 8.25 12.0 p(t-test) 0.0036 nd nd 0.0076 Min 1.00E-9 1.00E-9 nd nd 1.00E-9 1.00E-9 Max 69.2 49.5 nd nd 69.2 49.5 n (Samp) 111 25 nd nd 94 23 n (Patient) 111 25 nd nd 94 23 At Enrollment sCr or UO sCr only UO only AUC 0.71 nd 0.72 SE 0.062 nd 0.065 p 6.0E-4 nd 8.1E-4 nCohort 1 111 nd 94 nCohort 2 25 nd 23 Cutoff 1 1.00E-9 nd 1.00E-9 Sens 1 72% nd 74% Spec 1 64% nd 65% Cutoff 2 0 nd 0 Sens 2 100% nd 100% Spec 2 0% nd 0% Cutoff 3 0 nd 0 Sens 3 100% nd 100% Spec 3 0% nd 0% Cutoff 4 1.12 nd 1.26 Sens 4 64% nd 65% Spec 4 70% nd 70% Cutoff 5 4.82 nd 4.82 Sens 5 48% nd 48% Spec 5 83% nd 82% Cutoff 6 7.33 nd 11.1 Sens 6 32% nd 22% Spec 6 90% nd 90% OR Quart 2 0 nd 0.17 p Value na nd 0.12 95% CI of na nd 0.019 OR Quart 2 na nd 1.6 OR Quart 3 0.67 nd 1.3 p Value 0.53 nd 0.74 95% CI of 0.19 nd 0.34 OR Quart 3 2.3 nd 4.7 OR Quart 4 2.4 nd 2.8 p Value 0.11 nd 0.100 95% CI of 0.81 nd 0.82 OR Quart 4 7.0 nd 9.4
TABLE-US-00144 Sex hormone-binding globulin sCr or UO sCr only UO only Cohort 1 Cohort 2 Cohort 1 Cohort 2 Cohort 1 Cohort 2 Median 0.0177 0.0634 0.0204 0.171 0.0192 0.0266 Average 0.0498 0.601 0.155 0.287 0.0510 0.676 Stdev 0.144 2.37 1.11 0.427 0.153 2.56 p(t-test) 0.0067 0.74 0.011 Min 5.20E-6 0.00126 5.20E-6 0.00208 5.20E-6 0.00126 Max 1.57 14.0 14.0 1.32 1.57 14.0 n (Samp) 139 35 165 8 112 30 n (Patient) 139 35 165 8 112 30 At Enrollment sCr or UO sCr only UO only AUC 0.68 0.79 0.66 SE 0.054 0.097 0.059 P 7.7E-4 0.0027 0.0083 nCohort 1 139 165 112 nCohort 2 35 8 30 Cutoff 1 0.0191 0.136 0.0191 Sens 1 71% 75% 70% Spec 1 51% 93% 50% Cutoff 2 0.0145 0.0229 0.0145 Sens 2 80% 88% 80% Spec 2 43% 55% 41% Cutoff 3 0.00347 0.00203 0.00559 Sens 3 91% 100% 90% Spec 3 18% 12% 25% Cutoff 4 0.0404 0.0439 0.0404 Sens 4 51% 75% 47% Spec 4 71% 70% 71% Cutoff 5 0.0595 0.0697 0.0595 Sens 5 51% 75% 47% Spec 5 81% 80% 80% Cutoff 6 0.0951 0.115 0.0951 Sens 6 37% 75% 30% Spec 6 91% 90% 90% OR Quart 2 1.2 0 1.6 p Value 0.78 na 0.53 95% CI of 0.34 na 0.40 OR Quart 2 4.3 na 6.0 OR Quart 3 1.2 1.0 1.6 p Value 0.75 1.0 0.50 95% CI of 0.35 0.061 0.41 OR Quart 3 4.4 17 6.3 OR Quart 4 5.3 6.6 4.9 p Value 0.0033 0.086 0.012 95% CI of 1.7 0.76 1.4 OR Quart 4 16 58 17
[0168] FIG. 12: Comparison of marker levels in enroll EDTA samples collected from Cohort 1 (patients that did not progress beyond RIFLE stage 0 or R within 48 hrs) and in enroll EDTA samples collected from Cohort 2 (subjects reaching RIFLE stage I or F within 48 hrs). Enroll samples from patients already at stage I or F were included in Cohort 2.
TABLE-US-00145 Alpha-2 macroglobulin sCr or UO sCr only UO only Cohort 1 Cohort 2 Cohort 1 Cohort 2 Cohort 1 Cohort 2 Median 572 562 nd nd 578 573 Average 578 536 nd nd 595 538 Stdev 166 133 nd nd 159 136 p(t-test) 0.26 nd nd 0.13 Min 22.9 211 nd nd 242 211 Max 987 732 nd nd 987 732 n (Samp) 96 23 nd nd 82 22 n (Patient) 96 23 nd nd 82 22 At Enrollment sCr or UO sCr only UO only AUC 0.42 nd 0.40 SE 0.068 nd 0.071 p 0.25 nd 0.16 nCohort 1 96 nd 82 nCohort 2 23 nd 22 Cutoff 1 462 nd 462 Sens 1 74% nd 73% Spec 1 19% nd 16% Cutoff 2 427 nd 427 Sens 2 83% nd 82% Spec 2 18% nd 15% Cutoff 3 320 nd 320 Sens 3 91% nd 91% Spec 3 8% nd 7% Cutoff 4 661 nd 682 Sens 4 13% nd 9% Spec 4 71% nd 71% Cutoff 5 723 nd 729 Sens 5 9% nd 9% Spec 5 80% nd 80% Cutoff 6 773 nd 775 Sens 6 0% nd 0% Spec 6 91% nd 90% OR Quart 2 3.3 nd 6.4 p Value 0.11 nd 0.028 95% CI of 0.77 nd 1.2 OR Quart 2 14 nd 33 OR Quart 3 1.8 nd 2.2 p Value 0.45 nd 0.39 95% CI of 0.39 nd 0.36 OR Quart 3 8.3 nd 13 OR Quart 4 2.9 nd 4.4 p Value 0.16 nd 0.083 95% CI of 0.66 nd 0.82 OR Quart 4 12 nd 24
TABLE-US-00146 Apolipoprotein A-I sCr or UO sCr only UO only Cohort 1 Cohort 2 Cohort 1 Cohort 2 Cohort 1 Cohort 2 Median 666000 734000 nd nd 668000 737000 Average 1050000 990000 nd nd 1020000 1020000 Stdev 983000 1030000 nd nd 948000 1050000 p(t-test) 0.80 nd nd 0.99 Min 6920 171000 nd nd 6920 171000 Max 5130000 5040000 nd nd 5130000 5040000 n (Samp) 96 23 nd nd 82 22 n (Patient) 96 23 nd nd 82 22 At Enrollment sCr or UO sCr only UO only AUC 0.50 nd 0.52 SE 0.067 nd 0.070 p 0.94 nd 0.78 nCohort 1 96 nd 82 nCohort 2 23 nd 22 Cutoff 1 425000 nd 455000 Sens 1 74% nd 73% Spec 1 28% nd 33% Cutoff 2 395000 nd 407000 Sens 2 83% nd 82% Spec 2 21% nd 23% Cutoff 3 373000 nd 386000 Sens 3 91% nd 91% Spec 3 21% nd 21% Cutoff 4 964000 nd 964000 Sens 4 26% nd 27% Spec 4 71% nd 71% Cutoff 5 1520000 nd 1390000 Sens 5 13% nd 18% Spec 5 80% nd 80% Cutoff 6 2560000 nd 2560000 Sens 6 4% nd 5% Spec 6 95% nd 96% OR Quart 2 0.59 nd 0.76 p Value 0.45 nd 0.71 95% CI of 0.15 nd 0.18 OR Quart 2 2.4 nd 3.2 OR Quart 3 1.2 nd 1.5 p Value 0.81 nd 0.51 95% CI of 0.34 nd 0.42 OR Quart 3 4.0 nd 5.7 OR Quart 4 0.96 nd 1.3 p Value 0.95 nd 0.73 95% CI of 0.27 nd 0.33 OR Quart 4 3.4 nd 4.8
TABLE-US-00147 Apolipoprotein B-100 sCr or UO sCr only UO only Cohort 1 Cohort 2 Cohort 1 Cohort 2 Cohort 1 Cohort 2 Median 163000 186000 nd nd 164000 185000 Average 156000 177000 nd nd 156000 176000 Stdev 48500 52700 nd nd 49600 53700 p(t-test) 0.060 nd nd 0.10 Min 2920 76700 nd nd 2920 76700 Max 259000 255000 nd nd 259000 255000 n (Samp) 96 23 nd nd 82 22 n (Patient) 96 23 nd nd 82 22 At Enrollment sCr or UO sCr only UO only AUC 0.64 nd 0.62 SE 0.068 nd 0.070 p 0.043 nd 0.077 nCohort 1 96 nd 82 nCohort 2 23 nd 22 Cutoff 1 152000 nd 152000 Sens 1 74% nd 73% Spec 1 46% nd 44% Cutoff 2 118000 nd 118000 Sens 2 83% nd 82% Spec 2 25% nd 26% Cutoff 3 95000 nd 95000 Sens 3 91% nd 91% Spec 3 16% nd 16% Cutoff 4 184000 nd 184000 Sens 4 52% nd 50% Spec 4 71% nd 71% Cutoff 5 197000 nd 197000 Sens 5 48% nd 45% Spec 5 80% nd 80% Cutoff 6 216000 nd 211000 Sens 6 30% nd 36% Spec 6 91% nd 90% OR 2 Quart 0.53 nd 0.55 p Value 0.42 nd 0.45 95% CI of 0.12 nd 0.12 OR Quart 2 2.5 nd 2.6 OR Quart 3 0.74 nd 0.76 p Value 0.68 nd 0.71 95% CI of 0.18 nd 0.18 OR Quart 3 3.1 nd 3.2 OR Quart 4 2.8 nd 2.6 p Value 0.100 nd 0.13 95% CI of 0.82 nd 0.75 OR Quart 4 9.4 nd 9.2
TABLE-US-00148 Calcitonin sCr or UO sCr only UO only Cohort 1 Cohort 2 Cohort 1 Cohort 2 Cohort 1 Cohort 2 Median 47.5 115 52.6 180 60.8 71.7 Average 413 529 417 843 447 444 Stdev 1040 747 987 916 1110 701 p(t-test) 0.53 0.21 0.99 Min 0.0604 4.98 0.0604 32.3 0.0604 4.98 Max 6590 2390 6590 2090 6590 2390 n (Samp) 140 36 166 9 112 31 n (Patient) 140 36 166 9 112 31 At Enrollment sCr or UO sCr only UO only AUC 0.60 0.73 0.56 SE 0.055 0.098 0.060 p 0.068 0.019 0.34 nCohort 1 140 166 112 nCohort 2 36 9 31 Cutoff 1 29.7 66.5 23.1 Sens 1 72% 78% 71% Spec 1 44% 54% 37% Cutoff 2 12.8 48.5 12.5 Sens 2 81% 89% 81% Spec 2 28% 50% 27% Cutoff 3 6.55 32.0 6.55 Sens 3 92% 100% 90% Spec 3 14% 44% 12% Cutoff 4 151 168 162 Sens 4 47% 56% 42% Spec 4 70% 70% 71% Cutoff 5 304 373 316 Sens 5 39% 44% 35% Spec 5 80% 80% 80% Cutoff 6 978 1310 1580 Sens 6 25% 33% 13% Spec 6 90% 90% 90% OR Quart 2 1.9 >2.0 1.6 p Value 0.27 <0.56 0.42 95% CI of 0.61 >0.18 0.51 OR Quart 2 5.7 na 5.1 OR Quart 3 1.0 >3.1 0.78 p Value 1.0 <0.33 0.71 95% CI of 0.30 >0.31 0.21 OR Quart 3 3.4 na 2.8 OR Quart 4 3.0 >4.3 2.1 p Value 0.047 <0.20 0.19 95% CI of 1.0 >0.46 0.69 OR Quart 4 8.6 na 6.6
TABLE-US-00149 C-reactive protein sCr or UO sCr only UO only Co- Co- Cohort Cohort hort hort Cohort Cohort 1 2 1 2 1 2 Median 53500 45900 nd nd 53900 45000 Average 59000 50800 nd nd 60700 50000 Stdev 50000 20700 nd nd 52800 20800 p(t-test) 0.45 nd nd 0.36 Min 1.00E-9 20600 nd nd 7110 20600 Max 444000 96500 nd nd 444000 96500 n 96 23 nd nd 82 22 (Samp) n 96 23 nd nd 82 22 (Patient) At Enrollment sCr or UO sCr only UO only AUC 0.46 nd 0.44 SE 0.068 nd 0.071 p 0.60 nd 0.39 nCohort 96 nd 82 1 nCohort 23 nd 22 2 Cutoff 1 33300 nd 33300 Sens 1 74% nd 73% Spec 1 21% nd 17% Cutoff 2 32200 nd 32200 Sens 2 83% nd 82% Spec 2 20% nd 17% Cutoff 3 28300 nd 28100 Sens 3 91% nd 91% Spec 3 16% nd 13% Cutoff 4 70000 nd 70000 Sens 4 9% nd 9% Spec 4 89% nd 89% Cutoff 5 70000 nd 70000 Sens 5 9% nd 9% Spec 5 89% nd 89% Cutoff 6 77000 nd 72800 Sens 6 4% nd 9% Spec 6 91% nd 90% OR 1.6 nd 4.4 Quart 2 p Value 0.49 nd 0.083 95% 0.41 nd 0.82 CI of OR 6.5 nd 24 Quart 2 OR 1.6 nd 3.6 Quart 3 p Value 0.49 nd 0.14 95% 0.41 nd 0.65 CI of OR 6.5 nd 20 Quart 3 OR 2.1 nd 4.4 Quart 4 p Value 0.29 nd 0.083 95% 0.53 nd 0.82 CI of OR 8.0 nd 24 Quart 4
TABLE-US-00150 Tissue factor sCr or UO sCr only UO only Cohort 1 Cohort 2 Cohort 1 Cohort 2 Cohort 1 Cohort 2 Median 0.409 0.564 0.436 0.976 0.398 0.482 Average 0.549 0.694 0.552 1.13 0.527 0.583 Stdev 0.571 0.715 0.571 0.921 0.559 0.562 p(t-test) 0.20 0.0046 0.63 Min 0.00841 0.00841 0.00841 0.297 0.00841 0.00841 Max 2.67 2.85 2.67 2.85 2.67 2.43 n (Samp) 140 36 166 9 112 31 n (Patient) 140 36 166 9 112 31 At Enrollment sCr or UO sCr only UO only AUC 0.56 0.71 0.54 SE 0.055 0.099 0.059 p 0.28 0.032 0.45 nCohort 1 140 166 112 nCohort 2 36 9 31 Cutoff 1 0.286 0.336 0.280 Sens 1 75% 78% 71% Spec 1 37% 40% 37% Cutoff 2 0 0.297 0 Sens 2 100% 89% 100% Spec 2 0% 37% 0% Cutoff 3 0 0.286 0 Sens 3 100% 100% 100% Spec 3 0% 36% 0% Cutoff 4 0.674 0.678 0.641 Sens 4 44% 67% 48% Spec 4 70% 70% 71% Cutoff 5 0.970 0.948 0.945 Sens 5 25% 56% 19% Spec 5 81% 80% 81% Cutoff 6 1.30 1.31 1.23 Sens 6 14% 22% 10% Spec 6 90% 91% 90% OR Quart 2 1.2 >3.1 4.7 p Value 0.79 <0.33 0.028 95% CI of 0.40 >0.31 1.2 OR Quart 2 3.3 na 19 OR Quart 3 1.0 >0 3.0 p Value 1.0 <na 0.12 95% CI of 0.34 >na 0.74 OR Quart 3 3.0 na 13 OR Quart 4 1.5 >6.8 3.6 p Value 0.44 <0.082 0.076 95% CI of 0.54 >0.78 0.87 OR Quart 4 4.2 na 14
TABLE-US-00151 Fibrinogen sCr or UO sCr only UO only Cohort 1 Cohort 2 Cohort 1 Cohort 2 Cohort 1 Cohort 2 Median 1410 1200 nd nd 1460 1150 Average 1520 1370 nd nd 1540 1360 Stdev 747 772 nd nd 728 788 p(t-test) 0.40 nd nd 0.29 Min 16.3 256 nd nd 391 256 Max 4630 3370 nd nd 4630 3370 n (Samp) 96 23 nd nd 82 22 n (Patient) 96 23 nd nd 82 22 At Enrollment sCr or UO sCr only UO only AUC 0.43 nd 0.40 SE 0.068 nd 0.071 p 0.30 nd 0.17 nCohort 1 96 nd 82 nCohort 2 23 nd 22 Cutoff 1 990 nd 990 Sens 1 74% nd 73% Spec 1 28% nd 26% Cutoff 2 763 nd 759 Sens 2 83% nd 82% Spec 2 12% nd 11% Cutoff 3 661 nd 661 Sens 3 91% nd 91% Spec 3 7% nd 6% Cutoff 4 1770 nd 1780 Sens 4 17% nd 18% Spec 4 71% nd 71% Cutoff 5 2070 nd 2070 Sens 5 13% nd 14% Spec 5 80% nd 80% Cutoff 6 2450 nd 2370 Sens 6 9% nd 9% Spec 6 91% nd 90% OR Quart 2 2.0 nd 1.3 p Value 0.32 nd 0.71 95% CI of 0.51 nd 0.31 OR Quart 2 7.6 nd 5.6 OR Quart 3 1.6 nd 2.0 p Value 0.49 nd 0.31 95% CI of 0.41 nd 0.51 OR Quart 3 6.5 nd 8.0 OR Quart 4 1.7 nd 1.6 p Value 0.45 nd 0.48 95% CI of 0.42 nd 0.41 OR Quart 4 6.8 nd 6.7
TABLE-US-00152 Interleukin-5 sCr or UO sCr only UO only Cohort 1 Cohort 2 Cohort 1 Cohort 2 Cohort 1 Cohort 2 Median 0.705 0.790 nd nd 0.776 0.855 Average 3.82 2.96 nd nd 4.33 3.09 Stdev 15.0 8.94 nd nd 16.2 9.13 p(t-test) 0.79 nd nd 0.73 Min 1.00E-9 1.00E-9 nd nd 1.00E-9 1.00E-9 Max 120 43.4 nd nd 120 43.4 n (Samp) 96 23 nd nd 82 22 n (Patient) 96 23 nd nd 82 22 At Enrollment sCr or UO sCr only UO only AUC 0.45 nd 0.44 SE 0.068 nd 0.071 p 0.48 nd 0.43 nCohort 1 96 nd 82 nCohort 2 23 nd 22 Cutoff 1 0.100 nd 0.100 Sens 1 74% nd 73% Spec 1 10% nd 7% Cutoff 2 0.0826 nd 0.0915 Sens 2 83% nd 82% Spec 2 8% nd 6% Cutoff 3 0.0309 nd 1.00E-9 Sens 3 91% nd 91% Spec 3 5% nd 4% Cutoff 4 1.55 nd 1.57 Sens 4 22% nd 23% Spec 4 71% nd 71% Cutoff 5 2.23 nd 2.41 Sens 5 17% nd 14% Spec 5 80% nd 80% Cutoff 6 3.48 nd 3.48 Sens 6 13% nd 14% Spec 6 91% nd 90% OR Quart 2 1.5 nd 1.3 p Value 0.52 nd 0.73 95% CI of 0.42 nd 0.33 OR Quart 2 5.5 nd 4.8 OR Quart 3 0.56 nd 0.76 p Value 0.45 nd 0.71 95% CI of 0.12 nd 0.18 OR Quart 3 2.6 nd 3.2 OR Quart 4 1.9 nd 1.5 p Value 0.32 nd 0.51 95% CI of 0.54 nd 0.42 OR Quart 4 6.7 nd 5.7
TABLE-US-00153 Interleukin-6 receptor subunit beta sCr or UO sCr only UO only Cohort 1 Cohort 2 Cohort 1 Cohort 2 Cohort 1 Cohort 2 Median 141000 138000 142000 137000 148000 141000 Average 138000 136000 138000 138000 143000 136000 Stdev 37400 49000 41500 25100 36500 53900 p(t-test) 0.89 0.96 0.54 Min 40800 38400 38400 115000 40800 38400 Max 231000 275000 275000 186000 231000 275000 n 58 18 69 7 50 14 (Samp) n 58 18 69 7 50 14 (Patient) At Enrollment sCr or UO sCr only UO only AUC 0.46 0.49 0.41 SE 0.079 0.12 0.089 P 0.59 0.95 0.33 nCohort 58 69 50 1 nCohort 18 7 14 2 Cutoff 1 116000 120000 116000 Sens 1 72% 71% 71% Spec 1 31% 33% 30% Cutoff 2 114000 116000 87800 Sens 2 83% 86% 86% Spec 2 28% 32% 8% Cutoff 3 74900 114000 74900 Sens 3 94% 100% 93% Spec 3 5% 28% 4% Cutoff 4 163000 161000 165000 Sens 4 17% 14% 14% Spec 4 71% 71% 70% Cutoff 5 169000 169000 173000 Sens 5 17% 14% 14% Spec 5 81% 81% 80% Cutoff 6 182000 182000 186000 Sens 6 11% 14% 7% Spec 6 91% 91% 90% OR 1.9 1.0 1.6 Quart 2 p Value 0.43 1.0 0.63 95% 0.38 0.058 0.23 CI of OR 9.4 17 11 Quart 2 OR 3.1 6.4 4.2 Quart 3 p Value 0.15 0.11 0.12 95% 0.66 0.67 0.70 CI of OR 15 61 25 Quart 3 OR 1.0 0 1.6 Quart 4 p Value 1.0 na 0.63 95% 0.17 na 0.23 CI of OR 5.7 na 11 Quart 4
TABLE-US-00154 Macrophage metalloelastase sCr or UO sCr only UO only Cohort 1 Cohort 2 Cohort 1 Cohort 2 Cohort 1 Cohort 2 Median 36.8 36.8 nd nd 36.8 36.8 Average 26.9 35.0 nd nd 26.6 34.7 Stdev 23.3 18.0 nd nd 23.6 19.7 p(t-test) 0.40 nd nd 0.45 Min 1.00E-9 1.00E-9 nd nd 1.00E-9 1.00E-9 Max 61.3 61.3 nd nd 61.3 61.3 n (Samp) 26 7 nd nd 23 6 n (Patient) 26 7 nd nd 23 6 At Enrollment sCr or UO sCr only UO only AUC 0.59 nd 0.59 SE 0.13 nd 0.14 p 0.50 nd 0.51 nCohort 1 26 nd 23 nCohort 2 7 nd 6 Cutoff 1 1.00E-9 nd 1.00E-9 Sens 1 86% nd 83% Spec 1 38% nd 39% Cutoff 2 1.00E-9 nd 1.00E-9 Sens 2 86% nd 83% Spec 2 38% nd 39% Cutoff 3 0 nd 0 Sens 3 100% nd 100% Spec 3 0% nd 0% Cutoff 4 36.8 nd 36.8 Sens 4 14% nd 17% Spec 4 81% nd 83% Cutoff 5 36.8 nd 36.8 Sens 5 14% nd 17% Spec 5 81% nd 83% Cutoff 6 61.3 nd 61.3 Sens 6 0% nd 0% Spec 6 100% nd 100% OR Quart 2 >8.0 nd >9.3 p Value <0.10 nd <0.089 95% CI of >0.66 nd >0.71 OR Quart 2 na nd na OR Quart 3 >2.7 nd >1.2 p Value <0.46 nd <0.92 95% CI of >0.19 nd >0.059 OR Quart 3 na nd na OR Quart 4 >1.0 nd >1.0 p Value <1.0 nd <1.0 95% CI of >0.053 nd >0.052 OR Quart 4 na nd na
TABLE-US-00155 Sex hormone-binding globulin sCr or UO sCr only UO only Cohort 1 Cohort 2 Cohort 1 Cohort 2 Cohort 1 Cohort 2 Median 33.8 36.0 34.6 27.2 33.8 36.0 Average 37.2 37.2 37.5 28.6 37.9 38.5 Stdev 17.4 13.8 16.8 7.66 18.4 14.0 p(t-test) 1.00 0.12 0.86 Min 7.75 14.6 7.75 14.6 7.75 14.6 Max 139 64.8 139 41.3 139 64.8 n (Samp) 140 36 166 9 112 31 n (Patient) 140 36 166 9 112 31 At Enrollment sCr or UO sCr only UO only AUC 0.52 0.32 0.55 SE 0.055 0.10 0.059 p 0.65 0.071 0.43 nCohort 1 140 166 112 nCohort 2 36 9 31 Cutoff 1 28.2 26.2 29.7 Sens 1 72% 78% 71% Spec 1 32% 22% 39% Cutoff 2 26.8 24.6 27.6 Sens 2 81% 89% 81% Spec 2 25% 19% 29% Cutoff 3 20.1 10.1 20.3 Sens 3 92% 100% 90% Spec 3 9% 1% 7% Cutoff 4 41.3 41.6 41.3 Sens 4 28% 0% 32% Spec 4 70% 71% 71% Cutoff 5 46.4 48.6 46.5 Sens 5 25% 0% 29% Spec 5 80% 80% 80% Cutoff 6 57.7 58.1 59.6 Sens 6 11% 0% 13% Spec 6 90% 90% 90% OR Quart 2 0.85 >2.1 0.97 p Value 0.78 <0.55 0.96 95% CI of 0.28 >0.18 0.28 OR Quart 2 2.6 na 3.3 OR Quart 3 1.7 >3.2 1.9 p Value 0.31 <0.32 0.29 95% CI of 0.61 >0.32 0.59 OR Quart 3 4.6 na 5.8 OR Quart 4 1.2 >4.5 1.6 p Value 0.79 <0.19 0.42 95% CI of 0.40 >0.48 0.51 OR Quart 4 3.3 na 5.1
Example 7
Kidney Injury Markers for Evaluating Mortality Risk in Patients
[0169] Patients from the intensive care unit (ICU) were enrolled in the following study. Each patient was classified by kidney status as non-injury (O), risk of injury (R), injury (I), and failure (F) according to the maximum stage reached within 48 hours of enrollment as determined by the RIFLE criteria. EDTA anti-coagulated blood samples (10 mL) and a urine samples (25-30 mL) were collected from each patient at the time of enrollment into the study. Markers were each measured by standard immunoassay methods using commercially available assay reagents in the urine samples and the plasma component of the blood samples collected.
[0170] The patient population was segregated based on the marker concentrations using threshold values which divided the population into thirds ("tertiles"). Patients with marker concentrations in the lower, middle, and upper third comprise the first, second, and third tertiles, respectively. The relative risk of AKI-related mortality within 7, 14, and 28 days was calculated for the second and third tertiles, relative to a value of 1 for the first tertile, as indicated in the following table. "AKI-related mortality" or "AKI-related death" was defined as death accompanied by a minimum RIFLE stage of R.
TABLE-US-00156 TABLE 13 Relative risk of AKI-related death within 7, 14, and 28 days from enrollment for the third tertile compared to the first tertile of marker concentrations. Total Number Relative Total of AKI- Risk for Number of related Marker Third Tertile p Patients Deaths AKI-Related Alpha-2 Macroglobulin 5.5 0.02 355 16 Death within 7 Apolipoprotein B-100 5.0 0.04 356 16 Days after enrollment AKI-Related Alpha-2 Macroglobulin 4.3 0.02 355 20 Death within 14 Apolipoprotein B-100 4.0 0.03 356 20 Days after enrollment AKI-Related Alpha-2 Macroglobulin 4.3 0.02 355 22 Death within 28 Apolipoprotein B-100 3.0 0.05 356 22 Days after enrollment
[0171] While the invention has been described and exemplified in sufficient detail for those skilled in this art to make and use it, various alternatives, modifications, and improvements should be apparent without departing from the spirit and scope of the invention. The examples provided herein are representative of preferred embodiments, are exemplary, and are not intended as limitations on the scope of the invention. Modifications therein and other uses will occur to those skilled in the art. These modifications are encompassed within the spirit of the invention and are defined by the scope of the claims.
[0172] It will be readily apparent to a person skilled in the art that varying substitutions and modifications may be made to the invention disclosed herein without departing from the scope and spirit of the invention.
[0173] All patents and publications mentioned in the specification are indicative of the levels of those of ordinary skill in the art to which the invention pertains. All patents and publications are herein incorporated by reference to the same extent as if each individual publication was specifically and individually indicated to be incorporated by reference.
[0174] The invention illustratively described herein suitably may be practiced in the absence of any element or elements, limitation or limitations which is not specifically disclosed herein. Thus, for example, in each instance herein any of the terms "comprising", "consisting essentially of" and "consisting of" may be replaced with either of the other two terms. The terms and expressions which have been employed are used as terms of description and not of limitation, and there is no intention that in the use of such terms and expressions of excluding any equivalents of the features shown and described or portions thereof, but it is recognized that various modifications are possible within the scope of the invention claimed. Thus, it should be understood that although the present invention has been specifically disclosed by preferred embodiments and optional features, modification and variation of the concepts herein disclosed may be resorted to by those skilled in the art, and that such modifications and variations are considered to be within the scope of this invention as defined by the appended claims.
[0175] Other embodiments are set forth within the following claims.
Sequence CWU
1
1
191134PRTHomo sapiens 1Met Arg Met Leu Leu His Leu Ser Leu Leu Ala Leu Gly
Ala Ala Tyr 1 5 10 15
Val Tyr Ala Ile Pro Thr Glu Ile Pro Thr Ser Ala Leu Val Lys Glu
20 25 30 Thr Leu Ala Leu
Leu Ser Thr His Arg Thr Leu Leu Ile Ala Asn Glu 35
40 45 Thr Leu Arg Ile Pro Val Pro Val His
Lys Asn His Gln Leu Cys Thr 50 55
60 Glu Glu Ile Phe Gln Gly Ile Gly Thr Leu Glu Ser Gln
Thr Val Gln 65 70 75
80 Gly Gly Thr Val Glu Arg Leu Phe Lys Asn Leu Ser Leu Ile Lys Lys
85 90 95 Tyr Ile Asp Gly
Gln Lys Lys Lys Cys Gly Glu Glu Arg Arg Arg Val 100
105 110 Asn Gln Phe Leu Asp Tyr Leu Gln Glu
Phe Leu Gly Val Met Asn Thr 115 120
125 Glu Trp Ile Ile Glu Ser 130
2918PRTHomo sapiens 2Met Leu Thr Leu Gln Thr Trp Leu Val Gln Ala Leu Phe
Ile Phe Leu 1 5 10 15
Thr Thr Glu Ser Thr Gly Glu Leu Leu Asp Pro Cys Gly Tyr Ile Ser
20 25 30 Pro Glu Ser Pro
Val Val Gln Leu His Ser Asn Phe Thr Ala Val Cys 35
40 45 Val Leu Lys Glu Lys Cys Met Asp Tyr
Phe His Val Asn Ala Asn Tyr 50 55
60 Ile Val Trp Lys Thr Asn His Phe Thr Ile Pro Lys Glu
Gln Tyr Thr 65 70 75
80 Ile Ile Asn Arg Thr Ala Ser Ser Val Thr Phe Thr Asp Ile Ala Ser
85 90 95 Leu Asn Ile Gln
Leu Thr Cys Asn Ile Leu Thr Phe Gly Gln Leu Glu 100
105 110 Gln Asn Val Tyr Gly Ile Thr Ile Ile
Ser Gly Leu Pro Pro Glu Lys 115 120
125 Pro Lys Asn Leu Ser Cys Ile Val Asn Glu Gly Lys Lys Met
Arg Cys 130 135 140
Glu Trp Asp Gly Gly Arg Glu Thr His Leu Glu Thr Asn Phe Thr Leu 145
150 155 160 Lys Ser Glu Trp Ala
Thr His Lys Phe Ala Asp Cys Lys Ala Lys Arg 165
170 175 Asp Thr Pro Thr Ser Cys Thr Val Asp Tyr
Ser Thr Val Tyr Phe Val 180 185
190 Asn Ile Glu Val Trp Val Glu Ala Glu Asn Ala Leu Gly Lys Val
Thr 195 200 205 Ser
Asp His Ile Asn Phe Asp Pro Val Tyr Lys Val Lys Pro Asn Pro 210
215 220 Pro His Asn Leu Ser Val
Ile Asn Ser Glu Glu Leu Ser Ser Ile Leu 225 230
235 240 Lys Leu Thr Trp Thr Asn Pro Ser Ile Lys Ser
Val Ile Ile Leu Lys 245 250
255 Tyr Asn Ile Gln Tyr Arg Thr Lys Asp Ala Ser Thr Trp Ser Gln Ile
260 265 270 Pro Pro
Glu Asp Thr Ala Ser Thr Arg Ser Ser Phe Thr Val Gln Asp 275
280 285 Leu Lys Pro Phe Thr Glu Tyr
Val Phe Arg Ile Arg Cys Met Lys Glu 290 295
300 Asp Gly Lys Gly Tyr Trp Ser Asp Trp Ser Glu Glu
Ala Ser Gly Ile 305 310 315
320 Thr Tyr Glu Asp Arg Pro Ser Lys Ala Pro Ser Phe Trp Tyr Lys Ile
325 330 335 Asp Pro Ser
His Thr Gln Gly Tyr Arg Thr Val Gln Leu Val Trp Lys 340
345 350 Thr Leu Pro Pro Phe Glu Ala Asn
Gly Lys Ile Leu Asp Tyr Glu Val 355 360
365 Thr Leu Thr Arg Trp Lys Ser His Leu Gln Asn Tyr Thr
Val Asn Ala 370 375 380
Thr Lys Leu Thr Val Asn Leu Thr Asn Asp Arg Tyr Leu Ala Thr Leu 385
390 395 400 Thr Val Arg Asn
Leu Val Gly Lys Ser Asp Ala Ala Val Leu Thr Ile 405
410 415 Pro Ala Cys Asp Phe Gln Ala Thr His
Pro Val Met Asp Leu Lys Ala 420 425
430 Phe Pro Lys Asp Asn Met Leu Trp Val Glu Trp Thr Thr Pro
Arg Glu 435 440 445
Ser Val Lys Lys Tyr Ile Leu Glu Trp Cys Val Leu Ser Asp Lys Ala 450
455 460 Pro Cys Ile Thr Asp
Trp Gln Gln Glu Asp Gly Thr Val His Arg Thr 465 470
475 480 Tyr Leu Arg Gly Asn Leu Ala Glu Ser Lys
Cys Tyr Leu Ile Thr Val 485 490
495 Thr Pro Val Tyr Ala Asp Gly Pro Gly Ser Pro Glu Ser Ile Lys
Ala 500 505 510 Tyr
Leu Lys Gln Ala Pro Pro Ser Lys Gly Pro Thr Val Arg Thr Lys 515
520 525 Lys Val Gly Lys Asn Glu
Ala Val Leu Glu Trp Asp Gln Leu Pro Val 530 535
540 Asp Val Gln Asn Gly Phe Ile Arg Asn Tyr Thr
Ile Phe Tyr Arg Thr 545 550 555
560 Ile Ile Gly Asn Glu Thr Ala Val Asn Val Asp Ser Ser His Thr Glu
565 570 575 Tyr Thr
Leu Ser Ser Leu Thr Ser Asp Thr Leu Tyr Met Val Arg Met 580
585 590 Ala Ala Tyr Thr Asp Glu Gly
Gly Lys Asp Gly Pro Glu Phe Thr Phe 595 600
605 Thr Thr Pro Lys Phe Ala Gln Gly Glu Ile Glu Ala
Ile Val Val Pro 610 615 620
Val Cys Leu Ala Phe Leu Leu Thr Thr Leu Leu Gly Val Leu Phe Cys 625
630 635 640 Phe Asn Lys
Arg Asp Leu Ile Lys Lys His Ile Trp Pro Asn Val Pro 645
650 655 Asp Pro Ser Lys Ser His Ile Ala
Gln Trp Ser Pro His Thr Pro Pro 660 665
670 Arg His Asn Phe Asn Ser Lys Asp Gln Met Tyr Ser Asp
Gly Asn Phe 675 680 685
Thr Asp Val Ser Val Val Glu Ile Glu Ala Asn Asp Lys Lys Pro Phe 690
695 700 Pro Glu Asp Leu
Lys Ser Leu Asp Leu Phe Lys Lys Glu Lys Ile Asn 705 710
715 720 Thr Glu Gly His Ser Ser Gly Ile Gly
Gly Ser Ser Cys Met Ser Ser 725 730
735 Ser Arg Pro Ser Ile Ser Ser Ser Asp Glu Asn Glu Ser Ser
Gln Asn 740 745 750
Thr Ser Ser Thr Val Gln Tyr Ser Thr Val Val His Ser Gly Tyr Arg
755 760 765 His Gln Val Pro
Ser Val Gln Val Phe Ser Arg Ser Glu Ser Thr Gln 770
775 780 Pro Leu Leu Asp Ser Glu Glu Arg
Pro Glu Asp Leu Gln Leu Val Asp 785 790
795 800 His Val Asp Gly Gly Asp Gly Ile Leu Pro Arg Gln
Gln Tyr Phe Lys 805 810
815 Gln Asn Cys Ser Gln His Glu Ser Ser Pro Asp Ile Ser His Phe Glu
820 825 830 Arg Ser Lys
Gln Val Ser Ser Val Asn Glu Glu Asp Phe Val Arg Leu 835
840 845 Lys Gln Gln Ile Ser Asp His Ile
Ser Gln Ser Cys Gly Ser Gly Gln 850 855
860 Met Lys Met Phe Gln Glu Val Ser Ala Ala Asp Ala Phe
Gly Pro Gly 865 870 875
880 Thr Glu Gly Gln Val Glu Arg Phe Glu Thr Val Gly Met Glu Ala Ala
885 890 895 Thr Asp Glu Gly
Met Pro Lys Ser Tyr Leu Pro Gln Thr Val Arg Gln 900
905 910 Gly Gly Tyr Met Pro Gln 915
35PRTHomo sapiens 3Arg Pro Ser Lys Ala 1 5
45PRTHomo sapiens 4Asn Ile Ala Ser Phe 1 5 5295PRTHomo
sapiens 5Met Glu Thr Pro Ala Trp Pro Arg Val Pro Arg Pro Glu Thr Ala Val
1 5 10 15 Ala Arg
Thr Leu Leu Leu Gly Trp Val Phe Ala Gln Val Ala Gly Ala 20
25 30 Ser Gly Thr Thr Asn Thr Val
Ala Ala Tyr Asn Leu Thr Trp Lys Ser 35 40
45 Thr Asn Phe Lys Thr Ile Leu Glu Trp Glu Pro Lys
Pro Val Asn Gln 50 55 60
Val Tyr Thr Val Gln Ile Ser Thr Lys Ser Gly Asp Trp Lys Ser Lys 65
70 75 80 Cys Phe Tyr
Thr Thr Asp Thr Glu Cys Asp Leu Thr Asp Glu Ile Val 85
90 95 Lys Asp Val Lys Gln Thr Tyr Leu
Ala Arg Val Phe Ser Tyr Pro Ala 100 105
110 Gly Asn Val Glu Ser Thr Gly Ser Ala Gly Glu Pro Leu
Tyr Glu Asn 115 120 125
Ser Pro Glu Phe Thr Pro Tyr Leu Glu Thr Asn Leu Gly Gln Pro Thr 130
135 140 Ile Gln Ser Phe
Glu Gln Val Gly Thr Lys Val Asn Val Thr Val Glu 145 150
155 160 Asp Glu Arg Thr Leu Val Arg Arg Asn
Asn Thr Phe Leu Ser Leu Arg 165 170
175 Asp Val Phe Gly Lys Asp Leu Ile Tyr Thr Leu Tyr Tyr Trp
Lys Ser 180 185 190
Ser Ser Ser Gly Lys Lys Thr Ala Lys Thr Asn Thr Asn Glu Phe Leu
195 200 205 Ile Asp Val Asp
Lys Gly Glu Asn Tyr Cys Phe Ser Val Gln Ala Val 210
215 220 Ile Pro Ser Arg Thr Val Asn Arg
Lys Ser Thr Asp Ser Pro Val Glu 225 230
235 240 Cys Met Gly Gln Glu Lys Gly Glu Phe Arg Glu Ile
Phe Tyr Ile Ile 245 250
255 Gly Ala Val Val Phe Val Val Ile Ile Leu Val Ile Ile Leu Ala Ile
260 265 270 Ser Leu His
Lys Cys Arg Lys Ala Gly Val Gly Gln Ser Trp Lys Glu 275
280 285 Asn Ser Pro Leu Asn Val Ser
290 295 6402PRTHomo sapiens 6Met Glu Ser Arg Gly Pro Leu
Ala Thr Ser Arg Leu Leu Leu Leu Leu 1 5
10 15 Leu Leu Leu Leu Leu Arg His Thr Arg Gln Gly
Trp Ala Leu Arg Pro 20 25
30 Val Leu Pro Thr Gln Ser Ala His Asp Pro Pro Ala Val His Leu
Ser 35 40 45 Asn
Gly Pro Gly Gln Glu Pro Ile Ala Val Met Thr Phe Asp Leu Thr 50
55 60 Lys Ile Thr Lys Thr Ser
Ser Ser Phe Glu Val Arg Thr Trp Asp Pro 65 70
75 80 Glu Gly Val Ile Phe Tyr Gly Asp Thr Asn Pro
Lys Asp Asp Trp Phe 85 90
95 Met Leu Gly Leu Arg Asp Gly Arg Pro Glu Ile Gln Leu His Asn His
100 105 110 Trp Ala
Gln Leu Thr Val Gly Ala Gly Pro Arg Leu Asp Asp Gly Arg 115
120 125 Trp His Gln Val Glu Val Lys
Met Glu Gly Asp Ser Val Leu Leu Glu 130 135
140 Val Asp Gly Glu Glu Val Leu Arg Leu Arg Gln Val
Ser Gly Pro Leu 145 150 155
160 Thr Ser Lys Arg His Pro Ile Met Arg Ile Ala Leu Gly Gly Leu Leu
165 170 175 Phe Pro Ala
Ser Asn Leu Arg Leu Pro Leu Val Pro Ala Leu Asp Gly 180
185 190 Cys Leu Arg Arg Asp Ser Trp Leu
Asp Lys Gln Ala Glu Ile Ser Ala 195 200
205 Ser Ala Pro Thr Ser Leu Arg Ser Cys Asp Val Glu Ser
Asn Pro Gly 210 215 220
Ile Phe Leu Pro Pro Gly Thr Gln Ala Glu Phe Asn Leu Arg Asp Ile 225
230 235 240 Pro Gln Pro His
Ala Glu Pro Trp Ala Phe Ser Leu Asp Leu Gly Leu 245
250 255 Lys Gln Ala Ala Gly Ser Gly His Leu
Leu Ala Leu Gly Thr Pro Glu 260 265
270 Asn Pro Ser Trp Leu Ser Leu His Leu Gln Asp Gln Lys Val
Val Leu 275 280 285
Ser Ser Gly Ser Gly Pro Gly Leu Asp Leu Pro Leu Val Leu Gly Leu 290
295 300 Pro Leu Gln Leu Lys
Leu Ser Met Ser Arg Val Val Leu Ser Gln Gly 305 310
315 320 Ser Lys Met Lys Ala Leu Ala Leu Pro Pro
Leu Gly Leu Ala Pro Leu 325 330
335 Leu Asn Leu Trp Ala Lys Pro Gln Gly Arg Leu Phe Leu Gly Ala
Leu 340 345 350 Pro
Gly Glu Asp Ser Ser Thr Ser Phe Cys Leu Asn Gly Leu Trp Ala 355
360 365 Gln Gly Gln Arg Leu Asp
Val Asp Gln Ala Leu Asn Arg Ser His Glu 370 375
380 Ile Trp Thr His Ser Cys Pro Gln Ser Pro Gly
Asn Gly Thr Asp Ala 385 390 395
400 Ser His 71474PRTHomo sapiens 7Met Gly Lys Asn Lys Leu Leu His
Pro Ser Leu Val Leu Leu Leu Leu 1 5 10
15 Val Leu Leu Pro Thr Asp Ala Ser Val Ser Gly Lys Pro
Gln Tyr Met 20 25 30
Val Leu Val Pro Ser Leu Leu His Thr Glu Thr Thr Glu Lys Gly Cys
35 40 45 Val Leu Leu Ser
Tyr Leu Asn Glu Thr Val Thr Val Ser Ala Ser Leu 50
55 60 Glu Ser Val Arg Gly Asn Arg Ser
Leu Phe Thr Asp Leu Glu Ala Glu 65 70
75 80 Asn Asp Val Leu His Cys Val Ala Phe Ala Val Pro
Lys Ser Ser Ser 85 90
95 Asn Glu Glu Val Met Phe Leu Thr Val Gln Val Lys Gly Pro Thr Gln
100 105 110 Glu Phe Lys
Lys Arg Thr Thr Val Met Val Lys Asn Glu Asp Ser Leu 115
120 125 Val Phe Val Gln Thr Asp Lys Ser
Ile Tyr Lys Pro Gly Gln Thr Val 130 135
140 Lys Phe Arg Val Val Ser Met Asp Glu Asn Phe His Pro
Leu Asn Glu 145 150 155
160 Leu Ile Pro Leu Val Tyr Ile Gln Asp Pro Lys Gly Asn Arg Ile Ala
165 170 175 Gln Trp Gln Ser
Phe Gln Leu Glu Gly Gly Leu Lys Gln Phe Ser Phe 180
185 190 Pro Leu Ser Ser Glu Pro Phe Gln Gly
Ser Tyr Lys Val Val Val Gln 195 200
205 Lys Lys Ser Gly Gly Arg Thr Glu His Pro Phe Thr Val Glu
Glu Phe 210 215 220
Val Leu Pro Lys Phe Glu Val Gln Val Thr Val Pro Lys Ile Ile Thr 225
230 235 240 Ile Leu Glu Glu Glu
Met Asn Val Ser Val Cys Gly Leu Tyr Thr Tyr 245
250 255 Gly Lys Pro Val Pro Gly His Val Thr Val
Ser Ile Cys Arg Lys Tyr 260 265
270 Ser Asp Ala Ser Asp Cys His Gly Glu Asp Ser Gln Ala Phe Cys
Glu 275 280 285 Lys
Phe Ser Gly Gln Leu Asn Ser His Gly Cys Phe Tyr Gln Gln Val 290
295 300 Lys Thr Lys Val Phe Gln
Leu Lys Arg Lys Glu Tyr Glu Met Lys Leu 305 310
315 320 His Thr Glu Ala Gln Ile Gln Glu Glu Gly Thr
Val Val Glu Leu Thr 325 330
335 Gly Arg Gln Ser Ser Glu Ile Thr Arg Thr Ile Thr Lys Leu Ser Phe
340 345 350 Val Lys
Val Asp Ser His Phe Arg Gln Gly Ile Pro Phe Phe Gly Gln 355
360 365 Val Arg Leu Val Asp Gly Lys
Gly Val Pro Ile Pro Asn Lys Val Ile 370 375
380 Phe Ile Arg Gly Asn Glu Ala Asn Tyr Tyr Ser Asn
Ala Thr Thr Asp 385 390 395
400 Glu His Gly Leu Val Gln Phe Ser Ile Asn Thr Thr Asn Val Met Gly
405 410 415 Thr Ser Leu
Thr Val Arg Val Asn Tyr Lys Asp Arg Ser Pro Cys Tyr 420
425 430 Gly Tyr Gln Trp Val Ser Glu Glu
His Glu Glu Ala His His Thr Ala 435 440
445 Tyr Leu Val Phe Ser Pro Ser Lys Ser Phe Val His Leu
Glu Pro Met 450 455 460
Ser His Glu Leu Pro Cys Gly His Thr Gln Thr Val Gln Ala His Tyr 465
470 475 480 Ile Leu Asn Gly
Gly Thr Leu Leu Gly Leu Lys Lys Leu Ser Phe Tyr 485
490 495 Tyr Leu Ile Met Ala Lys Gly Gly Ile
Val Arg Thr Gly Thr His Gly 500 505
510 Leu Leu Val Lys Gln Glu Asp Met Lys Gly His Phe Ser Ile
Ser Ile 515 520 525
Pro Val Lys Ser Asp Ile Ala Pro Val Ala Arg Leu Leu Ile Tyr Ala 530
535 540 Val Leu Pro Thr Gly
Asp Val Ile Gly Asp Ser Ala Lys Tyr Asp Val 545 550
555 560 Glu Asn Cys Leu Ala Asn Lys Val Asp Leu
Ser Phe Ser Pro Ser Gln 565 570
575 Ser Leu Pro Ala Ser His Ala His Leu Arg Val Thr Ala Ala Pro
Gln 580 585 590 Ser
Val Cys Ala Leu Arg Ala Val Asp Gln Ser Val Leu Leu Met Lys 595
600 605 Pro Asp Ala Glu Leu Ser
Ala Ser Ser Val Tyr Asn Leu Leu Pro Glu 610 615
620 Lys Asp Leu Thr Gly Phe Pro Gly Pro Leu Asn
Asp Gln Asp Asp Glu 625 630 635
640 Asp Cys Ile Asn Arg His Asn Val Tyr Ile Asn Gly Ile Thr Tyr Thr
645 650 655 Pro Val
Ser Ser Thr Asn Glu Lys Asp Met Tyr Ser Phe Leu Glu Asp 660
665 670 Met Gly Leu Lys Ala Phe Thr
Asn Ser Lys Ile Arg Lys Pro Lys Met 675 680
685 Cys Pro Gln Leu Gln Gln Tyr Glu Met His Gly Pro
Glu Gly Leu Arg 690 695 700
Val Gly Phe Tyr Glu Ser Asp Val Met Gly Arg Gly His Ala Arg Leu 705
710 715 720 Val His Val
Glu Glu Pro His Thr Glu Thr Val Arg Lys Tyr Phe Pro 725
730 735 Glu Thr Trp Ile Trp Asp Leu Val
Val Val Asn Ser Ala Gly Val Ala 740 745
750 Glu Val Gly Val Thr Val Pro Asp Thr Ile Thr Glu Trp
Lys Ala Gly 755 760 765
Ala Phe Cys Leu Ser Glu Asp Ala Gly Leu Gly Ile Ser Ser Thr Ala 770
775 780 Ser Leu Arg Ala
Phe Gln Pro Phe Phe Val Glu Leu Thr Met Pro Tyr 785 790
795 800 Ser Val Ile Arg Gly Glu Ala Phe Thr
Leu Lys Ala Thr Val Leu Asn 805 810
815 Tyr Leu Pro Lys Cys Ile Arg Val Ser Val Gln Leu Glu Ala
Ser Pro 820 825 830
Ala Phe Leu Ala Val Pro Val Glu Lys Glu Gln Ala Pro His Cys Ile
835 840 845 Cys Ala Asn Gly
Arg Gln Thr Val Ser Trp Ala Val Thr Pro Lys Ser 850
855 860 Leu Gly Asn Val Asn Phe Thr Val
Ser Ala Glu Ala Leu Glu Ser Gln 865 870
875 880 Glu Leu Cys Gly Thr Glu Val Pro Ser Val Pro Glu
His Gly Arg Lys 885 890
895 Asp Thr Val Ile Lys Pro Leu Leu Val Glu Pro Glu Gly Leu Glu Lys
900 905 910 Glu Thr Thr
Phe Asn Ser Leu Leu Cys Pro Ser Gly Gly Glu Val Ser 915
920 925 Glu Glu Leu Ser Leu Lys Leu Pro
Pro Asn Val Val Glu Glu Ser Ala 930 935
940 Arg Ala Ser Val Ser Val Leu Gly Asp Ile Leu Gly Ser
Ala Met Gln 945 950 955
960 Asn Thr Gln Asn Leu Leu Gln Met Pro Tyr Gly Cys Gly Glu Gln Asn
965 970 975 Met Val Leu Phe
Ala Pro Asn Ile Tyr Val Leu Asp Tyr Leu Asn Glu 980
985 990 Thr Gln Gln Leu Thr Pro Glu Ile
Lys Ser Lys Ala Ile Gly Tyr Leu 995 1000
1005 Asn Thr Gly Tyr Gln Arg Gln Leu Asn Tyr Lys
His Tyr Asp Gly 1010 1015 1020
Ser Tyr Ser Thr Phe Gly Glu Arg Tyr Gly Arg Asn Gln Gly Asn
1025 1030 1035 Thr Trp Leu
Thr Ala Phe Val Leu Lys Thr Phe Ala Gln Ala Arg 1040
1045 1050 Ala Tyr Ile Phe Ile Asp Glu Ala
His Ile Thr Gln Ala Leu Ile 1055 1060
1065 Trp Leu Ser Gln Arg Gln Lys Asp Asn Gly Cys Phe Arg
Ser Ser 1070 1075 1080
Gly Ser Leu Leu Asn Asn Ala Ile Lys Gly Gly Val Glu Asp Glu 1085
1090 1095 Val Thr Leu Ser Ala
Tyr Ile Thr Ile Ala Leu Leu Glu Ile Pro 1100 1105
1110 Leu Thr Val Thr His Pro Val Val Arg Asn
Ala Leu Phe Cys Leu 1115 1120 1125
Glu Ser Ala Trp Lys Thr Ala Gln Glu Gly Asp His Gly Ser His
1130 1135 1140 Val Tyr
Thr Lys Ala Leu Leu Ala Tyr Ala Phe Ala Leu Ala Gly 1145
1150 1155 Asn Gln Asp Lys Arg Lys Glu
Val Leu Lys Ser Leu Asn Glu Glu 1160 1165
1170 Ala Val Lys Lys Asp Asn Ser Val His Trp Glu Arg
Pro Gln Lys 1175 1180 1185
Pro Lys Ala Pro Val Gly His Phe Tyr Glu Pro Gln Ala Pro Ser 1190
1195 1200 Ala Glu Val Glu Met
Thr Ser Tyr Val Leu Leu Ala Tyr Leu Thr 1205 1210
1215 Ala Gln Pro Ala Pro Thr Ser Glu Asp Leu
Thr Ser Ala Thr Asn 1220 1225 1230
Ile Val Lys Trp Ile Thr Lys Gln Gln Asn Ala Gln Gly Gly Phe
1235 1240 1245 Ser Ser
Thr Gln Asp Thr Val Val Ala Leu His Ala Leu Ser Lys 1250
1255 1260 Tyr Gly Ala Ala Thr Phe Thr
Arg Thr Gly Lys Ala Ala Gln Val 1265 1270
1275 Thr Ile Gln Ser Ser Gly Thr Phe Ser Ser Lys Phe
Gln Val Asp 1280 1285 1290
Asn Asn Asn Arg Leu Leu Leu Gln Gln Val Ser Leu Pro Glu Leu 1295
1300 1305 Pro Gly Glu Tyr Ser
Met Lys Val Thr Gly Glu Gly Cys Val Tyr 1310 1315
1320 Leu Gln Thr Ser Leu Lys Tyr Asn Ile Leu
Pro Glu Lys Glu Glu 1325 1330 1335
Phe Pro Phe Ala Leu Gly Val Gln Thr Leu Pro Gln Thr Cys Asp
1340 1345 1350 Glu Pro
Lys Ala His Thr Ser Phe Gln Ile Ser Leu Ser Val Ser 1355
1360 1365 Tyr Thr Gly Ser Arg Ser Ala
Ser Asn Met Ala Ile Val Asp Val 1370 1375
1380 Lys Met Val Ser Gly Phe Ile Pro Leu Lys Pro Thr
Val Lys Met 1385 1390 1395
Leu Glu Arg Ser Asn His Val Ser Arg Thr Glu Val Ser Ser Asn 1400
1405 1410 His Val Leu Ile Tyr
Leu Asp Lys Val Ser Asn Gln Thr Leu Ser 1415 1420
1425 Leu Phe Phe Thr Val Leu Gln Asp Val Pro
Val Arg Asp Leu Lys 1430 1435 1440
Pro Ala Ile Val Lys Val Tyr Asp Tyr Tyr Glu Thr Asp Glu Phe
1445 1450 1455 Ala Ile
Ala Glu Tyr Asn Ala Pro Cys Ser Lys Asp Leu Gly Asn 1460
1465 1470 Ala 8267PRTHomo sapiens 8Met
Lys Ala Ala Val Leu Thr Leu Ala Val Leu Phe Leu Thr Gly Ser 1
5 10 15 Gln Ala Arg His Phe Trp
Gln Gln Asp Glu Pro Pro Gln Ser Pro Trp 20
25 30 Asp Arg Val Lys Asp Leu Ala Thr Val Tyr
Val Asp Val Leu Lys Asp 35 40
45 Ser Gly Arg Asp Tyr Val Ser Gln Phe Glu Gly Ser Ala Leu
Gly Lys 50 55 60
Gln Leu Asn Leu Lys Leu Leu Asp Asn Trp Asp Ser Val Thr Ser Thr 65
70 75 80 Phe Ser Lys Leu Arg
Glu Gln Leu Gly Pro Val Thr Gln Glu Phe Trp 85
90 95 Asp Asn Leu Glu Lys Glu Thr Glu Gly Leu
Arg Gln Glu Met Ser Lys 100 105
110 Asp Leu Glu Glu Val Lys Ala Lys Val Gln Pro Tyr Leu Asp Asp
Phe 115 120 125 Gln
Lys Lys Trp Gln Glu Glu Met Glu Leu Tyr Arg Gln Lys Val Glu 130
135 140 Pro Leu Arg Ala Glu Leu
Gln Glu Gly Ala Arg Gln Lys Leu His Glu 145 150
155 160 Leu Gln Glu Lys Leu Ser Pro Leu Gly Glu Glu
Met Arg Asp Arg Ala 165 170
175 Arg Ala His Val Asp Ala Leu Arg Thr His Leu Ala Pro Tyr Ser Asp
180 185 190 Glu Leu
Arg Gln Arg Leu Ala Ala Arg Leu Glu Ala Leu Lys Glu Asn 195
200 205 Gly Gly Ala Arg Leu Ala Glu
Tyr His Ala Lys Ala Thr Glu His Leu 210 215
220 Ser Thr Leu Ser Glu Lys Ala Lys Pro Ala Leu Glu
Asp Leu Arg Gln 225 230 235
240 Gly Leu Leu Pro Val Leu Glu Ser Phe Lys Val Ser Phe Leu Ser Ala
245 250 255 Leu Glu Glu
Tyr Thr Lys Lys Leu Asn Thr Gln 260 265
9141PRTHomo sapiens 9Met Gly Phe Gln Lys Phe Ser Pro Phe Leu Ala Leu
Ser Ile Leu Val 1 5 10
15 Leu Leu Gln Ala Gly Ser Leu His Ala Ala Pro Phe Arg Ser Ala Leu
20 25 30 Glu Ser Ser
Pro Ala Asp Pro Ala Thr Leu Ser Glu Asp Glu Ala Arg 35
40 45 Leu Leu Leu Ala Ala Leu Val Gln
Asp Tyr Val Gln Met Lys Ala Ser 50 55
60 Glu Leu Glu Gln Glu Gln Glu Arg Glu Gly Ser Ser Leu
Asp Ser Pro 65 70 75
80 Arg Ser Lys Arg Cys Gly Asn Leu Ser Thr Cys Met Leu Gly Thr Tyr
85 90 95 Thr Gln Asp Phe
Asn Lys Phe His Thr Phe Pro Gln Thr Ala Ile Gly 100
105 110 Val Gly Ala Pro Gly Lys Lys Arg Asp
Met Ser Ser Asp Leu Glu Arg 115 120
125 Asp His Arg Pro His Val Ser Met Pro Gln Asn Ala Asn
130 135 140 108PRTHomo sapiens 10Val
Ser Met Pro Gln Asn Ala Asn 1 5 118PRTHomo
sapiens 11Asn His Cys Pro Glu Glu Ser Leu 1 5
12353PRTHomo sapiens 12Met Glu Leu Thr Glu Leu Leu Leu Val Val Met Leu
Leu Leu Thr Ala 1 5 10
15 Arg Leu Thr Leu Ser Ser Pro Ala Pro Pro Ala Cys Asp Leu Arg Val
20 25 30 Leu Ser Lys
Leu Leu Arg Asp Ser His Val Leu His Ser Arg Leu Ser 35
40 45 Gln Cys Pro Glu Val His Pro Leu
Pro Thr Pro Val Leu Leu Pro Ala 50 55
60 Val Asp Phe Ser Leu Gly Glu Trp Lys Thr Gln Met Glu
Glu Thr Lys 65 70 75
80 Ala Gln Asp Ile Leu Gly Ala Val Thr Leu Leu Leu Glu Gly Val Met
85 90 95 Ala Ala Arg Gly
Gln Leu Gly Pro Thr Cys Leu Ser Ser Leu Leu Gly 100
105 110 Gln Leu Ser Gly Gln Val Arg Leu Leu
Leu Gly Ala Leu Gln Ser Leu 115 120
125 Leu Gly Thr Gln Leu Pro Pro Gln Gly Arg Thr Thr Ala His
Lys Asp 130 135 140
Pro Asn Ala Ile Phe Leu Ser Phe Gln His Leu Leu Arg Gly Lys Val 145
150 155 160 Arg Phe Leu Met Leu
Val Gly Gly Ser Thr Leu Cys Val Arg Arg Ala 165
170 175 Pro Pro Thr Thr Ala Val Pro Ser Arg Thr
Ser Leu Val Leu Thr Leu 180 185
190 Asn Glu Leu Pro Asn Arg Thr Ser Gly Leu Leu Glu Thr Asn Phe
Thr 195 200 205 Ala
Ser Ala Arg Thr Thr Gly Ser Gly Leu Leu Lys Trp Gln Gln Gly 210
215 220 Phe Arg Ala Lys Ile Pro
Gly Leu Leu Asn Gln Thr Ser Arg Ser Leu 225 230
235 240 Asp Gln Ile Pro Gly Tyr Leu Asn Arg Ile His
Glu Leu Leu Asn Gly 245 250
255 Thr Arg Gly Leu Phe Pro Gly Pro Ser Arg Arg Thr Leu Gly Ala Pro
260 265 270 Asp Ile
Ser Ser Gly Thr Ser Asp Thr Gly Ser Leu Pro Pro Asn Leu 275
280 285 Gln Pro Gly Tyr Ser Pro Ser
Pro Thr His Pro Pro Thr Gly Gln Tyr 290 295
300 Thr Leu Phe Pro Leu Pro Pro Thr Leu Pro Thr Pro
Val Val Gln Leu 305 310 315
320 His Pro Leu Leu Pro Asp Pro Ser Ala Pro Thr Pro Thr Pro Thr Ser
325 330 335 Pro Leu Leu
Asn Thr Ser Tyr Thr His Ser Gln Asn Leu Ser Gln Glu 340
345 350 Gly 13224PRTHomo sapiens 13Met
Glu Lys Leu Leu Cys Phe Leu Val Leu Thr Ser Leu Ser His Ala 1
5 10 15 Phe Gly Gln Thr Asp Met
Ser Arg Lys Ala Phe Val Phe Pro Lys Glu 20
25 30 Ser Asp Thr Ser Tyr Val Ser Leu Lys Ala
Pro Leu Thr Lys Pro Leu 35 40
45 Lys Ala Phe Thr Val Cys Leu His Phe Tyr Thr Glu Leu Ser
Ser Thr 50 55 60
Arg Gly Tyr Ser Ile Phe Ser Tyr Ala Thr Lys Arg Gln Asp Asn Glu 65
70 75 80 Ile Leu Ile Phe Trp
Ser Lys Asp Ile Gly Tyr Ser Phe Thr Val Gly 85
90 95 Gly Ser Glu Ile Leu Phe Glu Val Pro Glu
Val Thr Val Ala Pro Val 100 105
110 His Ile Cys Thr Ser Trp Glu Ser Ala Ser Gly Ile Val Glu Phe
Trp 115 120 125 Val
Asp Gly Lys Pro Arg Val Arg Lys Ser Leu Lys Lys Gly Tyr Thr 130
135 140 Val Gly Ala Glu Ala Ser
Ile Ile Leu Gly Gln Glu Gln Asp Ser Phe 145 150
155 160 Gly Gly Asn Phe Glu Gly Ser Gln Ser Leu Val
Gly Asp Ile Gly Asn 165 170
175 Val Asn Met Trp Asp Phe Val Leu Ser Pro Asp Glu Ile Asn Thr Ile
180 185 190 Tyr Leu
Gly Gly Pro Phe Ser Pro Asn Val Leu Asn Trp Arg Ala Leu 195
200 205 Lys Tyr Glu Val Gln Gly Glu
Val Phe Thr Lys Pro Gln Leu Trp Pro 210 215
220 14547PRTHomo sapiens 14Met Ala Thr Met Val Pro
Ser Val Leu Trp Pro Arg Ala Cys Trp Thr 1 5
10 15 Leu Leu Val Cys Cys Leu Leu Thr Pro Gly Val
Gln Gly Gln Glu Phe 20 25
30 Leu Leu Arg Val Glu Pro Gln Asn Pro Val Leu Ser Ala Gly Gly
Ser 35 40 45 Leu
Phe Val Asn Cys Ser Thr Asp Cys Pro Ser Ser Glu Lys Ile Ala 50
55 60 Leu Glu Thr Ser Leu Ser
Lys Glu Leu Val Ala Ser Gly Met Gly Trp 65 70
75 80 Ala Ala Phe Asn Leu Ser Asn Val Thr Gly Asn
Ser Arg Ile Leu Cys 85 90
95 Ser Val Tyr Cys Asn Gly Ser Gln Ile Thr Gly Ser Ser Asn Ile Thr
100 105 110 Val Tyr
Arg Leu Pro Glu Arg Val Glu Leu Ala Pro Leu Pro Pro Trp 115
120 125 Gln Pro Val Gly Gln Asn Phe
Thr Leu Arg Cys Gln Val Glu Asp Gly 130 135
140 Ser Pro Arg Thr Ser Leu Thr Val Val Leu Leu Arg
Trp Glu Glu Glu 145 150 155
160 Leu Ser Arg Gln Pro Ala Val Glu Glu Pro Ala Glu Val Thr Ala Thr
165 170 175 Val Leu Ala
Ser Arg Asp Asp His Gly Ala Pro Phe Ser Cys Arg Thr 180
185 190 Glu Leu Asp Met Gln Pro Gln Gly
Leu Gly Leu Phe Val Asn Thr Ser 195 200
205 Ala Pro Arg Gln Leu Arg Thr Phe Val Leu Pro Val Thr
Pro Pro Arg 210 215 220
Leu Val Ala Pro Arg Phe Leu Glu Val Glu Thr Ser Trp Pro Val Asp 225
230 235 240 Cys Thr Leu Asp
Gly Leu Phe Pro Ala Ser Glu Ala Gln Val Tyr Leu 245
250 255 Ala Leu Gly Asp Gln Met Leu Asn Ala
Thr Val Met Asn His Gly Asp 260 265
270 Thr Leu Thr Ala Thr Ala Thr Ala Thr Ala Arg Ala Asp Gln
Glu Gly 275 280 285
Ala Arg Glu Ile Val Cys Asn Val Thr Leu Gly Gly Glu Arg Arg Glu 290
295 300 Ala Arg Glu Asn Leu
Thr Val Phe Ser Phe Leu Gly Pro Ile Val Asn 305 310
315 320 Leu Ser Glu Pro Thr Ala His Glu Gly Ser
Thr Val Thr Val Ser Cys 325 330
335 Met Ala Gly Ala Arg Val Gln Val Thr Leu Asp Gly Val Pro Ala
Ala 340 345 350 Ala
Pro Gly Gln Pro Ala Gln Leu Gln Leu Asn Ala Thr Glu Ser Asp 355
360 365 Asp Gly Arg Ser Phe Phe
Cys Ser Ala Thr Leu Glu Val Asp Gly Glu 370 375
380 Phe Leu His Arg Asn Ser Ser Val Gln Leu Arg
Val Leu Tyr Gly Pro 385 390 395
400 Lys Ile Asp Arg Ala Thr Cys Pro Gln His Leu Lys Trp Lys Asp Lys
405 410 415 Thr Arg
His Val Leu Gln Cys Gln Ala Arg Gly Asn Pro Tyr Pro Glu 420
425 430 Leu Arg Cys Leu Lys Glu Gly
Ser Ser Arg Glu Val Pro Val Gly Ile 435 440
445 Pro Phe Phe Val Asn Val Thr His Asn Gly Thr Tyr
Gln Cys Gln Ala 450 455 460
Ser Ser Ser Arg Gly Lys Tyr Thr Leu Val Val Val Met Asp Ile Glu 465
470 475 480 Ala Gly Ser
Ser His Phe Val Pro Val Phe Val Ala Val Leu Leu Thr 485
490 495 Leu Gly Val Val Thr Ile Val Leu
Ala Leu Met Tyr Val Phe Arg Glu 500 505
510 His Gln Arg Ser Gly Ser Tyr His Val Arg Glu Glu Ser
Thr Tyr Leu 515 520 525
Pro Leu Thr Ser Met Gln Pro Thr Glu Ala Met Gly Glu Glu Pro Ser 530
535 540 Arg Ala Glu 545
15470PRTHomo sapiens 15Met Lys Phe Leu Leu Ile Leu Leu Leu Gln Ala
Thr Ala Ser Gly Ala 1 5 10
15 Leu Pro Leu Asn Ser Ser Thr Ser Leu Glu Lys Asn Asn Val Leu Phe
20 25 30 Gly Glu
Arg Tyr Leu Glu Lys Phe Tyr Gly Leu Glu Ile Asn Lys Leu 35
40 45 Pro Val Thr Lys Met Lys Tyr
Ser Gly Asn Leu Met Lys Glu Lys Ile 50 55
60 Gln Glu Met Gln His Phe Leu Gly Leu Lys Val Thr
Gly Gln Leu Asp 65 70 75
80 Thr Ser Thr Leu Glu Met Met His Ala Pro Arg Cys Gly Val Pro Asp
85 90 95 Val His His
Phe Arg Glu Met Pro Gly Gly Pro Val Trp Arg Lys His 100
105 110 Tyr Ile Thr Tyr Arg Ile Asn Asn
Tyr Thr Pro Asp Met Asn Arg Glu 115 120
125 Asp Val Asp Tyr Ala Ile Arg Lys Ala Phe Gln Val Trp
Ser Asn Val 130 135 140
Thr Pro Leu Lys Phe Ser Lys Ile Asn Thr Gly Met Ala Asp Ile Leu 145
150 155 160 Val Val Phe Ala
Arg Gly Ala His Gly Asp Phe His Ala Phe Asp Gly 165
170 175 Lys Gly Gly Ile Leu Ala His Ala Phe
Gly Pro Gly Ser Gly Ile Gly 180 185
190 Gly Asp Ala His Phe Asp Glu Asp Glu Phe Trp Thr Thr His
Ser Gly 195 200 205
Gly Thr Asn Leu Phe Leu Thr Ala Val His Glu Ile Gly His Ser Leu 210
215 220 Gly Leu Gly His Ser
Ser Asp Pro Lys Ala Val Met Phe Pro Thr Tyr 225 230
235 240 Lys Tyr Val Asp Ile Asn Thr Phe Arg Leu
Ser Ala Asp Asp Ile Arg 245 250
255 Gly Ile Gln Ser Leu Tyr Gly Asp Pro Lys Glu Asn Gln Arg Leu
Pro 260 265 270 Asn
Pro Asp Asn Ser Glu Pro Ala Leu Cys Asp Pro Asn Leu Ser Phe 275
280 285 Asp Ala Val Thr Thr Val
Gly Asn Lys Ile Phe Phe Phe Lys Asp Arg 290 295
300 Phe Phe Trp Leu Lys Val Ser Glu Arg Pro Lys
Thr Ser Val Asn Leu 305 310 315
320 Ile Ser Ser Leu Trp Pro Thr Leu Pro Ser Gly Ile Glu Ala Ala Tyr
325 330 335 Glu Ile
Glu Ala Arg Asn Gln Val Phe Leu Phe Lys Asp Asp Lys Tyr 340
345 350 Trp Leu Ile Ser Asn Leu Arg
Pro Glu Pro Asn Tyr Pro Lys Ser Ile 355 360
365 His Ser Phe Gly Phe Pro Asn Phe Val Lys Lys Ile
Asp Ala Ala Val 370 375 380
Phe Asn Pro Arg Phe Tyr Arg Thr Tyr Phe Phe Val Asp Asn Gln Tyr 385
390 395 400 Trp Arg Tyr
Asp Glu Arg Arg Gln Met Met Asp Pro Gly Tyr Pro Lys 405
410 415 Leu Ile Thr Lys Asn Phe Gln Gly
Ile Gly Pro Lys Ile Asp Ala Val 420 425
430 Phe Tyr Ser Lys Asn Lys Tyr Tyr Tyr Phe Phe Gln Gly
Ser Asn Gln 435 440 445
Phe Glu Tyr Asp Phe Leu Leu Gln Arg Ile Thr Lys Thr Leu Lys Ser 450
455 460 Asn Ser Trp Phe
Gly Cys 465 470 164563PRTHomo sapiens 16Met Asp Pro Pro
Arg Pro Ala Leu Leu Ala Leu Leu Ala Leu Pro Ala 1 5
10 15 Leu Leu Leu Leu Leu Leu Ala Gly Ala
Arg Ala Glu Glu Glu Met Leu 20 25
30 Glu Asn Val Ser Leu Val Cys Pro Lys Asp Ala Thr Arg Phe
Lys His 35 40 45
Leu Arg Lys Tyr Thr Tyr Asn Tyr Glu Ala Glu Ser Ser Ser Gly Val 50
55 60 Pro Gly Thr Ala Asp
Ser Arg Ser Ala Thr Arg Ile Asn Cys Lys Val 65 70
75 80 Glu Leu Glu Val Pro Gln Leu Cys Ser Phe
Ile Leu Lys Thr Ser Gln 85 90
95 Cys Thr Leu Lys Glu Val Tyr Gly Phe Asn Pro Glu Gly Lys Ala
Leu 100 105 110 Leu
Lys Lys Thr Lys Asn Ser Glu Glu Phe Ala Ala Ala Met Ser Arg 115
120 125 Tyr Glu Leu Lys Leu Ala
Ile Pro Glu Gly Lys Gln Val Phe Leu Tyr 130 135
140 Pro Glu Lys Asp Glu Pro Thr Tyr Ile Leu Asn
Ile Lys Arg Gly Ile 145 150 155
160 Ile Ser Ala Leu Leu Val Pro Pro Glu Thr Glu Glu Ala Lys Gln Val
165 170 175 Leu Phe
Leu Asp Thr Val Tyr Gly Asn Cys Ser Thr His Phe Thr Val 180
185 190 Lys Thr Arg Lys Gly Asn Val
Ala Thr Glu Ile Ser Thr Glu Arg Asp 195 200
205 Leu Gly Gln Cys Asp Arg Phe Lys Pro Ile Arg Thr
Gly Ile Ser Pro 210 215 220
Leu Ala Leu Ile Lys Gly Met Thr Arg Pro Leu Ser Thr Leu Ile Ser 225
230 235 240 Ser Ser Gln
Ser Cys Gln Tyr Thr Leu Asp Ala Lys Arg Lys His Val 245
250 255 Ala Glu Ala Ile Cys Lys Glu Gln
His Leu Phe Leu Pro Phe Ser Tyr 260 265
270 Asn Asn Lys Tyr Gly Met Val Ala Gln Val Thr Gln Thr
Leu Lys Leu 275 280 285
Glu Asp Thr Pro Lys Ile Asn Ser Arg Phe Phe Gly Glu Gly Thr Lys 290
295 300 Lys Met Gly Leu
Ala Phe Glu Ser Thr Lys Ser Thr Ser Pro Pro Lys 305 310
315 320 Gln Ala Glu Ala Val Leu Lys Thr Leu
Gln Glu Leu Lys Lys Leu Thr 325 330
335 Ile Ser Glu Gln Asn Ile Gln Arg Ala Asn Leu Phe Asn Lys
Leu Val 340 345 350
Thr Glu Leu Arg Gly Leu Ser Asp Glu Ala Val Thr Ser Leu Leu Pro
355 360 365 Gln Leu Ile Glu
Val Ser Ser Pro Ile Thr Leu Gln Ala Leu Val Gln 370
375 380 Cys Gly Gln Pro Gln Cys Ser Thr
His Ile Leu Gln Trp Leu Lys Arg 385 390
395 400 Val His Ala Asn Pro Leu Leu Ile Asp Val Val Thr
Tyr Leu Val Ala 405 410
415 Leu Ile Pro Glu Pro Ser Ala Gln Gln Leu Arg Glu Ile Phe Asn Met
420 425 430 Ala Arg Asp
Gln Arg Ser Arg Ala Thr Leu Tyr Ala Leu Ser His Ala 435
440 445 Val Asn Asn Tyr His Lys Thr Asn
Pro Thr Gly Thr Gln Glu Leu Leu 450 455
460 Asp Ile Ala Asn Tyr Leu Met Glu Gln Ile Gln Asp Asp
Cys Thr Gly 465 470 475
480 Asp Glu Asp Tyr Thr Tyr Leu Ile Leu Arg Val Ile Gly Asn Met Gly
485 490 495 Gln Thr Met Glu
Gln Leu Thr Pro Glu Leu Lys Ser Ser Ile Leu Lys 500
505 510 Cys Val Gln Ser Thr Lys Pro Ser Leu
Met Ile Gln Lys Ala Ala Ile 515 520
525 Gln Ala Leu Arg Lys Met Glu Pro Lys Asp Lys Asp Gln Glu
Val Leu 530 535 540
Leu Gln Thr Phe Leu Asp Asp Ala Ser Pro Gly Asp Lys Arg Leu Ala 545
550 555 560 Ala Tyr Leu Met Leu
Met Arg Ser Pro Ser Gln Ala Asp Ile Asn Lys 565
570 575 Ile Val Gln Ile Leu Pro Trp Glu Gln Asn
Glu Gln Val Lys Asn Phe 580 585
590 Val Ala Ser His Ile Ala Asn Ile Leu Asn Ser Glu Glu Leu Asp
Ile 595 600 605 Gln
Asp Leu Lys Lys Leu Val Lys Glu Ala Leu Lys Glu Ser Gln Leu 610
615 620 Pro Thr Val Met Asp Phe
Arg Lys Phe Ser Arg Asn Tyr Gln Leu Tyr 625 630
635 640 Lys Ser Val Ser Leu Pro Ser Leu Asp Pro Ala
Ser Ala Lys Ile Glu 645 650
655 Gly Asn Leu Ile Phe Asp Pro Asn Asn Tyr Leu Pro Lys Glu Ser Met
660 665 670 Leu Lys
Thr Thr Leu Thr Ala Phe Gly Phe Ala Ser Ala Asp Leu Ile 675
680 685 Glu Ile Gly Leu Glu Gly Lys
Gly Phe Glu Pro Thr Leu Glu Ala Leu 690 695
700 Phe Gly Lys Gln Gly Phe Phe Pro Asp Ser Val Asn
Lys Ala Leu Tyr 705 710 715
720 Trp Val Asn Gly Gln Val Pro Asp Gly Val Ser Lys Val Leu Val Asp
725 730 735 His Phe Gly
Tyr Thr Lys Asp Asp Lys His Glu Gln Asp Met Val Asn 740
745 750 Gly Ile Met Leu Ser Val Glu Lys
Leu Ile Lys Asp Leu Lys Ser Lys 755 760
765 Glu Val Pro Glu Ala Arg Ala Tyr Leu Arg Ile Leu Gly
Glu Glu Leu 770 775 780
Gly Phe Ala Ser Leu His Asp Leu Gln Leu Leu Gly Lys Leu Leu Leu 785
790 795 800 Met Gly Ala Arg
Thr Leu Gln Gly Ile Pro Gln Met Ile Gly Glu Val 805
810 815 Ile Arg Lys Gly Ser Lys Asn Asp Phe
Phe Leu His Tyr Ile Phe Met 820 825
830 Glu Asn Ala Phe Glu Leu Pro Thr Gly Ala Gly Leu Gln Leu
Gln Ile 835 840 845
Ser Ser Ser Gly Val Ile Ala Pro Gly Ala Lys Ala Gly Val Lys Leu 850
855 860 Glu Val Ala Asn Met
Gln Ala Glu Leu Val Ala Lys Pro Ser Val Ser 865 870
875 880 Val Glu Phe Val Thr Asn Met Gly Ile Ile
Ile Pro Asp Phe Ala Arg 885 890
895 Ser Gly Val Gln Met Asn Thr Asn Phe Phe His Glu Ser Gly Leu
Glu 900 905 910 Ala
His Val Ala Leu Lys Ala Gly Lys Leu Lys Phe Ile Ile Pro Ser 915
920 925 Pro Lys Arg Pro Val Lys
Leu Leu Ser Gly Gly Asn Thr Leu His Leu 930 935
940 Val Ser Thr Thr Lys Thr Glu Val Ile Pro Pro
Leu Ile Glu Asn Arg 945 950 955
960 Gln Ser Trp Ser Val Cys Lys Gln Val Phe Pro Gly Leu Asn Tyr Cys
965 970 975 Thr Ser
Gly Ala Tyr Ser Asn Ala Ser Ser Thr Asp Ser Ala Ser Tyr 980
985 990 Tyr Pro Leu Thr Gly Asp Thr
Arg Leu Glu Leu Glu Leu Arg Pro Thr 995 1000
1005 Gly Glu Ile Glu Gln Tyr Ser Val Ser Ala
Thr Tyr Glu Leu Gln 1010 1015 1020
Arg Glu Asp Arg Ala Leu Val Asp Thr Leu Lys Phe Val Thr Gln
1025 1030 1035 Ala Glu
Gly Ala Lys Gln Thr Glu Ala Thr Met Thr Phe Lys Tyr 1040
1045 1050 Asn Arg Gln Ser Met Thr Leu
Ser Ser Glu Val Gln Ile Pro Asp 1055 1060
1065 Phe Asp Val Asp Leu Gly Thr Ile Leu Arg Val Asn
Asp Glu Ser 1070 1075 1080
Thr Glu Gly Lys Thr Ser Tyr Arg Leu Thr Leu Asp Ile Gln Asn 1085
1090 1095 Lys Lys Ile Thr Glu
Val Ala Leu Met Gly His Leu Ser Cys Asp 1100 1105
1110 Thr Lys Glu Glu Arg Lys Ile Lys Gly Val
Ile Ser Ile Pro Arg 1115 1120 1125
Leu Gln Ala Glu Ala Arg Ser Glu Ile Leu Ala His Trp Ser Pro
1130 1135 1140 Ala Lys
Leu Leu Leu Gln Met Asp Ser Ser Ala Thr Ala Tyr Gly 1145
1150 1155 Ser Thr Val Ser Lys Arg Val
Ala Trp His Tyr Asp Glu Glu Lys 1160 1165
1170 Ile Glu Phe Glu Trp Asn Thr Gly Thr Asn Val Asp
Thr Lys Lys 1175 1180 1185
Met Thr Ser Asn Phe Pro Val Asp Leu Ser Asp Tyr Pro Lys Ser 1190
1195 1200 Leu His Met Tyr Ala
Asn Arg Leu Leu Asp His Arg Val Pro Glu 1205 1210
1215 Thr Asp Met Thr Phe Arg His Val Gly Ser
Lys Leu Ile Val Ala 1220 1225 1230
Met Ser Ser Trp Leu Gln Lys Ala Ser Gly Ser Leu Pro Tyr Thr
1235 1240 1245 Gln Thr
Leu Gln Asp His Leu Asn Ser Leu Lys Glu Phe Asn Leu 1250
1255 1260 Gln Asn Met Gly Leu Pro Asp
Phe His Ile Pro Glu Asn Leu Phe 1265 1270
1275 Leu Lys Ser Asp Gly Arg Val Lys Tyr Thr Leu Asn
Lys Asn Ser 1280 1285 1290
Leu Lys Ile Glu Ile Pro Leu Pro Phe Gly Gly Lys Ser Ser Arg 1295
1300 1305 Asp Leu Lys Met Leu
Glu Thr Val Arg Thr Pro Ala Leu His Phe 1310 1315
1320 Lys Ser Val Gly Phe His Leu Pro Ser Arg
Glu Phe Gln Val Pro 1325 1330 1335
Thr Phe Thr Ile Pro Lys Leu Tyr Gln Leu Gln Val Pro Leu Leu
1340 1345 1350 Gly Val
Leu Asp Leu Ser Thr Asn Val Tyr Ser Asn Leu Tyr Asn 1355
1360 1365 Trp Ser Ala Ser Tyr Ser Gly
Gly Asn Thr Ser Thr Asp His Phe 1370 1375
1380 Ser Leu Arg Ala Arg Tyr His Met Lys Ala Asp Ser
Val Val Asp 1385 1390 1395
Leu Leu Ser Tyr Asn Val Gln Gly Ser Gly Glu Thr Thr Tyr Asp 1400
1405 1410 His Lys Asn Thr Phe
Thr Leu Ser Cys Asp Gly Ser Leu Arg His 1415 1420
1425 Lys Phe Leu Asp Ser Asn Ile Lys Phe Ser
His Val Glu Lys Leu 1430 1435 1440
Gly Asn Asn Pro Val Ser Lys Gly Leu Leu Ile Phe Asp Ala Ser
1445 1450 1455 Ser Ser
Trp Gly Pro Gln Met Ser Ala Ser Val His Leu Asp Ser 1460
1465 1470 Lys Lys Lys Gln His Leu Phe
Val Lys Glu Val Lys Ile Asp Gly 1475 1480
1485 Gln Phe Arg Val Ser Ser Phe Tyr Ala Lys Gly Thr
Tyr Gly Leu 1490 1495 1500
Ser Cys Gln Arg Asp Pro Asn Thr Gly Arg Leu Asn Gly Glu Ser 1505
1510 1515 Asn Leu Arg Phe Asn
Ser Ser Tyr Leu Gln Gly Thr Asn Gln Ile 1520 1525
1530 Thr Gly Arg Tyr Glu Asp Gly Thr Leu Ser
Leu Thr Ser Thr Ser 1535 1540 1545
Asp Leu Gln Ser Gly Ile Ile Lys Asn Thr Ala Ser Leu Lys Tyr
1550 1555 1560 Glu Asn
Tyr Glu Leu Thr Leu Lys Ser Asp Thr Asn Gly Lys Tyr 1565
1570 1575 Lys Asn Phe Ala Thr Ser Asn
Lys Met Asp Met Thr Phe Ser Lys 1580 1585
1590 Gln Asn Ala Leu Leu Arg Ser Glu Tyr Gln Ala Asp
Tyr Glu Ser 1595 1600 1605
Leu Arg Phe Phe Ser Leu Leu Ser Gly Ser Leu Asn Ser His Gly 1610
1615 1620 Leu Glu Leu Asn Ala
Asp Ile Leu Gly Thr Asp Lys Ile Asn Ser 1625 1630
1635 Gly Ala His Lys Ala Thr Leu Arg Ile Gly
Gln Asp Gly Ile Ser 1640 1645 1650
Thr Ser Ala Thr Thr Asn Leu Lys Cys Ser Leu Leu Val Leu Glu
1655 1660 1665 Asn Glu
Leu Asn Ala Glu Leu Gly Leu Ser Gly Ala Ser Met Lys 1670
1675 1680 Leu Thr Thr Asn Gly Arg Phe
Arg Glu His Asn Ala Lys Phe Ser 1685 1690
1695 Leu Asp Gly Lys Ala Ala Leu Thr Glu Leu Ser Leu
Gly Ser Ala 1700 1705 1710
Tyr Gln Ala Met Ile Leu Gly Val Asp Ser Lys Asn Ile Phe Asn 1715
1720 1725 Phe Lys Val Ser Gln
Glu Gly Leu Lys Leu Ser Asn Asp Met Met 1730 1735
1740 Gly Ser Tyr Ala Glu Met Lys Phe Asp His
Thr Asn Ser Leu Asn 1745 1750 1755
Ile Ala Gly Leu Ser Leu Asp Phe Ser Ser Lys Leu Asp Asn Ile
1760 1765 1770 Tyr Ser
Ser Asp Lys Phe Tyr Lys Gln Thr Val Asn Leu Gln Leu 1775
1780 1785 Gln Pro Tyr Ser Leu Val Thr
Thr Leu Asn Ser Asp Leu Lys Tyr 1790 1795
1800 Asn Ala Leu Asp Leu Thr Asn Asn Gly Lys Leu Arg
Leu Glu Pro 1805 1810 1815
Leu Lys Leu His Val Ala Gly Asn Leu Lys Gly Ala Tyr Gln Asn 1820
1825 1830 Asn Glu Ile Lys His
Ile Tyr Ala Ile Ser Ser Ala Ala Leu Ser 1835 1840
1845 Ala Ser Tyr Lys Ala Asp Thr Val Ala Lys
Val Gln Gly Val Glu 1850 1855 1860
Phe Ser His Arg Leu Asn Thr Asp Ile Ala Gly Leu Ala Ser Ala
1865 1870 1875 Ile Asp
Met Ser Thr Asn Tyr Asn Ser Asp Ser Leu His Phe Ser 1880
1885 1890 Asn Val Phe Arg Ser Val Met
Ala Pro Phe Thr Met Thr Ile Asp 1895 1900
1905 Ala His Thr Asn Gly Asn Gly Lys Leu Ala Leu Trp
Gly Glu His 1910 1915 1920
Thr Gly Gln Leu Tyr Ser Lys Phe Leu Leu Lys Ala Glu Pro Leu 1925
1930 1935 Ala Phe Thr Phe Ser
His Asp Tyr Lys Gly Ser Thr Ser His His 1940 1945
1950 Leu Val Ser Arg Lys Ser Ile Ser Ala Ala
Leu Glu His Lys Val 1955 1960 1965
Ser Ala Leu Leu Thr Pro Ala Glu Gln Thr Gly Thr Trp Lys Leu
1970 1975 1980 Lys Thr
Gln Phe Asn Asn Asn Glu Tyr Ser Gln Asp Leu Asp Ala 1985
1990 1995 Tyr Asn Thr Lys Asp Lys Ile
Gly Val Glu Leu Thr Gly Arg Thr 2000 2005
2010 Leu Ala Asp Leu Thr Leu Leu Asp Ser Pro Ile Lys
Val Pro Leu 2015 2020 2025
Leu Leu Ser Glu Pro Ile Asn Ile Ile Asp Ala Leu Glu Met Arg 2030
2035 2040 Asp Ala Val Glu Lys
Pro Gln Glu Phe Thr Ile Val Ala Phe Val 2045 2050
2055 Lys Tyr Asp Lys Asn Gln Asp Val His Ser
Ile Asn Leu Pro Phe 2060 2065 2070
Phe Glu Thr Leu Gln Glu Tyr Phe Glu Arg Asn Arg Gln Thr Ile
2075 2080 2085 Ile Val
Val Val Glu Asn Val Gln Arg Asn Leu Lys His Ile Asn 2090
2095 2100 Ile Asp Gln Phe Val Arg Lys
Tyr Arg Ala Ala Leu Gly Lys Leu 2105 2110
2115 Pro Gln Gln Ala Asn Asp Tyr Leu Asn Ser Phe Asn
Trp Glu Arg 2120 2125 2130
Gln Val Ser His Ala Lys Glu Lys Leu Thr Ala Leu Thr Lys Lys 2135
2140 2145 Tyr Arg Ile Thr Glu
Asn Asp Ile Gln Ile Ala Leu Asp Asp Ala 2150 2155
2160 Lys Ile Asn Phe Asn Glu Lys Leu Ser Gln
Leu Gln Thr Tyr Met 2165 2170 2175
Ile Gln Phe Asp Gln Tyr Ile Lys Asp Ser Tyr Asp Leu His Asp
2180 2185 2190 Leu Lys
Ile Ala Ile Ala Asn Ile Ile Asp Glu Ile Ile Glu Lys 2195
2200 2205 Leu Lys Ser Leu Asp Glu His
Tyr His Ile Arg Val Asn Leu Val 2210 2215
2220 Lys Thr Ile His Asp Leu His Leu Phe Ile Glu Asn
Ile Asp Phe 2225 2230 2235
Asn Lys Ser Gly Ser Ser Thr Ala Ser Trp Ile Gln Asn Val Asp 2240
2245 2250 Thr Lys Tyr Gln Ile
Arg Ile Gln Ile Gln Glu Lys Leu Gln Gln 2255 2260
2265 Leu Lys Arg His Ile Gln Asn Ile Asp Ile
Gln His Leu Ala Gly 2270 2275 2280
Lys Leu Lys Gln His Ile Glu Ala Ile Asp Val Arg Val Leu Leu
2285 2290 2295 Asp Gln
Leu Gly Thr Thr Ile Ser Phe Glu Arg Ile Asn Asp Val 2300
2305 2310 Leu Glu His Val Lys His Phe
Val Ile Asn Leu Ile Gly Asp Phe 2315 2320
2325 Glu Val Ala Glu Lys Ile Asn Ala Phe Arg Ala Lys
Val His Glu 2330 2335 2340
Leu Ile Glu Arg Tyr Glu Val Asp Gln Gln Ile Gln Val Leu Met 2345
2350 2355 Asp Lys Leu Val Glu
Leu Thr His Gln Tyr Lys Leu Lys Glu Thr 2360 2365
2370 Ile Gln Lys Leu Ser Asn Val Leu Gln Gln
Val Lys Ile Lys Asp 2375 2380 2385
Tyr Phe Glu Lys Leu Val Gly Phe Ile Asp Asp Ala Val Lys Lys
2390 2395 2400 Leu Asn
Glu Leu Ser Phe Lys Thr Phe Ile Glu Asp Val Asn Lys 2405
2410 2415 Phe Leu Asp Met Leu Ile Lys
Lys Leu Lys Ser Phe Asp Tyr His 2420 2425
2430 Gln Phe Val Asp Glu Thr Asn Asp Lys Ile Arg Glu
Val Thr Gln 2435 2440 2445
Arg Leu Asn Gly Glu Ile Gln Ala Leu Glu Leu Pro Gln Lys Ala 2450
2455 2460 Glu Ala Leu Lys Leu
Phe Leu Glu Glu Thr Lys Ala Thr Val Ala 2465 2470
2475 Val Tyr Leu Glu Ser Leu Gln Asp Thr Lys
Ile Thr Leu Ile Ile 2480 2485 2490
Asn Trp Leu Gln Glu Ala Leu Ser Ser Ala Ser Leu Ala His Met
2495 2500 2505 Lys Ala
Lys Phe Arg Glu Thr Leu Glu Asp Thr Arg Asp Arg Met 2510
2515 2520 Tyr Gln Met Asp Ile Gln Gln
Glu Leu Gln Arg Tyr Leu Ser Leu 2525 2530
2535 Val Gly Gln Val Tyr Ser Thr Leu Val Thr Tyr Ile
Ser Asp Trp 2540 2545 2550
Trp Thr Leu Ala Ala Lys Asn Leu Thr Asp Phe Ala Glu Gln Tyr 2555
2560 2565 Ser Ile Gln Asp Trp
Ala Lys Arg Met Lys Ala Leu Val Glu Gln 2570 2575
2580 Gly Phe Thr Val Pro Glu Ile Lys Thr Ile
Leu Gly Thr Met Pro 2585 2590 2595
Ala Phe Glu Val Ser Leu Gln Ala Leu Gln Lys Ala Thr Phe Gln
2600 2605 2610 Thr Pro
Asp Phe Ile Val Pro Leu Thr Asp Leu Arg Ile Pro Ser 2615
2620 2625 Val Gln Ile Asn Phe Lys Asp
Leu Lys Asn Ile Lys Ile Pro Ser 2630 2635
2640 Arg Phe Ser Thr Pro Glu Phe Thr Ile Leu Asn Thr
Phe His Ile 2645 2650 2655
Pro Ser Phe Thr Ile Asp Phe Val Glu Met Lys Val Lys Ile Ile 2660
2665 2670 Arg Thr Ile Asp Gln
Met Gln Asn Ser Glu Leu Gln Trp Pro Val 2675 2680
2685 Pro Asp Ile Tyr Leu Arg Asp Leu Lys Val
Glu Asp Ile Pro Leu 2690 2695 2700
Ala Arg Ile Thr Leu Pro Asp Phe Arg Leu Pro Glu Ile Ala Ile
2705 2710 2715 Pro Glu
Phe Ile Ile Pro Thr Leu Asn Leu Asn Asp Phe Gln Val 2720
2725 2730 Pro Asp Leu His Ile Pro Glu
Phe Gln Leu Pro His Ile Ser His 2735 2740
2745 Thr Ile Glu Val Pro Thr Phe Gly Lys Leu Tyr Ser
Ile Leu Lys 2750 2755 2760
Ile Gln Ser Pro Leu Phe Thr Leu Asp Ala Asn Ala Asp Ile Gly 2765
2770 2775 Asn Gly Thr Thr Ser
Ala Asn Glu Ala Gly Ile Ala Ala Ser Ile 2780 2785
2790 Thr Ala Lys Gly Glu Ser Lys Leu Glu Val
Leu Asn Phe Asp Phe 2795 2800 2805
Gln Ala Asn Ala Gln Leu Ser Asn Pro Lys Ile Asn Pro Leu Ala
2810 2815 2820 Leu Lys
Glu Ser Val Lys Phe Ser Ser Lys Tyr Leu Arg Thr Glu 2825
2830 2835 His Gly Ser Glu Met Leu Phe
Phe Gly Asn Ala Ile Glu Gly Lys 2840 2845
2850 Ser Asn Thr Val Ala Ser Leu His Thr Glu Lys Asn
Thr Leu Glu 2855 2860 2865
Leu Ser Asn Gly Val Ile Val Lys Ile Asn Asn Gln Leu Thr Leu 2870
2875 2880 Asp Ser Asn Thr Lys
Tyr Phe His Lys Leu Asn Ile Pro Lys Leu 2885 2890
2895 Asp Phe Ser Ser Gln Ala Asp Leu Arg Asn
Glu Ile Lys Thr Leu 2900 2905 2910
Leu Lys Ala Gly His Ile Ala Trp Thr Ser Ser Gly Lys Gly Ser
2915 2920 2925 Trp Lys
Trp Ala Cys Pro Arg Phe Ser Asp Glu Gly Thr His Glu 2930
2935 2940 Ser Gln Ile Ser Phe Thr Ile
Glu Gly Pro Leu Thr Ser Phe Gly 2945 2950
2955 Leu Ser Asn Lys Ile Asn Ser Lys His Leu Arg Val
Asn Gln Asn 2960 2965 2970
Leu Val Tyr Glu Ser Gly Ser Leu Asn Phe Ser Lys Leu Glu Ile 2975
2980 2985 Gln Ser Gln Val Asp
Ser Gln His Val Gly His Ser Val Leu Thr 2990 2995
3000 Ala Lys Gly Met Ala Leu Phe Gly Glu Gly
Lys Ala Glu Phe Thr 3005 3010 3015
Gly Arg His Asp Ala His Leu Asn Gly Lys Val Ile Gly Thr Leu
3020 3025 3030 Lys Asn
Ser Leu Phe Phe Ser Ala Gln Pro Phe Glu Ile Thr Ala 3035
3040 3045 Ser Thr Asn Asn Glu Gly Asn
Leu Lys Val Arg Phe Pro Leu Arg 3050 3055
3060 Leu Thr Gly Lys Ile Asp Phe Leu Asn Asn Tyr Ala
Leu Phe Leu 3065 3070 3075
Ser Pro Ser Ala Gln Gln Ala Ser Trp Gln Val Ser Ala Arg Phe 3080
3085 3090 Asn Gln Tyr Lys Tyr
Asn Gln Asn Phe Ser Ala Gly Asn Asn Glu 3095 3100
3105 Asn Ile Met Glu Ala His Val Gly Ile Asn
Gly Glu Ala Asn Leu 3110 3115 3120
Asp Phe Leu Asn Ile Pro Leu Thr Ile Pro Glu Met Arg Leu Pro
3125 3130 3135 Tyr Thr
Ile Ile Thr Thr Pro Pro Leu Lys Asp Phe Ser Leu Trp 3140
3145 3150 Glu Lys Thr Gly Leu Lys Glu
Phe Leu Lys Thr Thr Lys Gln Ser 3155 3160
3165 Phe Asp Leu Ser Val Lys Ala Gln Tyr Lys Lys Asn
Lys His Arg 3170 3175 3180
His Ser Ile Thr Asn Pro Leu Ala Val Leu Cys Glu Phe Ile Ser 3185
3190 3195 Gln Ser Ile Lys Ser
Phe Asp Arg His Phe Glu Lys Asn Arg Asn 3200 3205
3210 Asn Ala Leu Asp Phe Val Thr Lys Ser Tyr
Asn Glu Thr Lys Ile 3215 3220 3225
Lys Phe Asp Lys Tyr Lys Ala Glu Lys Ser His Asp Glu Leu Pro
3230 3235 3240 Arg Thr
Phe Gln Ile Pro Gly Tyr Thr Val Pro Val Val Asn Val 3245
3250 3255 Glu Val Ser Pro Phe Thr Ile
Glu Met Ser Ala Phe Gly Tyr Val 3260 3265
3270 Phe Pro Lys Ala Val Ser Met Pro Ser Phe Ser Ile
Leu Gly Ser 3275 3280 3285
Asp Val Arg Val Pro Ser Tyr Thr Leu Ile Leu Pro Ser Leu Glu 3290
3295 3300 Leu Pro Val Leu His
Val Pro Arg Asn Leu Lys Leu Ser Leu Pro 3305 3310
3315 His Phe Lys Glu Leu Cys Thr Ile Ser His
Ile Phe Ile Pro Ala 3320 3325 3330
Met Gly Asn Ile Thr Tyr Asp Phe Ser Phe Lys Ser Ser Val Ile
3335 3340 3345 Thr Leu
Asn Thr Asn Ala Glu Leu Phe Asn Gln Ser Asp Ile Val 3350
3355 3360 Ala His Leu Leu Ser Ser Ser
Ser Ser Val Ile Asp Ala Leu Gln 3365 3370
3375 Tyr Lys Leu Glu Gly Thr Thr Arg Leu Thr Arg Lys
Arg Gly Leu 3380 3385 3390
Lys Leu Ala Thr Ala Leu Ser Leu Ser Asn Lys Phe Val Glu Gly 3395
3400 3405 Ser His Asn Ser Thr
Val Ser Leu Thr Thr Lys Asn Met Glu Val 3410 3415
3420 Ser Val Ala Lys Thr Thr Lys Ala Glu Ile
Pro Ile Leu Arg Met 3425 3430 3435
Asn Phe Lys Gln Glu Leu Asn Gly Asn Thr Lys Ser Lys Pro Thr
3440 3445 3450 Val Ser
Ser Ser Met Glu Phe Lys Tyr Asp Phe Asn Ser Ser Met 3455
3460 3465 Leu Tyr Ser Thr Ala Lys Gly
Ala Val Asp His Lys Leu Ser Leu 3470 3475
3480 Glu Ser Leu Thr Ser Tyr Phe Ser Ile Glu Ser Ser
Thr Lys Gly 3485 3490 3495
Asp Val Lys Gly Ser Val Leu Ser Arg Glu Tyr Ser Gly Thr Ile 3500
3505 3510 Ala Ser Glu Ala Asn
Thr Tyr Leu Asn Ser Lys Ser Thr Arg Ser 3515 3520
3525 Ser Val Lys Leu Gln Gly Thr Ser Lys Ile
Asp Asp Ile Trp Asn 3530 3535 3540
Leu Glu Val Lys Glu Asn Phe Ala Gly Glu Ala Thr Leu Gln Arg
3545 3550 3555 Ile Tyr
Ser Leu Trp Glu His Ser Thr Lys Asn His Leu Gln Leu 3560
3565 3570 Glu Gly Leu Phe Phe Thr Asn
Gly Glu His Thr Ser Lys Ala Thr 3575 3580
3585 Leu Glu Leu Ser Pro Trp Gln Met Ser Ala Leu Val
Gln Val His 3590 3595 3600
Ala Ser Gln Pro Ser Ser Phe His Asp Phe Pro Asp Leu Gly Gln 3605
3610 3615 Glu Val Ala Leu Asn
Ala Asn Thr Lys Asn Gln Lys Ile Arg Trp 3620 3625
3630 Lys Asn Glu Val Arg Ile His Ser Gly Ser
Phe Gln Ser Gln Val 3635 3640 3645
Glu Leu Ser Asn Asp Gln Glu Lys Ala His Leu Asp Ile Ala Gly
3650 3655 3660 Ser Leu
Glu Gly His Leu Arg Phe Leu Lys Asn Ile Ile Leu Pro 3665
3670 3675 Val Tyr Asp Lys Ser Leu Trp
Asp Phe Leu Lys Leu Asp Val Thr 3680 3685
3690 Thr Ser Ile Gly Arg Arg Gln His Leu Arg Val Ser
Thr Ala Phe 3695 3700 3705
Val Tyr Thr Lys Asn Pro Asn Gly Tyr Ser Phe Ser Ile Pro Val 3710
3715 3720 Lys Val Leu Ala Asp
Lys Phe Ile Thr Pro Gly Leu Lys Leu Asn 3725 3730
3735 Asp Leu Asn Ser Val Leu Val Met Pro Thr
Phe His Val Pro Phe 3740 3745 3750
Thr Asp Leu Gln Val Pro Ser Cys Lys Leu Asp Phe Arg Glu Ile
3755 3760 3765 Gln Ile
Tyr Lys Lys Leu Arg Thr Ser Ser Phe Ala Leu Asn Leu 3770
3775 3780 Pro Thr Leu Pro Glu Val Lys
Phe Pro Glu Val Asp Val Leu Thr 3785 3790
3795 Lys Tyr Ser Gln Pro Glu Asp Ser Leu Ile Pro Phe
Phe Glu Ile 3800 3805 3810
Thr Val Pro Glu Ser Gln Leu Thr Val Ser Gln Phe Thr Leu Pro 3815
3820 3825 Lys Ser Val Ser Asp
Gly Ile Ala Ala Leu Asp Leu Asn Ala Val 3830 3835
3840 Ala Asn Lys Ile Ala Asp Phe Glu Leu Pro
Thr Ile Ile Val Pro 3845 3850 3855
Glu Gln Thr Ile Glu Ile Pro Ser Ile Lys Phe Ser Val Pro Ala
3860 3865 3870 Gly Ile
Val Ile Pro Ser Phe Gln Ala Leu Thr Ala Arg Phe Glu 3875
3880 3885 Val Asp Ser Pro Val Tyr Asn
Ala Thr Trp Ser Ala Ser Leu Lys 3890 3895
3900 Asn Lys Ala Asp Tyr Val Glu Thr Val Leu Asp Ser
Thr Cys Ser 3905 3910 3915
Ser Thr Val Gln Phe Leu Glu Tyr Glu Leu Asn Val Leu Gly Thr 3920
3925 3930 His Lys Ile Glu Asp
Gly Thr Leu Ala Ser Lys Thr Lys Gly Thr 3935 3940
3945 Leu Ala His Arg Asp Phe Ser Ala Glu Tyr
Glu Glu Asp Gly Lys 3950 3955 3960
Phe Glu Gly Leu Gln Glu Trp Glu Gly Lys Ala His Leu Asn Ile
3965 3970 3975 Lys Ser
Pro Ala Phe Thr Asp Leu His Leu Arg Tyr Gln Lys Asp 3980
3985 3990 Lys Lys Gly Ile Ser Thr Ser
Ala Ala Ser Pro Ala Val Gly Thr 3995 4000
4005 Val Gly Met Asp Met Asp Glu Asp Asp Asp Phe Ser
Lys Trp Asn 4010 4015 4020
Phe Tyr Tyr Ser Pro Gln Ser Ser Pro Asp Lys Lys Leu Thr Ile 4025
4030 4035 Phe Lys Thr Glu Leu
Arg Val Arg Glu Ser Asp Glu Glu Thr Gln 4040 4045
4050 Ile Lys Val Asn Trp Glu Glu Glu Ala Ala
Ser Gly Leu Leu Thr 4055 4060 4065
Ser Leu Lys Asp Asn Val Pro Lys Ala Thr Gly Val Leu Tyr Asp
4070 4075 4080 Tyr Val
Asn Lys Tyr His Trp Glu His Thr Gly Leu Thr Leu Arg 4085
4090 4095 Glu Val Ser Ser Lys Leu Arg
Arg Asn Leu Gln Asn Asn Ala Glu 4100 4105
4110 Trp Val Tyr Gln Gly Ala Ile Arg Gln Ile Asp Asp
Ile Asp Val 4115 4120 4125
Arg Phe Gln Lys Ala Ala Ser Gly Thr Thr Gly Thr Tyr Gln Glu 4130
4135 4140 Trp Lys Asp Lys Ala
Gln Asn Leu Tyr Gln Glu Leu Leu Thr Gln 4145 4150
4155 Glu Gly Gln Ala Ser Phe Gln Gly Leu Lys
Asp Asn Val Phe Asp 4160 4165 4170
Gly Leu Val Arg Val Thr Gln Lys Phe His Met Lys Val Lys His
4175 4180 4185 Leu Ile
Asp Ser Leu Ile Asp Phe Leu Asn Phe Pro Arg Phe Gln 4190
4195 4200 Phe Pro Gly Lys Pro Gly Ile
Tyr Thr Arg Glu Glu Leu Cys Thr 4205 4210
4215 Met Phe Ile Arg Glu Val Gly Thr Val Leu Ser Gln
Val Tyr Ser 4220 4225 4230
Lys Val His Asn Gly Ser Glu Ile Leu Phe Ser Tyr Phe Gln Asp 4235
4240 4245 Leu Val Ile Thr Leu
Pro Phe Glu Leu Arg Lys His Lys Leu Ile 4250 4255
4260 Asp Val Ile Ser Met Tyr Arg Glu Leu Leu
Lys Asp Leu Ser Lys 4265 4270 4275
Glu Ala Gln Glu Val Phe Lys Ala Ile Gln Ser Leu Lys Thr Thr
4280 4285 4290 Glu Val
Leu Arg Asn Leu Gln Asp Leu Leu Gln Phe Ile Phe Gln 4295
4300 4305 Leu Ile Glu Asp Asn Ile Lys
Gln Leu Lys Glu Met Lys Phe Thr 4310 4315
4320 Tyr Leu Ile Asn Tyr Ile Gln Asp Glu Ile Asn Thr
Ile Phe Asn 4325 4330 4335
Asp Tyr Ile Pro Tyr Val Phe Lys Leu Leu Lys Glu Asn Leu Cys 4340
4345 4350 Leu Asn Leu His Lys
Phe Asn Glu Phe Ile Gln Asn Glu Leu Gln 4355 4360
4365 Glu Ala Ser Gln Glu Leu Gln Gln Ile His
Gln Tyr Ile Met Ala 4370 4375 4380
Leu Arg Glu Glu Tyr Phe Asp Pro Ser Ile Val Gly Trp Thr Val
4385 4390 4395 Lys Tyr
Tyr Glu Leu Glu Glu Lys Ile Val Ser Leu Ile Lys Asn 4400
4405 4410 Leu Leu Val Ala Leu Lys Asp
Phe His Ser Glu Tyr Ile Val Ser 4415 4420
4425 Ala Ser Asn Phe Thr Ser Gln Leu Ser Ser Gln Val
Glu Gln Phe 4430 4435 4440
Leu His Arg Asn Ile Gln Glu Tyr Leu Ser Ile Leu Thr Asp Pro 4445
4450 4455 Asp Gly Lys Gly Lys
Glu Lys Ile Ala Glu Leu Ser Ala Thr Ala 4460 4465
4470 Gln Glu Ile Ile Lys Ser Gln Ala Ile Ala
Thr Lys Lys Ile Ile 4475 4480 4485
Ser Asp Tyr His Gln Gln Phe Arg Tyr Lys Leu Gln Asp Phe Ser
4490 4495 4500 Asp Gln
Leu Ser Asp Tyr Tyr Glu Lys Phe Ile Ala Glu Ser Lys 4505
4510 4515 Arg Leu Ile Asp Leu Ser Ile
Gln Asn Tyr His Thr Phe Leu Ile 4520 4525
4530 Tyr Ile Thr Glu Leu Leu Lys Lys Leu Gln Ser Thr
Thr Val Met 4535 4540 4545
Asn Pro Tyr Met Lys Leu Ala Pro Gly Glu Leu Thr Ile Ile Leu 4550
4555 4560 17866PRTHomo sapiens 17Met Phe
Ser Met Arg Ile Val Cys Leu Val Leu Ser Val Val Gly Thr 1 5
10 15 Ala Trp Thr Ala Asp Ser Gly
Glu Gly Asp Phe Leu Ala Glu Gly Gly 20 25
30 Gly Val Arg Gly Pro Arg Val Val Glu Arg His Gln
Ser Ala Cys Lys 35 40 45
Asp Ser Asp Trp Pro Phe Cys Ser Asp Glu Asp Trp Asn Tyr Lys Cys
50 55 60 Pro Ser Gly
Cys Arg Met Lys Gly Leu Ile Asp Glu Val Asn Gln Asp 65
70 75 80 Phe Thr Asn Arg Ile Asn Lys
Leu Lys Asn Ser Leu Phe Glu Tyr Gln 85
90 95 Lys Asn Asn Lys Asp Ser His Ser Leu Thr Thr
Asn Ile Met Glu Ile 100 105
110 Leu Arg Gly Asp Phe Ser Ser Ala Asn Asn Arg Asp Asn Thr Tyr
Asn 115 120 125 Arg
Val Ser Glu Asp Leu Arg Ser Arg Ile Glu Val Leu Lys Arg Lys 130
135 140 Val Ile Glu Lys Val Gln
His Ile Gln Leu Leu Gln Lys Asn Val Arg 145 150
155 160 Ala Gln Leu Val Asp Met Lys Arg Leu Glu Val
Asp Ile Asp Ile Lys 165 170
175 Ile Arg Ser Cys Arg Gly Ser Cys Ser Arg Ala Leu Ala Arg Glu Val
180 185 190 Asp Leu
Lys Asp Tyr Glu Asp Gln Gln Lys Gln Leu Glu Gln Val Ile 195
200 205 Ala Lys Asp Leu Leu Pro Ser
Arg Asp Arg Gln His Leu Pro Leu Ile 210 215
220 Lys Met Lys Pro Val Pro Asp Leu Val Pro Gly Asn
Phe Lys Ser Gln 225 230 235
240 Leu Gln Lys Val Pro Pro Glu Trp Lys Ala Leu Thr Asp Met Pro Gln
245 250 255 Met Arg Met
Glu Leu Glu Arg Pro Gly Gly Asn Glu Ile Thr Arg Gly 260
265 270 Gly Ser Thr Ser Tyr Gly Thr Gly
Ser Glu Thr Glu Ser Pro Arg Asn 275 280
285 Pro Ser Ser Ala Gly Ser Trp Asn Ser Gly Ser Ser Gly
Pro Gly Ser 290 295 300
Thr Gly Asn Arg Asn Pro Gly Ser Ser Gly Thr Gly Gly Thr Ala Thr 305
310 315 320 Trp Lys Pro Gly
Ser Ser Gly Pro Gly Ser Thr Gly Ser Trp Asn Ser 325
330 335 Gly Ser Ser Gly Thr Gly Ser Thr Gly
Asn Gln Asn Pro Gly Ser Pro 340 345
350 Arg Pro Gly Ser Thr Gly Thr Trp Asn Pro Gly Ser Ser Glu
Arg Gly 355 360 365
Ser Ala Gly His Trp Thr Ser Glu Ser Ser Val Ser Gly Ser Thr Gly 370
375 380 Gln Trp His Ser Glu
Ser Gly Ser Phe Arg Pro Asp Ser Pro Gly Ser 385 390
395 400 Gly Asn Ala Arg Pro Asn Asn Pro Asp Trp
Gly Thr Phe Glu Glu Val 405 410
415 Ser Gly Asn Val Ser Pro Gly Thr Arg Arg Glu Tyr His Thr Glu
Lys 420 425 430 Leu
Val Thr Ser Lys Gly Asp Lys Glu Leu Arg Thr Gly Lys Glu Lys 435
440 445 Val Thr Ser Gly Ser Thr
Thr Thr Thr Arg Arg Ser Cys Ser Lys Thr 450 455
460 Val Thr Lys Thr Val Ile Gly Pro Asp Gly His
Lys Glu Val Thr Lys 465 470 475
480 Glu Val Val Thr Ser Glu Asp Gly Ser Asp Cys Pro Glu Ala Met Asp
485 490 495 Leu Gly
Thr Leu Ser Gly Ile Gly Thr Leu Asp Gly Phe Arg His Arg 500
505 510 His Pro Asp Glu Ala Ala Phe
Phe Asp Thr Ala Ser Thr Gly Lys Thr 515 520
525 Phe Pro Gly Phe Phe Ser Pro Met Leu Gly Glu Phe
Val Ser Glu Thr 530 535 540
Glu Ser Arg Gly Ser Glu Ser Gly Ile Phe Thr Asn Thr Lys Glu Ser 545
550 555 560 Ser Ser His
His Pro Gly Ile Ala Glu Phe Pro Ser Arg Gly Lys Ser 565
570 575 Ser Ser Tyr Ser Lys Gln Phe Thr
Ser Ser Thr Ser Tyr Asn Arg Gly 580 585
590 Asp Ser Thr Phe Glu Ser Lys Ser Tyr Lys Met Ala Asp
Glu Ala Gly 595 600 605
Ser Glu Ala Asp His Glu Gly Thr His Ser Thr Lys Arg Gly His Ala 610
615 620 Lys Ser Arg Pro
Val Arg Asp Cys Asp Asp Val Leu Gln Thr His Pro 625 630
635 640 Ser Gly Thr Gln Ser Gly Ile Phe Asn
Ile Lys Leu Pro Gly Ser Ser 645 650
655 Lys Ile Phe Ser Val Tyr Cys Asp Gln Glu Thr Ser Leu Gly
Gly Trp 660 665 670
Leu Leu Ile Gln Gln Arg Met Asp Gly Ser Leu Asn Phe Asn Arg Thr
675 680 685 Trp Gln Asp Tyr
Lys Arg Gly Phe Gly Ser Leu Asn Asp Glu Gly Glu 690
695 700 Gly Glu Phe Trp Leu Gly Asn Asp
Tyr Leu His Leu Leu Thr Gln Arg 705 710
715 720 Gly Ser Val Leu Arg Val Glu Leu Glu Asp Trp Ala
Gly Asn Glu Ala 725 730
735 Tyr Ala Glu Tyr His Phe Arg Val Gly Ser Glu Ala Glu Gly Tyr Ala
740 745 750 Leu Gln Val
Ser Ser Tyr Glu Gly Thr Ala Gly Asp Ala Leu Ile Glu 755
760 765 Gly Ser Val Glu Glu Gly Ala Glu
Tyr Thr Ser His Asn Asn Met Gln 770 775
780 Phe Ser Thr Phe Asp Arg Asp Ala Asp Gln Trp Glu Glu
Asn Cys Ala 785 790 795
800 Glu Val Tyr Gly Gly Gly Trp Trp Tyr Asn Asn Cys Gln Ala Ala Asn
805 810 815 Leu Asn Gly Ile
Tyr Tyr Pro Gly Gly Ser Tyr Asp Pro Arg Asn Asn 820
825 830 Ser Pro Tyr Glu Ile Glu Asn Gly Val
Val Trp Val Ser Phe Arg Gly 835 840
845 Ala Asp Tyr Ser Leu Arg Ala Val Arg Met Lys Ile Arg Pro
Leu Val 850 855 860
Thr Gln 865 18491PRTHomo sapiens 18Met Lys Arg Met Val Ser Trp Ser
Phe His Lys Leu Lys Thr Met Lys 1 5 10
15 His Leu Leu Leu Leu Leu Leu Cys Val Phe Leu Val Lys
Ser Gln Gly 20 25 30
Val Asn Asp Asn Glu Glu Gly Phe Phe Ser Ala Arg Gly His Arg Pro
35 40 45 Leu Asp Lys Lys
Arg Glu Glu Ala Pro Ser Leu Arg Pro Ala Pro Pro 50
55 60 Pro Ile Ser Gly Gly Gly Tyr Arg
Ala Arg Pro Ala Lys Ala Ala Ala 65 70
75 80 Thr Gln Lys Lys Val Glu Arg Lys Ala Pro Asp Ala
Gly Gly Cys Leu 85 90
95 His Ala Asp Pro Asp Leu Gly Val Leu Cys Pro Thr Gly Cys Gln Leu
100 105 110 Gln Glu Ala
Leu Leu Gln Gln Glu Arg Pro Ile Arg Asn Ser Val Asp 115
120 125 Glu Leu Asn Asn Asn Val Glu Ala
Val Ser Gln Thr Ser Ser Ser Ser 130 135
140 Phe Gln Tyr Met Tyr Leu Leu Lys Asp Leu Trp Gln Lys
Arg Gln Lys 145 150 155
160 Gln Val Lys Asp Asn Glu Asn Val Val Asn Glu Tyr Ser Ser Glu Leu
165 170 175 Glu Lys His Gln
Leu Tyr Ile Asp Glu Thr Val Asn Ser Asn Ile Pro 180
185 190 Thr Asn Leu Arg Val Leu Arg Ser Ile
Leu Glu Asn Leu Arg Ser Lys 195 200
205 Ile Gln Lys Leu Glu Ser Asp Val Ser Ala Gln Met Glu Tyr
Cys Arg 210 215 220
Thr Pro Cys Thr Val Ser Cys Asn Ile Pro Val Val Ser Gly Lys Glu 225
230 235 240 Cys Glu Glu Ile Ile
Arg Lys Gly Gly Glu Thr Ser Glu Met Tyr Leu 245
250 255 Ile Gln Pro Asp Ser Ser Val Lys Pro Tyr
Arg Val Tyr Cys Asp Met 260 265
270 Asn Thr Glu Asn Gly Gly Trp Thr Val Ile Gln Asn Arg Gln Asp
Gly 275 280 285 Ser
Val Asp Phe Gly Arg Lys Trp Asp Pro Tyr Lys Gln Gly Phe Gly 290
295 300 Asn Val Ala Thr Asn Thr
Asp Gly Lys Asn Tyr Cys Gly Leu Pro Gly 305 310
315 320 Glu Tyr Trp Leu Gly Asn Asp Lys Ile Ser Gln
Leu Thr Arg Met Gly 325 330
335 Pro Thr Glu Leu Leu Ile Glu Met Glu Asp Trp Lys Gly Asp Lys Val
340 345 350 Lys Ala
His Tyr Gly Gly Phe Thr Val Gln Asn Glu Ala Asn Lys Tyr 355
360 365 Gln Ile Ser Val Asn Lys Tyr
Arg Gly Thr Ala Gly Asn Ala Leu Met 370 375
380 Asp Gly Ala Ser Gln Leu Met Gly Glu Asn Arg Thr
Met Thr Ile His 385 390 395
400 Asn Gly Met Phe Phe Ser Thr Tyr Asp Arg Asp Asn Asp Gly Trp Leu
405 410 415 Thr Ser Asp
Pro Arg Lys Gln Cys Ser Lys Glu Asp Gly Gly Gly Trp 420
425 430 Trp Tyr Asn Arg Cys His Ala Ala
Asn Pro Asn Gly Arg Tyr Tyr Trp 435 440
445 Gly Gly Gln Tyr Thr Trp Asp Met Ala Lys His Gly Thr
Asp Asp Gly 450 455 460
Val Val Trp Met Asn Trp Lys Gly Ser Trp Tyr Ser Met Arg Lys Met 465
470 475 480 Ser Met Lys Ile
Arg Pro Phe Phe Pro Gln Gln 485 490
19453PRTHomo sapiens 19Met Ser Trp Ser Leu His Pro Arg Asn Leu Ile Leu
Tyr Phe Tyr Ala 1 5 10
15 Leu Leu Phe Leu Ser Ser Thr Cys Val Ala Tyr Val Ala Thr Arg Asp
20 25 30 Asn Cys Cys
Ile Leu Asp Glu Arg Phe Gly Ser Tyr Cys Pro Thr Thr 35
40 45 Cys Gly Ile Ala Asp Phe Leu Ser
Thr Tyr Gln Thr Lys Val Asp Lys 50 55
60 Asp Leu Gln Ser Leu Glu Asp Ile Leu His Gln Val Glu
Asn Lys Thr 65 70 75
80 Ser Glu Val Lys Gln Leu Ile Lys Ala Ile Gln Leu Thr Tyr Asn Pro
85 90 95 Asp Glu Ser Ser
Lys Pro Asn Met Ile Asp Ala Ala Thr Leu Lys Ser 100
105 110 Arg Lys Met Leu Glu Glu Ile Met Lys
Tyr Glu Ala Ser Ile Leu Thr 115 120
125 His Asp Ser Ser Ile Arg Tyr Leu Gln Glu Ile Tyr Asn Ser
Asn Asn 130 135 140
Gln Lys Ile Val Asn Leu Lys Glu Lys Val Ala Gln Leu Glu Ala Gln 145
150 155 160 Cys Gln Glu Pro Cys
Lys Asp Thr Val Gln Ile His Asp Ile Thr Gly 165
170 175 Lys Asp Cys Gln Asp Ile Ala Asn Lys Gly
Ala Lys Gln Ser Gly Leu 180 185
190 Tyr Phe Ile Lys Pro Leu Lys Ala Asn Gln Gln Phe Leu Val Tyr
Cys 195 200 205 Glu
Ile Asp Gly Ser Gly Asn Gly Trp Thr Val Phe Gln Lys Arg Leu 210
215 220 Asp Gly Ser Val Asp Phe
Lys Lys Asn Trp Ile Gln Tyr Lys Glu Gly 225 230
235 240 Phe Gly His Leu Ser Pro Thr Gly Thr Thr Glu
Phe Trp Leu Gly Asn 245 250
255 Glu Lys Ile His Leu Ile Ser Thr Gln Ser Ala Ile Pro Tyr Ala Leu
260 265 270 Arg Val
Glu Leu Glu Asp Trp Asn Gly Arg Thr Ser Thr Ala Asp Tyr 275
280 285 Ala Met Phe Lys Val Gly Pro
Glu Ala Asp Lys Tyr Arg Leu Thr Tyr 290 295
300 Ala Tyr Phe Ala Gly Gly Asp Ala Gly Asp Ala Phe
Asp Gly Phe Asp 305 310 315
320 Phe Gly Asp Asp Pro Ser Asp Lys Phe Phe Thr Ser His Asn Gly Met
325 330 335 Gln Phe Ser
Thr Trp Asp Asn Asp Asn Asp Lys Phe Glu Gly Asn Cys 340
345 350 Ala Glu Gln Asp Gly Ser Gly Trp
Trp Met Asn Lys Cys His Ala Gly 355 360
365 His Leu Asn Gly Val Tyr Tyr Gln Gly Gly Thr Tyr Ser
Lys Ala Ser 370 375 380
Thr Pro Asn Gly Tyr Asp Asn Gly Ile Ile Trp Ala Thr Trp Lys Thr 385
390 395 400 Arg Trp Tyr Ser
Met Lys Lys Thr Thr Met Lys Ile Ile Pro Phe Asn 405
410 415 Arg Leu Thr Ile Gly Glu Gly Gln Gln
His His Leu Gly Gly Ala Lys 420 425
430 Gln Val Arg Pro Glu His Pro Ala Glu Thr Glu Tyr Asp Ser
Leu Tyr 435 440 445
Pro Glu Asp Asp Leu 450
User Contributions:
Comment about this patent or add new information about this topic:
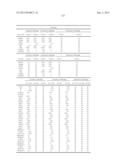 |  |
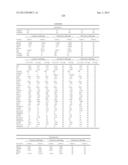 |  |
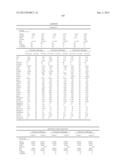 | 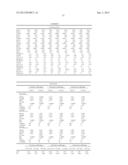 |
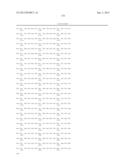 | 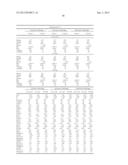 |
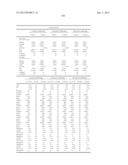 | 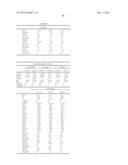 |
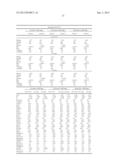 | 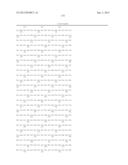 |
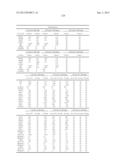 | 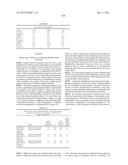 |
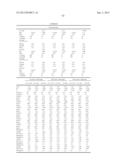 | 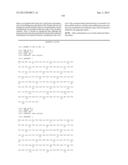 |
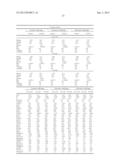 | 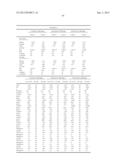 |
 | 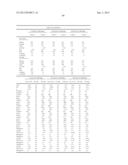 |
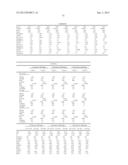 | 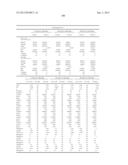 |
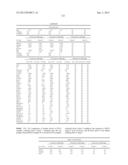 | 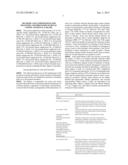 |
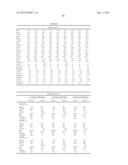 | 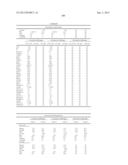 |
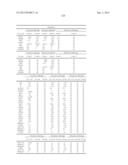 | 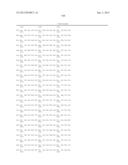 |
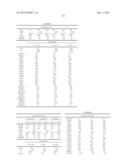 | 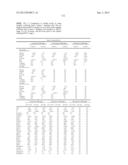 |
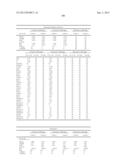 | 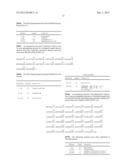 |
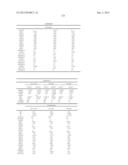 | 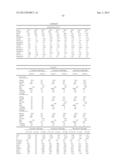 |
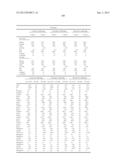 | 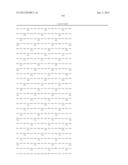 |
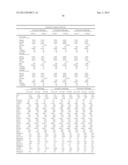 | 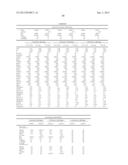 |
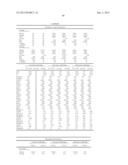 | 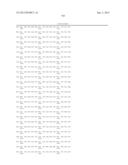 |
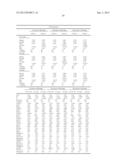 | 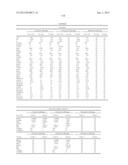 |
 | 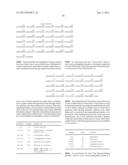 |
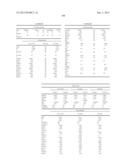 | 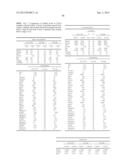 |
 |  |
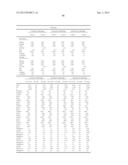 |  |
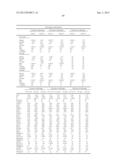 | 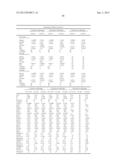 |
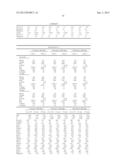 | 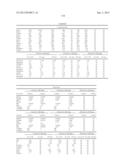 |
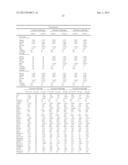 | 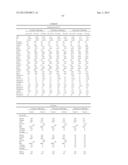 |
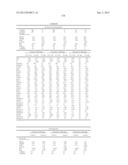 | 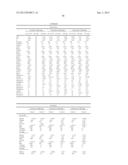 |
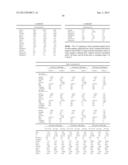 |  |
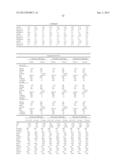 |  |
 | 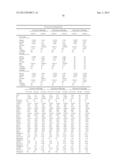 |
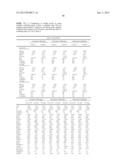 | 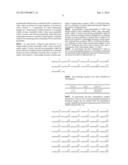 |
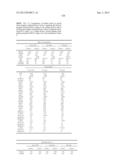 | 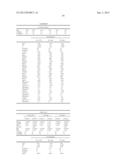 |
 | 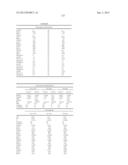 |
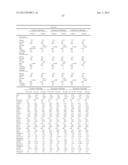 | 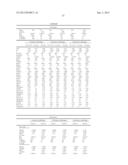 |
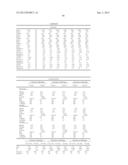 | 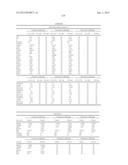 |
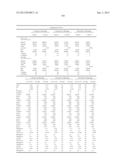 | 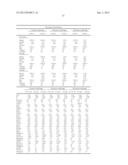 |
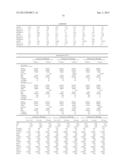 | 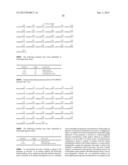 |
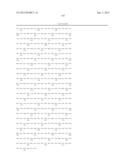 | 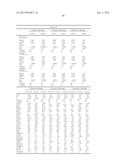 |
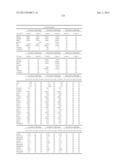 | 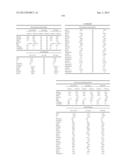 |
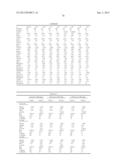 | 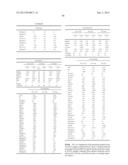 |
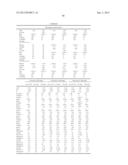 | 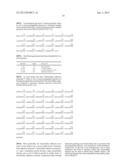 |
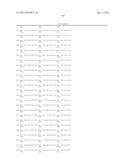 | 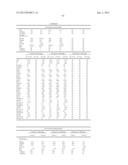 |
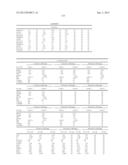 | 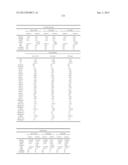 |
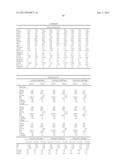 | 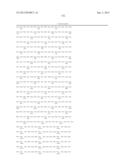 |
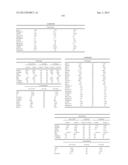 | 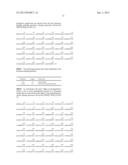 |
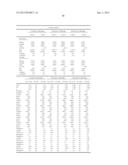 | 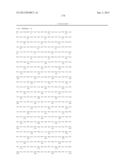 |
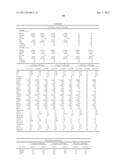 | 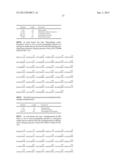 |
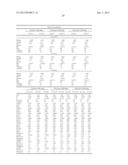 | 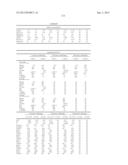 |
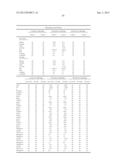 | 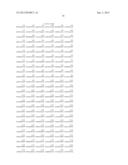 |
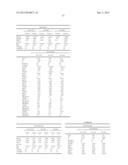 | 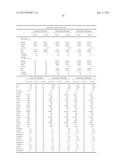 |
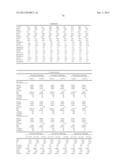 | 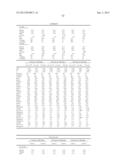 |
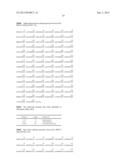 | 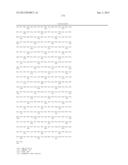 |
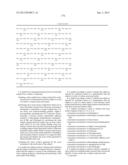 | 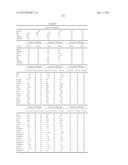 |
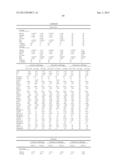 | 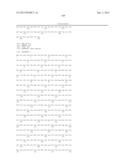 |
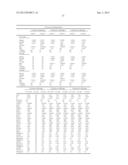 |  |
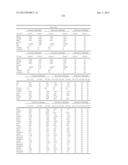 | 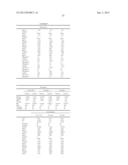 |
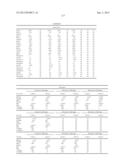 | 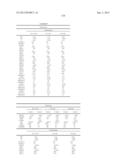 |
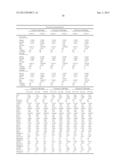 | 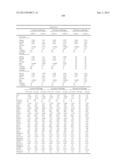 |
 |  |
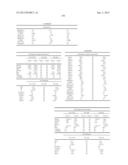 |  |
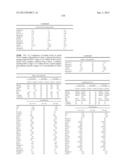 | 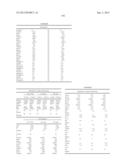 |
 |  |
 | 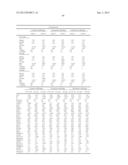 |
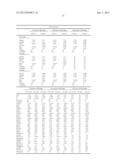 |  |
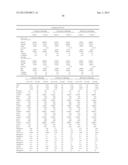 | 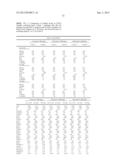 |
 | 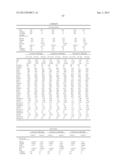 |
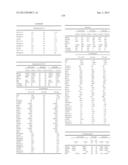 | 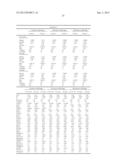 |
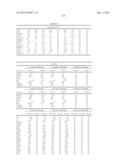 | 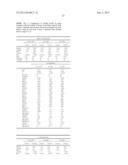 |
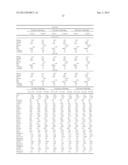 | 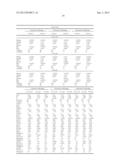 |
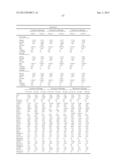 | 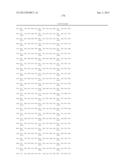 |
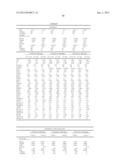 | 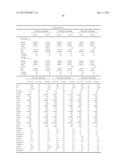 |
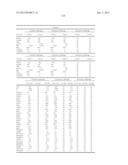 | 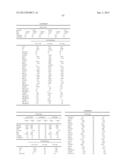 |
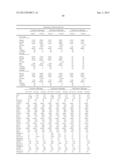 |  |
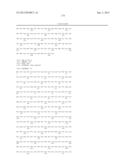 | 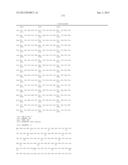 |
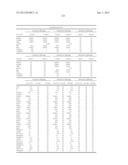 | 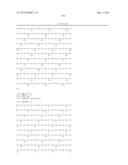 |
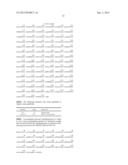 | 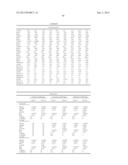 |
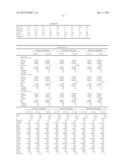 | 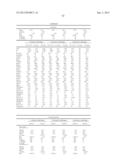 |
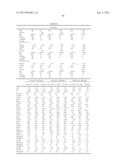 | 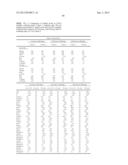 |
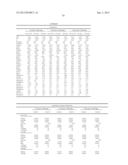 | 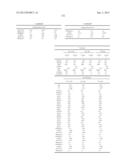 |
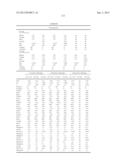 |
| New patent applications in this class: | |
| Date | Title |
|---|---|
| 2022-05-05 | Method and kit for measuring app669-711 |
| 2019-05-16 | Antibodies with high affinity for alpha-klotho |
| 2018-01-25 | Assay devices, methods for carrying out assays, assay kits and method for manufacturing assay devices |
| 2016-12-29 | Method for diganosing atherosclerotic plaques by measurement of cd36 |
| 2016-12-29 | Method for evaluation of function of phagocyte |
| New patent applications from these inventors: | |
| Date | Title |
|---|---|
| 2022-09-22 | Blood biomarkers for appendicitis and diagnostics methods using biomarkers |
| 2022-07-28 | Methods and compositions for diagnosis and prognosis of renal injury and renal failure |
| Top Inventors for class "Chemistry: molecular biology and microbiology" | |
| Rank | Inventor's name |
|---|---|
| 1 | Marshall Medoff |
| 2 | Anthony P. Burgard |
| 3 | Mark J. Burk |
| 4 | Robin E. Osterhout |
| 5 | Rangarajan Sampath |