Patent application title: EFFICIENT DETECTION OF DOUBLE MUTANTS OF THE CEBPA GENE IN ACUTE MYELOID LEUKEMIA
Inventors:
Erik Van Beers (Utrecht, NL)
Bas Wouters (Rotterdam, NL)
Hendrik Rudolf Delwel (Rotterdam, NL)
Peter Jacobus Maria Valk (Rotterdam, NL)
Bob Löwenberg (Rotterdam, NL)
Assignees:
ERASMUS UNIVERSITY MEDICAL CENTER ROTTERDAM
IPC8 Class: AC12Q168FI
USPC Class:
435 612
Class name: Measuring or testing process involving enzymes or micro-organisms; composition or test strip therefore; processes of forming such composition or test strip involving nucleic acid with significant amplification step (e.g., polymerase chain reaction (pcr), etc.)
Publication date: 2011-11-17
Patent application number: 20110281270
Abstract:
The invention is in the field of molecular diagnostics for cancer, in
particular, for acute myeloid leukemia (AML). The invention provides
methods for diagnosing AML patients with a favorable prognosis. We have
found that not all AML patients carrying a CEBPA mutation may have a more
favorable prognosis. We found that only the group with double mutations,
i.e., biallelic mutations, have a particularly favorable prognosis. We
also found a method that distinguishes mono-allelic CEBPA mutations from
bi-allelic mutations.Claims:
1. A method for determining whether a subject carries a biallelic
CCAAT/enhancer binding protein alpha ("CEBPA") mutation, the method
comprising: determining, in a sample obtained from the subject, the
expression levels of at least 2 genes selected from the group consisting
of NDFIP1, RAB34, UGT2B28, MARVELD1, RAB13, UMODL1, TNS3, LOC136306,
HSPB1///MEIS3, LRRC28, CTNNA1, SFXN3, GLULD1, DLC1, SUCLG2, PODS,
HSPC324, TUBB6, ARPP-21, and CEBPA.
2. The method according to claim 1, wherein the at least 2 genes are selected from the group consisting of NDFIP1, RAB34, UGT2B28, MARVELD1, RAB13, UMODL1, TNS3, LOC136306, HSPB1///MEIS3, LRRC28, CTNNA1, SFXN3, GLULD1, DLC1, SUCLG2, PGDS, HSPC324, TUBB6, ARPP-21, SHD, and CEBPA.
3. The method according to claim 1, wherein the at least 2 genes are selected from the group consisting of NDFIP1, RAB34, UGT2B28/B10, MARVELD1, RAB13, UMODL1, TNS3, CTNNA1, HSPC324, TUBB6, ARPP-21, and CEBPA.
4. The method according to claim 1, wherein the at least 2 genes are selected from the group consisting of RAB34, MARVELD1, UMODL1, CTNNA1, HSPC324, TUBB6, and CEBPA.
5. The method according to claim 1, wherein the at least 2 genes are selected from the group consisting of NDFIP 1, RAB34, UGT2B28/B10, MARVELD1, RAB13, TNS3, CTNNA1, ARPP-21, and CEBPA.
6. The method according to claim 4, further comprising determining the expression level level of each of RAB34, MARVELD1, UMODL1, CTNNA1, HSPC324, TUBB6, and CEBPA.
7. The method according to claim 5, further comprising determining the expression level of each of NDFIP1, RAB34, UGT2B28/B10, MARVELD1, RAB13, TNS3, CTNNA1, ARPP-21, and CEBPA.
8. The method according to claim 4, further comprising determining the expression level of CEBPA and comparing the expression level of CEBPA to a predetermined value.
9. The method according to claim 5, further comprising determining the expression level of CEBPA and comparing the expression level of CEBPA to a predetermined value.
10. The method according to claim 1 wherein the sample is taken from the group consisting of a tissue sample, a blood sample, a urine sample or a sputum sample
Description:
CROSS-REFERENCE TO RELATED APPLICATIONS
[0001] This is a national phase entry under 35 U.S.C. §371 of International Patent Application PCT/EP2009/065178, filed Nov. 13, 2009, published in English as International Patent Publication WO 2010/055147 A1 on May 20, 2010, which claims the benefit under Article 8 of the Patent Cooperation Treaty to European Patent Application Serial No. 08105794.5, filed Nov. 13, 2008.
TECHNICAL FIELD
[0002] The invention is in the field of molecular diagnostics for cancer, in particular, for acute myeloid leukemia (AML). The invention provides methods for diagnosing AML patients with a favorable prognosis.
BACKGROUND
[0003] Acute myeloid leukemia (AML) is not a single disease but a group of neoplasms with various genetic abnormalities and variable responses to treatment. The pretreatment karyotype is still essential in therapy decision-making in AML (Mrozek et al., Blood Rev. 2004, 18:115-136. In recent years, a number of novel molecular markers have been associated with AML prognostics (Mrozek et al., Hematology Am. Soc. Hematol. Educ. Program 2006:169-177; Estey et al., Lancet 2006, 368:1894-1907).
[0004] Mutations in the CEBPA gene encoding the CCAAT/enhancer binding protein alpha (C/EBPalpha) are commonly found in AML. Patients carrying monoallelic or biallelic mutations in CEBPA were found to belong to a subgroup with a relatively good prognosis of AML (Barjesteh van Waalwijk et al., Hematol. J. 2003, 4:31-40).
[0005] These studies usually require extensive nucleotide sequence analysis for and real-time PCR. There remains a need in the art for alternative detection methods to identify AML patients with a more favorable diagnosis.
SUMMARY OF THE INVENTION
[0006] We have found that not all AML patients carrying a CEBPA mutation may have a more favorable prognosis. We found that only the group with double mutations, i.e., biallelic mutations, have a particularly favorable prognosis. We also found a method that distinguishes mono-allelic CEBPA mutations from bi-allelic mutations.
[0007] That method relies on the analysis of the expression level of a set of genes, for instance, in a microarray. The set of genes is detailed in the examples below.
[0008] The invention, therefore, relates to a method for determining whether a patient carries a biallelic CEBPA mutation by determining the expression levels of a set of at least two genes selected from the group consisting of the classifier genes as described herein.
[0009] Mutations in CCAAT/enhancer binding protein alpha (CEBPA) are found in 5-10% of acute myeloid leukemia (AML) and have been associated with a favorable clinical outcome. The majority of AMLs with CEBPA mutations simultaneously carries two mutations, which are usually biallelic (CEBPA.sup.double-mut), while other AMLs only carry a single heterozygous mutation (CEBPA.sup.single-mut). Here, we identified, using denaturing high performance liquid chromatography and nucleotide sequencing, 41 CEBPA mutant cases in a cohort of 598 newly diagnosed AMLs, i.e., 28 CEBPA.sup.double-mut cases and 13 CEBPA.sup.single-mut cases. Genome-wide gene expression profiling and clinical outcome analysis revealed that CEBPA.sup.double-mut AMLs associated with a unique gene expression profile and a favorable outcome. In contrast, CEBPA.sup.single-mut AMLs did not express a discriminating signature, and could not be distinguished from wild-type cases with regard to clinical outcome. These results demonstrate significant underlying heterogeneity within CEBPA mutation positive AML with important implications for assessment of prognosis.
[0010] Mutations in the transcription factor CCAAT/enhancer binding protein alpha (CEBPA) are found in 5-10% of acute myeloid leukemia (AML).1-9 CEBPA mutations have been associated with a relatively favorable outcome and have, therefore, gained interest as a promising novel prognostic marker.3,4,9,10 While variable sequence variations have been described, two prototypical classes of mutations are most frequent. N-terminal mutations are located between the major translational start codon and a second ATG in the same open reading frame. These mutations introduce a premature stop of translation of the p42 CEBPA protein and increased translation of a p30 isoform that may inhibit the function of full length protein.6 Mutations in the C-terminal basic leucine zipper (bZIP) region, in contrast, are in-frame, and may impair dimerization and/or DNA binding.7 Remaining mutations in CEBPA are found between the N-terminus and bZIP region.
[0011] The majority CEBPA mutant AML carries two mutations. Most frequently, this is a combination of an N-teiiiiinal and a bZIP mutation.7,8,11 In AMLs with two CEBPA mutations, the mutations are usually on different alleles, hence no wild-type CEBPA protein is expressed. A similar condition is found in cases carrying a homozygous mutation. However, there are also AMLs that only have one single heterozygous mutation, and thus retain expression of a wild-type allele.
[0012] To obtain better insight into the exact distribution of the various types of CEBPA mutations in de novo adult AML and into their impact on clinical outcome, we have studied a cohort of 598 cases. Using denaturing high performance liquid chromatography (dHPLC) followed by nucleotide sequencing, we identified cases with two different mutations or one homozygous mutation (further referred to as double mutations; CEBPA.sup.double-mut) as well as cases with only one single heterozygous mutation (CEBPA.sup.single-mut). Genome-wide gene expression profiling (GEP) revealed that CEBPA.sup.double-mut AMLs expressed a highly characteristic signature, while CEBPA.sup.single-mut cases did not. More unexpectedly, a favorable prognostic effect was uniquely associated with double mutations. These results reveal the presence of unknown heterogeneity within AML with CEBPA mutations that may have important implications for clinical prognostication.
[0013] In a cohort of 598 cases of adult de novo AML, we identified 65 cases with an aberrant profile in at least one of the three investigated amplicons of the CEBPA coding sequence (FIG. 1, Panels A and B). The presence of a CEBPA sequence variation was confirmed by nucleotide sequencing. Cases that only carried an insertion polymorphism11,14-16 or variation(s) that did not lead to amino acid changes were considered wild-type. Two additional specimens were not considered in further analysis because they carried in-frame variations of unknown significance outside the bZIP region. As a result, 41/598 CEBPAmut AML cases (6.9%) were considered. These included 13 CEBPA .sup.single-mut cases and 28 CEBPA.sup.double-mut cases, i.e., AMLs with either homozygous or two distinct mutations (Table 2). Additional screening of the remaining 547 AML cases using a combination of agarose gel analysis and nucleotide sequencing as described3 did not reveal mutations that had been missed by dHPLC.
[0014] We found that the expression level of genes selected from a group of 25 genes was highly predictive for the occurrence of CEBPA double mutants. Every combination of two genes, selected from the group of 25 genes shown in Table 5, was found to predict the occurrence of a CEBPA double mutation to an acceptable level. The sensitivity and specificity of the method improved when the expression levels of more than two genes were determined, such as 3, 4, 5, 6, 7, 8, 9, 10, 11, 12, 13, 14, 15, 16, 17, 18, 19, 20, 21, 22, 23, 24 or 25 genes.
[0015] In a preferred embodiment of the invention, the two genes are selected from the group of genes shown in Table 11.
[0016] In a particularly preferred method according to the invention, the expression of at least two genes selected from a set of seven genes shown in Table 12 is determined, preferably the expression level of 3, 4, 5, 6 or 7 genes selected from the group of genes shown in Table 12 is determined.
[0017] In another particularly preferred method according to the invention, the expression of at least two genes selected from a set of nine genes shown in Table 13 is determined, preferably the expression level of 3, 4, 5, 6, 7, 8 or 9 genes selected from the group of genes shown in Table 13 is determined.
[0018] Best results were obtained when the expression level of all seven genes from Table 12 or all nine genes from Table 13 were determined.
[0019] The expression level of the genes identified herein may be determined in various ways known in the art. Particularly preferred is the use of specific probe sets as identified herein. Exemplary useful probe sets are provided in the accompanying sequence listing. Other probe sets may be designed by the skilled person based on the primary sequence of the genes identified herein, which are available from various public sources.
[0020] In a further preferred method, a prescreening is performed wherein the level of expression of the CEBPA gene is determined and compared to a predetermined value. If the expression level of the CEBPA gene in a particular sample is above that predetermined value, then the above methods may be performed on those samples and this combination assay then provides even more reliable results. The examples provide a method for reliably determining the predetermined value.
[0021] In the terminology used herein, a gene is identified and characterized in that it encodes an expression product comprising a nucleic acid sequence that is capable of specifically hybridizing, preferably under high stringency conditions, to the cDNA sequences provided in the sequence listings. Preferably, the genes encode an expression product that is more than 90% homologous to the sequences provided in the sequence listing, such as 92, 94, 96, 97, 98, 99 or even 100% homologous.
[0022] Table 10 provides details of the genes as described herein, reference to public databases is made that will allow the skilled person to unequivocally determine the identity and sequence of the particular genes.
[0023] The skilled person will be aware of the definition of high stringency conditions, further guidance is to be obtained from Sambrook et al., Molecular Cloning: A Laboratory Manual third edition.
[0024] The skilled person will also be aware of the fact that many splice variants of the genes mentioned herein may exist and he is well capable of designing specific primers and probes for such splice variants if necessary.
BRIEF DESCRIPTION OF THE DRAWINGS
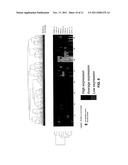
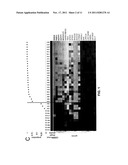
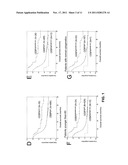
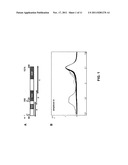
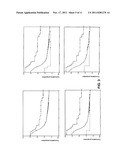
[0025] FIG. 1: Panel A: Schematic representation of the CEBPA gene and location of PCR primers used for dHPLC analysis of fragments a, b and c. Functional regions are depicted, i.e., two transactivation domains (TAD1 and TAD2) in the N-terminal part, and the basic leucine zipper (bZIP) region in the C-terminal part. Nucleotide (nt) position is indicated relative to the main translation start site. Amino acid (aa) numbering and the alternative translation start site at position nt 358 (aa 120) are also depicted. Panel B: Representative profiles of dHPLC analysis of one of the three investigated fragments, i.e., amplicons b, in a random selection of 90 samples. Heteroduplexes (various colors) are released earlier than homoduplexes (green), and can, therefore, be recognized as distinct peaks. Time is depicted on the x-axis, and voltage on the y-axis. Panel C: A gene expression prediction signature for CEBPA mutations (irrespective of single or double mutant status) was derived in a data set of 524 AMLs, including 38 CEBPAmut cases. Prediction accuracy for each of the 38 CEBPAmut cases was estimated using repeated ten-fold cross-validation as detailed herein. The proportion of correct predictions for the selected 38 CEBPA mutant specimens is indicated (upper panel). The heat map in the lower panel depicts the resulting 19 probe set gene expression classifier, comprising a good discriminating signature for CEBPAmut AML (see Table 6 for probe set infomiation). Intensity values (log2) were mean centered over the cohort of 524 AML cases. For visualization purposes, the genes were hierarchically clustered (Euclidian distance, average linkage). Cells represent relative log2 expression values, and were color coded on a scale ranging from bright green (-3) to bright red (+3). Panel D: Kaplan Meier curves showing difference in OS between CEBPAmut and CEBPAwt AML, log rank test P=0.027. Panel E: Differences in OS between CEBPA.sup.double-mut versus CEBPAwt AML, P=0.004, and versus CEBPA.sup.single-mut AML, P=0.005. Panel F: Restricted analysis to patients younger than 60: differences in OS between CEBPA.sup.double-mut versus CEBPAwt AML, P=0.0096, and versus CEBPA.sup.single-mut AML, P=0.033. Panel G: Restricted analysis to patients with normal cytogenetics: differences in OS between CEBPA.sup.double-mut versus CEBPAwt AML, P=0.069, and versus CEBPA.sup.single-mut AML, P=0.024.
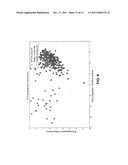
[0026] FIG. 2: Principal component analysis of GEP data based on 19-probe set prediction signature for CEBPA mutations. Principal component analysis of 524 cases of AML was carried out based on the 19 probe sets that constitute the prediction signature for CEBPA mutation irrespective of single or double mutant status (Table 6). Each square represents an AML case. AMLs were color coded based on CEBPA status: CEBPA.sup.double-mut (red), CEBPA.sup.single-mut (blue) and CEBPAwt (yellow). Cases belonging to a previously described subgroup of myeloid/T-lymphoid leukemias characterized by epigenetic silencing of CEBPA have been colored in green. The first two principal components (PCA1 and PCA2) have been depicted. The figure illustrates that CEBPA.sup.double-mut can be completely separated from CEBPAwt cases over the first principal component (PCA1), while the CEBPA.sup.single-mut cases are scattered within the wild-type cohort. In addition to CEBPA.sup.double-mut, there are also some other AMLs that are clearly separated from the wild-type cohort--these all represent CEBPA silenced AMLs.
[0027] FIG. 3: Kaplan Meier curves for event-free survival. Panel A: Kaplan Meier curves showing difference in EFS between CEBPAmut and CEBPAwt AML, log rank test P=0.050. Panel B: Differences in EFS between CEBPA.sup.double-mut versus CEBPAwt AML, P=0.005, and versus CEBPA .sup.single-mut AML, P=0.004. Panel C: Restricted analysis to patients younger than 60: differences in EFS between CEBPA.sup.double-mut versus CEBPAwt AML, P=0.014, and versus CEBPA.sup.single-mut AML, P=0.026. Panel D: Restricted analysis to patients with normal cytogenetics: differences in EFS between CEBPA.sup.double-mut versus CEBPAwt AML, P=0.081, and versus CEBPA.sup.single-mut AML, P=0.093.
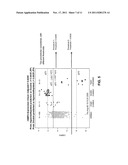
[0028] FIG. 4: Procedure for a preferred method according to the invention wherein sample is tested for the elevated expression of the CEBPA gene and if found above a predetermined value, a set of genes is tested from the groups described herein.
[0029] FIG. 5: Determining the predetermined value for a method as depicted in FIG. 4.
[0030] FIG. 6: Unsupervised hierarchical cluster analysis of the expression values of the seven classifier genes shown in Table 12. Clustering CEBPA double mutant versus non-double mutant; seven genes used to cluster the samples (cosine--complete).
[0031] FIG. 7: Principal component analysis plot of the data obtained in FIG. 6.
[0032] FIG. 8: Unsupervised hierarchical cluster analysis of the expression values of the nine classifier genes shown in Table 13. Clustering CEBPA double mutant versus non-double mutant; nine genes used to cluster the samples (cosine--complete).
[0033] FIG. 9: Principal component analysis plot of the data obtained in FIG. 8.
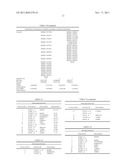
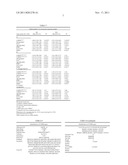
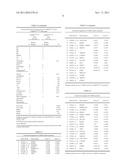
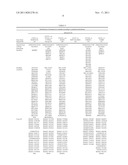
TABLE-US-00001 TABLE 1 Clinical and molecular data AML AML cohort1 cohort2 (n = 247) (n = 214) Gender Male 119 113 Female 128 101 Age (median (range)) 43 (15-60) 46 (17-60) White blood cell count 30 (0-278) 29 (1-349) Bone marrow blast count 68 (0-98) 64 (0-96) Platelet count 49 (3-931) 59 (5-998) FAB M0 6 10 M1 55 41 M2 54 52 M3 17 7 M4 43 41 M5 62 42 M6 3 3 not determined 7 18 Cytogenetics* normal 99 (41%) 95 (46%) inv(16) 21 (9%) 16 (7%) t(15; 17)** 18 (7%) 7 (3%) t(8; 21) 21 (9%) 14 (7%) t(6; 9) 4 (2%) 2 (1%) abn3q 7 (3%) 9 (4%) del5(q) 3 (1%) 12 (6%) del7(q) 17 (7%) 14 (7%) 11q23 13 (5%) 8 (4%) +8 22 (9%) 11 (5%) t(9; 22) 4 (2%) 1 (<1%) complex 13 (5%) 21 (10%) other 63 (26%) 45 (22%) Mutations* CEBPA 16 (6%) 15 (7%) NPM1 77 (31%) 63 (29%) FLT3-ITD 65 (26%) 61 (29%) FLT3-TKD 30 (12%) 19 (9%) KRAS 4 (2%) 0 (0%) NRAS 23 (9%) 22 (10%)
TABLE-US-00002 TABLE 2 Details of identified CEBPA mutations, Detected mutations/sequence variations N-terminus before 2nd ATG bZIP other Double mutants 1316 del357C 1106-1107ins3bp -- 2169 del213C 1066-1067ins18 -- 2192 ins396GG 1060-1062dup -- 2230 del381C 1076-1078dup -- 2234 392-395dup 1084-1089dup -- 2240 del332C 1076-1078dup -- 2242 del252-261 dup1064-1066 -- 2253 del213 1051-1052ins36 -- 2273 ins472T 1062-1079dup -- 2748 ins424A 1057-1058ins3bp -- 2753 del302-317 1085-1087dup -- 3117 397delC 1090insAAG -- 6735 del377-389 1087insCAG -- 6975 397C > T (stop) 1076insTGG -- 7127 437delG 1090insAAG -- 7142 354delCG 1090insAAG -- 7148 248delTT 1072insGTGGAGACGCAGC -- ACCTAAAATCG 7149 382delC 1090insAAG -- 7406 406delCGGCAGC 1087insCAG -- 2218 -- dup1062-1094 (hom.) -- 3101 ins362CC (hom.) -- -- 3327 -- 1104-1115del (hom.) -- 6376 -- 1091insTGCTGGAGCTGCAG -- CGCAACGTGGAGACGCAG CAGAAGG (hom.) 2545 474C > G (stop) -- 813delG 4336 219insC 1016G > C (R > P)* -- 5362 349delTACATCGACCC 1033G > C, A > P* -- 5352 311delG -- 678ins13bp 5364 376insG -- 486-522dup Single mutants 2176 218insC -- -- 2194 ins468AACC -- -- 4341 309 CGG > TT -- -- 6462 445insCCAA -- -- 7075 219insC -- -- 7302 505delG -- -- 2188 -- -- 852insCCCGC AC 6247 -- 564insTA 6362 -- -- 648insG 2237 -- 1188-1189ins125 -- 3096 -- 1114-1134del -- 7185 -- 1029insGGACCC -- 7324 -- 1075-1203dup -- Other (not included in analysis) 2183 -- -- 722-736dup 5359 -- -- 575C > G, R > T *Point mutations in basic leucine zipper region, located in highly conserved amino acid. Vinson C. R., P. B. Sigler, and S. L. McKnight. Scissors-grip model for DNA recognition by a family of leucine zipper proteins. Science 1989, 246: 911-916.
TABLE-US-00003 TABLE 3 Clinical and molecular characteristics of 524 AML cases included in survival analysis N Median (Range) Sex Male 263 Female 261 Age 46.5 (15.0-77.0) Younger than 60 460 Older than 60 64 WBC × 10{circumflex over ( )}9/L 28.2 (0.3-510) Blasts in BM % 65 (0-98) Platelets × 10{circumflex over ( )}9/L 55 (3-998) FAB* M0 18 M1 105 M2 127 M3 25 M4 92 M5 114 M6 7 RAEB-t 10 10 ( . . . ) 4 11 ( . . . ) 19 Cytogenetic risk group Good 103 Intermediate 305 Poor 104 Cytogenetics.sup.† Normal cytogenetics 214 t(15; 17) 25 t(8; 21) 37 Inv(16) 41 11q23 22 3q 20 -5(q) 16 -7(q) 37 Chromosome 8 37 Complex karyotype 33 Other cytogenetic abnormality 130 Molecular abnormalities FLT3-ITD 141 FLT3-TKD 53 NPM1 157 NRAS 50 KRAS 5 *FAB indicates French-American-British classification .sup.†Each cytogenetic abnormality was taken into account, irrespective of the presence of other cytogenetic abnormalities.
TABLE-US-00004 TABLE 4 Clinical and molecular characteristics of CEBPA.sup.single-mut and CEBPA.sup.double-mut AML cases CEBPA.sup.double-mut CEBPA.sup.single-mut cases cases (N = 26) (N = 12) Median Median N (Range) N (Range) P* Sex 0.85 Male 16 7 Female 10 5 Age 45 (16-75) 52 (20-70) 0.27 Age group 0.40 Younger than 60 24 10 Older than 60 2 2 WBC × 10{circumflex over ( )}9/L 35.7 (3.4-174) 11.4 (2.8-263.4) 0.65 Blasts in BM % 65 (25-94) 70 (16-92) 0.66 Platelets × 51 (8-265) 89 (18-174) 0.087 10{circumflex over ( )}9/L FAB.sup.† 0.24 M0 0 0 M1 15 3 M2 7 4 M3 0 0 M4 2 3 M5 1 0 M6 0 0 RAEB-t 0 1 10 ( . . . ) 0 0 11 ( . . . ) 1 1 Cytogenetic 0.56 risk group Good 0 0 Intermediate 25 11 Poor 1 1 Cytogenetics** Normal 20 7 0.24 cytogenetics t(15; 17) 0 0 NA t(8; 21) 0 0 NA Inv(16) 0 0 NA 11q23 0 0 NA 3q 0 0 NA -5(q) 1 0 0.49 -7(q) 1 1 0.56 Chromosome 8 0 2 0.03* Complex 0 1 0.14 karyotype Other cytogenetic 5 2 0.85 abnormality Molecular abnormalities FLT3-ITD 3 5 0.034* FLT3-TKD 0 2 0.033* NPM1 0 3 0.0079* NRAS 3 1 0.76 KRAS 0 0 NA P values for chi-square test (categorical variables) and Mann-Whitney test (continuous variables) are given. *P value < 0.05. .sup.†FAB indicates French-American-British classification. NA: not applicable. **Each cytogenetic abnormality was taken into account, irrespective of the presence of other cytogenetic abnormalities
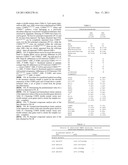
TABLE-US-00005 TABLE 5 25-probe set signature for CEBPA double mutations. Probe Set ID Gene Symbol Score 1* Score 2* 1 222423_at NDFIP1 0.0365 -0.6993 2 1555630_a_at RAB34 0.031 -0.5929 3 211682_x_at UGT2B28 -0.0278 0.5323 4 217800_s_at NDFIP1 0.0271 -0.519 5 223095_at MARVELD1 0.0225 -0.4307 6 202252_at RAB13 0.0182 -0.3482 7 1553183_at UMODL1 -0.0108 0.2071 8 217853_at TNS3 0.0093 -0.1783 9 1554300_a_at LOC136306 -0.009 0.1733 10 224710_at RAB34 0.0078 -0.1487 11 201841_s_at HSPB1 /// MEIS3 0.0077 -0.1483 12 222422_s_at NDFIP1 0.0077 -0.1473 13 234247_at -- -0.0069 0.132 14 227423_at LRRC28 -0.0057 0.1091 15 200765_x_at CTNNA1 0.0056 -0.1075 16 217226_s_at SFXN3 0.0056 -0.1072 17 220393_at GLULD1 -0.0045 0.086 18 224822_at DLC1 -0.0024 0.046 19 220974_x_at SFXN3 0.0011 -0.0204 20 215772_x_at SUCLG2 9.00E-04 -0.0165 21 206726_at PGDS -8.00E-04 0.0162 22 232227_at HSPC324 23 1553183_at TUBB6 24 1556599_s_at ARPP-21 25 204039_at CEBPA *Shrunken centroids for class 1 (CEBPAwt) and class 2 (CEBPA.sup.double-mut), respectively.
TABLE-US-00006 TABLE 6 19-probe set signature for CEBPA mutation. Probe Set ID Gene symbol Score 1* Score 2* 1 222423_at NDFIP1 0.0228 -0.291 2 223095_at MARVELD1 0.0209 -0.2676 3 211682_x_at UGT2B28 -0.0188 0.241 4 1555630_a_at RAB34 0.0172 -0.2202 5 201841_s_at HSPB1 /// MEIS3 0.0166 -0.2127 6 217800_s_at NDFIP1 0.0135 -0.1726 7 215772_x_at SUCLG2 0.0123 -0.1575 8 202252_at RAB13 0.0114 -0.1462 9 220974_x_at SFXN3 0.01 -0.1283 10 217226_s_at SFXN3 0.0094 -0.1209 11 217853_at TNS3 0.0094 -0.1201 12 212459_x_at SUCLG2 0.0075 -0.0958 13 1553183_at UMODL1 -0.0069 0.0877 14 227423_at LRRC28 -0.0055 0.071 15 1554300_a_at LOC136306 -0.0055 0.0704 16 200765_x_at CTNNA1 0.0039 -0.0504 17 227845_s_at SHD -0.0017 0.0217 18 204039_at CEBPA -6.00E-04 0.008 19 224822_at DLC1 -2.00E-04 0.0029 *Shrunken centroids for class 1 (CEBPAwt) and class 2 (CEBPAmut), respectively.
TABLE-US-00007 TABLE 7 Multivariable Cox's proportion hazards models. OS EFS Total cohort (N = 524) HR (95% CI) P* HR (95% CI) P* A. CEBPAmut † 0.48 (0.29-0.78) 0.0035* 0.53 (0.34-0.83) 0.0053* Intermediate.sup..dagger-dbl. 2.15 (1.48-3.14) <0.001* 1.96 (1.40-2.75) <0.001* Poor.sup..dagger-dbl. 3.29 (2.23-4.85) <0.001* 2.79 (1.96-3.98) <0.001* Age [decades] 1.18 (1.08-1.28) <0.001* 1.10 (1.02-1.19) 0.012* WBC.sup.§ 1.30 (1.02-1.64) 0.032* 1.23 (0.98-1.54) 0.07 FLT3-ITD.sup.| 1.58 (1.22-2.07) <0.001* 1.51 (1.17-1.94) 0.0014* NPM1.sup.| 0.57 (0.43-0.76) <0.001* 0.54 (0.41-0.72) <0.001* B. CEBPA.sup.single-mut † 1.18 (0.58-2.40) 0.65 1.61 (0.82-3.17) 0.16 CEBPA.sup.double-mut † 0.32 (0.17-0.61) <0.001* 0.35 (0.20-0.62) <0.001* Intermediate.sup..dagger-dbl. 2.21 (1.52-3.22) <0.001* 2.05 (1.46-2.87) <0.001* Poor.sup..dagger-dbl. 3.35 (2.27-4.94) <0.001* 2.85 (2.00-4.06) <0.001* Age [decades] 1.17 (1.08-1.28) <0.001* 1.10 (1.02-1.19) 0.014* WBC.sup.§ 1.33 (1.05-1.68) <0.019* 1.29 (1.03-1.62) 0.025* FLT3-ITD.sup.| 1.56 (1.20-2.03) <0.001* 1.46 (1.14-1.89) 0.0031* NPM1.sup.| 0.55 (0.41-0.74) <0.001* 0.51 (0.39-0.67) <0.001* C. Younger than 60 CEBPA.sup.single-mut † 1.08 (0.48-2.45) 0.85 1.55 (0.72-3.33) 0.26 CEBPA.sup.double-mut † 0.31 (0.15-0.61) <0.001* 0.34 (0.19-0.62) <0.001* Intermediate.sup..dagger-dbl. 2.50 (1.67-3.74) <0.001* 2.24 (1.57-3.21) <0.001* Poor.sup..dagger-dbl. 3.74 (2.48-5.65) <0.001* 3.06 (2.11-4.43) <0.001* Age [decades] 1.13 (1.02-1.26) 0.019* 1.09 (0.99-1.20) 0.093 WBC.sup.§ 1.35 (1.04-1.75) 0.024* 1.31 (1.03-1.67) 0.029* FLT3-ITD.sup.| 1.59 (1.19-2.11) 0.0014* 1.44 (1.10-1.89) 0.0088* NPM1.sup.| 0.50 (0.37-0.69) <0.001* 0.47 (0.35-0.63) <0.001* D. Normal cytogenetics CEBPA.sup.single-mut † 1.81 (0.72-4.56) 0.21 1.46 (0.57-3.61) 0.44 CEBPA.sup.double-mut .dagger-dbl. 0.43 (0.22-0.86) 0.017* 0.45 (0.24-0.84) 0.012* Age [decades] 1.16 (1.01-1.32) 0.035* 1.06 (0.94-1.20) 0.33 WBC.sup.§ 1.83 (1.22-2.74) 0.0035* 1.40 (0.96-2.04) 0.079 FLT3-ITD.sup.| 1.59 (1.09-2.32) 0.016* 1.57 (1.10-2.25) 0.012* NPM1.sup.| 0.47 (0.32-0.70) <0.001* 0.48 (0.33-0.70) <0.001* HR indicates hazard ratio, CI indicates confidence interval, ITD indicates internal tandem duplication. *P value <0.05 .sup.†CEBPA status versus CEBPAwt .sup..dagger-dbl.Cytogenetic risk versus cytogenetic good risk .sup.§White blood cell count higher than 20 × 10{circumflex over ( )}9/L versus lower than 20 × 10{circumflex over ( )}9/L .sup.|FLT3-ITD versus no FLT3-ITD .sup.|NPM1 mutation versus no NPM1 mutation
TABLE-US-00008 TABLE 8 Identification of CEBPA gene Affymetrix ID 204039_at Gene Name CEBPA SEQ ID NO: 144 Ensembl Gene ENSG00000184771 UniGene Hs.76171 EntrezGene 1050 Swiss Prot P49715, Q6P3S4 GenBank BX381916 BM454745 BX343831 BG166894 BX343822 Accession BX357445 BG481789 BF343807 BG480539 AW387104 BP381812 BM685384 BP318479 BP316640 BU536048 BE901458 DB355660 BE301008 AI971171 N39553 AI133307 BF897933 AA974969 BQ320594 BE817700 AI335709 H25130 AI359788 W87364 Clone ID CS0DI071YP19 IMAGE: 5583238 CS0DI026YB17 IMAGE: 4455116 CS0DI025YB17 IMAGE: 4652008 IMAGE: 4151059 IMAGE: 4652989 adSE00431 UI-E-CI0-aac-b-01-0-UI PCD07787 PCD01895 IMAGE: 6563891 IMAGE: 3957506 HEMBA1002093 IMAGE: 2906902 IMAGE: 2488780 IMAGE: 243975 IMAGE: 1555532 Ensembl* Chr 19 Start (bp) 38484084 End (bp) 38485044 Strand -1 CEBPA >0.9295 Double Mutant non-CEBPA <=0.9295 Double Mutant
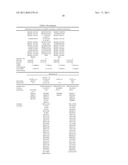
TABLE-US-00009 TABLE 9 Identification of the genes in a classifier according to a preferred embodiment Affymetrix ID 200765_s_at 223095_at 200764_s_at 1555630_a_at 232227_at 1553183_at 209191_at Gene Name MARVELD1 CTNNA1 RAB34 HSPC324 mRNA UMODL1 TUBB6 SEQ ID NO 145 146 and 147 148 149 150 151 Ensembl Gene ENSG00000155254 ENSG00000044115 ENSG00000109113 ENSG00000177398 ENSG00000176014 UniGene Hs.209614 Hs.534797 Hs.301853 Hs.242520 Hs.193491 EntrezGene 1495 83871 89766 84617 SwissProt Q9BSK0 B3KSR8, A8MYQ9, Q5DID0, B3KS31 B4DKT9, B4DNC0, Q6L9N1, Q2NKY5 B4DU00, B4E3A0, Q6L9N2, Q9BUF5 B4E2G8, Q6NXT3, Q6L9N3, P35221, Q96PJ7, Q6L9N4, Q8N1C0 Q9BZG1 Q6L9N5, Q6L9N6, Q6L9N7, Q6L9N8, Q6L9N9 GenBank AF325259 NM_001903 NM_031934 NM_173568 AK092677 Accession AK025996 U03100 AK074689 AY771619 BC002654 CR596454 L23805 CR596043 AB051810 NM_032525 AK027093 D14705 CR622817 NM_001004416 CR616368 BE893438 BC000385 CR613380 AY771620 AK001295 CB987999 D13866 CR612137 AB051811 AK098440 BQ069359 AK094151 CR620011 AK124223 AK022340 BM467964 BC031262 BC016841 AK093654 CR605380 BI760667 AK022326 CR614283 AK093909 CR595733 CB998043 AK055751 CR600820 AB096971 CR607214 AL561889 BM471580 BM923740 AB096970 CR593961 BF689317 BG325862 CR612854 AB096969 CR593665 BQ680528 BM470327 BM908364 AB096967 BC111374 BQ678428 BM541985 BM543785 AB096968 CR594370 BX427275 BQ921033 BC066904 BC039531 CR614714 BG680011 BG331611 AJ277106 BM554176 BQ931764 BQ688723 BM911471 AK027312 AB096966 CD518467 BX427274 CR591756 BC091510 AB096972 BM459986 BU146020 BM910414 BM927206 DB119958 BQ051130 BQ685706 BE872885 BI160806 DB203306 BM808494 BF525741 BF308274 BQ688695 AB096973 BM473459 BE784598 BI115155 BM471195 DB120482 BM916088 BQ431733 BQ680232 BG678790 DB105484 AL570105 BG119599 BG421344 AL572680 DA667096 BM916277 BU557883 BG324521 BQ690161 DB342848 BQ050656 BQ685699 BM809837 BM542780 DB107494 BE562844 AL520554 AL517624 BM459933 AI674725 BE908682 BQ722260 BU174894 AL582669 AL DB34454 BM916793 AL BU8 BM549588 B Clone ID IMAGE: 3921691 IMAGE: 5517928 IMAGE: 5759466 IMAGE: 5742385 IMAGE: 6464655 IMAGE: 30340385 IMAGE: 4562616 IMAGE: 5430926 THYMU2027857 IMAGE: 30396260 IMAGE: 5811757 IMAGE: 5539050 IMAGE: 5589119 TRACH2014018 IMAGE: 5532341 IMAGE: 5532864 IMAGE: 5527347 IMAGE: 5768168 THYMU2028637 IMAGE: 5785949 IMAGE: 5185189 IMAGE: 6470427 IMAGE: 5018808 THYMU2006277 IMAGE: 5471125 IMAGE: 30348746 IMAGE: 4550616 IMAGE: 6251210 NCRRP2000438 IMAGE: 5561909 THYMU2009363 CS0B006YF24 IMAGE: 5466258 IMAGE: 5517701 IMAGE: 2328624 IMAGE: 5482386 IMAGE: 4299175 IMAGE: 5453895 IMAGE: 4749251 THYMU3000028 CS0DI006YL18 IMAGE: 6273218 IMAGE: 3854669 CS0DI033YF23 THYMU2035004 IMAGE: 5482619 IMAGE: 6257558 IMAGE: 4131441 IMAGE: 6206810 IMAGE: 2686446 IMAGE: 5784634 CS0DM009YB15 IMAGE: 5022066 IMAGE: 5520781 IMAGE: 1369237 IMAGE: 3690396 IMAGE: 4751839 IMAGE: 6264343 IMAGE: 5532285 IMAGE: 2714078 IMAGE: 3901613 IMAGE: 6247732 IMAGE: 4590040 CS0DL007YP05 IMAGE: 3220570 IMAGE: 5483264 IMAGE: 6182685 IMAGE: 4560593 CS0DC027YN21 IMAGE: 3210444 IMAGE: 5480342 IMAGE: 6250286 IMAGE: 5454742 CS0DF036YK16 CS0DI048YB17 IMAGE: 4212835 CS0DA003YN06 IMAGE: 5431145 IMAGE: 5573184 IMAGE: 3877109 IMAGE: 6253265 IMAGE: 30335877 CS0DF032YF04 IMAGE: 61594040 IMAGE: 5441502 IMAGE: 6255765 IMAGE: 5812025 IMA IMAG IMAGE: IMAGE Ensembl* Chr 10 5 17 21 18 Start (bp) 99463469 138117006 24065429 42356137 12298215 End (bp) 99467897 138298619 24069328 42436174 12316551 Strand 1 1 -1 1 1 CEBPA -1.2350042 -1.1971764 -1.1888662 1.1646809 1.1563656 -1.1314407 Double Mutant non-CEBPA 0.6058511 0.5872941 0.5832174 -0.5713529 -0.5672737 0.5550464 Double Mutant
TABLE-US-00010 TABLE 10 Identification of the genes in a classifier according to a preferred embodiment Affymetrix ID 1555630_a_at 211682_x_at 223095_at 202252_at Gene Name RAB34 UGT2B10 MARVELD1 RAB13 SEQ ID NO: 148 152 145 153 Ensembl Gene ENSG00000109113 ENSG00000109181 ENSG00000155254 ENSG00000143545 UniGene Hs.301853 Hs.201634 Hs.209614 EntrezGene 83871 7365 5872 A8MYQ9,B4 B5BUM0, Q9BSK0 P51153 DNC0, Q9BY64 Q504R6 B4E3A0, Q6NXT3, Q96PJ7, Q9BZG1 GenBank NM_031934 AK292738 AF325259 Accession AK074689 BC I 13649 AK025996 CR596043 AK222872 CR596454 CR622817 AK222839 AK027093 CR613380 NM_001075 BE893438 CR612137 CD013995 CB987999 CR620011 CD013994 BQ069359 BC016841 BG208263 BM467964 CR614283 BG189133 BI760667 CR600820 BG460626 CB998043 BM923740 DA636871 AL561889 CR612854 BG207749 BF689317 BM908364 BG 193837 BQ680528 BM543785 BG212458 BQ678428 BC066904 BG201991 BX427275 AJ277106 CD610479 BG680011 AK027312 DV080704 BQ688723 BC091510 DV080703 BX427274 BM927206 AV657530 BU146020 BI160806 CB113377 BQ685706 BQ688695 BJ994179 BF525741 BM471195 BP239062 BE784598 BG678790 BJ996532 BQ431733 AL572680 DA035754 BG119599 BQ690161 DA036946 BU557883 BM542780 CB161428 BQ685699 BM459933 CB164598 AL520554 AL582669 AL DA035976 BQ722260 BJ BU8 Clone ID IMAGE: 5759466 LIVER1000008 IMAGE: 3921691 IMAGE: 5430926 MGC9.4.1.1.1.D12 IMAGE: 30340385 IMAGE: 5589119 GLCFCH04 IMAGE: 5811757 IMAGE: 5768681 L7N800102-1-G03 IMAGE: 5532864 hmfn-2739 IMAGE: 5018808 HEP05515 IMAGE: 5185189 hyst-1724 IMAGE: 6251210 BEAST2001235 IMAGE: 30348746 IMAGE: 5517701 BEAST2002650 CS0DB006YF24 IMAGE: 4749251 L 1 7N670205 IMAGE: 4299175 n1-44-E11 CS0DI033YF23 L17N670205 IMAGE: 6273218 n1-40-B03 IMAGE: 6206810 BEAST2001491 IMAGE: 6257558 IMAGE: 5520781 hmfn-1058 CS0DM009YB15 IMAGE: 5532285 LIVER2000454 IMAGE: 4751839 CS0DL007YP05 BRHIP3026232 IMAGE: 6247732 CS0DC027YN21 LIVER2005346 IMAGE: 6182685 CS0DF036YK16 TLIVE2000399 IMAGE: 6250286 IMAGE: 5431145 BEAST1000079 IMAGE: 4212835 IMAGE: 30335877 LIVER2001765 IMAGE: 3877109 IMAGE: 6255765 FEKI IMAGE: 6159404 IMAGE: IMA Ensembl* Chr 17 4 10 1 Start (bp) 24065429 69716300 99463469 152220756 End (bp) 24069328 69731217 99467897 152225430 Strand -1 1 1 -1 CEBPA -1.1888662 2.5589241 -1.2350042 -2.5430716 Double Mutant non-CEBPA 0.5832174 -0.1719174 0.6058511 0.1708524 Double Mutant Affymetrix ID 200765_x_at 1556599_s_at 200764s_att 222423_at 217853_at Gene Name ARPP-21 CTNNA1 TNS3 SEQ ID NO: 154 146 and 147 155 156 Ensembl Gene ENSG00000044115 ENSG00000131507 ENSG00000136205 UniGene Hs.534797 Hs.698981 Hs.520814 EntrezGene 100130503, 1495 80762 64759 10777 A8K0T4, B3KSR8, B2RDB8, B2RNV1 , A8KIF3, B4DKT9, Q9BT67 Q59GW4, B4DG96, B4DU00, Q68CZ2, Q9UBL0 B4E2G8, Q8NDL6, P35221, Q9H8D5 Q8N1C0 GenBank NM_001903 NM_022748 Accession U03100 CR749644 L23805 AF378756 D14705 AB208995 BC000385 BX648770 D13866 BX649002 AK094151 AB062750 BC031262 AF417489 AK022326 AK023794 AK055751 AL833845 BM471580 AK001539 BG325862 AL137468 BM470327 AK092864 BM541985 AK002151 BQ921033 CR612439 BG331611 CR626304 BM911471 BC071791 CR591756 BM549238 BM910414 BM464033 BE872885 BM479835 BF308274 CF455895 BI115155 BU177971 BQ680232 BQ219649 BG421344 AL574224 BG324521 BX402420 BM809837 BX343887 AL517624 BM456641 BU174894 AL550191 BF BM549588 B Clone ID IMAGE: 5517928 IMAGE: 5548500 IMAGE: 5540062 IMAGE: 4562616 IMAGE: 5577335 IMAGE: 30515668 IMAGE: 5539050 IMAGE: 6110724 IMAGE: 6052747 IMAGE: 5527347 CS0DI039YB04 CS0DI033YA01 IMAGE: 6470427 IMAGE: 5496318 IMAGE: 4067904 IMAGE: 4550616 IMAGE: 4375295 IMAGE: 6182151 IMAGE: 5466258 IMAGE: 6183810 IMAGE: 6021041 IMAGE: 5453895 IMAGE: 4642284 IMAGE: 6182344 IMAGE: 3854669 IMAGE: 6180126 IMAGE: 6598436 IMAGE: 4131441 IMAG IMAGE: 5022066 IMAGE: 6264343 IMAGE: 4590040 IMAGE: 4560593 IMAGE: 5454742 CS0DA003YN06 IMAGE: 6253265 IMAGE: 5441502 IMAG Ensembl* Chr 5 5 7 Start (bp) 138117006 141468508 47281277 End (bp) 138298619 141513222 47588216 Strand 1 1 -1 CEBPA 2.4642698 -1.1971764 -2.4427875 -2.3294763 Double Mutant non-CEBPA -0.1655582 0.5872941 0.1641149 0.1565023 Double Mutant
TABLE-US-00011 TABLE 11 Twelve gene probe sets Nr from Table 5 Probe Set ID Gene Symbol SEQ ID NO: s 1 222423_at NDFIP1 122-132 217800_s_at 2 1555630_a_at RAB34 45-55 3 211682_x_at UGT2B28/B10 89-99 5 223095_at MARVELD1 12-22 6 202252_at RAB13 100-110 7 1553183_at UMODL1 67-77 8 217853_at TNS3 133/143 15 200765_x_at CTNNA1 23-33 200764_x_at 34-44 22 232227_at HSPC324 56-66 23 209191_at TUBB6 78-88 24 1556599_s_at ARPP-21 111-121 25 204039_at CEBPA 1-11
TABLE-US-00012 TABLE 12 Seven gene probe sets Nr from Table 5 Probe Set ID Gene Symbol 2 1555630_a_at RAB34 5 223095_at MARVELD1 7 1553183_at UMODL1 15 200765_x_at CTNNA1 200764_x_at 22 232227_at HSPC324 23 1553183_at TUBB6 25 204039_at CEBPA
TABLE-US-00013 TABLE 13 Nine gene probe set Probe Set ID Gene Symbol 1 222423_at NDFIP1 217800_s_at 2 1555630_a_at RAB34 3 211682_x_at UGT2B28/B10 5 223095_at MARVELD1 6 202252_at RAB13 8 217853_at TNS3 15 200765_x_at CTNNA1 24 1556599_s_at ARPP-21 25 204039_at CEBPA
EXAMPLES
AML Samples, mRNA Isolation, dHPLC Analysis and Nucleotide Sequencing
[0034] Bone marrow aspirates or peripheral blood samples of 598 cases of de novo AML were collected, blast cells were purified, and mRNA was isolated as reported.12 The entire CEBPA coding region was investigated by dHPLC and nucleotide sequencing. For details on patient characteristics and experimental procedures, see below.
Statistical Analysis
[0035] Survival was estimated according to the method by Kaplan and Meier. The log rank test was used to assess statistical significance. Multivariable analysis was performed using Cox's proportional hazards models. Definitions for outcome parameters and cytogenetic risk groups have been described.13 Further details are given below.
Gene Expression Profiling Analysis
[0036] Gene expression profiles were obtained using Affymetrix HGU133Plus2.0 GeneChips.12 Details on data processing and analysis are given below.
Materials and Methods
Patient Characteristics and Molecular Analyses
[0037] CEBPA mutations were assessed in a cohort of 598 cases of de novo AML. Detailed clinical and molecular characteristics were available for 524/598 cases (Table 3). These 524 were enrolled in the Dutch-Belgian Hemato-Oncology Cooperative Group (HOVON)-04, -10, -12, -29, -32, -42, or -43 protocols (available at http://www.hovon.nl). Reverse-transcription polymerase chain reaction (RT-PCR) and sequence analyses for FLT3-ITD, FLT3-TKD, NPMJ, N-RAS, and K-RAS, mutations were performed as described previously.1-3
Detection of CEBPA Mutations
[0038] Complementary DNA (cDNA) was generated from 1 μg of mRNA using SuperScript reverse transcriptase (Invitrogen). The CEBPA coding region was divided into three overlapping amplicons (FIG. 1, Panel A). Primers for the three fragments (A, B and C) are shown in Table 14. PCR amplification for all three fragments was carried out using 2 μl of cDNA in mixes containing 0.5 mM dNTPs, 10% DMSO, 2 mM MgCl2, 0.4 μM of forward and reverse primer, 1×PCR buffer and 2.5 units of Taq polymerase (Invitrogen), in a total volume of 50 microliters. Thermal cycling conditions for the three reactions were equal, i.e., denaturation at 94° C. for 5 minutes, followed by 35 cycles of 94° C. for 1 minute, 56° C. for 1 minute and 72° C. for 1 minute, and a final 5-minute elongation step of 72° C. After PCR amplification, 10 μl of PCR product was mixed with 10 μl of corresponding PCR product obtained from NB4 cell line cDNA. Heteroduplexes were allowed to form in an Applied Biosystems GeneAmp PCR System 9700 (two cycles of 95° C. for 3 minutes, cooled to 20° C. with a ramp of 5%, and maintained at 20° C. for 5 minutes). The samples were then subjected to denaturing high-performance liquid chromatography (DHPLC) analysis on a Transgenomics WAVE device, using temperatures of 65.4° C., 66.4° C. and 65.5° C., respectively. Data were analyzed using Transgenomics software, and aberrant peaks were independently scored by two investigators. Samples with aberrant peaks were subjected to direct nucleotide sequencing on an Applied Biosystems 3100 using the forward and reverse primers. In case a mutation was found, a second analysis on new input material was performed to rule out PCR-induced artifacts.
[0039] In AML cases for which dHPLC had revealed one single heterozygous mutation, the CEBPA coding region was fully sequenced to exclude the possibility that a second mutation had gone unnoticed. In three cases with an N-terminal mutation (#4336, #5362 and #5364), this extra analysis revealed an additional bZIP mutation. Two of these three were single nucleotide variations that were predicted to lead to substitutions of conserved amino acids in the basic region.4
[0040] Cases that appeared negative by dHPLC were additionally screened as follows. The CEBPA N-terminal part was nucleotide sequenced using previously described primers 2 and 10.5 Insertions or deletions in the basic leucine zipper domain were detected using a previously described ethidium bromide agarose gel electrophoresis approach and subsequent nucleotide sequencing (primers 4 and 8) in cases with apparent abnormalities.5
TABLE-US-00014 TABLE 14 Primer sequences SEQ Primer Start (relative ID name to XM_009180.3) Sequence (5' to 3') NO: A fw 142 CGCCATGCCGGGAGAACTCT 157 A rev 400 CTTCTCCTGCTGCCGGCTGT 158 B fw 385 GCCGCCTTCAACGACGAGTT 159 B rev 643 CTTGGCTTCATCCTCCTCGC 160 C fw 634 CGGCCGCTGGTGATCAAG 161 C rev 1235 CCCAGGGCGGTCCCACAGC 162
Statistical Analysis
[0041] Statistical analyses were performed in Statistical Package for the Social Sciences (SPSS) software, version 16.0. All patients received induction therapy and were included in the survival analysis. Actuarial probabilities of overall survival (OS, with death due to any cause) and event-free survival (EFS, with failure in case of no complete remission at day 1 [CR1] or relapse or death) were estimated by the method of Kaplan and Meier, and significance was assessed with the log rank test. Cox's proportional hazards models were fitted for multivariable analysis. Cytogenetic risk groups (favorable, intermediate, or poor) were defined as described.1 Briefly, patients with inv(16)/t(16;16), t(8;21), and t(15;17) abnormalities, irrespective of the presence of additional cytogenetic aberrations, were considered as being in the favorable-risk category. These included a small number of cases in which the abnormality had been identified by RQ-PCR, despite noinial cytogenetics. The poor-risk category was defined by the presence of -5/del(5q), -7del(7q), t(6;9), t(9;22), 3q26 abnormality, or complex karyotype (more than three abnormalities) in the absence of good risk cytogenetic characteristics. All other patients were classified as intermediate risk. All tests were two-tailed, and a P value of less than 0.05 was considered statistically significant.
[0042] To investigate whether CEBPA mutations related to gene expression, we examined GEP data of 524 AML cases (including 26 CEBPA.sup.double-mut and 12 CEBPA.sup.single-mut cases). Clinical and molecular characteristics of the AML cases are depicted in Tables 3 and 4. Using a supervised approach, Prediction Analysis for Microarrays (PAM),17 we derived a 19-probe set signature predictive for CEBPA mutations (FIG. 1, Panel C). This classifier showed a high specificity (99%), but a limited sensitivity (67%) in cross-validation. Strikingly, misclassification was almost entirely due to CEBPA.sup.single-mut cases, whereas CEBPA AMLs were predicted with an accuracy that was near perfect (FIG. 1, Panel C). In line with this, we were able to derive a specific CEBPA.sup.double-mut classifier, consisting of 21 probe sets, with a cross-validated sensitivity of 100% (Table 5). In further support, unsupervised analysis of GEP data from the selected mutant subset confirmed an underlying variability that correlated with mutation status.
[0043] We next assessed whether our observations could be related to differences in clinical outcome. In line with previous data, overall survival (OS) and event-free survival (EFS) were better for CEBPAmut cases compared to cases with wild-type CEBPA (CEBPAwt) (FIG. 1, Panel D, and FIG. 3). Separate analyses for the two mutation subgroups, however, revealed a favorable outcome for CEBPA.sup.double-mut cases but failed to find the same for the CEBPA.sup.single-mut cases (FIG. 1, Panels E and G). In fact, CEBPA.sup.single-mut AMLs showed a significantly worse outcome than CEBPA.sup.double-mut cases. These findings were retained in multivariable analyses (Table 1). When only patients younger than 60 were taken into account, similar results were found (FIG. 1, Panel F, Table 1). Likewise, in the selected subset of AML with normal cytogenetics, significant differences in OS and EFS were observed between CEBPA.sup.double-mut and CEBPA.sup.single-mut AMLs (FIG. 1, Panel G, Table 1).
[0044] Based on previous analyses in a subset of our cases3 and based on literature, it is likely that in the majority of CEBPA .sup.double-mut cases studied, both alleles were affected. A liable hypothesis is, therefore, that absence of wild-type CEBPA mRNA is directly involved in the CEBPA.sup.double-mut gene expression profile. It is possible that analysis of larger patient series will lead to further refinement of the subclassification suggested here. Our data for instance indicated a tendency of CEBPA.sup.single-mut cases with a mutation in the bZIP region, directly involved in DNA binding, to be potentially less distinct from the double mutants (cases #7185, #7324 and #2237; (FIG. 1, Panel C).
[0045] Studies to date have associated CEBPA mutations with outcome,3,4,9,18 but have not applied subdivisions into single and double mutants. It is unclear why AMLs with CEBPA.sup.double-mut would have a better outcome than those with single mutations. One explanation could be that single mutations are not sufficient for leukemogenesis and require additional mutations. In possible support of this hypothesis, we found significantly more FLT3-ITD, FLT3-TKD and NPM1 mutations in CEBPA.sup.single-mut compared to CEBPA.sup.double-mut cases (Table 4). Currently unknown abnormalities may associate with CEBPA.sup.single-mut AML as well and predispose to relatively inferior outcome. It seems evident, however, that these findings and their clinical significance warrant further investigation and confirmation in independent series of AML.
[0046] In summary, the data presented here indicate that CEBPA mutant AML should not be considered a single biologic and clinical group but at least be distinguished according the presence of CEBPA.sup.double-mut and CEBPA.sup.single-mut. We suggest that screening using dHPLC, followed by nucleotide sequencing, should rapidly identify mutant cases. Second, gene expression based classification, for instance, using the classifiers described here, should allow accurate identification of CEBPA.sup.double-mut AML cases.
U133Plus2 GeneChip Gene Expression Profiling Analysis
[0047] Raw microarray data were processed using Affymetrix Microarray Suite 5 (MASS) to target intensity values of 100. Intensity values lower than 30 were set at 30, and subsequently all data were log2 transformed.
[0048] Gene expression classifiers for CEBPAmut and CEBPA.sup.double-mut were derived using Prediction Analysis for Microarrays (PAM)6 version 1.28 in R version 2.1.0. The method of the nearest shrunken centroids identifies a subgroup of genes that best characterizes a predefined class. In accordance with good practice guidelines,7'8 all available data were used for classifier construction, and estimated predictive performances were based on cross-validation as follows. PAM was first used to train a classifier based on the entire data set of 524 AML cases. Next, selection of a shrinkage factor (in order to only use the most informative genes) as well as estimation of classifier performance were carried out using ten-fold cross-validation, involving a random split of the data into ten folds, which was balanced with respect to mutation status. Each fold was once used as an independent validation set for a classifier that has been trained on the remaining nine folds. The minimum number of misclassified cases was subsequently determined, and the corresponding shrinkage threshold was recorded. Furthermore, sensitivity and specificity were calculated. This entire procedure of ten-fold random cross-validation was repeated 100 times. Reported final classifiers represent the probe sets that remained after shrinkage using the median threshold over the 100 cross-validations. Reported final sensitivities and specificities represent the averages over the 100-cross-validations. Criterion for the CEBPAmut classifier was minimum total misclassification rate (i.e., minimum false positives+false negatives). Criterion for the reported CEBP .sup.double-mut classifier was minimum misclassification of double mutant specimens (i.e., minimum false negatives).
[0049] Principal component analysis was performed using Spotfire Decision Site (Spotfire, Inc., Somerville, Mass.). Before the analysis, data for all probe sets were mean-centered.
CEPBA.sup.double-mut Analysis with the AMLProfiler
[0050] In addition to the detection of CEBPA.sup.double-mut among results obtained with the U133Plus2 GeneChip platform, we have also hybridized 505 of the above 598 AML cases on the AMLProfiler to optimize the procedure for this platform. Also, we have improved the performance of the procedure through addition of a gene expression level pre-filtering. After normalization, scaling, imputation, intensity mean centering, and log2 transformation, the first criterion is that all CEBPA.sup.double-mut have a gene expression above a certain threshold for the CEBPA gene itself. Next, a LDA classifier decides whether a sample is CEBPA.sup.double-mut or not. This has shown to be the most efficient method so far. Details of the sequences used are provided in the various tables.
[0051] These results show that the selection of classifier genes is independent from the platform used for determining the expression levels of the genes identified herein. Hence, the teaching of this patent application may be extended to any platform. However, the U133Plus2 Genechip platform and the AML Profiler platform remain preferred.
AMLProfiler GeneChip Gene Expression Profiling Analysis
[0052] Raw microarray data were processed using Affymetrix Microarray Suite 5 (MASS) to target intensity values of 1500. Intensity values lower than 30 were set at 30, and subsequently all data were log2 transformed. The data was mean-centered per probe. All computational analyses were performed using R (www.r-project.org, version 2.9.2) or Matlab (www.mathworks.com, version R2009a).
[0053] The procedure to detect the CEBPA.sup.double-mut status consists of two serial steps (see FIG. 4). In the first step, samples with a CEBPA expression below a threshold are all predicted as non-double mutant. In the second step, a classifier is trained to predict CEBPA.sup.double-mut vs non-CEBPA.sup.double-mut (linear classifier, LDA, Dabney et al., Bioinformatics, 2005). Currently, two procedures are preferred, differing in the chosen threshold in the first step, and consequentially have a slightly different classifier in the second step (see FIG. 5).
[0054] Based on a double-loop cross-validation protocol (DLCV, Wessels et al., Bioinformatics, 2005), we determined an optimal set of genes for the classifier. This DLCV was run with 100 repeats of each of 26 folds in the outer loop, and ten-fold cross-validation in the inner loop. Probes were ranked univariately (t-test, equal variance), and learning curves were constructed for up to 50 probes. The classifier was optimized such that the average false positive ratio/false negative ratio was minimal. Reported final signatures were derived using all samples, using the number of features estimated in the DLCV.
[0055] For procedure 1, we chose a threshold value of t=0.9295 such that all hypermethylated samples are well below the threshold (see FIG. 6). Subsequently, a classifier set of seven genes was used in a method according to the invention. Both samples and genes were hierarchically clustered (see FIG. 6), and a PCA plot was constructed (see FIG. 7). In addition, Table 9 lists the seven probes with extensive annotation.
[0056] For procedure 2, we chose a threshold t=-0.9532. We determined an optimal set of nine genes for the classifier. Both samples and genes were hierarchically clustered (see FIG. 8), and a PCA plot was constructed (see FIG. 9). In addition, Table 10 lists the nine probes with extensive annotation.
REFERENCES FOR THE EXAMPLES SECTION
[0057] 1. Verhaak R. G., C. S. Goudswaard, W. van Putten, et al. Mutations in nucleophosmin
[0058] (NPM1) in acute myeloid leukemia (AML): association with other gene abnomialities and previously established gene expression signatures and their favorable prognostic significance. Blood 2005, 106:3747-3754.
[0059] 2. Valk P. J., D. T. Bowen, M. E. Frew, A. C. Goodeve, B. Lowenberg, and J. T. Reilly. Second hit mutations in the RTK/RAS signaling pathway in acute myeloid leukemia with inv(16). Haematologica 2004, 89:106.
[0060] 3. Care R. S., P. J. Valk, A. C. Goodeve, et al. Incidence and prognosis of c-KIT and FLT3 mutations in core binding factor (CBF) acute myeloid leukaemias. Br. J. Haematol. 2003, 121:775-777.
[0061] 4. Vinson C. R., P. B. Sigler, and S. L. McKnight. Scissors-grip model for DNA recognition by a family of leucine zipper proteins. Science 1989, 246:911-916.
[0062] 5. Barjesteh van Waalwijk van Doorn-Khosrovani S., C. Erpelinck, J. Meijer, et al. Biallelic mutations in the CEBPA gene and low CEBPA expression levels as prognostic markers in intermediate-risk AML. Hematol. J. 2003, 4:31-40.
[0063] 6. Tibshirani R., T. Hastie, B. Narasimhan, and G. Chu. Diagnosis of multiple cancer types by shrunken centroids of gene expression. Proc. Natl. Acad. Sci. U.S A. 2002, 99:6567-6572.
[0064] 7. Simon R. Roadmap for developing and validating therapeutically relevant genomic classifiers. J. Clin. Oncol. 2005, 23:7332-7341.
[0065] 8. Dupuy A., and R. M. Simon. Critical review of published microarray studies for cancer outcome and guidelines on statistical analysis and reporting. J. Natl. Cancer Inst. 2007, 99:147-157.
REFERENCES FOR THE BODY OF THE DESCRIPTION
[0066] 1. Zhang D. E., P. Zhang, N. D. Wang, C. J. Hetherington, G. J. Darlington, and D. G. Tenen. Absence of granulocyte colony-stimulating factor signaling and neutrophil development in CCAAT enhancer binding protein alpha-deficient mice. Proc. Natl. Acad. Sci. U.S.A. 1997, 94:569-574.
[0067] 2. Zhang P., J. Iwasaki-Arai, H. Iwasaki, et al. Enhancement of hematopoietic stem cell repopulating capacity and self-renewal in the absence of the transcription factor C/EBP alpha. Immunity 2004, 21:853-863.
[0068] 3. Barjesteh van Waalwijk van Doom-Khosrovani S., C. Erpelinck, J. Meijer, et al. Biallelic mutations in the CEBPA gene and low CEBPA expression levels as prognostic markers in intermediate-risk AML. Hematol. J. 2003, 4:31-40.
[0069] 4. Frohling S., R. F. Schlenk, I. Stoize, et al. CEBPA mutations in younger adults with acute myeloid leukemia and normal cytogenetics: prognostic relevance and analysis of cooperating mutations. J. Clin. Oncol. 2004, 22:624-633.
[0070] 5. Gombart A. F., W. K. Hofmann, S. Kawano, et al. Mutations in the gene encoding the transcription factor CCAAT/enhancer binding protein alpha in myelodysplastic syndromes and acute myeloid leukemias. Blood 2002, 99:1332-1340.
[0071] 6. Pabst T., B. U. Mueller, P. Zhang, et al. Dominant-negative mutations of CEBPA, encoding CCAAT/enhancer binding protein-alpha (C/EBPalpha), in acute myeloid leukemia. Nat. Genet. 2001, 27:263-270.
[0072] 7. Nerlov C. C/EBPalpha mutations in acute myeloid leukaemias. Nat. Rev. Cancer 2004, 4:394-400.
[0073] 8. Leroy H., C. Roumier, P. Huyghe, V. Biggio, P. Fenaux, and C. Preudhomme. CEBPA point mutations in hematological malignancies. Leukemia 2005, 19:329-334.
[0074] 9. Preudhomme C., C. Sagot, N. Boissel, et al. Favorable prognostic significance of CEBPA mutations in patients with de novo acute myeloid leukemia: a study from the Acute Leukemia French Association (ALFA). Blood 2002, 100:2717-2723.
[0075] 10. Schlenk R. F., K. Dohner, J. Krauter, et al. Mutations and treatment outcome in cytogenetically normal acute myeloid leukemia. N. Engl. J. Med. 2008, 358:1909-1918.
[0076] 11. Lin L. I., C. Y. Chen, D. T. Lin, et al. Characterization of CEBPA mutations in acute myeloid leukemia: most patients with CEBPA mutations have biallelic mutations and show a distinct immunophenotype of the leukemic cells. Clin. Cancer Res. 2005, 11:1372-1379.
[0077] 12. Valk P. J., R. G. Verhaak, M. A. Beijen, et al. Prognostically useful gene-expression profiles in acute myeloid leukemia. N. Engl. J. Med. 2004, 350:1617-1628.
[0078] 13. Verhaak R. G., C. S. Goudswaard, W. van Putten, et al. Mutations in nucleophosmin (NPM1) in acute myeloid leukemia (AML): association with other gene abnormalities and previously established gene expression signatures and their favorable prognostic significance. Blood 2005, 106:3747-3754.
[0079] 14. Wouters B. J., I. Louwers, P. J. Valk, B. Lowenberg, and R. Delwel. A recurrent in-frame insertion in a CEBPA transactivation domain is a polymorphism rather than a mutation that does not affect gene expression profiling-based clustering of AML. Blood 2007, 109:389-390.
[0080] 15. Resende C., G. Regalo, C. Duraes, F. Carneiro, and J. C. Machado. Genetic changes of CEBPA in cancer: mutations or polymorphisms? J. Clin. Oncol. 2007, 25:2493-2494; author reply 2494-2495.
[0081] 16. Biggio V., A. Renneville, O. Nibourel, et al. Recurrent in-frame insertion in C/EBPalpha
[0082] TAD2 region is a polymorphism without prognostic value in AML. Leukemia 2008, 22:655-657.
[0083] 17. Tibshirani R., T. Hastie, B. Narasimhan, and G. Chu. Diagnosis of multiple cancer types by shrunken centroids of gene expression. Proc. Natl. Acad. Sci. U.S.A. 2002, 99:6567-6572.
[0084] 18. Bienz M., M. Ludwig, E. O. Leibundgut, et al. Risk assessment in patients with acute myeloid leukemia and a normal karyotype. Clin. Cancer Res. 2005, 11:1416-1424.
[0085] 19. Wouters B. J., M. A. Jorda, K. Keeshan, et al. Distinct gene expression profiles of acute myeloid/T-lymphoid leukemia with silenced CEBPA and mutations in NOTCH1. Blood 2007, 110:3706-3714.
Sequence CWU
1
162125DNAHomo sapiens 1aagctaggtc gtgggtcagc tctga
25225DNAHomo sapiens 2agctctgagg atgtataccc ctggt
25325DNAHomo sapiens 3gagggagacc
tagagatctg gctgt 25425DNAHomo
sapiens 4agccttgttt gtactgtatg ccttc
25525DNAHomo sapiens 5atgccttcag cattgcctag gaaca
25625DNAHomo sapiens 6gaacacgaag cacgatcagt ccatc
25725DNAHomo sapiens 7tcaacacttg
tatctggcct ctgtg 25825DNAHomo
sapiens 8tgtgaatgta ccgtctctgc taaac
25925DNAHomo sapiens 9tgtttggttt tctcggatac ttgcc
251025DNAHomo sapiens 10gccaaaatga gactctccgt
cggca 251125DNAHomo sapiens
11ccctggctcc tggtcgggaa gggag
251225DNAHomo sapiens 12tgcctgtagc attccagagc tcact
251325DNAHomo sapiens 13ctcactctgt ctgccaggta tgaga
251425DNAHomo sapiens
14agaagaacac gtaagaccgc cacca
251525DNAHomo sapiens 15ctgcccccag aacttttgga tactg
251625DNAHomo sapiens 16ggaggcagtt gcataggtct ccctc
251725DNAHomo sapiens
17gcccaagact actctgggca gctcc
251825DNAHomo sapiens 18ggaaaggatt tctacagtgt tctat
251925DNAHomo sapiens 19agagagagtg ggtttgggaa gagtg
252025DNAHomo sapiens
20gttggggaga ggggaccgat gtgcc
252125DNAHomo sapiens 21gaccgatgtg cctcattgtt tagtg
252225DNAHomo sapiens 22ttctggataa agtttggttg tttgc
252325DNAHomo sapiens
23aatgcaggag cctacttcta gctgt
252425DNAHomo sapiens 24gaccaagccg agatgccatt ctctt
252525DNAHomo sapiens 25ttctcttagt gatggcggcg ttagg
252625DNAHomo sapiens
26gttgagaggg tgcagtccag acagc
252725DNAHomo sapiens 27gtccagacag cttgactgct tttaa
252825DNAHomo sapiens 28gacctgtggt aagcaacctg gcatc
252925DNAHomo sapiens
29ttactaatgt acgctgctgc aggac
253025DNAHomo sapiens 30gctacagtgt ctcgatgcca taatc
253125DNAHomo sapiens 31tcagaacaca ctttttttcc tcttt
253225DNAHomo sapiens
32tttctcccag cttcaaatgc acaat
253325DNAHomo sapiens 33aattcatcat tgggctcact tctaa
253425DNAHomo sapiens 34aggtgcagaa tctcggcggg gagct
253525DNAHomo sapiens
35gaatctcggc ggggagcttg ttgtc
253625DNAHomo sapiens 36gatccaggca gccaagaact tgatg
253725DNAHomo sapiens 37aacaggatga gacacagacc aagat
253825DNAHomo sapiens
38tggacagcat ctaagtctgc ccagg
253925DNAHomo sapiens 39ggctcctgaa tatcagtcac tgttc
254025DNAHomo sapiens 40cagtcactgt tcgtcactca aatga
254125DNAHomo sapiens
41tacaacactg atactagatt ccaca
254225DNAHomo sapiens 42ggaaatgggc agactgaacc agtcc
254325DNAHomo sapiens 43gaaccagtcc aggtggtgaa ttttc
254425DNAHomo sapiens
44aatgcaggag cctacttcta gctgt
254525DNAHomo sapiens 45aatgcattgc atcaacctac tatag
254625DNAHomo sapiens 46ggagctcaag ccatcatcat tgtct
254725DNAHomo sapiens
47gtggcatctc tggaacatac caagc
254825DNAHomo sapiens 48ggagaatgac ccttccagtg tgctt
254925DNAHomo sapiens 49tgcttctctt ccttgtaggt tccaa
255025DNAHomo sapiens
50gttccaagaa ggatctgagt acccc
255125DNAHomo sapiens 51ccctgctcag tatgcgctga tggag
255225DNAHomo sapiens 52ccctggacat ttgcactgac tttat
255325DNAHomo sapiens
53agctgggatc atgctagtca cttcc
255425DNAHomo sapiens 54ggagagtgtc tctgttcttt tgctc
255525DNAHomo sapiens 55ggatgcttaa tgattccagc ctctc
255625DNAHomo sapiens
56gagggagaac tttcctgtgg acgtc
255725DNAHomo sapiens 57tcaaccgagg gggaggtcac ttccg
255825DNAHomo sapiens 58tcacttccga atccacagat ggcgt
255925DNAHomo sapiens
59gatggcgtgt gagtgcatgg cgagc
256025DNAHomo sapiens 60ctccaggaca cacttactgt tccct
256125DNAHomo sapiens 61ctgctctttg cagctgcctg caagg
256225DNAHomo sapiens
62tgcaaggggt tcctgcgaag accag
256325DNAHomo sapiens 63agagcctgcg gctgaacttg aactc
256425DNAHomo sapiens 64gaactcgcag ctacctgagt cagac
256525DNAHomo sapiens
65tgagtcagac ctgtgctttt tcacc
256625DNAHomo sapiens 66atgtcagagc gtttccctag caatg
256725DNAHomo sapiens 67cttttctcct gtgtaccaag gtatt
256825DNAHomo sapiens
68tttatttaca cgacagcgac tcaaa
256925DNAHomo sapiens 69gactcaaaag gcactcgatt aatgt
257025DNAHomo sapiens 70atgtgacaac cttttcaata agcag
257125DNAHomo sapiens
71gtaggtacac atcactcttt acatt
257225DNAHomo sapiens 72agcattttca cagccgtttc ttcat
257325DNAHomo sapiens 73catataatcc gaccacagtg ggagg
257425DNAHomo sapiens
74ggaggtgtga tttacccatt acaca
257525DNAHomo sapiens 75ccagaggagc cgatgagtta cttaa
257625DNAHomo sapiens 76agaattttct ccattacatc atcct
257725DNAHomo sapiens
77gataatgctc tgtacttcat ttgaa
257825DNAHomo sapiens 78gatagtcgga atagagccgc cccaa
257925DNAHomo sapiens 79aactcagatc ctacaacacg caagt
258025DNAHomo sapiens
80caacacgcaa gttccttctt gaacc
258125DNAHomo sapiens 81ccctatggcc ctgaatggtg cactg
258225DNAHomo sapiens 82cccctcacaa atgcagccaa gtcat
258325DNAHomo sapiens
83gagaattgcg ggttctaccc agtca
258425DNAHomo sapiens 84ctacccagtc agaagatcac accat
258525DNAHomo sapiens 85gatcacacca tggagacttt ctact
258625DNAHomo sapiens
86aacttcacct tccattaagt gttca
258725DNAHomo sapiens 87gaagcctgaa attgtgccgt gttgc
258825DNAHomo sapiens 88tgccgtgttg ccttatatga atatg
258925DNAHomo sapiens
89gagtacagac ctgctgaatg cactg
259025DNAHomo sapiens 90tgatcaacca gtaaagcccc tgcat
259125DNAHomo sapiens 91cccctgcatc gagcagtctt ctgga
259225DNAHomo sapiens
92aaggagccaa acaccttcga gttgc
259325DNAHomo sapiens 93ggttccagta ccactctttg gatgt
259425DNAHomo sapiens 94ggatgtgatt gggtttctgc tggcc
259525DNAHomo sapiens
95ctgctggcct gtgtggcaac tgtga
259625DNAHomo sapiens 96ttgtctgttt tgtttctgga agttt
259725DNAHomo sapiens 97gggttgacat cagtttattc cagca
259825DNAHomo sapiens
98agatttcttt cttcctgtga caaaa
259925DNAHomo sapiens 99tttttcagag atttaccacc caggt
2510025DNAHomo sapiens 100caggaaacgg caacaagcct cccag
2510125DNAHomo sapiens
101gcctcccagt actgacctga aaact
2510225DNAHomo sapiens 102gaagaacacc aacaagtgct ccctg
2510325DNAHomo sapiens 103caccccggaa gctgaacctg
aggga 2510425DNAHomo sapiens
104gagagatgcc tcaggcttca gacct
2510525DNAHomo sapiens 105cttcagacct tacctgggtt ttcag
2510625DNAHomo sapiens 106agggtcctgc aaaaggctag
ctcgg 2510725DNAHomo sapiens
107gctagctcgg cactacacta gggaa
2510825DNAHomo sapiens 108actagggaat ttgctcctgt tctgt
2510925DNAHomo sapiens 109tcacttgtca tggtctttct
tggta 2511025DNAHomo sapiens
110ggtattaaag gccaccattt gcaca
2511125DNAHomo sapiens 111tctgctgcat ttctaatgtg aattg
2511225DNAHomo sapiens 112gagcttatga atacactctt
ttcaa 2511325DNAHomo sapiens
113tcaagtgtat gtgggttttc aaggt
2511425DNAHomo sapiens 114gtttgatcct atatttcctt tgtta
2511525DNAHomo sapiens 115ctgcttttca tcactttgac
agaat 2511625DNAHomo sapiens
116gagtttgggt atatgctttg aggaa
2511725DNAHomo sapiens 117ggaatatgct tcctcattac aaaag
2511825DNAHomo sapiens 118gattactaca cttgcttatc
aatag 2511925DNAHomo sapiens
119aagatacgtg gattgctatg cattc
2512025DNAHomo sapiens 120atttatcctc tccaggcatg attta
2512125DNAHomo sapiens 121gtgcctatta aacagagtac
tttgt 2512225DNAHomo sapiens
122ggaattccta tttctacgta tttgg
2512325DNAHomo sapiens 123gggcaccata tatcatctag agtcc
2512425DNAHomo sapiens 124atctagagtc cttactggta
ttcag 2512525DNAHomo sapiens
125atgttcacgc tgcattaatt gtcat
2512625DNAHomo sapiens 126aaactagctt ggaccttggg ctgca
2512725DNAHomo sapiens 127gctgcaggac gactaggatt
caccc 2512825DNAHomo sapiens
128ggattcaccc ataacgacac agtgc
2512925DNAHomo sapiens 129gacacagtgc cctatgtttc ttaac
2513025DNAHomo sapiens 130gtttcttaac ttcttgttgc
cattt 2513125DNAHomo sapiens
131gccatttgaa actctgtact cttat
2513225DNAHomo sapiens 132taaagggttc tgtatagcca ttttt
2513325DNAHomo sapiens 133gaagcaagtt tccatgattt
ctgaa 2513425DNAHomo sapiens
134gaacgtttcc aggcattttg tctcc
2513525DNAHomo sapiens 135ggagagttca cgaactgtgc ccaac
2513625DNAHomo sapiens 136tgtgcccaac gcatgttata
gccag 2513725DNAHomo sapiens
137tagccagggt cctactaact actca
2513825DNAHomo sapiens 138aacgtattgt tgtattcctc cagtg
2513925DNAHomo sapiens 139tcctccagtg ttaagctata
gccat 2514025DNAHomo sapiens
140cactgtgcat ttattctcag catca
2514125DNAHomo sapiens 141aaataccttg taacgtcttc tctgc
2514225DNAHomo sapiens 142tcttctctgc cttgttagtg
catat 2514325DNAHomo sapiens
143ttctctgctc cttaaatatc atctc
25144540DNAHomo sapiens 144aagctaggtc gtgggtcagc tctgaggatg tatacccctg
gtgggagagg gagacctaga 60gatctggctg tggggcgggc atggggggtg aagggccact
gggaccctca gccttgtttg 120tactgtatgc cttcagcatt gcctaggaac acgaagcacg
atcagtccat ccagagggac 180cggagttatg acaagcttcc caaatatttt gctttatcag
ccgatatcaa cacttgtatc 240tggcctctgt gcccagcagt gccttgtgca atgtgaatgt
accgtctctg ctaaaccacc 300attttatttg gttttgtttt gtttggtttt ctcggatact
tgccaaaatg agactctccg 360tcggcagctg ggggaagggt ctgagactct ctttcctttt
ggttttggga ttacttttga 420tcctggggga ccaatgaggt gaggggggtt ctcctttgcc
ctcagctttc ccagccctcc 480ggcctgggct gcccacaagg cttctccccc agaggccctg
gctcctggtc gggaagggag 540145437DNAHomo sapiens 145tgcctgtagc
attccagagc tcactgccct tctagatgtg ccttcccgct tggcttccag 60cggcttgtgc
tcactctgtc tgccaggtat gagaagaaca cgtaagaccg ccaccacact 120caccctccct
caaggccctg tgccataggg gtggccaccc gacctgcccc cagaactttt 180ggatactgga
ggcagttgca taggtctccc tctctgggca ccaggactca gtccagccca 240agactactct
gggcagctcc catcccagtc tggggccatt tgcagactca ggaaaggatt 300tctacagtgt
tctataaaag ccaaaagaga gagtgggttt gggaagagtg agggtggttg 360gggagagggg
accgatgtgc ctcattgttt agtggtgatt acaaatatgc ttttctggat 420aaagtttggt
tgtttgc
437146514DNAHomo sapiens 146aatgcaggag cctacttcta gctgtatttt ttgtatgctt
aaataaaata aaattcataa 60ccaagagatc cacattagct tgttagtaat gctctgacca
agccgagatg ccattctctt 120agtgatggcg gcgttaggtt tgagagaagg aattggctca
acttcagttg agagggtgca 180gtccagacag cttgactgct tttaaatgac caaagatgac
ctgtggtaag caacctggca 240tcttaggaag cagtccttga gaaggcatgt tccagaaagg
tctctgagga caaactcact 300cagtaaaaca taatgtatca tgaagaaaac tgattctcta
tgacatgaaa tgaaaatttt 360aatgcattgt tataattact aatgtacgct gctgcaggac
attaataaag ttgctttttt 420aggctacagt gtctcgatgc cataatcaga acacactttt
tttcctcttt ctcccagctt 480caaatgcaca attcatcatt gggctcactt ctaa
514147534DNAHomo sapiens 147aggtgcagaa tctcggcggg
gagcttgttg tctctggggt ggacagcgcc atgtccctga 60tccaggcagc caagaacttg
atgaatgctg tggtgcagac agtgaaggca tcctacgtcg 120cctctaccaa ataccaaaag
tcacagggta tggcttccct caaccttcct gctgtgtcat 180ggaagatgaa ggcaccagag
aaaaagccat tggtgaagag agagaaacag gatgagacac 240agaccaagat taaacgggca
tctcagaaga agcacgtgaa cccggtgcag gccctcagcg 300agttcaaagc tatggacagc
atctaagtct gcccaggccg gccgccccca cccctcgggg 360ctcctgaata tcagtcactg
ttcgtcactc aaatgaattt gctaaataca acactgatac 420tagattccac agggaaatgg
gcagactgaa ccagtccagg tggtgaattt tccaagaaca 480tagtttaagt tgattaaaaa
tgcttttaga atgcaggagc ctacttctag ctgt 534148540DNAHomo sapiens
148aatgcattgc atcaacctac tatagaggag ctcaagccat catcattgtc ttcaacctga
60atgatgtggc atctctggaa cataccaagc agtggctggc cgatgccctg aaggagaatg
120acccttccag tgtgcttctc ttccttgtag gttccaagaa ggatctgagt acccctgctc
180agtatgcgct gatggagaaa gacgccctcc aggtggccca ggagatgaag actgttcaga
240gactgcccag ccctagggca ctgtgccacc ctcattcctc cagagcttga cccctggaca
300tttgcactga ctttatccag accaaagagc tgcctcttgg tggcagtatt cccacagagg
360ggtagctggg atcatgctag tcacttcctg cccccaggca ccgtgccaaa gactggatgc
420cccctactcc tcaggggact gtccagggcg cccagtggta gtgagggaga gtgtctctgt
480tcttttgctc agcctgctgg gccctttgtg tttgaggatg cttaatgatt ccagcctctc
540149331DNAHomo sapiensmisc_feature(113)..(113)n is a, c, g, or t
149gagggagaac tttcctgtgg acgtcctgtg ttctccagac gcagagaacc ctcatcaacc
60gagggggagg tcacttccga atccacagat ggcgtgtgag tgcatggcga gcncctccag
120gacacactta ctgttccctt gctctggcca gacgccagcc ggaccctgtg tgtgcgcgcc
180gtgctgctct ttgcagctgc ctgcaagggg ttcctgcgaa gaccagcacc ttggggaaga
240gcctgcggct gaacttgaac tcgcagctac ctgagtcaga cctgtgcttt ttcacctcta
300cggaagatgt cagagcgttt ccctagcaat g
331150341DNAHomo sapiens 150cttttctcct gtgtaccaag gtattgcttt tatttacacg
acagcgactc aaaaggcact 60cgattaatgt gacaaccttt tcaataagca gaaataacgt
aggtacacat cactctttac 120atttttctaa gcattttcac agccgtttct tcatataatc
cgaccacagt gggaggtgtg 180atttacccat tacacaatga gaaaccagag gagccgatga
gttacttaat tgaggtcaca 240gaatgaatta gcaagaaaat ggttctaaaa tctaagtatt
ttagtctaga attttctcca 300ttacatcatc ctaagagata atgctctgta cttcatttga a
341151389DNAHomo sapiens 151gatagtcgga atagagccgc
cccaactcag atcctacaac acgcaagttc cttcttgaac 60cctggtgcct cctaccctat
ggccctgaat ggtgcactgg tttaattgtg ttggtgtcgg 120cccctcacaa atgcagccaa
gtcatgtaat tagtcatctg gaacaaagac taaaaacagc 180agagaattgc gggttctacc
cagtcagaag atcacaccat ggagactttc tactagagga 240cttgaaagag aactgagggg
ccacaaaata aacttcacct tccattaagt gttcaagcat 300gtctgcaaat taggagggag
ttagaaacag tctttttcat cctttgtgat gaagcctgaa 360attgtgccgt gttgccttat
atgaatatg 389152503DNAHomo sapiens
152gagtacagac ctgctgaatg cactgaagac agtaattaat gatccttcat ataaagagaa
60tgttatgaaa ttatcaataa ttcaacatga tcaaccagta aagcccctgc atcgagcagt
120cttctggatt gaatttgtga tgtgccacaa aggagccaaa caccttcgag ttgcagcccg
180tgacctcacc tggttccagt accactcttt ggatgtgatt gggtttctgc tggcctgtgt
240ggcaactgtg atatttgtcg tcacaaagtt ttgtctgttt tgtttctgga agtttgctag
300aaaagggaag aagggaaaaa gagattagtt atgtctgaca tttgaagctg gaaaaccaga
360tagatgggtt gacatcagtt tattccagca agaaagaaaa gattgttatg caagatttct
420ttcttcctgt gacaaaaaaa aaaacttttc aaaatctacc ttgtcaagta aaaatttgtt
480tttcagagat ttaccaccca ggt
503153528DNAHomo sapiens 153caggaaacgg caacaagcct cccagtactg acctgaaaac
ttgtgacaag aagaacacca 60acaagtgctc cctgggctga ggaccctttc ttgcctcccc
accccggaag ctgaacctga 120gggagacaac ggcagaggga gtgagcaggg gagaaatagc
agaggggctt ggagggtcac 180ataggtagat ggtaaagaga atgaggagaa aaaggagaaa
agggaaaagc agaaaggaaa 240aaaaggaaga gagaggaagg gagaagggag aggaatgaat
tgaggaagtg aaagaaggca 300aggaggtagg aagagaggga ggaggaaagg aaggagagag
atgcctcagg cttcagacct 360tacctgggtt ttcagggcaa acataaatgt aaatacactg
atttattctg ttactagatc 420aggttttagg gtcctgcaaa aggctagctc ggcactacac
tagggaattt gctcctgttc 480tgtcacttgt catggtcttt cttggtatta aaggccacca
tttgcaca 528154408DNAHomo
sapiensmisc_feature(317)..(317)n is a, c, g, or t 154tctgctgcat
ttctaatgtg aattgcatgt gagagcttat gaatacactc ttttcaagtg 60tatgtgggtt
ttcaaggtat gtatttgtgt ttgatcctat atttcctttg ttataacatt 120ctgcttttca
tcactttgac agaatatttg taaattttct ggagagtgag tttgggtata 180tgctttgagg
aatatgcttc ctcattacaa aagatatgga aacataattg attactacac 240ttgcttatca
atagtatttt gattttgttt aaatgaaatg tttaagatac gtggattgct 300atgcattcat
gttttanatt tatcctctcc aggcatgatt tatgccattc aataattaaa 360ataactaagt
tactttagaa aaagtgccta ttaaacagag tactttgt
408155489DNAHomo sapiensmisc_feature(68)..(68)n is a, c, g, or t
155ggaattccta tttctacgta tttggtggtc cataagactt tgtcaaatgt aaacctacag
60tttgatangc tttaaaatac ctagttaaga ggatgatttc tctttaatcg tttaaatgtt
120ctgaaaatta aaatcttttg aggcacatga agtgggcacc atatatcatc tagagtcctt
180actggtattc aggatgaaaa tgttcacgct gcattaattg tcatttttct ctcccatgtt
240ctttctcact ttgatacgtt aatactgata atggataaag agtgagtttt tataataaat
300ggttttggaa aggtattcat aggaaccgcg gttatttact taaggttatg gagtaaacta
360gcttggacct tgggctgcag gacgactagg attcacccat aacgacacag tgccctatgt
420ttcttaactt cttgttgcca tttgaaactc tgtactctta tgtttaaagg gttctgtata
480gccattttt
489156520DNAHomo sapiens 156gaagcaagtt tccatgattt ctgaagagct ggtataggaa
gtttctttct tccttttgtg 60ttacatgtgc attaaacaga acaagctgtg tgtcatcaca
gattgtactg tgggctcaga 120aaccgtgaga gagcccccac cgtggacacc ggctctatgg
ccacaggaaa aggaacgttt 180ccaggcattt tgtctccagg gctcccgctg gacaggcacg
tactgccccg gggagtaaat 240gcggagagtt cacgaactgt gcccaacgca tgttatagcc
agggtcctac taactactca 300gtaaaagaac gtattgttgt attcctccag tgttaagcta
tagccatgtt aaaagtcact 360gtgcatttat tctcagcatc aaataccttg taacgtcttc
tctgccttgt tagtgcatat 420ttttactttt ctgatactgt aaagaatata tccagtatgt
aaatgaatgt tctataaatc 480ttttgtatag tcattttctc tgctccttaa atatcatctc
52015720DNAHomo sapiens 157cgccatgccg ggagaactct
2015820DNAHomo sapiens
158cttctcctgc tgccggctgt
2015920DNAHomo sapiens 159gccgccttca acgacgagtt
2016020DNAHomo sapiens 160cttggcttca tcctcctcgc
2016118DNAHomo sapiens
161cggccgctgg tgatcaag
1816219DNAHomo sapiens 162cccagggcgg tcccacagc
19
User Contributions:
Comment about this patent or add new information about this topic:
| People who visited this patent also read: | |
| Patent application number | Title |
|---|---|
| 20160322925 | MOTOR DRIVER AND A METHOD OF OPERATING THEREOF |
| 20160322924 | HARMONICS MITIGATION IN MULTIPHASE GENERATOR-CONVERSION SYSTEMS |
| 20160322923 | POWER SYSTEM THAT OPERATES IN AN EXERCISE MODE BASED ON MEASURED PARAMETERS |
| 20160322922 | TECHNIQUES FOR CONTROLLING ENGINE SPEED BASED ON ALTERNATOR DUTY CYCLE TO INCREASE VEHICLE EFFICIENCY |
| 20160322921 | BRUSHLESS MOTOR, WIPER APPARATUS, MOTOR APPARATUS, AND CONTROL METHOD FOR MOTOR APPARATUS |
 |  |
 |  |
 |  |
 |  |
 |  |
 |  |
 |  |
 |  |
 |  |
 |  |
 |  |
 |  |
 |  |
 |  |
 |  |
 |  |
 |  |
 |  |
 |  |
 |  |
 |  |
 |  |
 |  |
| Similar patent applications: | |
| Date | Title |
|---|---|
| 2009-11-05 | Medium scale intergration of molecular logic gates in an automaton |
| 2010-01-14 | Method for the detection of egfr mutations in blood samples |
| 2010-03-18 | Probe for detecting mutation in jak2 gene and use thereof |
| 2010-03-18 | Method for the selection and/or the processing of particles, in particular cells |
| 2010-03-18 | Method for the visual detection of specific antibodies by the use of lateral flow assays |
| New patent applications in this class: | |
| Date | Title |
|---|---|
| 2022-05-05 | Isolation and detection of exosome-associated microbiome for diagnostic and therapeutic purposes |
| 2022-05-05 | New biomarkers and biotargets in renal cell carcinoma |
| 2022-05-05 | Method of predicting survival rates for cancer patients |
| 2022-05-05 | Biomarkers for autism spectrum disorders |
| 2022-05-05 | Method for preimplantation genetic screening of embryos for detection of structural rearrangements |
| New patent applications from these inventors: | |
| Date | Title |
|---|---|
| 2012-04-12 | Method for the treatment of acute myeloid leukemia |
| Top Inventors for class "Chemistry: molecular biology and microbiology" | |
| Rank | Inventor's name |
|---|---|
| 1 | Marshall Medoff |
| 2 | Anthony P. Burgard |
| 3 | Mark J. Burk |
| 4 | Robin E. Osterhout |
| 5 | Rangarajan Sampath |