Patent application title: NON-INVASIVE METHOD OF DIAGNOSING RENAL FIBROSIS
Inventors:
Manikkam Suthanthiran (Scarsdale, NY, US)
Joseph E. Schwartz (East Setauket, NY, US)
Ruchuang Ding (Beechurst, NY, US)
Thangamani Muthukumar (New York, NY, US)
IPC8 Class: AC12Q168FI
USPC Class:
Class name:
Publication date: 2015-08-27
Patent application number: 20150240305
Abstract:
Measurement of mRNAs in urinary cells offers a noninvasive means of
diagnosing fibrosis in kidneys. One aspect of the invention is a method
that includes: (a) measuring quantities of vimentin mRNA, NKCC2 mRNA, and
E-cadherin mRNA in a test sample of cells obtained from urine; and (b)
determining whether the vimentin mRNA quantity is higher, the NKCC2 mRNA
quantity is lower, or the E-cadherin mRNA is higher than in healthy
urinary cells; and thereby detecting that the sample is a fibrotic kidney
sample. Step (a) can also include measuring the quantity of RNA expressed
by a housekeeping gene (e.g., 18S rRNA). The quantities of vimentin mRNA,
NKCC2 mRNA, and E-cadherin mRNA can be normalized against the quantity of
housekeeping gene RNA.Claims:
1. A method comprising: a) measuring quantities of vimentin mRNA, NKCC2
mRNA, and E-cadherin mRNA in a test sample of cells obtained from urine;
b) determining whether the vimentin mRNA quantity is higher, the NKCC2
mRNA quantity is lower, or the E-cadherin mRNA is higher than in healthy
urinary cells; and thereby detecting whether or not the sample is a
fibrotic kidney sample.
2. The method of claim 1, further comprising measuring a housekeeping gene RNA quantity.
3. The method of claim 1, further comprising measuring a housekeeping gene mRNA quantity, and normalizing the vimentin mRNA quantity, the NKCC2 mRNA quantity, or the E-cadherin mRNA against the housekeeping gene mRNA quantity.
4. The method of claim 2, wherein the housekeeping gene is 18S rRNA, actin mRNA, histone mRNA, ribosomal protein mRNA, myosin mRNA, cytochrome c mRNA, β2-microglobulin mRNA, or major histocompatibility complex mRNA.
5. The method of claim 2, wherein the housekeeping gene is 18S rRNA.
6. The method of claim 1, wherein the vimentin mRNA quantity is divided by the quantity of 18S rRNA/100,000 in the sample to generate a normalized vimentin mRNA value.
7. The method of claim 1, wherein the vimentin mRNA quantity is divided by the quantity of 18S rRNA/100,000 in the sample to generate a normalized vimentin mRNA value, which is converted into a log 10 normalized vimentin mRNA value.
8. The method of claim 1, wherein detecting that the sample is a fibrotic kidney sample comprises determining that the log10 normalized vimentin mRNA value is at least 5.2.
9. The method of claim 1, wherein the NKCC2 mRNA quantity is divided by the quantity of 18S rRNA/100,000 in the sample to generate a normalized NKCC2 mRNA value.
10. The method of claim 1, wherein the NKCC2 mRNA quantity is divided by the quantity of 18S rRNA/100,000 in the sample to generate a normalized NKCC2 mRNA value, which is converted into a log10 normalized NKCC2 mRNA value.
11. The method of claim 1, wherein detecting that the sample is a fibrotic kidney sample comprises determining that the log10 normalized NKCC2 mRNA value is 2.5 or less.
12. The method of claim 1, wherein the E-cadherin mRNA quantity is divided by the quantity of 18S rRNA/100,000 in the sample to generate a normalized E-cadherin mRNA value.
13. The method of claim 1, wherein the E-cadherin mRNA quantity is divided by the quantity of 18S rRNA/100,000 in the sample to generate a normalized E-cadherin mRNA value, which is converted into a log10 normalized E-cadherin mRNA value.
14. The method of claim 1, wherein detecting that the sample is a fibrotic kidney sample comprises determining that the log10 normalized E-cadherin mRNA value is at least 2.7.
15. The method of claim 1, wherein measuring quantities of vimentin mRNA, NKCC2 mRNA, and E-cadherin mRNA comprises reverse transcription, polymerase chain reaction preamplification, real-time quantitative polymerase chain reaction, microarray analysis, Northern blotting, nuclease protection assays, RNA fingerprinting, ligase chain reaction, Qbeta replicase, isothermal amplification method, strand displacement amplification, transcription based amplification systems, quantitative nucleic acid amplification, combined reverse transcription/nucleic acid amplification, nuclease protection, Serial Analysis Gene Expression (SAGE), next generation sequencing, gene expression microarray, and combinations thereof.
16. The method of claim 1, wherein a nucleic acid measuring quantities of vimentin mRNA, NKCC2 mRNA, and E-cadherin mRNA comprises use of a probe or primer that can stringently hybridizes to a nucleic acid encoding an amino acid sequence selected from the group consisting of SEQ ID NO:2, 4, 6, 8, 10 or a combination thereof.
17. The method of claim 1, wherein a nucleic acid measuring quantities of 18S rRNA comprises use of a probe or primer that can stringently hybridize to a nucleic acid comprising any of SEQ ID NO: 11, 78, 79, 81, or a combination thereof.
18. The method of claim 1, further comprising: (a) measuring quantities of vimentin RNA, NKCC2 RNA, E-cadherin RNA and 18S rRNA in a test sample of cells obtained from a subject's urine to generate a vimentin RNA quantity value [vimentin], a NKCC2 RNA quantity value [NKCC2], an E-cadherin RNA quantity value [E-cadherin], and an 18S rRNA quantity value [18S rRNA]; (b) identifying the subject as a patient who would benefit from treatment of kidney fibrosis when: (ii) the log10([vimentin]/[18S rRNA/10.sup.5]) value is greater than about 5.0; (iii) the log10([NKCC2]/[18S rRNA/10.sup.5]) value is less than about 3.0; or (iv) the log10([E-cadherin]/[18S rRNA/10.sup.5]) value is greater than about 3.0.
19. The method of claim 1, further comprising assigning a composite score to the test sample, which is calculated as follows: Composite Score = 36.10283 + [ - 15.84215 * log 10 ( 18 s ) ] + 1.56907 * log 10 ( 18 s ) * log 10 ( 18 s ) + 5.11698 * max [ 0 , log 10 ( Vimentin ) - 5.6 ] + [ - 1.44145 * log 10 ( NKCC 2 ) ] + 3.31357 * min [ 3.1 , log 10 ( E - cadherin ) ] ##EQU00006## where, log10(18s RNA) is log10 of 18S RNA quantity/10.sup.5 in the test sample; log10(Vimentin) is log10 of normalized vimentin mRNA quantity in the test sample; log10(NKCC2)] is log10 of normalized NKCC2 mRNA quantity in the test sample; log10(E-cadherin) is log10 of normalized E-cadherin mRNA quantity in the test sample. max[0, log10(Vimentin)-5.6]=0 whenever log10(Vimentin) is <5.6 and =log10(Vimentin)-5.6 whenever log10(Vimentin) is >5.6; min[3.1, log10(E-cadherin)]=log10(E-cadherin) whenever log10(E-cadherin)<3.1 and =3.1 whenever log10(E-cadherin)>3.1; and * signifies multiplication.
20. The method of claim 19, wherein the composite score varies from about 1 to 8, and a normal composite score is about 3.5.
21. The method of claim 19, wherein a test sample with a composite score of about 4.7 indicates a subject has fibrosis.
22. The method of claim 1, further comprising treating a subject from which the fibrotic kidney sample was obtained.
23. A method comprising: treating kidney fibrosis in a subject when a test sample of urinary cells from the subject has a vimentin mRNA quantity that is higher, a NKCC2 mRNA quantity that is lower, or an E-cadherin mRNA that is higher than in healthy urinary cells.
24. A method comprising: treating kidney fibrosis in a subject when a test sample of urinary cells from the subject has: (i) the log10([vimentin]/[18S rRNA]/10.sup.5) value is greater than about 5.0; (ii) the log10([NKCC2]/[18S rRNA]/10.sup.5) value is less than about 3.0; or (iii) the log10([E-cadherin]/[18S rRNA]/10.sup.5) value is greater than about 3.0.
25. A method comprising: treating kidney fibrosis in a subject when a test sample of urinary cells from the subject has a composite score that is calculated as follows: Composite Score = 36.10283 + [ - 15.84215 * log 10 ( 18 s RNA ) ] + 1.56907 * log 10 ( 18 s ) * log 10 ( 18 s RNA ) + 5.11698 * max [ 0 , log 10 ( Vimentin ) - 5.6 ] + [ - 1.44145 * log 10 ( NKCC 2 ) ] + 3.31357 * min [ 3.1 , log 10 ( E - cadherin ) ] ##EQU00007## where, log10(18s RNA) is log10 of 18S RNA quantity/10.sup.5 in the test sample; log10(Vimentin) is log10 of a normalized vimentin mRNA quantity in the test sample; log10(NKCC2)] is log10 of a normalized NKCC2 mRNA quantity in the test sample; log10(E-cadherin) is log10 of a normalized E-cadherin mRNA quantity in the test sample; max[0, log10(Vimentin)-5.6]=0 whenever log10(Vimentin) is ≦5.6 and =log10(Vimentin)-5.6 whenever log10(Vimentin) is >5.6; min[3.1, log10(E-cadherin)]=log10(E-cadherin) whenever log10(E-cadherin)<3.1 and =3.1 whenever log10(E-cadherin)≧3.1; and * signifies multiplication.
Description:
[0001] This application claims benefit of the filing date of U.S.
Provisional Patent Application No. 61/647,347, filed May 15, 2012, the
contents of which are specifically incorporated herein in their entirety.
BACKGROUND
[0003] Renal allograft fibrosis is currently identified using the invasive allograft biopsy procedure in patients with worsening renal function. However, many challenges exist including early diagnosis of fibrosis (see, e.g., Arias et al., Transplantation 91:4 (2011)) and neither serum creatinine nor estimated glomerular filtration rate appears to be an accurate indicator of fibrosis (Yilmaz et al., Transpl Int 20: 608 (2007)). Moreover, the biopsy procedure is costly, complications still occur, sampling errors may bias the diagnosis, and inter-observer variability in grading of biopsies remains a challenge (Huraib et al., Am J Kidney Dis 14:13 (1989); Beckingham et al., Br J Urol 73: 13 (1994); Benfield et al., Transplantation 67: 544 (1999); Sorof et al., Transplantation 60: 1215 (1995); Colvin et al., J Am Soc Nephrol 8: 1930 (1997); Nicholson et al., Kidney Int 58: 390 (2000); Joh et al. Clin Transplant 20 Suppl 15: 53 (2006)).
SUMMARY
[0004] A noninvasive test for the diagnosis of renal (kidney) fibrosis is provided herein. Instead of invasive biopsy extraction, urinary samples can be used to assess the propensity for developing renal fibrosis, to assess the severity of renal fibrosis, and/or to monitor the progression of kidney fibrosis in a subject. For example, about 50% of kidney transplants are currently lost due to patient death with a functioning graft. The potent immunosuppressive regimens used to date increase cardiovascular risk factors such as hypertension and hypercholesterolemia and increase malignancy development (9), which may contribute to transplant patient death rates. Over-immunosuppression may also increase the risk for developing opportunistic infections, which may further complicate transplant management. The invention provides a non-invasive method of detecting a transplant related disease that can be performed repeatedly and analyzed quickly without the increased risk of an invasive procedure. Hence, one of the advantages of the methods and devices described herein their non-invasive, which permit repeated risk-free testing.
[0005] One aspect of the invention is a method that includes: (a) measuring quantities of vimentin mRNA, NKCC2 mRNA, and E-cadherin mRNA in a test sample of cells obtained from urine; and (b) determining whether the vimentin mRNA quantity is higher, the NKCC2 mRNA quantity is lower, or the E-cadherin mRNA is higher than in healthy urinary cells; and thereby detecting that the sample is a fibrotic kidney sample. Step (a) can also include measuring the quantity of RNA expressed by a housekeeping gene (e.g., 18S rRNA). The quantities of vimentin mRNA, NKCC2 mRNA, and E-cadherin mRNA can be normalized against the quantity of housekeeping gene RNA. Methods for assigning a composite score regarding the expression values are also described herein, which can facilitate identification of fibrotic test samples and subjects that can benefit from treatment.
DESCRIPTION OF THE FIGURES
[0006] FIGS. 1A and 1B1-1B22 show steps involved in generating Discovery and Validation sets based upon differential expression of urinary mRNAs and the differential expression of mRNAs in fibrosis and normal renal biopsies. FIG. 1A is a flow chart illustrating the discovery and validation of urinary mRNA profiles. One hundred fourteen renal allograft recipients (48 with biopsies showing fibrosis and 66 with normal biopsy results) were rank ordered within group (Fibrosis group or Normal Biopsy group) by the copy number of 18S rRNA and partitioned into triplets. Within each triplet, the first and third patients were assigned to the Discovery set and the second patient was assigned to the Validation set, resulting in the two sets being exactly matched on fibrosis status and very closely matched on 18S rRNA copy number. Twice as many patients were assigned to the Discovery set in order to enhance statistical power for the exploratory analyses which included a procedure to protect against the risk of a Type I error. FIG. 1B1-1B22 illustrate that urinary cell mRNAs are differentially expressed in fibrosis tissues versus normal tissues by graphically illustrating the log10 normalized mRNA quantities from fibrotic and normal tissues. FIG. 1B1 shows vimentin expression in normal and fibrosis biopsies. FIG. 1B2 shows S100A4 expression in normal and fibrosis biopsies. FIG. 1B3 shows α-SMA expression in normal and fibrosis biopsies. FIG. 1B4 shows fibronectin1 expression in normal and fibrosis biopsies. FIG. 1B5 shows TIMP1 expression in normal and fibrosis biopsies. FIG. 1B6 shows PAI1 expression in normal and fibrosis biopsies. FIG. 1B7 shows collagen 1A1 expression in normal and fibrosis biopsies. FIG. 1B8 shows NKCC2 expression in normal and fibrosis biopsies. FIG. 1B9 shows E-cadherin expression in normal and fibrosis biopsies. FIG. 1B10 shows USAG1 expression in normal and fibrosis biopsies. FIG. 1B11 shows FGF2 expression in normal and fibrosis biopsies. FIG. 1B12 shows TGFβ1 expression in normal and fibrosis biopsies. FIG. 1B13 shows ITGB6 expression in normal and fibrosis biopsies. FIG. 1B14 shows CTGF expression in normal and fibrosis biopsies. FIG. 1B15 shows BMP7 expression in normal and fibrosis biopsies. FIG. 1B16 shows HGF expression in normal and fibrosis biopsies. FIG. 1B17 shows FOX P3 expression in normal and fibrosis biopsies. FIG. 1B18 shows CTLA4 expression in normal and fibrosis biopsies. FIG. 1B19 shows CD103 expression in normal and fibrosis biopsies. FIG. 1B20 shows perforin expression in normal and fibrosis biopsies. FIG. 1B21 shows CD25 expression in normal and fibrosis biopsies. FIG. 1B22 shows granzyme B expression in normal and fibrosis biopsies.
[0007] FIGS. 2A1-2A12 and 2B1-2B10 illustrate that the levels of twelve of twenty-two mRNAs analyzed in urinary cell samples appear to be significantly associated with the diagnosis of fibrosis when using the Holm modified Bonferoni procedure (Holm, Journal of Statistics 6: 65 (1979)) to control the risk of a Type I error. FIG. 2A1-2A12 graphically illustrates that the log10 expression values of 12 genes in urinary cells are predictive of fibrosis (A1=vimentin; A2=HGF; A3=αSMA; A4=fibronectin; A5=perforin; A6=PAI1; A7=TGFβ1; A8=TIMP1; A9=granzyme B; A10=FSP1; A11=CD103; A12=collagen 1A1). The predicted probability of fibrosis as a function of urinary cell mRNA copy number in the Discovery set, for the locally weighted scatterplot smoothing (LOESS) model and the piece-wise linear logistic regression model, after controlling for 18S rRNA copy number. Urine samples were collected from 32 renal transplant recipients with graft dysfunction and biopsy-confirmed fibrosis and 44 recipients with stable allograft function and normal allograft biopsy, and levels of mRNA in urinary cells were measured with the use of pre-amplification enhanced kinetic quantitative PCR assays. FIG. 2B1-2B10 illustrates the predicted probability of fibrosis (Y-axis), controlling for 18S rRNA, of ten genes as a function of individual log10-transformed mRNA copy numbers (X-axis) (B1=BMP7; B2=CTGF; B3=CTLA4; B4=FGF2; B5=CD25; B6=FOXP3; B7=USAG1; B8=E-cadherin; B9=ITGB6; and B10=NKCC2). Each plot shows the LOESS model's predicted probabilities (dotted line), their 95% confidence interval (shaded area) and the logistic regression model's predicted probabilities (solid line). As indicated by the data in FIG. 2B1-2B10, the ten mRNAs tested and evaluated as described are apparently are not significantly correlated with a fibrosis diagnosis. Thus, according to the logistic models, the levels of twelve of the twenty-two mRNAs (vimentin, HGF, α-SMA, fibronectin 1, perforin, PAI1, TGFβ1, TIMP1, granzyme B, FSP1, CD103, and collagen 1A1) were significantly (P-values<0.05 with modified Bonferroni correction) associated with the diagnosis of fibrosis. Adjusted P-value for each parametric model is shown. The number of stable patients, number of fibrosis patients, and percentage of fibrosis patients within categories of the mRNA measure appear in each plot.
[0008] FIG. 3A-3D shows the final model derived from the Discovery Set for the diagnosis of fibrosis. FIG. 3A shows the probability of fibrosis in view of log vimentin expression in urinary cells. FIG. 3B shows the probability of fibrosis in view of log NKCC2 expression in urinary cells. FIG. 3C shows the probability of fibrosis in view of log E-cadherin expression in urinary cells. FIG. 3D shows the parameter estimates for the model, including terms accounting for the relationships, including non-linear relationships, between the RNA expression levels and diagnosis.
[0009] FIG. 4A-4D illustrates the relationship of the composite score to fibrosis in the Discovery set (FIG. 4A), receiver operating characteristics (ROC) curve analysis of the composite score in the Discovery set (FIG. 4B) and the Validation set (FIG. 4C) and the predicted and observed number of transplant recipients with fibrosis for each sextile of the composite score within the Discovery and Validation sets (FIG. 4D).
[0010] FIG. 5 graphically illustrates the mean level (and 95% CI) of the 4-gene composite score by fibrosis grade. Kidney allograft biopsies were classified as normal, mild fibrosis (grade I, <25% of cortical area), moderate (grade II, 26-50% of cortical area), or severe (grade III, >50% of cortical area). The mean (and 95% CI) composite scores derived from urinary cell vimentin, NKCC2 and E-cadherin mRNA levels and 18S rRNA level were significantly different across the four groups (P<0.0001, one-way ANOVA). Pair-wise comparisons revealed that the mean composite score of normal biopsies was significantly different from those of mild fibrosis (P=0.0002, Tukey's honestly significant differences criterion), moderate fibrosis (P<0.0001) and severe fibrosis (P<0.0001). Within the fibrosis group however the mean composite scores were not significantly different (mild vs. moderate [P=0.64], mild vs. severe [P=0.65] and moderate vs. severe [P=0.99]). Values under each biopsy diagnosis show the number of kidney graft recipients from whom urine samples were collected for the measurement of urinary cell mRNA.
DETAILED DESCRIPTION
[0011] Kidney fibrosis can accurately and less invasively be detected, monitored and evaluated by use of the methods and devices described herein. As demonstrated herein vimentin, NKCC2 and E-cadherin mRNA levels as well as the 18S rRNA level were significantly different in urinary sample cells of subjects with kidney fibrosis than in healthy subjects. Moreover, the severity of kidney fibrosis directly correlates with the degree to which the quantities of these four RNAs in the test sample differ from control RNA quantities. The control RNA quantities are the quantities of the same RNAs from healthy subject(s) who do not have renal fibrosis.
[0012] Thus, a four-gene method involving measurement of levels of mRNA for vimentin, NKCC2, and E-cadherin, as well as 18S rRNA, is an accurate, parsimonious, diagnostic model of kidney fibrosis, having 93.8% sensitivity and 84.1% specificity (P<0.0001) in a Discovery set. In an independent validation set, this same model predicted the presence of allograft fibrosis with 77.3% sensitivity and 87.5% specificity (P<0.0001).
Vimentin
[0013] Vimentin is a type III intermediate filament protein that is expressed in mesenchymal cells, where it serves as a major cytoskeletal component. Vimentin plays a significant role in supporting and anchoring the position of the organelles in the cytosol.
[0014] In the 4-gene diagnostic signature defined herein, vimentin had the strongest association with the allograft fibrosis diagnosis. Ivaska et al. (Exp Cell Res 313:2050 (2007)) have reviewed the dynamic nature of vimentin expression and the role of this evolutionarily conserved protein in cell adhesion, migration and signaling. Whereas healthy renal tubular cells do no express vimentin protein, injured ones are decorated by vimentin. Vimentin-expressing regenerating renal tubular cells have been reported by Nakatsuji et al. (Virchows Arch 433: 359 (1998); see also, Bielesz et al., J Clin Invest 120: 4040 (2010); Hertig et al., J Am Soc Nephrol 19: 1584 (2008)).
[0015] Nucleic acid and protein sequences for vimentin are available, for example, in the sequence database maintained by the National Center for Biotechnology Information (see website at www.ncbi.nlm.nih.gov/). One example of a human vimentin nucleic acid sequence is available as accession number NM--003380.3 (GI:240849334), provided below as SEQ ID NO:1.
TABLE-US-00001 1 GTCCCCGCGC CAGAGACGCA GCCGCGCTCC CACCACCCAC 41 ACCCACCGCG CCCTCGTTCG CCTCTTCTCC GGGAGCCAGT 81 CCGCGCCACC GCCGCCGCCC AGGCCATCGC CACCCTCCGC 121 AGCCATGTCC ACCAGGTCCG TGTCCTCGTC CTCCTACCGC 161 AGGATGTTCG GCGGCCCGGG CACCGCGAGC CGGCCGAGCT 201 CCAGCCGGAG CTACGTGACT ACGTCCACCC GCACCTACAG 241 CCTGGGCAGC GCGCTGCGCC CCAGCACCAG CCGCAGCCTC 281 TACGCCTCGT CCCCGGGCGG CGTGTATGCC ACGCGCTCCT 321 CTGCCGTGCG CCTGCGGAGC AGCGTGCCCG GGGTGCGGCT 361 CCTGCAGGAC TCGGTGGACT TCTCGCTGGC CGACGCCATC 401 AACACCGAGT TCAAGAACAC CCGCACCAAC GAGAAGGTGG 441 AGCTGCAGGA GCTGAATGAC CGCTTCGCCA ACTACATCGA 481 CAAGGTGCGC TTCCTGGAGC AGCAGAATAA GATCCTGCTG 521 GCCGAGCTCG AGCAGCTCAA GGGCCAAGGC AAGTCGCGCC 561 TGGGGGACCT CTACGAGGAG GAGATGCGGG AGCTGCGCCG 601 GCAGGTGGAC CAGCTAACCA ACGACAAAGC CCGCGTCGAG 641 GTGGAGCGCG ACAACCTGGC CGAGGACATC ATGCGCCTCC 681 GGGAGAAATT GCAGGAGGAG ATGCTTCAGA GAGAGGAAGC 721 CGAAAACACC CTGCAATCTT TCAGACAGGA TGTTGACAAT 761 GCGTCTCTGG CACGTCTTGA CCTTGAACGC AAAGTGGAAT 801 CTTTGCAAGA AGAGATTGCC TTTTTGAAGA AACTCCACGA 841 AGAGGAAATC CAGGAGCTGC AGGCTCAGAT TCAGGAACAG 881 CATGTCCAAA TCGATGTGGA TGTTTCCAAG CCTGACCTCA 921 CGGCTGCCCT GCGTGACGTA CGTCAGCAAT ATGAAAGTGT 961 GGCTGCCAAG AACCTGCAGG AGGCAGAAGA ATGGTACAAA 1001 TCCAAGTTTG CTGACCTCTC TGAGGCTGCC AACCGGAACA 1041 ATGACGCCCT GCGCCAGGCA AAGCAGGAGT CCACTGAGTA 1081 CCGGAGACAG GTGCAGTCCC TCACCTGTGA AGTGGATGCC 1121 CTTAAAGGAA CCAATGAGTC CCTGGAACGC CAGATGCGTG 1161 AAATGGAAGA GAACTTTGCC GTTGAAGCTG CTAACTACCA 1201 AGACACTATT GGCCGCCTGC AGGATGAGAT TCAGAATATG 1241 AAGGAGGAAA TGGCTCGTCA CCTTCGTGAA TACCAAGACC 1281 TGCTCAATGT TAAGATGGCC CTTGACATTG AGATTGCCAC 1321 CTACAGGAAG CTGCTGGAAG GCGAGGAGAG CAGGATTTCT 1361 CTGCCTCTTC CAAACTTTTC CTCCCTGAAC CTGAGGGAAA 1401 CTAATCTGGA TTCACTCCCT CTGGTTGATA CCCACTCAAA 1441 AAGGACACTT CTGATTAAGA CGGTTGAAAC TAGAGATGGA 1481 CAGGTTATCA ACGAAACTTC TCAGCATCAC GATGACCTTG 1521 AATAAAAATT GCACACACTC AGTGCAGCAA TATATTACCA 1561 GCAAGAATAA AAAAGAAATC CATATCTTAA AGAAACAGCT 1601 TTCAAGTGCC TTTCTGCAGT TTTTCAGGAG CGCAAGATAG 1641 ATTTGGAATA GGAATAAGCT CTAGTTCTTA ACAACCGACA 1681 CTCCTACAAG ATTTAGAAAA AAGTTTACAA CATAATCTAG 1721 TTTACAGAAA AATCTTGTGC TAGAATACTT TTTAAAAGGT 1781 ATTTTGAATA CCATTAAAAC TGCTTTTTTT TTTCCAGCAA 1801 GTATCCAACC AACTTGGTTC TGCTTCAATA AATCTTTGGA 1841 AAAACTC
[0016] The human protein encoded by the vimentin nucleic acid shown above as SEQ ID NO:1 has an amino acid sequence with SEQ ID NO:2, shown below.
TABLE-US-00002 1 MSTRSVSSSS YRRMFGGPGT ASRPSSSRSY VTTSTRTYSL 41 GSALRPSTSR SLYASSPGGV YATRSSAVRL RSSVPGVRLL 81 QDSVDFSLAD AINTEFKNTR TNEKVELQEL NDRFANYIDK 121 VRFLEQQNKI LLAELEQLKG QGKSRLGDLY EEEMRELRRQ 161 VDQLTNDKAR VEVERDNLAE DIMRLREKLQ EEMLQREEAE 201 NTLQSFRQDV DNASLARLDL ERKVESLQEE IAFLKKLHEE 241 EIQELQAQIQ EQHVQIDVDV SKPDLTAALR DVRQQYESVA 281 AKNLQEAEEW YKSKFADLSE AANRNNDALR QAKQESTEYR 321 RQVQSLTCEV DALKGTNESL ERQMREMEEN FAVEAANYQD 361 TIGRLQDEIQ NMKEEMARHL REYQDLLNVK MALDIEIATY 401 RKLLEGEESR ISLPLPNFSS LNLRETNLDS LPLVDTHSKR 411 TLLIKTVETR DGQVINETSQ HHDDLE
[0017] Another example of a human vimentin nucleic acid sequence is available as accession number NM--003380.3 (GI:240849334), provided below as SEQ ID NO:3.
TABLE-US-00003 1 GCCTCTCCAA AGGCTGCAGA AGTTTCTTGC TAACAAAAAG 41 TCCGCACATT CGAGCAAAGA CAGGCTTTAG CGAGTTATTA 81 AAAACTTAGG GGCGCTCTTG TCCCCCACAG GGCCCGACCG 121 CACACAGCAA GGCGATGGCC CAGCTGTAAG TTGGTAGCAC 161 TGAGAACTAG CAGCGCGCGC GGAGCCCGCT GAGACTTGAA 201 TCAATCTGGT CTAACGGTTT CCCCTAAACC GCTAGGAGCC 241 CTCAATCGGC GGGACAGCAG GGCGCGTCCT CTGCCACTCT 281 CGCTCCGAGG TCCCCGCGCC AGAGACGCAG CCGCGCTCCC 321 ACCACCCACA CCCACCGCGC CCTCGTTCGC CTCTTCTCCG 361 GGAGCCAGTC CGCGCCACCG CCGCCGCCCA GGCCATCGCC 401 ACCCTCCGCA GCCATGTCCA CCAGGTCCGT GTCCTCGTCC 441 TCCTACCGCA GGATGTTCGG CGGCCCGGGC ACCGCGAGCC 481 GGCCGAGCTC CAGCCGGAGC TACGTGACTA CGTCCACCCG 521 CACCTACAGC CTGGGCAGCG CGCTGCGCCC CAGCACCAGC 561 CGCAGCCTCT ACGCCTCGTC CCCGGGCGGC GTGTATGCCA 601 CGCGCTCCTC TGCCGTGCGC CTGCGGAGCA GCGTGCCCGG 641 GGTGCGGCTC CTGCAGGACT CGGTGGACTT CTCGCTGGCC 681 GACGCCATCA ACACCGAGTT CAAGAACACC CGCACCAACG 721 AGAAGGTGGA GCTGCAGGAG CTGAATGACC GCTTCGCCAA 761 CTACATCGAC AAGGTGCGCT TCCTGGAGCA GCAGAATAAG 801 ATCCTGCTGG CCGAGCTCGA GCAGCTCAAG GGCCAAGGCA 841 AGTCGCGCCT GGGGGACCTC TACGAGGAGG AGATGCGGGA 881 GCTGCGCCGG CAGGTGGACC AGCTAACCAA CGACAAAGCC 921 CGCGTCGAGG TGGAGCGCGA CAACCTGGCC GAGGACATCA 961 TGCGCCTCCG GGAGAAATTG CAGGAGGAGA TGCTTCAGAG 1001 AGAGGAAGCC GAAAACACCC TGCAATCTTT CAGACAGGAT 1041 GTTGACAATG CGTCTCTGGC ACGTCTTGAC CTTGAACGCA 1081 AAGTGGAATC TTTGCAAGAA GAGATTGCCT TTTTGAAGAA 1121 ACTCCACGAA GAGGAAATCC AGGAGCTGCA GGCTCAGATT 1181 CAGGAACAGC ATGTCCAAAT CGATGTGGAT GTTTCCAAGC 1201 CTGACCTCAC GGCTGCCCTG CGTGACGTAC GTCAGCAATA 1241 TGAAAGTGTG GCTGCCAAGA ACCTGCAGGA GGCAGAAGAA 1281 TGGTACAAAT CCAAGTTTGC TGACCTCTCT GAGGCTGCCA 1321 ACCGGAACAA TGACGCCCTG CGCCAGGCAA AGCAGGAGTC 1361 CACTGAGTAC CGGAGACAGG TGCAGTCCCT CACCTGTGAA 1401 GTGGATGCCC TTAAAGGAAC CAATGAGTCC CTGGAACGCC 1441 AGATGCGTGA AATGGAAGAG AACTTTGCCG TTGAAGCTGC 1481 TAACTACCAA GACACTATTG GCCGCCTGCA GGATGAGATT 1521 CAGAATATGA AGGAGGAAAT GGCTCGTCAC CTTCGTGAAT 1561 ACCAAGACCT GCTCAATGTT AAGATGGCCC TTGACATTGA 1601 GATTGCCACC TACAGGAAGC TGCTGGAAGG CGAGGAGAGC 1641 AGGATTTCTC TGCCTCTTCC AAACTTTTCC TCCCTGAACC 1681 TGAGGGAAAC TAATCTGGAT TCACTCCCTC TGGTTGATAC 1721 CCACTCAAAA AGGACACTTC TGATTAAGAC GGTTGAAACT 1761 AGAGATGGAC AGGTTATCAA CGAAACTTCT CAGCATCACG 1801 ATGACCTTGA ATAAAAATTG CACACACTCA GTGCAGCAAT 1841 ATATTACCAG CAAGAATAAA AAAGAAATCC ATATCTTAAA 1881 GAAACAGCTT TCAAGTGCCT TTCTGCAGTT TTTCAGGAGC 1921 GCAAGATAGA TTTGGAATAG GAATAAGCTC TAGTTCTTAA 1961 CAACCGACAC TCCTACAAGA TTTAGAAAAA AGTTTACAAC 2001 ATAATCTAGT TTACAGAAAA ATCTTGTGCT AGAATACTTT 2041 TTAAAAGGTA TTTTGAATAC CATTAAAACT GCTTTTTTTT 2081 TTCCAGCAAG TATCCAACCA ACTTGGTTCT GCTTCAATAA 2121 ATCTTTGGAA AAACTCAAAA AAAAAAAAAA A
[0018] The human protein encoded by the vimentin nucleic acid shown above as SEQ ID NO:3 has an amino acid sequence with NCBI accession number NP--003371.2 (GI:62414289), shown below as SEQ ID NO:4.
TABLE-US-00004 1 MSTRSVSSSS YRRMFGGPGT ASRPSSSRSY VTTSTRTYSL 41 GSALRPSTSR SLYASSPGGV YATRSSAVRL RSSVPGVRLL 81 QDSVDFSLAD AINTEFKNTR TNEKVELQEL NDRFANYIDK 121 VRFLEQQNKI LLAELEQLKG QGKSRLGDLY EEEMRELRRQ 161 VDQLTNDKAR VEVERDNLAE DIMRLREKLQ EEMLQREEAE 201 NTLQSFRQDV DNASLARLDL ERKVESLQEE IAFLKKLHEE 241 EIQELQAQIQ EQHVQIDVDV SKPDLTAALR DVRQQYESVA 281 AKNLQEAEEW YKSKFADLSE AANRNNDALR QAKQESTEYR 321 RQVQSLTCEV DALKGTNESL ERQMREMEEN FAVEAANYQD 361 TIGRLQDEIQ NMKEEMARHL REYQDLLNVK MALDIEIATY 401 RKLLEGEESR ISLPLPNFSS LNLRETNLDS LPLVDTHSKR 421 LIKTVETR DGQVINETSQ HHDDLE
[0019] Urinary cell levels of vimentin mRNA were significantly associated with the presence of kidney fibrosis (P<0.0001, logistic regression model). The predicted probability of fibrosis (Y-axis) as a function of vimentin log 10-transformed mRNA copy numbers (X-axis) is shown in FIG. 2A. The vimentin plot shows the LOESS model's predicted probability (dotted line), its 95% confidence interval (shaded area) and the logistic regression model's predicted probabilities (solid line). The parameter estimates for the 4-gene model including terms accounting for the relationships, including non-linear relationships, between the mRNAs and diagnosis are provided in FIG. 3D.
[0020] Any probe or primer that is specific for vimentin can be used in the methods and devices described herein. Examples are provided herein.
NKCC2
[0021] The Na--K--Cl cotransporter (NKCC, SLC12A2) is a protein that aids in the active transport of sodium, potassium, and chloride into and out of cells. There are two varieties, or isoforms, of this membrane transport protein, called NKCC1 and NKCC2.
[0022] Nucleic acid and protein sequences for NKCC2 are available, for example, in the sequence database maintained by the National Center for Biotechnology Information (see website at www.ncbi.nlm.nih.gov/). One example of a human NKCC2 nucleic acid sequence is available as accession number BC040138.2 (GI:34193025), provided below as SEQ ID NO:5.
TABLE-US-00005 1 CTTTGAAGAA CATCCTGAAG ATTATATCGG AGACAATATA 41 TCAAGAATCT ATTTATTGAA TCATCTAGAA CAAAAGCCAG 61 GAGCTCCCTA ATGGAAGCAC ATTAGTGTTT ATTTTGATGA 121 AGAAATATAT AGATTTTTTA AAACAACCAC AAAGTAGATA 161 GCTCAGTAAA AAATCAATTT TGGAAGATGT CACTGAACAA 201 CTCTTCCAAT GTATTTCTGG ATTCAGTGCC CAGTAATACC 241 AATCGCTTTC AAGTTAGTGT CATAAATGAG AACCATGAGA 281 GCAGTGCAGC TGCAGATGAC AATACTGACC CACCACATTA 321 TGAAGAAACC TCTTTTGGGG ATGAAGCTCA GAAAAGACTC 361 AGAATCAGCT TTAGGCCTGG GAATCAGGAG TGCTATGACA 401 ATTTCCTCCA AAGTGGAGAA ACTGCTAAAA CAGATGCCAG 441 TTTTCACGCT TATGATTCTC ACACAAACAC ATACTATCTA 481 CAAACTTTTG GCCACAACAC CATGGATGCC GTTCCCAAGA 521 TAGAGTACTA TCGTAACACC GGCAGCATCA GTGGGCCCAA 561 GGTCAACCGA CCCAGCCTGC TTGAGATTCA CGAGCAACTC 601 GCAAAGAATG TGGCAGTCAC CCCAAGTTCA GCTGACAGAG 641 TTGCTAACGG TGATGGGATA CCTGGAGATG AACAAGCTGA 661 AAATAAGGAA GATGATCAAG CTGGTGTTGT GAAGTTTGGA 721 TGGGTGAAAG GTGTGCTGGT AAGATGCATG CTGAACATCT 761 GGGGAGTCAT GCTCTTCATT CGCCTCTCCT GGATTGTTGG 801 AGAAGCTGGA ATTGGTCTTG GAGTTCTCAT AATTCTTCTT 841 TCCACCATGG TAACTTCTAT TACTGGGTTG TCAACTTCTG 881 CGATAGCAAC TAACGGGTTT GTTCGTGGAG GTGGGGCCTA 921 CTATCTTATT TCCAGAAGTT TAGGGCCCGA GTTCGGTGGG 961 TCAATAGGCC TGATCTTTGC TTTTGCTAAT GCAGTGGCTG 1001 TTGCTATGTA TGTGGTGGGA TTTGCTGAGA CTGTAGTAGA 1041 TCTTCTTAAG GAGAGTGATT CGATGATGGT GGATCCAACC 1081 AATGACATCC GGATTATAGG CTCCATCACA GTGGTGATTC 1121 TTCTAGGAAT TTCAGTAGCT GGAATGGAAT GGGAGGCAAA 1161 GGCCCAAGTC ATTCTTCTGG TCATTCTTCT AATTGCTATT 1201 GCAAACTTCT TCATTGGAAC TGTCATTCCA TCCAACAATG 1241 AGAAAAAGTC CAGAGGTTTC TTTAATTACC AAGCATCAAT 1281 ATTTGCAGAA AACTTTGGGC CACGCTTCAC AAAGGGTGAA 1321 GGCTTCTTCT CTGTCTTTGC CATTTTTTTC CCAGCAGCTA 1361 CTGGGATTCT TGCTGGTGCC AATATCTCAG GAGATTTGGA 1401 GGCACTGAGG AAACAAGGAG CTTCACCTCT CCCTCAAGGA 1441 GCTCAGAGTC GAAGGAGGAG ACAGACTTCC CTTATATGAA 1481 TTAGAACAAG CAAGAGTAGA ATCAAGTGCA AAGGAAAGAG 1521 GAAGCAGAAA TTGCCTGTCC CCTCAAAAAG TAAAGGAAGA 1561 CTTTCAGAAG AGGGGACACT CAATCCAGGT TTTGAGGGAT 1601 GAACAGGAGT TTGCCGACAG GACAAAGAAG AGACGGACAT 1641 TTGAAACAGA AGGAATGGGA TGTAAGAAGG CACCAAGAAA 1681 GATGCTGCTA ATGAGAATTA TTTTATGTGC AGAGTAGTGT 1721 ATGTAATCCT TCATTAATAT ATTAATAAAC ATATTTATAA 1761 ATAAAAAAAA AAAAAAAAAA AAAAAAAAAA AAAAA
[0023] The protein encoded by the NKCC2 nucleic acid with SEQ ID NO:5 has NCBI accession number AAH40138.1 (GI:25304083) and the following human amino acid sequence (SEQ ID NO: 6).
TABLE-US-00006 1 MSLNNSSNVF LDSVPSNTNR FQVSVINENH ESSAAADDNT 41 DPPHYEETSF GDEAQKRLRI SFRPGNQECY DNFLQSGETA 81 KTDASFHAYD SHTNTYYLQT FGHNTMDAVP KIEYYRNTGS 121 ISGPKVNRPS LLEIHEQLAK NVAVTPSSAD RVANGDGIPG 161 DEQAENKEDD QAGVVKFGWV KGVLVRCMLN IWGVMLFIRL 201 SWIVGEAGIG LGVLIILLST MVTSITGLST SAIATNGFVR 241 GGGAYYLISR SLGPEFGGSI GLIFAFANAV AVAMYVVGFA 281 ETVVDLLKES DSMMVDPTND IRIIGSITVV ILLGISVAGM 321 EWEAKAQVIL LVILLIAIAN FFIGTVIPSN NEKKSRGFFN 361 YQASIFAENF GPRFTKGEGF FSVFAIFFPA ATGILAGANI 401 SGDLEALRKQ GASPLPQGAQ SRRRRQTSLI
[0024] Even though initial analysis indicated that NKCC2 was not amongst the twelve genes that initially appeared to be more correlated with fibrosis (FIG. 2A), quantification of NKCC2 mRNA levels along with vimentin, E-cadherin and 18S rRNA provided the most accurate, parsimonious, diagnostic model of allograft fibrosis with 93.8% sensitivity and 84.1% specificity (P<0.0001).
[0025] Additional mRNAs such as HGF (P<0.0001), α-SMA (P<0.0001), fibronectin 1 (P<0.0001), perforin (P=0.0002), PAI1 (P=0.0002), TGFβ1 (P=0.0004), TIMP1 (P=0.0009), granzyme B (P=0.0009), FSP1 (P=0.006), CD103 (P=0.02), and collagen 1A1 (P=0.04) were also associated with fibrosis. Surprisingly, once vimentin mRNA levels were entered into the four-gene model that included analysis of levels of mRNA for vimentin, NKCC2, and E-cadherin, with 18S rRNA, none of the mRNA levels increased the accuracy of diagnosis of fibrosis. The four gene signature was robustly validated using an independent set of urine samples (the validation set) that were not used in the discovery of the four gene diagnosis model.
[0026] The parameter estimates for the four-gene model, including terms accounting for non-linear relationships between the mRNA levels and diagnosis are provided in FIG. 3. As shown, the propensity for development of kidney fibrosis is inversely proportional to NKCC2 expression. In other words, the propensity for development of kidney fibrosis is higher when NKCC2 expression is lower.
[0027] Any probe or primer that is specific for NKCC2 can be used in the methods and devices described herein. Examples are provided herein.
E-Cadherin
[0028] Cadherins (named for "calcium-dependent adhesion") are a class of type-1 transmembrane proteins. They play important roles in cell adhesion, ensuring that cells within tissues are bound together. They are dependent on calcium (Ca2+) ions to function, hence their name. E-cadherin is found in epithelial tissue.
[0029] Nucleic acid and protein sequences for E-cadherin are available, for example, in the sequence database maintained by the National Center for Biotechnology Information (see website at www.ncbi.nlm.nih.gov/). One example of a human E-cadherin nucleic acid sequence is available as accession number XM--007840.5 (GI:15316186), provided below as SEQ ID NO:7.
TABLE-US-00007 1 AGTGAATTTT GAAGATTGCA CCGGTCGACA AAGGACAGCC 41 TATTTTTCCC TCGACACCCG ATTCAAAGTG GGCACAGATG 81 GTGTGATTAC AGTCAAAAGG CCTCTACGGT TTCATAACCC 121 ACAGATCCAT TTCTTGGTCT ACGCCTGGGA CTCCACCTAC 161 AGAAAGTTTT CCACCAAAGT CACGCTGAAT ACAGTGGGGC 201 ACCACCACCG CCCCCCGCCC CATCAGGCCT CCGTTTCTGG 241 AATCCAAGCA GAATTGCTCA CATTTCCCAA CTCCTCTCCT 281 GGCCTCAGAA GACAGAAGAG AGACTGGGTT ATTCCTCCCA 321 TCAGCTGCCC AGAAAATGAA AAAGGCCCAT TTCCTAAAAA 361 CCTGGTTCAG ATCAAATCCA ACAAAGACAA AGAAGGCAAG 401 GTTTTCTACA GCATCACTGG CCAAGGAGCT GACACACCCC 441 CTGTTGGTGT CTTTATTATT GAAAGAGAAA CAGGATGGCT 481 GAAGGTGACA GAGCCTCTGG ATAGAGAACG CATTGCCACA 521 TACACTCTCT TCTCTCACGC TGTGTCATCC AACGGGAATG 561 CAGTTGAGGA TCCAATGGAG ATTTTGATCA CGGTAACCGA 601 TCAGAATGAC AACAAGCCCG AATTCACCCA GGAGGTCTTT 641 AAGGGGTCTG TCATGGAAGG TGCTCTTCCA GGAACCTCTG 681 TGATGGAGGT CACAGCCACA GACGCGGACG ATGATGTGAA 721 CACCTACAAT GCCGCCATCG CTTACACCAT CCTCAGCCAA 761 GATCCTGAGC TCCCTGACAA AAATATGTTC ACCATTAACA 801 GGAACACAGG AGTCATCAGT GTGGTCACCA CTGGGCTGGA 841 CCGAGAGAGT TTCCCTACGT ATACCCTGGT GGTTCAAGCT 881 GCTGACCTTC AAGGTGAGGG GTTAAGCACA ACAGCAACAG 921 CTGTGATCAC AGTCACTGAC ACCAACGATA ATCCTCCGAT 961 CTTCAATCCC ACCACGTACA AGGGTCAGGT GCCTGAGAAC 1001 GAGGCTAACG TCGTAATCAC CACACTGAAA GTGACTGATG 1041 CTGATGCCCC CAATACCCCA GCGTGGGAGG CTGTATACAC 1081 CATATTGAAT GATGATGGTG GACAATTTGT CGTCACCACA 1121 AATCCAGTGA ACAACGATGG CATTTTGAAA ACAGCAAAGG 1161 GCTTGGATTT TGAGGCCAAG CAGCAGTACA TTCTACACGT 1201 AGCAGTGACG AATGTGGTAC CTTTTGAGGT CTCTCTCACC 1241 ACCTCCACAG CCACCGTCAC CGTGGATGTG CTGGATGTGA 1281 ATGAAGCCCC CATCTTTGTG CCTCCTGAAA AGAGAGTGGA 1321 AGTGTCCGAG GACTTTGGCG TGGGCCAGGA AATCACATCC 1361 TACACTGCCC AGGAGCCAGA CACATTTATG GAACAGAAAA 1401 TAACATATCG GATTTGGAGA GACACTGCCA ACTGGCTGGA 1441 GATTAATCCG GACACTGGTG CCATTTCCAC TCGGGCTGAG 1481 CTGGACAGGG AGGATTTTGA GCACGTGAAG AACAGCACGT 1521 ACACAGCCCT AATCATAGCT ACAGACAATG GTTCTCCAGT 1561 TGCTACTGGA ACAGGGACAC TTCTGCTGAT CCTGTCTGAT 1601 GTGAATGACA ACGCCCCCAT ACCAGAACCT CGAACTATAT 1641 TCTTCTGTGA GAGGAATCCA AAGCCTCAGG TCATAAACAT 1681 CATTGATGCA GACCTTCCTC CCAATACATC TCCCTTCACA 1721 GCAGAACTAA CACACGGGGC GAGTGCCAAC TGGACCATTC 1761 AGTACAACGA CCCAACCCAA GAATCTATCA TTTTGAAGCC 1801 AAAGATGGCC TTAGAGGTGG GTGACTACAA AATCAATCTC 1841 AAGCTCATGG ATAACCAGAA TAAAGACCAA GTGACCACCT 1881 TAGAGGTCAG CGTGTGTGAC TGTGAAGGGG CCGCTGGCGT 1921 CTGTAGGAAG GCACAGCCTG TCGAAGCAGG ATTGCAAATT 1961 CCTGCCATTC TGGGGATTCT TGGAGGAATT CTTGCTTTGC 2001 TAATTCTGAT TCTGCTGCTC TTGCTGTTTC TTCGGAGGAG 2041 AGCGGTGGTC AAAGAGCCCT TACTGCCCCC AGAGGATGAC 2081 ACCCGGGACA ACGTTTATTA CTATGATGAA GAAGGAGGCG 2121 GAGAAGAGGA CCAGGACTTT GACTTGAGCC AGCTGCACAG 2161 GGGCCTGGAC GCTCGGCCTG AAGTGACTCG TAACGACGTT 2201 GCACCAACCC TCATGAGTGT CCCCCGGTAT CTTCCCCGCC 2241 CTGCCAATCC CGATGAAATT GGAAATTTTA TTGATGAAAA 2281 TCTGAAAGCG GCTGATACTG ACCCCACAGC CCCGCCTTAT 2321 GATTCTCTGC TCGTGTTTGA CTATGAAGGA AGCGGTTCCG 2361 AAGCTGCTAG TCTGAGCTCC CTGAACTCCT CAGAGTCAGA 2401 CAAAGACCAG GACTATGACT ACTTGAACGA ATGGGGCAAT 2441 CGCTTCAAGA AGCTGGCTGA CATGTACGGA GGCGGCGAGG 2481 ACGACTAGGG GACTCGAGAG AGGCGGGCCC CAGACCCATG 2521 TGCTGGGAAA TGCAGAAATC ACGTTGCTGG TGGTTTT
[0030] The protein encoded by the E-cadherin nucleic acid with SEQ ID NO:7 has the following human amino acid sequence (SEQ ID NO: 8).
TABLE-US-00008 1 MEILITVTDQ NDNKPEFTQE VFKGSVMEGA LPGTSVMEVT 41 ATDADDDVNT YNAAIAYTIL SQDPELPDKN MFTINRNTGV 81 ISVVTTGLDR ESFPTYTLVV QAADLQGEGL STTATAVITV 121 TDTNDNPPIF NPTTYKGQVP ENEANVVITT LKVTDADAPN 161 TPAWEAVYTI LNDDGGQFVV TTNPVNNDGI LKTAKGLDFE 201 AKQQYILHVA VTNVVPFEVS LTTSTATVTV DVLDVNEAPI 241 FVPPEKRVEV SEDFGVGQEI TSYTAQEPDT FMEQKITYRI 281 WRDTANWLEI NPDTGAISTR AELDREDFEH VKNSTYTALI 321 IATDNGSPVA TGTGTLLLIL SDVNDNAPIP EPRTIFFCER 361 NPKPQVINII DADLPPNTSP FTAELTHGAS ANWTIQYNDP 401 TQESIILKPK MALEVGDYKI NLKLMDNQNK DQVTTLEVSV 441 CDCEGAAGVC RKAQPVEAGL QIPAILGILG GILALLILIL 481 LLLLFLRRRA VVKEPLLPPE DDTRDNVYYY DEEGGGEEDQ 521 DFDLSQLHRG LDARPEVTRN DVAPTLMSVP RYLPRPANPD 561 EIGNFIDENL KAADTDPTAP PYDSLLVFDY EGSGSEAASL 601 SSLNSSESDK DQDYDYLNEW GNRFKKLADM YGGGEDD
[0031] Another example of a human E-cadherin nucleic acid sequence is available as accession number NM--004360.3 (GI:169790842), provided below as SEQ ID NO:9.
TABLE-US-00009 1 AGTGGCGTCG GAACTGCAAA GCACCTGTGA GCTTGCGGAA 41 GTCAGTTCAG ACTCCAGCCC GCTCCAGCCC GGCCCGACCC 81 GACCGCACCC GGCGCCTGCC CTCGCTCGGC GTCCCCGGCC 121 AGCCATGGGC CCTTGGAGCC GCAGCCTCTC GGCGCTGCTG 161 CTGCTGCTGC AGGTCTCCTC TTGGCTCTGC CAGGAGCCGG 201 AGCCCTGCCA CCCTGGCTTT GACGCCGAGA GCTACACGTT 241 CACGGTGCCC CGGCGCCACC TGGAGAGAGG CCGCGTCCTG 281 GGCAGAGTGA ATTTTGAAGA TTGCACCGGT CGACAAAGGA 321 CAGCCTATTT TTCCCTCGAC ACCCGATTCA AAGTGGGCAC 361 AGATGGTGTG ATTACAGTCA AAAGGCCTCT ACGGTTTCAT 401 AACCCACAGA TCCATTTCTT GGTCTACGCC TGGGACTCCA 441 CCTACAGAAA GTTTTCCACC AAAGTCACGC TGAATACAGT 481 GGGGCACCAC CACCGCCCCC CGCCCCATCA GGCCTCCGTT 521 TCTGGAATCC AAGCAGAATT GCTCACATTT CCCAACTCCT 561 CTCCTGGCCT CAGAAGACAG AAGAGAGACT GGGTTATTCC 601 TCCCATCAGC TGCCCAGAAA ATGAAAAAGG CCCATTTCCT 641 AAAAACCTGG TTCAGATCAA ATCCAACAAA GACAAAGAAG 681 GCAAGGTTTT CTACAGCATC ACTGGCCAAG GAGCTGACAC 721 ACCCCCTGTT GGTGTCTTTA TTATTGAAAG AGAAACAGGA 761 TGGCTGAAGG TGACAGAGCC TCTGGATAGA GAACGCATTG 801 CCACATACAC TCTCTTCTCT CACGCTGTGT CATCCAACGG 841 GAATGCAGTT GAGGATCCAA TGGAGATTTT GATCACGGTA 881 ACCGATCAGA ATGACAACAA GCCCGAATTC ACCCAGGAGG 921 TCTTTAAGGG GTCTGTCATG GAAGGTGCTC TTCCAGGAAC 961 CTCTGTGATG GAGGTCACAG CCACAGACGC GGACGATGAT 1001 GTGAACACCT ACAATGCCGC CATCGCTTAC ACCATCCTCA 1041 GCCAAGATCC TGAGCTCCCT GACAAAAATA TGTTCACCAT 1081 TAACAGGAAC ACAGGAGTCA TCAGTGTGGT CACCACTGGG 1121 CTGGACCGAG AGAGTTTCCC TACGTATACC CTGGTGGTTC 1161 AAGCTGCTGA CCTTCAAGGT GAGGGGTTAA GCACAACAGC 1201 AACAGCTGTG ATCACAGTCA CTGACACCAA CGATAATCCT 1241 CCGATCTTCA ATCCCACCAC GTACAAGGGT CAGGTGCCTG 1281 AGAACGAGGC TAACGTCGTA ATCACCACAC TGAAAGTGAC 1321 TGATGCTGAT GCCCCCAATA CCCCAGCGTG GGAGGCTGTA 1361 TACACCATAT TGAATGATGA TGGTGGACAA TTTGTCGTCA 1401 CCACAAATCC AGTGAACAAC GATGGCATTT TGAAAACAGC 1441 AAAGGGCTTG GATTTTGAGG CCAAGCAGCA GTACATTCTA 1481 CACGTAGCAG TGACGAATGT GGTACCTTTT GAGGTCTCTC 1521 TCACCACCTC CACAGCCACC GTCACCGTGG ATGTGCTGGA 1561 TGTGAATGAA GCCCCCATCT TTGTGCCTCC TGAAAAGAGA 1601 GTGGAAGTGT CCGAGGACTT TGGCGTGGGC CAGGAAATCA 1641 CATCCTACAC TGCCCAGGAG CCAGACACAT TTATGGAACA 1681 GAAAATAACA TATCGGATTT GGAGAGACAC TGCCAACTGG 1721 CTGGAGATTA ATCCGGACAC TGGTGCCATT TCCACTCGGG 1761 CTGAGCTGGA CAGGGAGGAT TTTGAGCACG TGAAGAACAG 1801 CACGTACACA GCCCTAATCA TAGCTACAGA CAATGGTTCT 1841 CCAGTTGCTA CTGGAACAGG GACACTTCTG CTGATCCTGT 1881 CTGATGTGAA TGACAACGCC CCCATACCAG AACCTCGAAC 1921 TATATTCTTC TGTGAGAGGA ATCCAAAGCC TCAGGTCATA 1961 AACATCATTG ATGCAGACCT TCCTCCCAAT ACATCTCCCT 2001 TCACAGCAGA ACTAACACAC GGGGCGAGTG CCAACTGGAC 2041 CATTCAGTAC AACGACCCAA CCCAAGAATC TATCATTTTG 2081 AAGCCAAAGA TGGCCTTAGA GGTGGGTGAC TACAAAATCA 2121 ATCTCAAGCT CATGGATAAC CAGAATAAAG ACCAAGTGAC 2161 CACCTTAGAG GTCAGCGTGT GTGACTGTGA AGGGGCCGCT 2201 GGCGTCTGTA GGAAGGCACA GCCTGTCGAA GCAGGATTGC 2241 AAATTCCTGC CATTCTGGGG ATTCTTGGAG GAATTCTTGC 2281 TTTGCTAATT CTGATTCTGC TGCTCTTGCT GTTTCTTCGG 2321 AGGAGAGCGG TGGTCAAAGA GCCCTTACTG CCCCCAGAGG 2361 ATGACACCCG GGACAACGTT TATTACTATG ATGAAGAAGG 2401 AGGCGGAGAA GAGGACCAGG ACTTTGACTT GAGCCAGCTG 2441 CACAGGGGCC TGGACGCTCG GCCTGAAGTG ACTCGTAACG 2481 ACGTTGCACC AACCCTCATG AGTGTCCCCC GGTATCTTCC 2521 CCGCCCTGCC AATCCCGATG AAATTGGAAA TTTTATTGAT 2561 GAAAATCTGA AAGCGGCTGA TACTGACCCC ACAGCCCCGC 2601 CTTATGATTC TCTGCTCGTG TTTGACTATG AAGGAAGCGG 2641 TTCCGAAGCT GCTAGTCTGA GCTCCCTGAA CTCCTCAGAG 2681 TCAGACAAAG ACCAGGACTA TGACTACTTG AACGAATGGG 2721 GCAATCGCTT CAAGAAGCTG GCTGACATGT ACGGAGGCGG 2761 CGAGGACGAC TAGGGGACTC GAGAGAGGCG GGCCCCAGAC 2801 CCATGTGCTG GGAAATGCAG AAATCACGTT GCTGGTGGTT 2841 TTTCAGCTCC CTTCCCTTGA GATGAGTTTC TGGGGAAAAA 2881 AAAGAGACTG GTTAGTGATG CAGTTAGTAT AGCTTTATAC 2921 TCTCTCCACT TTATAGCTCT AATAAGTTTG TGTTAGAAAA 2961 GTTTCGACTT ATTTCTTAAA GCTTTTTTTT TTTTCCCATC 3001 ACTCTTTACA TGGTGGTGAT GTCCAAAAGA TACCCAAATT 3041 TTAATATTCC AGAAGAACAA CTTTAGCATC AGAAGGTTCA 3081 CCCAGCACCT TGCAGATTTT CTTAAGGAAT TTTGTCTCAC 3121 TTTTAAAAAG AAGGGGAGAA GTCAGCTACT CTAGTTCTGT 3161 TGTTTTGTGT ATATAATTTT TTAAAAAAAA TTTGTGTGCT 3201 TCTGCTCATT ACTACACTGG TGTGTCCCTC TGCCTTTTTT 3241 TTTTTTTTAA GACAGGGTCT CATTCTATCG GCCAGGCTGG 3281 AGTGCAGTGG TGCAATCACA GCTCACTGCA GCCTTGTCCT 3321 CCCAGGCTCA AGCTATCCTT GCACCTCAGC CTCCCAAGTA 3361 GCTGGGACCA CAGGCATGCA CCACTACGCA TGACTAATTT 3401 TTTAAATATT TGAGACGGGG TCTCCCTGTG TTACCCAGGC 3441 TGGTCTCAAA CTCCTGGGCT CAAGTGATCC TCCCATCTTG 3481 GCCTCCCAGA GTATTGGGAT TACAGACATG AGCCACTGCA 3521 CCTGCCCAGC TCCCCAACTC CCTGCCATTT TTTAAGAGAC 3561 AGTTTCGCTC CATCGCCCAG GCCTGGGATG CAGTGATGTG 3601 ATCATAGCTC ACTGTAACCT CAAACTCTGG GGCTCAAGCA 3641 GTTCTCCCAC CAGCCTCCTT TTTATTTTTT TGTACAGATG 3681 GGGTCTTGCT ATGTTGCCCA AGCTGGTCTT AAACTCCTGG 3721 CCTCAAGCAA TCCTTCTGCC TTGGCCCCCC AAAGAGACTG 3861 GATTGTGGGC ATGAGCTGCT GTGCCCAGCC TCCATGTTTT 3801 AATATCAACT CTCACTCCTG AATTCAGTTG CTTTGCCCAA 3841 GATAGGAGTT CTCTGATGCA GAAATTATTG GGCTCTTTTA 3881 GGGTAAGAAG TTTGTGTCTT TGTCTGGCCA CATCTTGACT 3921 AGGTATTGTC TACTCTGAAG ACCTTTAATG GCTTCCCTCT 3961 TTCATCTCCT GAGTATGTAA CTTGCAATGG GCAGCTATCC 4001 AGTGACTTGT TCTGAGTAAG TGTGTTCATT AATGTTTATT 4041 TAGCTCTGAA GCAAGAGTGA TATACTCCAG GACTTAGAAT 4081 AGTGCCTAAA GTGCTGCAGC CAAAGACAGA GCGGAACTAT 4121 GAAAAGTGGG CTTGGAGATG GCAGGAGAGC TTGTCATTGA 4161 GCCTGGCAAT TTAGCAAACT GATGCTGAGG ATGATTGAGG 4201 TGGGTCTACC TCATCTCTGA AAATTCTGGA AGGAATGGAG 4241 GAGTCTCAAC ATGTGTTTCT GACACAAGAT CCGTGGTTTG 4281 TACTCAAAGC CCAGAATCCC CAAGTGCCTG CTTTTGATGA 4321 TGTCTACAGA AAATGCTGGC TGAGCTGAAC ACATTTGCCC 4361 AATTCCAGGT GTGCACAGAA AACCGAGAAT ATTCAAAATT 4401 CCAAATTTTT TTCTTAGGAG CAAGAAGAAA ATGTGGCCCT 4441 AAAGGGGGTT AGTTGAGGGG TAGGGGGTAG TGAGGATCTT 4481 GATTTGGATC TCTTTTTATT TAAATGTGAA TTTCAACTTT 4521 TGACAATCAA AGAAAAGACT TTTGTTGAAA TAGCTTTACT 4561 GTTTCTCAAG TGTTTTGGAG AAAAAAATCA ACCCTGCAAT 4601 CACTTTTTGG AATTGTCTTG ATTTTTCGGC AGTTCAAGCT 4641 ATATCGAATA TAGTTCTGTG TAGAGAATGT CACTGTAGTT 4681 TTGAGTGTAT ACATGTGTGG GTGCTGATAA TTGTGTATTT 4721 TCTTTGGGGG TGGAAAAGGA AAACAATTCA AGCTGAGAAA 4761 AGTATTCTCA AAGATGCATT TTTATAAATT TTATTAAACA 4801 ATTTTGTTAA ACCAT
[0032] The protein encoded by the E-cadherin nucleic acid with SEQ ID NO:9 has a human amino acid sequence with NCBI accession number NP--004351.1 (GI:4757960), which is provided below as SEQ ID NO: 10.
TABLE-US-00010 1 MGPWSRSLSA LLLLLQVSSW LCQEPEPCHP GFDAESYTFT 41 VPRRHLERGR VLGRVNFEDC TGRQRTAYFS LDTRFKVGTD 61 GVITVKRPLR FHNPQIHFLV YAWDSTYRKF STKVTLNTVG 121 HHHRPPPHQA SVSGIQAELL TFPNSSPGLR RQKRDWVIPP 161 ISCPENEKGP FPKNLVQIKS NKDKEGKVFY SITGQGADTP 201 PVGVFIIERE TGWLKVTEPL DRERIATYTL FSHAVSSNGN 241 AVEDPMEILI TVTDQNDNKP EFTQEVFKGS VMEGALPGTS 281 VMEVTATDAD DDVNTYNAAI AYTILSQDPE LPDKNMFTIN 321 RNTGVISVVT TGLDRESFPT YTLVVQAADL QGEGLSTTAT 361 AVITVTDTND NPPIFNPTTY KGQVPENEAN VVITTLKVTD 401 ADAPNTPAWE AVYTILNDDG GQFVVTTNPV NNDGILKTAK 441 GLDFEAKQQY ILHVAVTNVV PFEVSLTTST ATVTVDVLDV 481 NEAPIFVPPE KRVEVSEDFG VGQEITSYTA QEPDTFMEQK 521 ITYRIWRDTA NWLEINPDTG AISTRAELDR EDFEHVKNST 561 YTALIIATDN GSPVATGTGT LLLILSDVND NAPIPEPRTI 601 FFCERNPKPQ VINIIDADLP PNTSPFTAEL THGASANWTI 641 QYNDPTQESI ILKPKMALEV GDYKINLKLM DNQNKDQVTT 681 LEVSVCDCEG AAGVCRKAQP VEAGLQIPAI LGILGGILAL 721 LILILLLLLF LRRRAVVKEP LLPPEDDTRD NVYYYDEEGG 761 GEEDQDFDLS QLHRGLDARP EVTRNDVAPT LMSVPRYLPR 801 PANPDEIGNF IDENLKAADT DPTAPPYDSL LVFDYEGSGS 841 EAASLSSLNS SESDKDQDYD YLNEWGNRFK KLADMYGGGE 881 DD
[0033] Even though initial analysis indicated that E-cadherin was not amongst the twelve genes that initially appeared to be more correlated with fibrosis (FIG. 2A), quantification of E-cadherin mRNA levels along with vimentin, NKCC2 and 18S rRNA provided the most accurate, parsimonious, diagnostic model of allograft fibrosis with 93.8% sensitivity and 84.1% specificity (P<0.0001).
[0034] It is surprising that despite initial correlation of fibrosis with HGF (P<0.0001), α-SMA (P<0.0001), fibronectin 1 (P<0.0001), perforin (P=0.0002), PAI1, (P=0.0002), TGFβ1 (P=0.0004), TIMP1 (P=0.0009), granzyme B (P=0.0009), FSP1 (P=0.006), CD103 (P=0.02), and collagen 1A1 (P=0.04), a four-gene model that included analysis of levels of mRNA for vimentin, NKCC2, E-cadherin and 18S rRNA was more accurate and diagnostic of kidney fibrosis. In the independent validation set, this four-gene model predicted the presence of allograft fibrosis with 77.3% sensitivity and 87.5% specificity (P<0.0001).
[0035] The parameter estimates for the four-gene model including terms accounting for the relationships, including non-linear relationships, between the mRNAs and diagnosis are provided in FIG. 3. As shown, the propensity for development of kidney fibrosis is proportional to E-cadherin expression. In other words, the propensity for development of kidney fibrosis is higher when E-cadherin expression increases.
[0036] Any probe or primer that is specific for E-cadherin can be used in the methods and devices described herein. Examples are provided herein.
18S rRNA
[0037] Expression levels of a housekeeping gene can be measured and used to normalize the quantities of the other mRNAs measured. The 18S ribosomal RNA (abbreviated 18S rRNA) is one convenient gene whose expression can be employed for such normalization. The 18S rRNA is a part of the ribosomal RNA. The S in 18S represents Svedberg units. 18S rRNA is a component of the small eukaryotic ribosomal subunit (40S). 18S rRNA is the structural RNA for the small component of eukaryotic cytoplasmic ribosomes, and thus one of the basic components of all eukaryotic cells.
[0038] Nucleic acid sequences for rRNA are available, for example, in the sequence database maintained by the National Center for Biotechnology Information (see website at www.ncbi.nlm.nih.gov/). One example of a human rRNA nucleic acid sequence is available as accession number K03432.1 (GI:337377), provided below as SEQ ID NO:11.
TABLE-US-00011 1 CGCTGCTCCT CCCGTCGCCG TCCGGGCCCG TCCGTCCGTC 41 CGTCCGTCGT CCTCCTCGCT NNNNCGGGGC GCCGGGCCCG 61 TCCTCACNGG CCCCCGNNNN NGTCCNGGCC CGTCGGGGCC 121 TCGCCGCGCT CTACCTTACC TACCTGGTTG ATCCTGCCAG 161 TAGCATATGC TTGTCTCAAA GATTAAGCCA TGCATGTCTA 201 AGTACGCACG GCCGGTACAG TGAAACTGCG AATGGCTCAT 241 TAAATCAGTT ATGGTTCCTT TGGTCGCTCG CTCCTCTCCT 281 ACTTGGATAA CTGTGGTAAT TCTAGAGCTA ATACATGCCG 301 ACGGGCGCTG ACCCCCTTCG CGGGGGGGAT GCGTGCATTT 361 ATCAGATCAA AACCAACCCG GTCAGCCCCT CTCCGGCCCC 401 GGCCGGGGGG CGGGCGCCGG CGGCTTTGGT GACTCTAGAT 441 AACCTCGGGC CGATCGCACG CCCCCCGTGG CGGCGACGAC 481 CCATTCGAAC GTCTGCCCTA TCAACTTTCG ATGGTAGTCG 521 CCGTGCCTAC CATGGTGACC ACGGGTGACG GGGAATCAGG 561 GTTCGATTCC GGAGAGGGAG CCTGAGAAAC GGCTACCACA 601 TCCAAGGAAG GCAGCAGGCG CGCAAATTAC CCACTCCCGA 641 CCCGGGGAGG TAGTGACGAA AAATAACAAT ACAGGACTCT 681 TTCGAGGCCC TGTAATTGGA ATGAGTCCAC TTTAAATCCT 721 TTAACGAGGA TCCATTGGAG GGCAAGTCTG GTGCCAGCAG 761 CCGCGGTAAT TCCAGCTCCA ATAGCGTATA TTAAAGTTGC 801 TGCAGTTAAA AAGCTCGTAG TTGGATCTTG GGAGCGGGCG 841 GGCGGTCCGC CGCGAGGCGA GCCACCGCCC GTCCCCGCCC 881 CTTGCCTCTC GGCGCCCCCT CGATGCTCTT AGCTGAGTGT 921 CCCGCGGGGC CCGAAGCGTT TACTTTGAAA AAATTAGAGT 961 GTTCAAAGCA GGCCCGAGCC GCCTGGATAC CGCAGCTAGG 1001 AATAATGGAA TAGGACCGCG GTTCTATTTT GTTGGTTTTC 1041 GGAACTGAGG CCATGATTAA GAGGGACGGC CGGGGGCATT 1081 CGTATTGCGC CGCTAGAGGT GAAATTCCTT GGACCGGCGC 1121 AAGACGGACC AGAGCGAAAG CATTTGCCAA GAATGTTTTC 1161 ATTAATCAAG AACGAAAGTC GGAGGTTCGA AGACGATCAG 1201 ATACCGTCGT AGTTCCGACC ATAAACGATG CCGACCGGCG 1241 ATGCGGCGGC GTTATTCCCA TGACCCGCCG GGCAGCTTCC 1281 GGGAAACCAA AGTCTTTGGG TTCCGGGGGG AGTATGGTTG 1321 CAAAGCTGAA ACTTAAAGGA ATTGACGGAA GGGCACCACC 1361 AGGAGTGGAG CCTGCGGCTT AATTTGACTC AACACGGGAA 1401 ACCTCACCCG GCCCGGACAC GGACAGGATT GACAGATTGA 1441 TAGCTCTTTC TCGATTCCGT GGGTGGTGGT GCATGGCCGT 1481 TCTTAGTTGG TGGAGCGATT TGTCTGGTTA ATTCCGATAA 1521 CGAACGAGAC TCTGGCATGC TAACTAGTTA CGCGACCCCC 1561 GAGCGGTCGG CGTCCCCCAA CTTCTTAGAG GGACAAGTGG 1601 CGTTCAGCCA CCCGAGATTG AGCAATAACA GGTCTGTGAT 1641 GCCCTTAGAT GTCCGGGGCT GCACGCGCGC TACACTGACT 1681 GGCTCAGCGT GTGCCTACCC TACGCCGGCA GGCGCGGGTA 1721 ACCCGTTGAA CCCCATTCGT GATGGGGATC GGGGATTGCA 1761 ATTATTCCCC ATGAACGAGG AATTCCCAGT AAGTGCGGGT 1801 CATAAGCTTG CGTTGATTAA GTCCCTGCCC TTTGTACACA 1841 CCGCCCGTCG CTACTACCGA TTGGATGGTT TAGTGAGGCC 1881 CTCGGATCGG CCCCGCCGGG GTCGGCCCAC GGCCCTGGCG 1921 GAGCGCTGAG AAGACGGTCG AACTTGACTA TCTAGAGGAA 1961 GTAAAAGTCG TAACAAGGTT TCCGTAGGTG AACCTGCGGA 2001 AGGATCATTA ACGGAGCCCG GACGGCGGCC CGCGGCGGCG 2041 CCGCGCCGCG CTTCCCTCCG CACACCCACC CCCCCACCGC 2081 GACGGCGCGT GCGGGCGGGG CCGTGCCCGT TCGTTCGCTC 2121 GCTCGTTCGT TCGCCGCCCG GCCCGGCCGC GAGAGCCGAG 2161 AACTCGGGAG GGAGACGGGG GAGAGAGAGA GAGAGAGAGA 2201 GAGAGAGAGA GAGAGAGAGA GAAAGAAGGG CGTGT
[0039] The 18S rRNA expression can be used as a normalizing factor for amount and quality of total RNA isolated from the urinary cells. For example, the quantities of vimentin, NKCC2, and E-cadherin mRNAs can be divided by the quantity of 18S rRNA to remove sample-to-sample variability caused by factors other than those relating to expression levels (e.g., variation in cell numbers in the test sample). Surprisingly, the levels of 18S rRNA also contribute to the accuracy of diagnosis.
Assays for Detecting and Quantifying RNA
[0040] Any technique known to one of skill in the art for detecting and measuring RNA expression levels can be used in accordance with the methods described herein. Non-limiting examples of such techniques include reverse transcription, polymerase chain reaction pre-amplification, real-time quantitative polymerase chain reaction, microarray analysis, Northern blotting, nuclease protection assays, RNA fingerprinting, polymerase chain reaction, ligase chain reaction, Qbeta replicase, isothermal amplification method, strand displacement amplification, transcription based amplification systems, quantitative nucleic acid amplification assays (e.g., polymerase chain reaction assays), combined reverse transcription/nucleic acid amplification, nuclease protection (SI nuclease or RNAse protection assays), Serial Analysis Gene Expression (SAGE), next generation sequencing, gene expression microarray, as well as other methods.
[0041] Nucleic acids the can hybridize RNAs of vimentin, NKCC2, E-cadherin and one or more housekeeping genes (e.g., 18S rRNA) can be used as probes or primers for quantifying these RNAs. For example, the probes and/or primers can selectively hybridize to a nucleic acid encoding any of the polypeptides with SEQ ID NO:2, 4, 6, 8 and/or 10 sequence. When 18S rRNA levels are quantified the probes and/or primers can selectively hybridize to a nucleic acid that has at least 90% or at least 95% sequence identity or sequence complementarity to any of SEQ ID NO:11. Similarly, probes and/or primers for vimentin, NKCC2, and E-cadherin can have at least 90% or at least 95% sequence identity or sequence complementarity to any of SEQ ID NO:1, 3, 5, 7, and/or 9. Examples of primers and/or probes are provided in Table 2. For example, primers or probes for vimentin can include any of SEQ ID NO:12-14, or a combination thereof. Examples of NKCC2 probes or primers can include any of SEQ ID NO: 69-71, or a combination thereof. Examples of E-cadherin probes or primers can include any of SEQ ID NO: 75-77, or a combination thereof. Examples of 18S rRNA probes or primers can include any of SEQ ID NO: 78-81, or a combination thereof.
[0042] A "probe or primer" as used herein refers to one or more nucleic acids that may be used to detect one or more RNA type (e.g. vimentin, NKCC2, E-cadherin and a housekeeping RNA such as 18S rRNA). Detection may be, for example, through amplification as in PCR, RT-PCR, quantitative PCR or through hybridization, or through selective destruction and protection, as in assays based on the selective enzymatic degradation of single or double stranded nucleic acids, or by detecting mRNA. Probes and/or primers can be labeled with one or more fluorescent, radioactive, quenchers, or other detectable moieties (including enzymes). Probes may be any size so long as the probe is sufficiently large to selectively detect the desired gene or be amplified.
[0043] Primers can be polynucleotides or oligonucleotides capable of being extended in a primer extension reaction at their 3' end. In order for an oligonucleotide to serve as a primer, it typically is sufficiently complementary in sequence to be capable of forming a double-stranded structure with the template, or target, under the conditions employed. Establishing such conditions typically involves selection of solvent and salt concentration, incubation temperatures, incubation times, assay reagents and stabilization factors known to those in the art. The term primer or primer oligonucleotide refers to an oligonucleotide as defined herein, which is capable of acting as a point of initiation of synthesis when employed under conditions in which synthesis of a primer extension product that is complementary to a nucleic acid strand is induced, as, for example, in a cDNA or DNA replication reaction such as a PCR reaction. Like non-primer oligonucleotides, primer oligonucleotides can be labeled according to any technique known in the art, such as with radioactive atoms, fluorescent labels, enzymatic labels, proteins, haptens, antibodies, sequence tags, mass label or the like. Such labels may be employed by associating them, for example, with the 5' terminus of a primer by a plurality of techniques known in the art. Such labels may also act as capture moieties. A probe or primer may be in solution, as would be typical for multiplex PCR, or a probe or primer may be adhered to a solid surface, as in an array or microarray. Compounds such as peptide nucleic acids (PNAs) can be used instead of nucleic acids to hybridize to the RNAs. In addition, probes may contain rare or unnatural nucleic acids such as inosine.
[0044] Such a RNA or DNA (or fragments therefore) may serve as a probe, for example, when it is at least 9, at least 10, at least 11, at least 12, at least 13, at least 14, at least 15, or at least 16 consecutive nucleotides in length. In some embodiments, the probe is about 9, about 10, about 11, about 12, about 13, about 14, about 15, about 16, about 17, about 18, about 19, about 20, about 21 or about 22 consecutive nucleotides in length. In further embodiments, the probe may be at least 20, at least 30, at least 50, or at least 70 consecutive nucleotides in length. The primers and/or probes can be less than about 80, less than about 70, less than about 60, less than about 50, less than about 45, less than about 40, less than about 39, less than about 38, less than about 37, less than about 36, less than about 35, less than about 34, less than about 33, less than about 32, less than about 31, or less than about 30 consecutive nucleotides in length.
[0045] During quantification probes and primers can be hybridized to vimentin, NKCC2, E-cadherin and housekeeping (e.g. 18S rRNA) RNAs. Hybridization reactions can be performed under conditions of different "stringency". The stringency of a hybridization reaction includes the difficulty with which any two nucleic acid molecules will hybridize to one another. Under stringent conditions, nucleic acid molecules at least 60%, 65%, 70%, 75% identical (or complementary) to each other remain hybridized to each other, whereas molecules with low percent identity do not remain hybridized. As the hybridization conditions become more stringent, the percent sequence identity or percent sequence complementarity between nucleic acid hybrids increases. Under highly stringent conditions, nucleic acid molecules at least 90%, 92%, 94%, 95%, 96%, 97%, 98%, 99%, or 100% identical (or complementary) to each other remain hybridized to each other, whereas molecules with low percent identity cannot remain hybridized.
[0046] A preferred, non-limiting example of stringent hybridization conditions are hybridization in 6× sodium chloride/sodium citrate (SSC) at about 45° C., followed by one or more washes in 0.2×SSC, 0.1% SDS at 50° C. A non-limiting example of highly stringent hybridization conditions is hybridization in 6× sodium chloride/sodium citrate (SSC) at about 45° C., followed by one or more washes in 0.2×SSC, 0.1% SDS at 60° C., or preferably at 65° C.
[0047] When hybridization occurs in an antiparallel configuration between two single-stranded polynucleotides, the reaction is called "annealing" and those polynucleotides are described as "complementary". A double-stranded polynucleotide can be "complementary" or "homologous" to another polynucleotide, if hybridization can occur between one of the strands of the first polynucleotide and the second. "Complementarity" or "homology" (the degree that one polynucleotide is complementary with another) is quantifiable in terms of the proportion of bases in opposing strands that are expected to hydrogen bond with each other, according to generally accepted base-pairing rules.
[0048] The probe can be labeled by any of the many different methods known to those skilled in this art. The labels most commonly employed for these studies are radioactive elements, enzymes, chemicals that fluoresce when exposed to ultraviolet light, and others. A number of fluorescent materials are known and can be utilized as labels. These include, but are not limited to, fluorescein, rhodamine, auramine, Texas Red, AMCA blue and Lucifer Yellow. The radioactive label can be detected by any of the currently available counting procedures. Non-limiting examples of isotopes include 3H, 14C, 32P, 35S, 36Ci, 51Cr, 57Co, 58Co, 59Fe, 90Y, 125I, 131I, and 186Re.
[0049] Enzyme labels are likewise useful, and can be detected by any of the presently utilized colorimetric, spectrophotometric, fluorospectrophotometric, amperometric or gasometric techniques. The enzyme is conjugated to the selected particle by reaction with bridging molecules such as carbodiimides, diisocyanates, glutaraldehyde and the like. Any enzymes known to one of skill in the art can be utilized. Examples of such enzymes include, but are not limited to, peroxidase, beta-D-galactosidase, urease, glucose oxidase plus peroxidase and alkaline phosphatase. U.S. Pat. Nos. 3,654,090, 3,850,752, and 4,016,043 are referred to by way of example for their disclosure of alternate labeling material and methods.
[0050] Quantification of RNA levels is typically performed in solution. As described herein such quantification of a plurality of RNAs is informative for identifying whether a sample is diagnostic of fibrosis, determining whether a sample exhibits progression of a fibrotic disease or condition, and, whether a sample is diagnostic of the severity of a fibrotic condition (i.e., are prognosis-informative for a particular patient subset).
[0051] Quantitative reverse transcriptase PCR (qRT-PCR) can also be used to determine the expression profiles of RNA genes (see, e.g., U.S. Patent Application Publication No. 2005/0048542A1). The first step in gene expression profiling by RT-PCR is the reverse transcription of the RNA template into cDNA, followed by its exponential amplification in a PCR reaction. The two most commonly used reverse transcriptases are avilo myeloblastosis virus reverse transcriptase (AMV-RT) and Moloney murine leukemia virus reverse transcriptase (MLU-RT). The reverse transcription step is typically primed using specific primers, random hexamers, or oligo-dT primers, depending on the circumstances and the goal of expression profiling. For example, extracted RNA can be reverse-transcribed using a GeneAmp RNA PCR kit (Perkin Elmer, Calif., USA), following the manufacturer's instructions. The derived cDNA can then be used as a template in the subsequent PCR reaction.
[0052] Although the PCR step can use a variety of thermostable DNA-dependent DNA polymerases, commonly employed polymerases include the Taq DNA polymerase, which has a 5'-3' nuclease activity but lacks a 3'-5' proofreading endonuclease activity. TaqMan® PCR typically utilizes the 5'-nuclease activity of Taq or Tth polymerase to hydrolyze a hybridization probe bound to its target amplicon, but any enzyme with similar or equivalent 5' nuclease activity can be used. Two oligonucleotide primers are used to generate an amplicon typical of a PCR reaction. A third oligonucleotide, or probe, is designed to detect nucleotide sequence located between the two PCR primers. The probe is non-extendible by Taq DNA polymerase enzyme, and is labeled with a reporter fluorescent dye and a quencher fluorescent dye. Any laser-induced emission from the reporter dye is quenched by the quenching dye when the two dyes are located close together as they are on the probe. During the amplification reaction, the Taq DNA polymerase enzyme cleaves the probe in a template-dependent manner. The resultant probe fragments disassociate in solution, and signal from the released reporter dye is free from the quenching effect of the second fluorophore. One molecule of reporter dye is liberated for each new molecule synthesized, and detection of the unquenched reporter dye provides the basis for quantitative interpretation of the data.
[0053] TaqMan® RT-PCR can be performed using commercially available equipment, such as, for example, ABI PRISM 7700®. Sequence Detection System® (Perkin-Elmer-Applied Biosystems, Foster City, Calif., USA), or Lightcycler (Roche Molecular Biochemicals, Mannheim, Germany). In one embodiment, the 5' nuclease procedure is run on a real-time quantitative PCR device such as the ABI PRISM 7700® Sequence Detection System®. The system consists of a thermocycler, laser, charge-coupled device (CCD), camera and computer. The system includes software for running the instrument and for analyzing the data.
[0054] In some embodiments, the quantitative RT-PCR assay data are presented as Ct values, also referred to as ΔCt thresholds. The ΔCt (cycle threshold) is defined as the number of cycles required for the fluorescent signal to cross a detectable threshold. The ΔCt is a measure of when the amount of RNA expressed exceeds background levels. Ct threshold levels are inversely proportional to the amount of target nucleic acid in the sample (i.e., the lower the Ct threshold the greater the amount of target nucleic acid in the sample). Fluorescence values are recorded during every cycle and represent the amount of product amplified to that point in the amplification reaction. The point when the fluorescent signal is first recorded as statistically significant is the threshold cycle (ΔCt).
[0055] To minimize errors and the effect of sample-to-sample variation, RT-PCR is often performed using an internal standard. The ideal internal standard is expressed at a constant level among different tissues, and is unaffected by the experimental treatment. RNAs most frequently used to normalize patterns of gene expression are mRNAs for the housekeeping genes glyceraldehyde-3-phosphate-dehydrogenase (GAPDH) and β-actin.
[0056] A more recent variation of the RT-PCR technique is the real time quantitative PCR, which measures PCR product accumulation through a dual-labeled fluorogenic probe (i.e., TaqMan® probe). Real time PCR is compatible both with quantitative competitive PCR, where internal competitor for each target sequence is used for normalization, and with quantitative comparative PCR using a normalization gene contained within the sample, or a housekeeping gene for RT-PCR. For further details see, e.g. Held et al., Genome Research 6:986-994 (1996).
[0057] Polynucleotide microarrays generally have probes bound to a solid surface. Microarrays can be used to simultaneously measure whether or not any of several RNAs are expressed. A standard Northern blot assay can be used to ascertain an RNA size, and the relative amounts of RNA in a sample, in accordance with conventional Northern hybridization techniques known to those persons of ordinary skill in the art. In Northern blots, RNA samples are first separated by size via electrophoresis in an agarose gel under denaturing conditions. The RNA is then transferred to a membrane, crosslinked and hybridized with a labeled probe. Nonisotopic or high specific activity radiolabeled probes can be used including random-primed, nick-translated, or PCR-generated DNA probes, in vitro transcribed RNA probes, and oligonucleotides. Additionally, sequences with only partial homology (e.g., a RNA from a different species or genomic DNA fragments that might contain an exon) may be used as probes. The labeled probe can be a labeled cDNA; a full-length, single stranded labeled RNA or DNA, or a labeled fragment of that RNA or DNA sequence.
[0058] Nuclease protection assays such as ribonuclease protection assays and S1 nuclease assays can be used to detect and quantify specific RNAs. In nuclease protection assays, an antisense probe (labeled with, e.g., radiolabeled or nonisotopic) hybridizes in solution to an RNA sample. Following hybridization, single-stranded, unhybridized probe and RNA are degraded by nucleases. An acrylamide gel is used to separate the remaining protected fragments. Typically, solution hybridization is more efficient than membrane-based hybridization, and it can accommodate up to 100 μg of sample RNA, compared with the 20-30 μg maximum of blot hybridizations.
[0059] A ribonuclease protection assay employs RNA probes. Oligonucleotides and other single-stranded DNA probes can only be used in assays containing S1 nuclease. The single-stranded, antisense probe must typically be completely homologous to target RNA to prevent cleavage of the probe:target hybrid by nuclease.
[0060] Serial Analysis Gene Expression (SAGE), which is described in e.g., Velculescu et al., 1995, Science 270:484-7; Carulli, et al., 1998, Journal of Cellular Biochemistry Supplements 30/31:286-96, can also be used to determine RNA abundances in a cell sample.
[0061] Transcript levels can be calculated by a standard curve method, and mRNA copy numbers can be normalized against 18S rRNA copy numbers, by dividing the number of mRNA copies by the number of 18S rRNA copies. For example, the number of mRNA copies in 1 μg of RNA can be divided by the number of 18S rRNA copies in 1 femtogram (fg) of RNA.
[0062] As described herein, the distribution of each mRNA, as well as the 18S rRNA, exhibited considerable positive skewness, which can be substantially reduced by use of a log transformation. For example, the number of mRNA copies normalized against rRNA can be converted to the log10 values. These log10 values can be used in the 4-gene model to predict the propensity of a subject to develop kidney fibrosis, to predict the severity of a kidney fibrosis disease, and/or to evaluate the progression of a kidney fibrosis disease.
[0063] The process for converting into vimentin, NKCC2 and E-cadherin mRNA quantities and the 18S rRNA quantity into a composite score for the diagnosis of fibrosis involves, dividing the 18S rRNA quantity by 105 (i.e., 100,000). The composite score can be calculated as follows.
Composite Score = 36.10283 + [ - 15.84215 * log 10 ( 18 s ) ] + 1.56907 * log 10 ( 18 s ) * log 10 ( 18 s ) + 5.11698 * max [ 0 , log 10 ( Vimentin ) - 5.6 ] + [ - 1.44145 * log 10 ( NKCC 2 ) ] + 3.31357 * min [ 3.1 , log 10 ( E - cadherin ) ] ##EQU00001## where , max [ 0 , log 10 ( Vimentin ) - 5.6 ] = 0 whenever log 10 ( Vimentin ) is ≦ 5.6 and = log 10 ( Vimentin ) - 5.6 whenever log 10 ( Vimentin ) is > 5.6 ; ##EQU00001.2## min [ 3.1 , log 10 ( E - cadherin ) ] = log 10 ( E - cadherin ) whenever log 10 ( E - cadherin ) < 3.1 and = 3.1 whenever log 10 ( E - cadherin ) ≧ 3.1 ; ##EQU00001.3## and * signifies multiplication . ##EQU00001.4##
The log10 variables are defined as follows:
[0064] log10(18s RNA) is log10 of 18S RNA/100,000 quantity in the test sample;
[0065] log10(Vimentin) is log10 of normalized vimentin mRNA quantity in the test sample;
[0066] log10(NKCC2)] is log10 of normalized NKCC2 mRNA quantity in the test sample; and
[0067] log10(E-cadherin) is log10 of normalized E-cadherin mRNA quantity in the test sample.
[0068] In calculating the composite score, the vimentin mRNA quantity, the NKCC2 mRNA quantity, and the E-cadherin mRNA quantity can be divided by the 18S RNA quantity multiplied by 100,000 before generating the log10(Vimentin), the log10(NKCC2), and the log10(E-cadherin) values, respectively. This generates normalized values of these mRNA quantities.
Normalized Vimentin mRNA quantity : measured vimentin mRNA quantity Measured 18 S rRNA quantity / 100 , 000 ##EQU00002## Normalized NKCC 2 mRNA quantity : measured NKCC 2 mRNA quantity Measured 18 S rRNA quantity / 100 , 000 ##EQU00002.2## Normalized E - cadherin mRNA quantity : measured E - cadherin mRNA quantity Measured 18 S rRNA quantity / 100 , 000 ##EQU00002.3##
[0069] The composite score varies from about 1 to 8, where a normal (healthy) composite score is about 3.5. A test sample with a composite score of 4.7 or more indicates that a subject has fibrosis. For example, a test sample with a composite score from about 4.7 to about 6.5 indicates a subject has mild to moderate fibrosis. A test sample with a composite score from about 6.5 or more indicates a subject has moderate to severe fibrosis.
[0070] Therefore, kidney fibrosis can be diagnosed using the methods described herein.
Kidney Fibrosis
[0071] Human kidney disease can evolve from various origins including kidney transplantation, glomerular nephritis, nephritis associated with systemic lupus, cancer, physical obstructions, toxins, metabolic disease and immunological diseases, all of which may culminate in kidney fibrosis. Different types of insults can therefore converge on a single genetic program resulting in two hallmarks of fibrosis: the proliferation of fibroblasts and overproduction by them of various protein components of connective tissue. In addition, thickening of the basal membrane in the glomeruli accompanies interstitial fibrosis and culminates in glomerulosclerosis.
[0072] The severity of kidney fibrosis disease can be described by the grade of disease. Fibrosis grade I is assigned when less than about 25% of the kidney cortical area is fibrotic (mild fibrosis). Fibrosis grade II is assigned when about 26-50% of the kidney cortical area is fibrotic (moderate fibrosis). Fibrosis grade III is assigned when greater than about 50% of the kidney cortical area is fibrotic (severe fibrosis). Those with substantially no evidence of fibrosis have a normal biopsy and exhibit substantially no fibrosis.
[0073] Fibrotic diseases are generally characterized by the excess deposition of a fibrous material within the extracellular matrix, which contributes to abnormal changes in tissue architecture and interferes with normal organ function. Tissues damaged by trauma respond by the initiation of a wound-healing program. Fibrosis, a type of disorder characterized by excessive scarring, occurs when the normal self-limiting process of wound healing response is disturbed, and causes excessive production and deposition of collagen. As a result, normal organ tissue is replaced with scar tissue, which eventually leads to the functional failure of the organ.
Treatment
[0074] When kidney fibrosis is detected in a test sample, the subject from which the sample was obtained can be treated. Such treatment can include administration of any therapeutic agent useful for treatment of kidney fibrosis. Such therapeutic agents can include agents that treat the underlying cause(s) of kidney fibrosis, that delay the progression of kidney fibrosis, or ameliorate the symptoms of kidney fibrosis. For example, therapeutic agents that can be employed include anti-inflammatory agents, anti-coagulants, antioxidants, blood pressure medications, angiotensin-converting enzyme inhibitors (ACEIs), angiotensin AT1 receptor blockers, connective tissue growth factor (CTGF) inhibitors, antifibrotic agents (e.g., pirfenidone or tranilast), and the like.
[0075] Treatment can also include kidney transplantation.
Kits
[0076] The methods described herein may be performed by utilizing pre-packaged diagnostic kits that include devices and reagents for performing any of the methods described herein.
[0077] For example, a kit can be made and/or used for detecting kidney fibrotic diseases or disorders in a subject, where the kit includes (i) reagents for conducting a method of the invention and (ii) instructions for its use. The kits may include a device for calculating a composite score. Such a device can be a calculator, computer or minicomputer with software for performing the calculation of composite score.
[0078] The kits may be conveniently used, e.g., in clinical settings, to monitor kidney function, to detect kidney dysfunction, and to screen, monitor and diagnose transplant recipients for transplant health or the development of transplant related disease.
[0079] A variety of reagents can be included in the kits. For example, the nucleic acids (e.g., primers and/or probes) for quantification RNA levels of vimentin, NKCC2, E-cadherin, and a housekeeping gene (e.g., 18S rRNA) can be provided in separate vials, compartments, or areas of a microarray. The kits can therefore include nucleic acid primers for amplifying and quantifying the RNA levels, as well as enzymes for performing the amplification. Enzymes can also be provided in separate vials, or compartments of a container. Such enzymes can include reverse transcriptases, thermally stable DNA polymerases and the like. The kits can also include nucleotides, stabilizing agents, RNase inhibitors, protease inhibitors, and buffers useful in the method of the invention as well as electrophoretic markers such as a 200 bp ladder. The kit will also include detailed instructions for carrying out the methods of the invention.
DEFINITIONS
[0080] As used herein, the term "fibrosis" refers to the formation or development of excess fibrous connective tissue in an organ or tissue as a reparative or reactive process, as opposed to a formation of fibrous tissue as a normal constituent of an organ or tissue.
[0081] A diagnostic biomarker is described by its sensitivity, specificity and its receiver operating characteristics (ROC) curve. ROC-analysis allows finding the best cut-off value to assign the test result to be `positive` or `negative`. For clinical decision-making, it is more important to know the positive (PPV; `true positives`) and negative predictive value (NPV; `true negatives`) than its sensitivity and specificity. This calculation then allows determination of how many `false positive` and `false negative` results the test produces. These numbers should be as low as possible, because they represent the patients that are wrongly assigned to have either a `positive` or a `negative` test. Besides the given and constant factors that affect sensitivity and the specificity of a diagnostic test, the prevalence of the target disease in the screened population largely influences the PPV, the NPV, the number of `false positives` and the number of `false negatives`. Therefore, these values should always be calculated based on the `true prevalence` of the disease in the screened population rather than from a selected population, which may over- or underestimate the `true prevalence` and consequently lead to wrongly calculated PPV and NPV (64).
[0082] A prognostic biomarker should preferably `predict` the outcome of a particular condition. Prediction requires the further criterion of showing that changes in the value have consequential changes in the outcome. Many prognostic biomarkers used to date only `correlate` with an outcome (e.g. C-reactive protein and risk of acute myocardial infarction), fewer `predict` (e.g. smoking and risk of lung cancer or acute myocardial infarction).
[0083] As used herein, "obtaining a test sample" involves removing a sample of tissue or fluid from a patient, receiving a sample of tissue or fluid from a patient, receiving a patient's tissue or fluid sample from a physician, receiving a patient's tissue or fluid sample via mail delivery and/or removing a patient's tissue or fluid sample from a storage apparatus (e.g., a refrigerator or freezer) or a facility. Thus, obtaining a test sample can involve removal or receipt of the test sample directly from the patient, but obtaining a test sample can also include receipt of a test sample indirectly from a medical worker, from a storage apparatus/facility, from a mail delivery service after transportation from a medical facility, and any combination thereof. The test sample can therefore originate in one location, and be transported to another location where it is received and tested. Any of these activities or combinations of activities involves "obtaining a test sample." The test sample can be body fluid or a tissue sample. For example, the test sample can be a urine sample or a kidney biopsy.
[0084] As used herein the phrase "determining whether a test dataset of expression levels within a test sample from the patient is significantly within a fibrosis dataset or within a non-fibrosis dataset" can involve actual measurement of test dataset expression levels, i.e., quantifying the expression levels of vimentin, NKCC2, E-cadherin, and/or 18S rRNA in a test sample from the patient and then assessing whether the those test dataset expression levels are significantly (e.g., statistically significantly) within a fibrosis dataset or within a non-fibrosis dataset. In some cases, the phrase "determining whether a test dataset of expression levels within a test sample from the patient is significantly within a fibrosis dataset or within a non-fibrosis dataset" involves obtaining measurements of test dataset expression levels by directing another person or entity to make those measurements, and then assessing whether the those test dataset expression levels are significantly (e.g., statistically significantly) within a fibrosis dataset or within a non-fibrosis dataset. In further embodiments, the phrase "determining whether a test dataset of expression levels within a test sample from the patient is significantly within a fibrosis dataset or within a non-fibrosis dataset" involves obtaining measurements of test dataset expression levels by directing another person or entity to make those measurements, and having that other person or entity assess whether the those test dataset expression levels are significantly (e.g., statistically significantly) within a fibrosis dataset or within a non-fibrosis dataset. The other (second) person or entity can then report to the person or entity that requested the determination and/or assessment. Thus, the determining step can be performed directly by one person or entity; or alternatively, the determining step can be performed indirectly by a second person or entity who is acting at the request of a first person or entity. The first person or entity can assess whether the test dataset expression levels are significantly (e.g., statistically significantly) within a fibrosis dataset or within a non-fibrosis dataset. Alternatively, the first person or entity can direct the second person or entity to assess whether the test dataset expression levels are significantly (e.g., statistically significantly) within a fibrosis dataset or within a non-fibrosis dataset.
[0085] As used herein, the term "acute rejection" (e.g., of a transplant) refers to a rejection of a transplanted organ developing after the first 5-60 post-transplant days. It is generally a manifestation of cell-mediated immune injury. It is believed that both delayed hypersensitivity and cytotoxicity mechanisms are involved. The immune injury is directed against HLA, and possibly other cell-specific antigens expressed by the tubular epithelium and vascular endothelium.
[0086] As used herein, the term "chronic rejection" (e.g., of a transplant) represents a consequence of combined immunological injury and non-immunological damage (e.g. from hypertensive nephrosclerosis, or nephrotoxicity of immuno-suppressants like cyclosporine A), occurring months or years after transplantation and ultimately leading to fibrosis and sclerosis of the allograft, associated with progressive loss of organ function.
[0087] Treatment" refers to both therapeutic treatment, and prophylactic or preventative measures. Those in need of treatment include those already with the disorder as well as those prone to have the disorder, or those in whom the disorder is to be prevented.
[0088] "Subject" for purposes of treatment refers to any animal classified as a mammal, including humans, domestic and farm animals, and zoo, sports, or pet animals, such as dogs, horses, cats, cows, etc. Preferably, the subject is human.
[0089] The present description is further illustrated by the following examples, which should not be construed as limiting in any way. The contents of all cited references (including literature references, issued patents, published patent applications as cited throughout this application) are hereby expressly incorporated by reference.
Example 1
Renal Allograft Histology and Urine Collection Study Cohort and Renal Allograft Histology
[0090] The for-cause biopsy group consisted of 48 subjects with graft dysfunction and biopsy-confirmed tubulointerstitial fibrosis (Fibrosis biopsy group, N=48) and the protocol biopsy group included 66 subjects with stable allograft function and normal allograft biopsy (Normal biopsy group, N=66).
[0091] The biopsy specimens were fixed in formalin, embedded in paraffin, and stained with hematoxylin and eosin, periodic acid--Schiff, and Masson's trichrome stains. Cryostat or paraffin sections of the for-cause biopsies were examined for C4d deposition with the use of anti-human C4d antibody. In addition to screening for the presence or absence of fibrosis and the grading of fibrosis, the allograft biopsies were also classified using the Banff 07 updated version of Banff 97 diagnostic categories and using the Banff schema 66 allograft biopsies were classified as Normal, and 48 biopsies with fibrosis were classified as IF/TA, no evidence of any specific etiology (N=30), chronic antibody-mediated rejection (N=6), chronic active T-cell mediated rejection (N=6), and the remaining 6 with fibrosis were also classified as having diabetic nephropathy (N=4) or recurrent glomerular disease (N=2).
[0092] The allograft fibrosis biopsies were also scored for concurrent inflammation as indicated by cellular infiltration within non-fibrotic areas of cortical interstitium. Among the 48 patients with allograft fibrosis, 32 biopsies from 32 patients showed no inflammation (inflammation score=0) and 16 biopsies from 16 patients displayed both fibrosis and inflammation. Inflammation was graded as 1 when 10-25% of cortical interstitium was involved (N=8 biopsies), 2 when 26-50% of cortical interstitium was involved N=2 biopsies) or 3 when greater than 50% cortical interstitium was involved, N=6 biopsies). All biopsies were classified by a pathologist blinded to the molecular study results.
[0093] Urine Collection.
[0094] One hundred and four of the 114 urine specimens for the mRNA profiling study were collected within 24 hours of the biopsy procedure, 8 within 7 days and the remaining 2 specimens within 15 days. These time lines refer to the time intervals between the biopsy procedure and urine specimen collection and not to the time interval between the time the urine was collected and when it was centrifuged to obtain the urine pellet prepared for RNA isolation.
[0095] Urine was centrifuged at 2,000 g for 30 minutes and the cell pellet was prepared within 4 hours of urine collection. RNAlater (50 μl) was then added to the urine pellet and stored at -80° C. prior to isolation of RNA. RNA was extracted from the pellet using the RNeasy mini kit (Qiagen) and reverse-transcribed to cDNA using TaqMan® Reverse Transcription Reagents (Applied Biosystems).
Example 2
Study Cohorts for the Discovery Set and Validation Set
[0096] Urine samples were examined from 114 kidney transplant recipients who had undergone either a diagnostic (for-cause) renal allograft biopsy or a scheduled (protocol) biopsy. The biopsies were examined for the presence or absence of tubulointerstitial fibrosis or inflammation, and classified according to the Banff schema (Solez et al., Am J Transplant 8: 753 (2008)) by a pathologist blinded to the mRNA results.
[0097] Prior to data analysis, the 114 urine samples were assigned, at a 2:1 ratio, to a Discovery set of 76 samples (32 samples from 32 recipients with renal allograft biopsies showing fibrosis and 44 samples from 44 recipients with normal biopsy results) and an independent Validation set of 38 samples (16 samples from 16 recipients with biopsies showing fibrosis and 22 samples from 22 recipients with normal biopsy results). FIG. 1A outlines the process employed. Neither the recipients' characteristics nor the transplant or renal allograft related variables differed between those assigned to the Discovery set or the Validation set (Table 1). The risk factors for fibrosis such as acute rejection and deceased donor grafts however were more frequent in the fibrosis biopsy group compared to the normal biopsy group.
TABLE-US-00012 TABLE 1 Characteristics of the Renal Allograft Recipients Discovery Set (N = 76) Validation Set (N = 38) Pa Fibrosis Normal Fibrosis Normal Discovery All Biopsy Biopsy Pa All Biopsy Biopsy Pa Set vs. Patients Group Group Fibrosis Patients Group Group Fibrosis Validation Parameter (N = 76) (N = 32) (N = 44) vs. Normal (N = 38) (N = 16) (N = 22) vs. Normal Set Recipient Characteristics Age (mean ± SD, 46 ± 46 ± 46 ± 0.88 44 ± 44 ± 44 ± 0.80 0.40 years) 13 14 12 10 9 12 Gender (Male/female) 37/39 17/15 20/24 0.50 21/17 8/8 13/9 0.57 0.50 Ethnicity 26/19/31 12/7/13 14/12/18 0.82 13/11/14 4/9/3 9/2/11 0.006 0.88 (White/Black/Other) Cause of End Stage 0.18 0.29 0.20 Renal Disease, N (%) Glomerulonephritis 18 (24) 10 (31) 8 (18) 7 (18) 4 (25) 3 (14) Diabetes 21 (28) 9 (28) 12 (27) 6 (16) 1 (6) 5 (23) Cystic/hereditary/ 11 (15) 4 (13) 7 (16) 10 (26) 4 (25) 6 (27) Congenital Secondary 4 (5) 1 (3) 3 (7) 4 (11) 3 (19) 1 (5) Glomerulonephritis Hypertension 6 (8) 1 (3) 5 (11) 6 (16) 3 (19) 3 (14) Interstitial nephritis 4 (5) 3 (9) 1 (2) 0 (0) 0 (0) 0 (0) Miscellaneous 2 (3) 2 (6) 0 (0) 1 (3) 1 (6) 0 (0) Conditions Neoplasm 0 (0) 0 (0) 0 (0) 1 (3) 0 (0) 1 (5) Etiology uncertain 10 (13) 2 (6) 8 (18) 3 (8) 0 (0) 3 (14) Peak pre-transplant 17.6 ± 18.8 ± 17.0 ± 0.77 26.4 ± 34.8 ± 20.3 ± 0.12 0.09 HLA class I or II 23.7 25.3 23.0 28.3 33.1 23.1 PRA (mean ± SD, %)b Peak pre-transplant 6 (9) 2 (9) 4 (9 0.95 6 (16) 4 (25) 2 (9) 0.18 0.29 HLA class I or II PRA ≧50%, n (%) Transplant variables Deceased donor, N (%) 26 (34) 19 (59) 7 (16) <0.0001 18 (47) 12 (75) 6 (27) 0.004 0.17 Donor age (mean ± 44 ± 48 ± 42 ± 0.03 45 ± 49 ± 42 ± 0.12 0.65 SD, years) 11 11 10 14 13 14 HLA mismatches 3.5 ± 3.8 ± 3.4 ± 0.41 3.3 ± 4.6 ± 2.4 ± <0.0001 0.57 (mean ± SD) 2.0 2.2 1.8 1.8 1.4 1.5 Cold ischemia time 20.8 ± 20.5 ± 21.3 ± 0.83 22.2 ± 22.9 ± 20.7 ± 0.39 0.51 (deceased donor 7.6 8.1 7.1 5.0 5.5 3.6 grafts only, mean ± SD, hours) Delayed graft functionc, N (%) Deceased donor grafts 8/26 (39) 6/19 (32) 2/7 (29) 0.88 6/18 (33) 5/12 (42) 1/6 (17) 0.28 0.85 History of acute 9 (12) 7 (22) 2 (5) 0.02 9 (24) 8 (50) 1 (5) 0.001 0.10 rejection before biopsy, N (%) History of BK 2 (3) 2 (6) 0 (0) 0.09 2 (5) 2 (13) 0 (0) 0.09 0.47 virus nephropathy before biopsy, N (%) Graft failure 13 (17) 13 (41) 0 (0) <0.0001 8 (21) 7 (44) 1 (5) 0.003 0.61 within 12 months after biopsy, N (%) Renal allograft variables Time of biopsy 25.4 ± 54.4 ± 4.3 ± <0.0001 14.1 ± 29.2 ± 3.0 ± 0.0002 0.21 (mean ± SD, 53.1 72.7 4.4 23.3 29.9 3.8 months since transplant) Serum creatinine 2.1 ± 3.2 ± 1.3 ± <0.0001 2.3 ± 3.3 ± 1.5 ± <0.0001 0.63 at biopsy (mean ± 1.5 1.9 0.4 1.5 1.8 0.4 SD, mg/dL) eGFR at biopsy 45.1 ± 26.2 ± 58.5 ± <0.0001 42.8 ± 29.1 ± 52.7 ± <0.0001 0.56 (mean ± SD, 20.6 13.2 13.1 19.5 19.0 12.9 mL/min/1.73 m2) Urinary 1.4 ± 3.6 ± 0.3 ± <0.0001 0.5 ± 1.2 ± 0.2 ± 0.004 0.11 protein:creatinine 2.9 4.3 0.3 0.9 1.4 0.1 ratiod at biopsy Discovery Set (N = 76) Validation Set (N = 38) Fibrosis Normal Fibrosis Normal All biopsy biopsy All biopsy biopsy patients group group patients group group Allograft fibrosis grade (n = 76) (n = 32) (n = 44) (n = 38) (n = 16) (n = 22) No fibrosis, N (%) 44 (58) 0 (0) 44 (100) 0 22 (58) 0 (0) 22 (100) Grade I (<25% of cortical area), N (%) 7 (9) 7 (22) (0) 0 2 (5) 2 (13) 0 (0) Grade II (26-50% of cortical area), N (%) 9 (12) 9 (28) (0) 0 (0) 7 (18) 7 (44) 0 (0) Grade III (>50% of cortical area), N (%) 16 (21) 16 (50) 7 (18) 7 (44) 0 (0) Mean ± SD fibrosis grade 1.0 ± 2.3 ± 0.0 ± 1.0 ± 2.3 ± 0.0 ± 1.2 0.8 0.0 1.2 0.7 0.0 Banff Classification categoriese Normal 39 (51) 0 (0) 39 (89) 19 (50) 0 (0) 19 (86) Chronic active antibody-mediated rejection 4 (5) 4 (13) 0 (0) 2 (5) 2 (13) 0 (0) Chronic active T-cell mediated rejection 3 (4) 3 (9) 0 (0) 3 (8) 3 (19) 0 (0) IF/TA, no evidence of any specific etiology 22 (29) 22 (69) 0 (0) 8 (21) 8 (50) 0 (0) Other 8 (11) 3 (9)f 5 (11)9 6 (16) 3 (19)f 3 (19)g aP-values determined by Chi-square or Fisher's exact tests for categorical variables or independent samples T-test for continuous variables. bPanel reactive antibodies (PRA) directed to the HLA class I or II antibodies were identified using the complement dependent cytotoxicity assay, and PRA value was available in 67 of 76 patients in the Discovery set (23 of 32 patients in the fibrosis biopsy group and 44 of 44 patients in the normal biopsy group) and 38 of 38 patients in the Validation set. cDefined by the need for hemodialysis in the first week post-transplantation dUrinary protein:creatinine ratio is the urinary protein concentration (mg/dL) divided by the urinary creatinine concentration (mg/dL) in a random urine specimen. eIn addition to screening the allograft biopsies for the presence or absence of tubulointerstial fibrosis and grading the extent of fibrosis, presence or absence of inflammation, the allograft biopsies were also classified using the Banff 07 updated version of the Banff 97 diagnostic categories (21). All 6 biopsies classified as chronic antibody mediated rejection were positive for C4d deposition; cryostat or paraffin sections of the for-cause biopsies were examined for C4d deposition with the use of anti-human C4d antibody. All other biopsies in the fibrosis group were negative for C4d deposition. f6 biopsies in the Other diagnosis category; 3 in the Discovery set and 3 in the Validation set include diabetic nephropathy (N = 4), and glomerulonephritis recurrence (N = 2). g8 biopsies in the Other diagnosis category; 5 in the Discovery set and 3 in the Validation set includes vascular changes but no interstitial fibrosis.
Example 3
Diagnostic Value of Individual mRNA Levels in the Discovery Set
[0098] This study employed the pre-amplification enhanced kinetic quantitative PCR assay for the absolute quantification of mRNAs in the urine of renal allograft recipients reported in (Muthukumar et al., N Engl J Med 353: 2342 (2005)). This method is in frequent use in the inventor's laboratory. This assay enables measurement of a large number of mRNAs using a very small quantity of cDNA.
[0099] Urine was centrifuged at 2000 g for 30 min within 4 hr of collection. RNA was extracted from the pellet using the RNeasy mini kit (Qiagen, Valencia, Calif.) and reverse transcribed to complementary DNA using TaqMan Reverse Transcription Reagents (Applied Biosystems). PCR analysis involved a preamplification step, followed by quantification of mRNA with an ABI Prism 7500 Fast detection system (Applied Biosystems). Transcript levels were calculated by a standard curve method (Anglicheau et al., Prov. Natl. Acad. Sci. USA 106: 5330 (2009)). The sequence and location of the gene specific oligonucleotide primers and TaqMan probes designed for quantifying the mRNAs in the PCR assays are listed in Table 2.
TABLE-US-00013 TABLE 2 Oligonucleotide primers and probes used in kinetic quantitative polymerase chain reaction assays for the quantification of mRNAs. SEQ Accession ID Gene number Sequence Location NO: Vimentin NM_003380.2 Sense: 5' TCAGAGAGAGGAAGCCGAAAAC 3' 706-727 12 Antisense: 5' CCAGAGACGCATTGTCAACATC 3' 770-749 13 Probe: 5' FAM CCCTGCAATCTTTCAGAC MGB 3' 729-746 14 HGF BC063485 Sense: 5' CAAATGTCAGCCCTGGAGTTC 3' 526-546 15 Antisense: 5' CTGTAGGTCTTTACCCCGATAGCT 3' 604-581 16 Probe: 5' FAM ATGATACCACACGAACACAGCTTTTTGCC TAMARA 3' 548-576 17 α-SMA NM_001613 Sense: 5' TGGGACGACATGGAAAAGATC 3' 288-308 18 Antisense: 5' CAGGGTGGGATGCTCTTCAG 3' 365-346 19 Probe: 5' FAM CCACTCTTTCTACAATGAGCTTCGTGTTGCC TAMRA 3' 314-344 20 Fibronectin XM_055254 Sense: 5' GAAAGTACACCTGTTGTCATTCAACA 3' 2582-2607 21 1 Antisense: 5' ACCTTCACGTCTGTCACTTCCA 3' 2688-2666 22 Probe: 5' FAM CCACTGGCACCCCACGCTCA TAMRA 3' 2613-2632 23 PAI1 NM_000602.1 Sense: 5' AATCAGACGGCAGCACTGTCT 3' 716-736 24 Antisense: 5' GGGCGTGGTGAACTCAGTATAGT 3' 792-770 25 Probe: 5' FAM TGTGCCCATGATGGC MGB 3' 738-752 26 Perforin M28393 Sense: 5' GGACCAGTACAGCTTCAGCACTG 3' 492-514 27 Antisense: 5' GCCCTCTTGAAGTCAGGGTG 3' 587-568 28 Probe: 5' FAM TGCCGCTTCTACAGTTTCCATGTGGTACAC TAMRA 3' 526-555 29 TGFI31 NM_000660 Sense: 5' GCGTGCTAATGGTGGAAACC 3' 1170-1189 30 Antisense: 5' CGGAGCTCTGATGTGTTGAAGA 3' 1263-1242 31 Probe: 5' FAM ACAACGAAATCTATGACAAGTTCAAGCAGAGTACACA TAMRA 3' 1191-1227 32 TIMP1 NM003254 Sense: 5' GACGGCCTTCTGCAATTCC 3' 288-306 33 Antisense: 5' GTATAAGGTGGTCTGGTTGACTTCTG 3' 366-341 34 Probe: 5' FAM AGGGCCAAGTTCGTGG MGB 3' 319-334 35 Granzyme B J04071 Sense: 5' GCGAATCTGACTTACGCCATTATT 3' 534-557 36 Antisense: 5' CAAGAGGGCCTCCAGAGTCC 3' 638-619 37 Probe: 5' FAM CCCACGCACAACTCAATGGTACTGTCG TAMRA 3' 559-585 38 FSP1 CR450345.1 Sense: 5' AGGAGCTGCTGACCCGG 3' 104-120 39 Antisense: 5' GCTTCATCTGTCCTTTTCCCC 3' 158-138 40 Probe: 5' FAM CTGCCCAGCTTCT MGB 3' 124-136 41 CD103 XM_008508 Sense: 5' CGTGCTCAGCTCCCTTCTG 3' 211-229 42 Antisense: 5' CCTGGTGTCCTCTTGGTTCTG 3' 297-277 43 Probe: 5' FAM ACCAAGACCCCAGCACCAACCATACCT TAMRA 3' 231-257 44 Collagen NM_000088.3 Sense: 5' CCAGAAGAACTGGTACATCAGCAA 3' 4050-4073 45 1A1 Antisense: 5' CGCCATACTCGAACTGGAATC 3' 4144-4124 46 Probe: 5' FAM ACAAGAGGCATGTCTGG MGB 3' 4085-4101 47 BMP7 NM_001719.1 Sense: 5' GCTTCGTCAACCTCGTGGAA 3' 526-545 48 Antisense: 5' CAAACCGGAACTCTCGATGGT 3' 597-577 49 Probe: 5' FAM ATGACAAGGAATTCTTCCACCCACGCTAC TAMRA 3' 547-575 50 CTLA4 BC074893 Sense: 5' CGCCATACTACCTGGGCATAG 3' 441-461 51 Antisense: 5 GATCCAGAGGAGGAAGTCAGAATC 3' 529-506 52 Probe: 5' FAM CAGATTTATGTAATTGATCCAGAACCGTGCCC TAMRA 3' 473-504 53 CTGF NM_001901 Sense: 5' TGTGTGACGAGCCCAAGGA 3' 639-657 54 Antisense: 5' TAGTTGGGTCTGGGCCAAAC 3' 725-706 55 Probe: 5' FAM CCTGCCCTCGCGGCTTACCG TAMRA 3' 674-693 56 FGF2 NM_002006.3 Sense: 5' CCGACGGCCGAGTTGAC 3' 601-617 57 Antisense: 5' TAACGGTTAGCACACACTCCTTTG 3' 712-689 58 Probe: 5' FAM ACCCTCACATCAAGCTACAACTTCAAGCAGAA TAMRA 3' 637-668 59 CD25 NM_000417 Sense: 5' GACTGCTCACGTTCATCATGGT 3' 185-206 60 Antisense: 5' AATGTGGCGTGTGGGATCTC 3' 266-247 61 Probe: 5' FAM AGAGCTCTGTGACGATGACCCGCC TAMRA 3' 222-245 62 FoxP3 NM_014009 Sense: 5' GAGAAGCTGAGTGCCATGCA 3' 939-958 63 Antisense: 5' GGAGCCCTTGTCGGATGAT 3' 1025-1007 64 Probe: 5' FAM TGCCATTTTCCCAGCCAGGTGG TAMRA 3' 962-983 65 USAG1 NM_015464 Sense: 5' TGGAGGCAGGCATTTCAGTAA 3' 364-366 66 Antisense: 5' TTCCCGGCAACCCACTT 3' 412-396 67 Probe: 5' FAM CCCGAGTGTTCCGATCCAGTCCAGT TAMRA 3' 392-368 68 NKCC2 BC040138.2 Sense: 5' TCACGAGCAACTCGCAAAGA 3' 588-607 69 Antisense: 5' TCCCATCACCGTTAGCAACTC 3' 658-638 70 Probe: 5' FAM TGTGGCAGTCACCCCAAGTTCAGC TAMRA 3' 609-632 71 ITGB6 NM_000888.3 Sense: 5' GGATTGAACTGCTTTGCCTGTT 3' 21-42 72 Antisense: 5' GGCACAGCCACCTTGTACGT 3' 69-88 73 Probe: 5' FAM TTTCTATTTCTAGGAAGGAATG MGB 3' 44-65 74 E-cadherin XM_007840 Sense: 5' TGAGTGTCCCCCGGTATCTTC 3' 2469-2489 75 Antisense: 5' CAGCCGCTTTCAGATTTTCAT 3' 2549-2529 76 Probe: 5' FAM CCTGCCAATCCCGATGAAATTGGAAAT TAMRA 3' 2495-2521 77 18S rRNA K03432 Sense: 5' GCCCGAAGCGTTTACTTTGA 3' 929-948 78 Antisense: 5' TCCATTATTCCTAGCTGCGGTATC 3' 1009-986 79 Probe: 5' FAM AAAGCAGGCCCGAGCCGCC TAMRA 3' 965-983 80
[0100] Pre-Amplification Enhanced Real-Time Quantitative PCR Assay.
[0101] Oligonucleotide primers and fluorogenic probes were designed for the measurement of levels of mRNAs (Table 2). encoding proteins implicated in fibrosis, extracellular matrix accumulation, and/or EMT (TGFβ1, integrin β6 [ITGB6], fibroblast growth factor-2 [FGF2], connective tissue growth factor [CTGF], PAI1, tissue inhibitor of metalloproteinases-1 [TIMP1], fibronectin 1, collagen 1A1, E-cadherin, BMP7 and HGF). Also measured were mRNAs for proteins expressed in renal tubular epithelial cells (NKCC2 found on the apical membrane of the thick ascending limb of loop of Henley, and uterine sensitization associated gene 1 [USAG1] expressed in distal collecting tubules), mesenchymal cells (vimentin, FSP1, α-smooth muscle actin [α-SMA]), and effector and/or regulatory T lymphocytes (perforin, granzyme B, CD25, CD103, FoxP3, CTLA4).
[0102] PCR analysis was performed by a two-step process, a preamplification step followed by measurement of mRNA with an ABI Prism 7500 Fast detection system. A pre-amplification protocol that allows quantification of these 22 mRNAs from small amounts of cDNA was developed. The pre-amplification reaction for each sample was set up in a 0.2 ml PCR tube with a final reaction volume of 10 μl containing 3.0 μl cDNA (from reverse transcription of 1 μg total RNA in 100 μl buffer), 1.0 μl 10× buffer, 1.0 μl MgCl2 (25 mM), 0.25 μl 4×dNTP (10 mM each), 0.25 μl Ampli-Taq gold (5 U/μl), 0.15 μl primer mix per gene (50 μM sense and 50 μM antisense primer) and water to final volume of 10 μl. Following vortexing, the PCR was set up using a Veriti thermal cycler (Applied Biosystems) and the 10-cycle PCR reaction profile consisted of an initial hold at 95° C. for 10 min, denaturing at 95° C. for 15 seconds and primer annealing and extension at 60° C. for 1 min. At the end of 10 cycles, 140 μl of TE buffer was added to the PCR reaction and 2.5 μl of diluted PCR amplicons were then used for quantification of mRNA using the real-time quantitative PCR assay.
[0103] Transcript levels (copy number/μg total RNA) were calculated by a standard curve method and all analyses of mRNA copy numbers statistically controlled for the copy number of the reference gene 18S ribosomal RNA (rRNA).
[0104] The LOESS (locally weighted scatterplot smoothing) method was employed in the discovery phase of the analysis to initially examine the bivariate relationship of each mRNA measure to diagnosis in the Discovery set comprised of 32 renal transplant recipients with biopsy-confirmed fibrosis and 44 recipients with normal allograft biopsy results, controlling for the quadratic relationship of 18S rRNA. Logistic regression analysis was then used to parsimoniously model each relationship as a piece-wise linear model.
[0105] Advantage of the LOESS Model.
[0106] LOESS (locally weighted scatterplot smoothing) is a powerful tool to elucidate the potentially non-linear relationship between two variables since it has the advantage of fitting segments of data without pre-specifying a specific, usually linear, global function. Importantly, a threshold effect at which the risk for an outcome increases can be ascertained.
[0107] Definition of Parsimonious Model.
[0108] A parsimonious model is a model that contains the fewest number of predictor variables for a given outcome, without compromising the model's prediction accuracy. In essence, it balances the trade-off between simplicity (simpler is better) and the incremental increase in prediction accuracy that is obtained by including more predictors in a model. The analyses of levels of 22 mRNAs measured in this study showed that the diagnostic accuracy of the 4-gene model (vimentin, 18S, NKCC2 and E-cadherin) is not significantly improved by inclusion of the levels of any or all of the remaining 18 mRNAs that were measured. Thus, the 4-gene model is the parsimonious model in this study.
[0109] FIG. 1B shows that up to 22 genes are differentially express in renal fibrosis tissues obtained by biopsy compared to normal renal biopsy tissues.
[0110] FIG. 2A illustrates that the levels of twelve of the twenty-two mRNAs measured from urinary cells are significantly associated with the diagnosis of fibrosis after using the Holm modified (Holm, Scandinavian Journal of Statistics 6: 65 (1979)) Bonferoni procedure to control the risk of a Type I error. The lack of association between the remaining 10 mRNAs and allograft diagnosis is shown in FIG. 2B.
[0111] Receiver-Operating-Characteristic (ROC) Curve Analysis.
[0112] Analysis involving ROC curve demonstrated that allograft fibrosis can be predicted accurately using urinary cell levels of mRNA for vimentin (area under the curve [AUC] and 95% confidence intervals=0.90, 0.82-0.97), HGF (0.91, 0.84-0.98), α-SMA (0.88, 0.80-0.95), fibronectin 1 (0.83, 0.73-0.93), perforin (0.83, 0.74-0.93), TGFβ1 (0.82, 0.72-0.92), TIMP1 (0.81, 0.71-0.90), granzyme B (0.82, 0.71-0.92), FSP1 (0.81, 0.71-0.91), PAI1, (0.79, 0.68-0.90), collagen 1A1 (0.77, 0.66-0.88) or CD103 (0.76, 0.65-0.87).
Example 4
Multigene Prediction Model of Fibrosis Diagnosis in the Discovery Set
[0113] It was determined useful to build a multigene prediction model of fibrosis around vimentin in view of biologic properties of vimentin and data from pre-clinical models that vimentin is over-expressed preceding and/or during fibrosis and the clinical observation that vimentin expression in the 3-month protocol biopsies of renal allografts is associated with fibrosis score at 12 months. Accordingly, a LOESS model was once again estimated and corresponding piece-wise linear model for the relationship of each mRNA measure to fibrosis, this time controlling for vimentin mRNA level and the quadratic relationship of 18S rRNA level. These analyses showed that after controlling for vimentin mRNA levels, the levels of other mRNAs (HGF, TGFβ1, fibronectin 1, PAIL FSP1, collagen 1A1, α-SMA, CD103, granzyme B or perforin) that were initially significantly associated with fibrosis were no longer significant (P>0.05), whereas the mRNAs for NKCC2 and E-cadherin became significantly associated with the diagnosis (FIG. 3). Based on these findings, a 4-gene diagnostic model that included vimentin, NKCC2, E-cadherin and 18S rRNA was developed. The parameter estimates for the model, provided in FIG. 3, include terms accounting for the relationships, including non-linear relationships, between the mRNAs and diagnosis.
[0114] The composite score based on this model was highly associated with the diagnosis of fibrosis (FIG. 4A). The ROC curve (FIG. 4B) shows, for various levels of this composite score, the fraction of true positive results (sensitivity) and false positive results (1-specificity) for distinguishing recipients with allograft fibrosis from recipients with normal biopsy results. The AUC was 0.95 (95% CI: 0.90 to 0.99, P<0.0001), and a significant improvement (P<0.05) over the AUC for vimentin and 18S only. Using the optimal cut-point of 4.5 (the cut-point yielding the highest combined sensitivity and specificity), the composite score predicted fibrosis with a specificity of 84.1% (95% CI: 73.3 to 94.9%) and a sensitivity of 93.8% (95% CI: 85.4.0 to 99.9%) (FIG. 4B).
Example 5
Independent Validation of the Diagnostic Signature
[0115] The final diagnostic equation predicting fibrosis in the Discovery set was then validated in an independent Validation set of 38 renal transplant recipients consisting of 16 patients with biopsy-proven fibrosis and 22 recipients with normal allograft biopsy results (Table 1). FIG. 4C shows the ROC curve of this equation based on urinary cell levels of vimentin, NKCC2 and E-cadherin mRNAs and 18S rRNA level for the diagnosis of fibrosis. This 4-gene classifier could diagnose fibrosis in the Validation set with high accuracy and the AUC for the diagnosis of fibrosis in the independent Validation set was 0.89 (95% CI: 0.78 to 0.99, P<0.0001) (FIG. 4C). At the composite score cut-point of 4.5 (the same cut-point used in the Discovery set), fibrosis was diagnosed in the Validation set with a specificity of 77.3% (95% CI: 59.8 to 94.8%) and a sensitivity of 87.5% (95% CI: 71.3 to 99.9%)
[0116] In this study the fit of the predictor model was also examined by dividing the Discovery and Validation sets into sextiles of the composite score and examining the predicted and observed number of transplant recipients with fibrosis, separately for each sets, for each sextile (FIG. 4D). Based on the Hosmer-Lemeshow test, the fit between the observed and the predicted number of subjects with fibrosis in each of the sextiles was excellent (P=0.69) in the Discovery set (left half of FIG. 4D). For the Validation set (right half of FIG. 4D), the P-value was 0.04, suggesting a good fit, given that this set was not involved in the estimation of the model.
[0117] Serum creatinine levels were higher in the fibrosis group compared to the normal biopsy group (P<0.0001, Table 1). The study assessed whether the composite score independently differentiates the fibrosis and stable patient groups after controlling for serum creatinine. This analysis showed that the composite score is statistically significant and a slightly stronger predictor of group status (Fibrosis vs. Normal) than serum creatinine (each P<0.0001, controlling for the other).
[0118] This study also explored whether graft dysfunction, independent of fibrosis, was associated with the composite score. The log mean composite score of the 4-gene signature was 4.58 (95% CI: 3.52 to 5.64) in the acute tubular necrosis (ATN) group with graft dysfunction (N=9 patients) and 6.49 (95% CI: 5.96 to 7.02) in the fibrosis group with graft dysfunction (N=48 patients) (P=0.01). In addition, the composite score for the ATN group was not significantly different from that of normal biopsy group (N=66) with normal graft function (P=0.12). Whether the time to biopsy was associated with the diagnostic signature (composite score) was also investigated. This analyses showed that there was no significant association between the diagnostic signature and time to biopsy; Pearson correlation coefficient r=0.17, P=0.24 in the fibrosis biopsy group (N=48) and r=0.23, P=0.07 in the normal biopsy group (N=66).
Example 6
Fibrosis Grades and the 4-Gene Composite Score
[0119] Whether this 4-gene composite score could strongly discriminate patients with differing degrees of fibrosis from patients with no evidence of fibrosis was also investigated. This analysis revealed that the log mean composite score derived from urinary cell vimentin, NKCC2 and E-cadherin mRNA levels and 18S rRNA level was significantly different among the four groups (fibrosis grades I [<25% of cortical area], II [26-50%], and III [>50%] and those with no evidence of fibrosis, P<0.0001, one-way ANOVA) (FIG. 5). Pair-wise comparisons revealed that the mean composite score of normal biopsies were significantly different from that of grade I fibrosis (P=0.0002), grade II fibrosis (P<0.0001) and grade III fibrosis (P<0.0001). The mean composite score however did not differ significantly among the three grades of fibrosis (P=0.58).
Example 7
Allograft Fibrosis with Concurrent Inflammation and the 4-Gene Composite Score
[0120] Among the 48 patients with allograft fibrosis, 32 biopsies from 32 patients showed no inflammation and 16 biopsies from 16 patients displayed both fibrosis and inflammation. The log mean composite score was 7.5±2.3 in the 16 urine samples from patients with both fibrosis and inflammation and 5.9±1.3 score in the 32 urine samples from patients with fibrosis only and without concurrent inflammation (P=0.003).
Example 8
Statistical Analysis
[0121] The 114 patients (48 recipients with allograft fibrosis and 66 recipients with normal biopsies) were rank ordered within group by the copy number of 18S rRNA and partitioned into consecutive triplets. Within each triplet, the first and third patients were assigned to the Discovery set and the second patient was assigned to the Validation set, resulting in the two sets being exactly matched on fibrosis status and very closely matched on 18S. Twice as many patients were assigned to the Discovery set in order to enhance statistical power for the exploratory analyses which included a procedure to protect against the risk of a Type I error.
[0122] The distribution of each mRNA, as well as 18S rRNA, exhibited considerable positive skewness, which was substantially reduced by use of a log transformation. LOESS methods were used to examine the relationship of the mRNA measures to diagnosis (Fibrosis vs. Normal). An initial LOESS model revealed a U-shaped relationship of 18S to diagnosis that was well represented by a quadratic function. Then a GAM (generalized additive model) (Hastie & Tibshirani, Statistical Science 1: 297 (1986); Hastie & Tibshirani, eds. GENERALIZED ADDITIVE MODELS, New York: Chapman & Hall (1990)) procedure was used to fit an additive LOESS model of the relationship of each individual mRNA measure with diagnosis while statistically controlling for the quadratic effect of 18S. The smoothing parameter for the LOESS model was determined using the generalized cross validation criterion, but restricted to DF<5). After reviewing the smoothed relationship, a piece-wise linear logistic regression spline model was fit that closely approximated the LOESS-smoothed relationship. Plots are presented where the parametric model of the relationship of mRNA level to the probability of being in the Fibrosis group is superimposed on the LOESS model. Also presented are the AUC and its 95% confidence interval for each logistic model. Significance levels of the 22 parametric models were adjusted for the experiment-wise risk of a Type I error using Holm's modified (27) Bonferroni method. Based on the results, one mRNA was chosen to be definitely included in the final model, and then repeated the above process for the remaining 21 mRNA measures to determine which if any could further improve the prediction of fibrosis diagnosis. This stepwise process was repeated until, after 3 steps, no further mRNA measures significantly improved the prediction model. The ROC curve for the final model and its AUC are presented.
[0123] In the Validation phase, the final prediction equation from the Discovery phase was used to calculate composite scores for those in the Validation set. A logistic regression analysis predicting fibrosis diagnosis from this single composite score was estimated to test the significance of the prediction equation. The ROC curve for the prediction equation and its AUC for the Validation set are presented. Finally, the Discovery and Validation sets were each divided into sextiles and an exact test version of the Hosmer-Lemeshow test (Hosmer & Lemeshow, APPLIED LOGISTIC REGRESSION, New York: John Wiley & Sons (1989) was used to assess the fit of the equation in both the Discovery and Validation sets.
[0124] All analyses were performed using SAS, version 9.2 (Cary, N.C.).
[0125] The process for converting into vimentin, NKCC2 and E-cadherin mRNA quantities and the 18S rRNA quantity into a composite score for the diagnosis of fibrosis involves, dividing the 18S rRNA quantity by 105 (i.e., 100,000). The composite score can be calculated as follows.
Composite Score = 36.10283 + [ - 15.84215 * log 10 ( 18 s ) ] + 1.56907 * log 10 ( 18 s ) * log 10 ( 18 s ) + 5.11698 * max [ 0 , log 10 ( Vimentin ) - 5.6 ] + [ - 1.44145 * log 10 ( NKCC 2 ) ] + 3.31357 * min [ 3.1 , log 10 ( E - cadherin ) ] ##EQU00003## where , max [ 0 , log 10 ( Vimentin ) - 5.6 ] = 0 whenever log 10 ( Vimentin ) is ≦ 5.6 and = log 10 ( Vimentin ) - 5.6 whenever log 10 ( Vimentin ) is > 5.6 ; ##EQU00003.2## min [ 3.1 , log 10 ( E - cadherin ) ] = log 10 ( E - cadherin ) whenever log 10 ( E - cadherin ) < 3.1 and = 3.1 whenever log 10 ( E - cadherin ) ≧ 3.1 ; ##EQU00003.3## and * signifies multiplication . ##EQU00003.4##
[0126] The log10 variables are defined as follows:
[0127] log10(18s RNA) is log10 of 18S RNA/100,000 quantity in the test sample;
[0128] log10(Vimentin) is log10 of normalized vimentin mRNA quantity in the test sample;
[0129] log10(NKCC2)] is log10 of normalized NKCC2 mRNA quantity in the test sample; and
[0130] log10(E-cadherin) is log10 of E-cadherin mRNA quantity in the test sample.
[0131] In calculating the composite score, the vimentin mRNA quantity, the NKCC2 mRNA quantity, and the E-cadherin mRNA quantity can be divided by the 18S RNA quantity multiplied by 100,000 before generating the log10(Vimentin), the log10(NKCC2), and the log10(E-cadherin) values, respectively. This generates normalized values of these mRNA quantities.
Vimentin mRNA quantity can e qual : measured vimentin mRNA quantity Measured 18 S rRNA quantity / 100 , 000 ##EQU00004## NKCC 2 mRNA quantity can e qual : measured NKCC 2 mRNA quantity Measured 18 S rRNA quantity / 100 , 000 ##EQU00004.2## E - cadherin mRNA quantity can e qual : measured E - cadherin mRNA quantity Measured 18 S rRNA quantity / 100 , 000 ##EQU00004.3##
[0132] The composite score varies from about 1 to 8, where a normal (healthy) composite score is about 3.5. A test sample with a composite score of above 4.7 indicates that the subject has fibrosis. For example, a test score from about 4.7 to about 6.5 indicates a subject has mild to moderate fibrosis. A test sample with a composite score from about 6.5 or more indicates a subject has moderate to severe fibrosis.
[0133] Therefore, kidney fibrosis can be diagnosed using the methods described herein.
REFERENCES
[0134] 1. Arias M, Seron D, Moreso F, Bestard O, Praga M. Renal allograft damage: existing challenges. Transplantation 2011; 91: 4.
[0135] 2. Yilmaz S, Isik I, Afrouzian M, et al. Evaluating the accuracy of functional biomarkers for detecting histological changes in chronic allograft nephropathy. Transpl Int 2007; 20: 608.
[0136] 3. Huraib S, Goldberg H, Katz A, et al. Percutaneous needle biopsy of the transplanted kidney: technique and complications. Am J Kidney Dis 1989; 14: 13.
[0137] 4. Beckingham I J, Nicholson M L, Bell P R. Analysis of factors associated with complications following renal transplant needle core biopsy. Br J Urol 1994; 73: 13.
[0138] 5. Benfield M R, Herrin J, Feld L, Rose S, Stablein D, Tejani A. Safety of kidney biopsy in pediatric transplantation: a report of the Controlled Clinical Trials in Pediatric Transplantation Trial of Induction Therapy Study Group. Transplantation 1999; 67: 544.
[0139] 6. Sorof J M, Vartanian R K, Olson J L, Tomlanovich S J, Vincenti F G, Amend W J C. Histopathological concordance of paired renal allograft biopsy cores: effect on the diagnosis and management of acute rejection. Transplantation 1995; 60: 1215.
[0140] 7. Colvin R B, Cohen A H, Saiontz C, et al. Evaluation of pathologic criteria for acute renal allograft rejection: reproducibility, sensitivity, and clinical correlation. J Am Soc Nephrol 1997; 8: 1930.
[0141] 8. Nicholson M L, Wheatley T J, Doughman T M, et al. A prospective randomized trial of three different sizes of core-cutting needle for renal transplant biopsy. Kidney Int 2000; 58: 390.
[0142] 9. Joh K, Morozumi K, Kitamura H. Symposium: evaluating the reproducibility of pathological diagnosis using the 1997 Banff classification update. Clin Transplant 2006; 20 Suppl 15: 53.
[0143] 10. Li B, Hartono C, Ding R, et al. Noninvasive diagnosis of renal-allograft rejection by measurement of messenger RNA for perforin and granzyme B in urine. N Engl J Med 2001; 344: 947.
[0144] 11. Muthukumar T, Dadhania D, Ding R, et al. Messenger RNA for FOXP3 in the urine of renal-allograft recipients. N Engl J Med 2005; 353: 2342.
[0145] 12. Anglicheau D, Suthanthiran M. Noninvasive prediction of organ graft rejection and outcome using gene expression patterns. Transplantation 2008; 86: 192.
[0146] 13. Maluf D G, Mas V R, Archer K J, et al. Molecular pathways involved in loss of kidney graft function with tubular atrophy and interstitial fibrosis. Mol Med 2008; 14: 276.
[0147] 14. Strutz F. Pathogenesis of tubulointerstitial fibrosis in chronic allograft dysfunction. Clin Transplant 2009; 23 Suppl 21: 26.
[0148] 15. Boor P, Ostendorf T, Floege J. Renal fibrosis: novel insights into mechanisms and therapeutic targets. Nat Rev Nephrol 2010; 6: 643.
[0149] 16. Zeisberg M, Neilson E G. Mechanisms of tubulointerstitial fibrosis. J Am Soc Nephrol 2010; 21: 1819.
[0150] 17. Park W, Griffin M, Grande J P, Cosio F, Stegall M D. Molecular evidence of injury and inflammation in normal and fibrotic renal allografts one year posttransplant. Transplantation 2007; 83: 1466.
[0151] 18. Scherer A, Gwinner W, Mengel M, et al. Transcriptome changes in renal allograft protocol biopsies at 3 months precede the onset of interstitial fibrosis/tubular atrophy (IF/TA) at 6 months. Nephrol Dial Transplant 2009; 24: 2567.
[0152] 19. Seron D, Moreso F. Protocol biopsies in renal transplantation: prognostic value of structural monitoring. Kidney Int 2007; 72: 690.
[0153] 20. Park W D, Griffin M D, Cornell L D, Cosio F G, Stegall M D. Fibrosis with inflammation at one year predicts transplant functional decline. J Am Soc Nephrol 2010; 21: 1987.
[0154] 21. Solez K, Colvin R B, Racusen L C, et al. Banff 07 classification of renal allograft pathology: updates and future directions. Am J Transplant 2008; 8: 753.
[0155] 22. Holm S. A simple sequentially rejective multiple test procedure. Scandinavian Journal of Statistics 1979; 6: 65.
[0156] 23. Ivaska J, Pallari H M, Nevo J, Eriksson J E. Novel functions of vimentin in cell adhesion, migration, and signaling. Exp Cell Res 2007; 313: 2050.
[0157] 24. Nakatsuji S, Yamate J, Sakuma S. Relationship between vimentin expressing renal tubules and interstitial fibrosis in chronic progressive nephropathy in aged rats. Virchows Arch 1998; 433: 359.
[0158] 25. Bielesz B, Sirin Y, Si H, et al. Epithelial Notch signaling regulates interstitial fibrosis development in the kidneys of mice and humans. J Clin Invest 2010; 120: 4040.
[0159] 26. Hertig A, Anglicheau D, Verine J, et al. Early epithelial phenotypic changes predict graft fibrosis. J Am Soc Nephrol 2008; 19: 1584.
[0160] 27. Zeisberg M, Soubasakos M A, Kalluri R. Animal models of renal fibrosis. Methods Mol Med 2005; 117: 261.
[0161] 28. Wynn TA. Cellular and molecular mechanisms of fibrosis. J Pathol 2008; 214:199.
[0162] 29. Sharma V K, Bologa R M, Xu G P, et al. Intragraft TGF-beta 1 mRNA: a correlate of interstitial fibrosis and chronic allograft nephropathy. Kidney Int 1996; 49: 1297.
[0163] 30. Hotchkiss H, Chu T T, Hancock W W, et al. Differential expression of profibrotic and growth factors in chronic allograft nephropathy. Transplantation 2006; 81: 342.
[0164] 31. Mas V, Maluf D, Archer K, et al. Establishing the molecular pathways involved in chronic allograft nephropathy for testing new noninvasive diagnostic markers. Transplantation 2007; 83: 448.
[0165] 32. Hinz B, Phan S H, Thannickal V J, Galli A, Bochaton-Piallat M L, Gabbiani G. The myofibroblast: one function, multiple origins. Am J Pathol 2007; 170: 1807.
[0166] 33. Kriz W, Kaissling B, Le Hir M. Epithelial-mesenchymal transition (EMT) in kidney fibrosis: fact or fantasy? J Clin Invest 2011; 121: 468.
[0167] 34. Koesters R, Kaissling B, Lehir M, et al. Tubular overexpression of transforming growth factor-betal induces autophagy and fibrosis but not mesenchymal transition of renal epithelial cells. Am J Pathol 2010; 177: 632.
[0168] 35. Yang J, Liu Y. Blockage of tubular epithelial to myofibroblast transition by hepatocyte growth factor prevents renal interstitial fibrosis. J Am Soc Nephrol 2002; 13: 96.
[0169] 36. Yang J, Dai C, Liu Y. Hepatocyte growth factor gene therapy and angiotensin II blockade synergistically attenuate renal interstitial fibrosis in mice. J Am Soc Nephrol 2002; 13: 2464.
[0170] 37. Yang J, Dai C, Liu Y. A novel mechanism by which hepatocyte growth factor blocks tubular epithelial to mesenchymal transition. J Am Soc Nephrol 2005; 16: 68.
[0171] 38. Liu Y, Tolbert E M, Lin L, et al. Up-regulation of hepatocyte growth factor receptor: an amplification and targeting mechanism for hepatocyte growth factor action in acute renal failure. Kidney Int 1999; 55: 442.
[0172] 39. Liu Y. Hepatocyte growth factor and the kidney. Curr Opin Nephrol Hypertens 2002; 11:23.
[0173] 40. Liu Y, Rajur K, Tolbert E, Dworkin L D. Endogenous hepatocyte growth factor ameliorates chronic renal injury by activating matrix degradation pathways. Kidney Int 2000; 58: 2028.
[0174] 41. Mizuno S, Matsumoto K, Kurosawa T, Mizuno-Horikawa Y, Nakamura T. Reciprocal balance of hepatocyte growth factor and transforming growth factor-beta 1 in renal fibrosis in mice. Kidney Int 2000; 57: 937.
[0175] 42. Mizuno S, Matsumoto K, Nakamura T. Hepatocyte growth factor suppresses interstitial fibrosis in a mouse model of obstructive nephropathy. Kidney Int 2001; 59: 1304.
[0176] 43. Lohr J W, Lee T P, Farooqui M, Mookerjee B K. Increased levels of serum hepatocyte growth factor in patients with end-stage renal disease. J Med 2000; 31: 131.
[0177] 44. Mizuno S, Matsumoto K, Nakamura T. HGF as a renotrophic and anti-fibrotic regulator in chronic renal disease. Front Biosci 2008; 13: 7072.
[0178] 45. Xu G P, Sharma V K, Li B, et al. Intragraft expression of IL-10 messenger RNA: A novel correlate of renal allograft rejection. Kidney Int 1995; 48: 1504.
[0179] 46. Suthanthiran M, Ding R, Sharma V, et al. Urinary Cell Messenger RNA Expression Signatures Anticipate Acute Cellular Rejection: A Report from CTOT-04. Am J Transplant 2011; 11 Suppl 2: 29.
[0180] 47. Anglicheau D, Sharma V K, Ding R, et al. MicroRNA expression profiles predictive of human renal allograft status. Proc Natl Acad Sci USA 2009; 106: 5330.
[0181] 48. Hastie T J, Tibshirani R J. Generalized additive models (with discussion). Statistical Science 1986; 1: 297.
[0182] 49. Hastie T J, Tibshirani R J, eds. Generalized Additive Models, New York: Chapman & Hall, 1990.
[0183] 50. Hosmer D W Jr, Lemeshow S. Applied Logistic Regression, New York: John Wiley & Sons, 1989
[0184] All patents and publications referenced or mentioned herein are indicative of the levels of skill of those skilled in the art to which the invention pertains, and each such referenced patent or publication is hereby specifically incorporated by reference to the same extent as if it had been incorporated by reference in its entirety individually or set forth herein in its entirety. Applicants reserve the right to physically incorporate into this specification any and all materials and information from any such cited patents or publications.
[0185] The specific methods, devices and compositions described herein are representative of preferred embodiments and are exemplary and not intended as limitations on the scope of the invention. Other objects, aspects, and embodiments will occur to those skilled in the art upon consideration of this specification, and are encompassed within the spirit of the invention as defined by the scope of the claims. It will be readily apparent to one skilled in the art that varying substitutions and modifications may be made to the invention disclosed herein without departing from the scope and spirit of the invention.
[0186] The invention illustratively described herein suitably may be practiced in the absence of any element or elements, or limitation or limitations, which is not specifically disclosed herein as essential. The methods and processes illustratively described herein suitably may be practiced in differing orders of steps, and the methods and processes are not necessarily restricted to the orders of steps indicated herein or in the claims.
[0187] As used herein and in the appended claims, the singular forms "a," "an," and "the" include plural reference unless the context clearly dictates otherwise. Thus, for example, a reference to "a reactor" or "a mixer" or "a feedstream" includes a plurality of such reactors, mixers or feedstreams (for example, a series of reactors, mixers or feedstreams), and so forth. In this document, the term "or" is used to refer to a nonexclusive or, such that "A or B" includes "A but not B," "B but not A," and "A and B," unless otherwise indicated.
[0188] Under no circumstances may the patent be interpreted to be limited to the specific examples or embodiments or methods specifically disclosed herein. Under no circumstances may the patent be interpreted to be limited by any statement made by any Examiner or any other official or employee of the Patent and Trademark Office unless such statement is specifically and without qualification or reservation expressly adopted in a responsive writing by Applicants.
[0189] The terms and expressions that have been employed are used as terms of description and not of limitation, and there is no intent in the use of such terms and expressions to exclude any equivalent of the features shown and described or portions thereof, but it is recognized that various modifications are possible within the scope of the invention as claimed. Thus, it will be understood that although the present invention has been specifically disclosed by preferred embodiments and optional features, modification and variation of the concepts herein disclosed may be resorted to by those skilled in the art, and that such modifications and variations are considered to be within the scope of this invention as defined by the appended claims and statements of the invention.
[0190] The invention has been described broadly and generically herein. Each of the narrower species and subgeneric groupings falling within the generic disclosure also form part of the invention. This includes the generic description of the invention with a proviso or negative limitation removing any subject matter from the genus, regardless of whether or not the excised material is specifically recited herein. In addition, where features or aspects of the invention are described in terms of Markush groups, those skilled in the art will recognize that the invention is also thereby described in terms of any individual member or subgroup of members of the Markush group.
[0191] The following statements describe some of the elements or features of the invention.
Statements:
[0192] 1. A method comprising:
[0193] (a) measuring quantities of vimentin mRNA, NKCC2 mRNA, and E-cadherin mRNA in a test sample of cells obtained from urine;
[0194] (b) determining whether the vimentin mRNA quantity is higher, the NKCC2 mRNA quantity is lower or the E-cadherin mRNA is higher than in healthy urinary cells; and thereby detecting that the sample is a fibrotic kidney sample.
[0195] 2. The method of statement 1, further comprising measuring a housekeeping gene RNA quantity.
[0196] 3. The method of statement 1 or 2, further comprising measuring a housekeeping gene mRNA quantity, and normalizing the vimentin mRNA quantity, the NKCC2 mRNA quantity, or the E-cadherin mRNA against the housekeeping gene mRNA quantity.
[0197] 4. The method of statement 1 or 2, further comprising measuring a housekeeping gene mRNA quantity, and dividing the vimentin mRNA quantity, the NKCC2 mRNA quantity, or the E-cadherin mRNA by the housekeeping gene mRNA quantity.
[0198] 5. The method of any of statements of 2-4, wherein the housekeeping gene is 18S rRNA, actin mRNA, histone mRNA, ribosomal protein mRNA, myosin mRNA, cytochrome c mRNA, β2-microglobulin mRNA, or major histocompatibility complex mRNA.
[0199] 6. The method of any of statements of 2-5, wherein the housekeeping gene is 18S rRNA.
[0200] 7. The method of any of statements 1-6, wherein the vimentin mRNA quantity is divided by the quantity of 18S rRNA/100,000 in the sample to generate a normalized vimentin mRNA value.
[0201] 8. The method of any of statements 1-7, wherein the vimentin mRNA quantity is divided by the quantity of 18S rRNA/100,000 in the sample to generate a normalized vimentin mRNA value, which is converted into a log10 normalized vimentin mRNA value.
[0202] 9. The method of any of statements 1-8, wherein detecting that the sample is a fibrotic kidney sample comprises determining that the log10 normalized vimentin mRNA value is at least 5.2, or at least 5.3, or at least 5.4, or at least 5.5, or at least 5.6 (as illustrated in FIG. 3A).
[0203] 10. The method of any of statements 1-9, wherein the NKCC2 mRNA quantity is divided by the quantity of 18S rRNA/100,000 in the sample to generate a normalized NKCC2 mRNA value.
[0204] 11. The method of any of statements 1-10, wherein the NKCC2 mRNA quantity is divided by the quantity of 18S rRNA/100,000 in the sample to generate a normalized NKCC2 mRNA value, which is converted into a log10 normalized NKCC2 mRNA value.
[0205] 12. The method of any of statements 1-11, wherein detecting that the sample is a fibrotic kidney sample comprises determining that the log10 normalized NKCC2 mRNA value is 2.5 or less, or 2.4 or less, or 2.3 or less, or 2.2 or less, or 2.1 or less, or 2.0 or less (as illustrated in FIG. 3B).
[0206] 13. The method of any of statements 1-12, wherein the E-cadherin mRNA quantity is divided by the quantity of 18S rRNA/100,000 in the sample to generate a normalized E-cadherin mRNA value.
[0207] 14. The method of any of statements 1-13, wherein the E-cadherin mRNA quantity is divided by the quantity of 18S rRNA/100,000 in the sample to generate a normalized E-cadherin mRNA value, which is converted into a log10 normalized E-cadherin mRNA value.
[0208] 15. The method of any of statements 1-14, wherein detecting that the sample is a fibrotic kidney sample comprises determining that the log10 normalized E-cadherin mRNA value is at least 2.7, or at least 2.8, or at least 2.9, or at least 3.0, or at least 3.1 (as illustrated in FIG. 3C).
[0209] 16. The method of any of statements 1-15, wherein measuring quantities of vimentin mRNA, NKCC2 mRNA, and E-cadherin mRNA comprises reverse transcription, polymerase chain reaction preamplification, real-time quantitative polymerase chain reaction, microarray analysis, Northern blotting, nuclease protection assays, RNA fingerprinting, ligase chain reaction, Qbeta replicase, isothermal amplification method, strand displacement amplification, transcription based amplification systems, quantitative nucleic acid amplification, combined reverse transcription/nucleic acid amplification, nuclease protection, Serial Analysis Gene Expression (SAGE), next generation sequencing, gene expression microarray, and combinations thereof.
[0210] 17. The method of any of statements 1-16, wherein measuring quantities of vimentin mRNA, NKCC2 mRNA, and E-cadherin mRNA comprises reverse transcription, polymerase chain reaction preamplification, real-time quantitative polymerase chain reaction, or a combination thereof.
[0211] 18. The method of any of statements 1-17, wherein a nucleic acid measuring quantities of vimentin mRNA, NKCC2 mRNA, and E-cadherin mRNA comprises use of a probe or primer that can stringently hybridizes to a nucleic acid encoding an amino acid sequence selected from the group consisting of SEQ ID NO:2, 4, 6, 8, 10 or a combination thereof.
[0212] 19. The method of any of statements 1-18, wherein a nucleic acid measuring quantities of vimentin mRNA, NKCC2 mRNA, and E-cadherin mRNA comprises use of a probe or primer that can stringently hybridizes to a nucleic acid comprising any of SEQ ID NO:1, 3, 5, 7, 9, 12, 13, 14, 69, 70, 71, 75, 76, 77, or a combination thereof.
[0213] 20. The method of any of statements 1-19, wherein a nucleic acid measuring quantities of 18S rRNA comprises use of a probe or primer that can stringently hybridize to a nucleic acid comprising any of SEQ ID NO: 11, 78, 79, 81, or a combination thereof.
[0214] 21. The method of any of statements 1-20, wherein a nucleic acid measuring quantities of vimentin mRNA, NKCC2 mRNA, and E-cadherin mRNA comprises use of a probe or primer that has at least 90% or at least 95% sequence identity or sequence complementarity to any of SEQ ID NO:1, 3, 5, 7, 9, 12, 13, 14, 69, 70, 71, 75, 76, 77, or a combination thereof.
[0215] 22. The method of any of statements 1-21, wherein a nucleic acid measuring quantities of 18S rRNA comprises use of a probe or primer that has at least 90% or at least 95% sequence identity or sequence complementarity to any of SEQ ID NO: 11, 78, 79, 81, or a combination thereof.
[0216] 23. The method of any of statements 1-22, further comprising assigning a composite score calculated as follows:
[0216] Composite Score = 36.10283 + [ - 15.84215 * log 10 ( 18 s ) ] + 1.56907 * log 10 ( 18 s ) * log 10 ( 18 s ) + 5.11698 * max [ 0 , log 10 ( Vimentin ) - 5.6 ] + [ - 1.44145 * log 10 ( NKCC 2 ) ] + 3.31357 * min [ 3.1 , log 10 ( E - cadherin ) ] ##EQU00005## where , max [ 0 , log 10 ( Vimentin ) - 5.6 ] = 0 whenever log 10 ( Vimentin ) is ≦ 5.6 and = log 10 ( Vimentin ) - 5.6 whenever log 10 ( Vimentin ) is > 5.6 ; ##EQU00005.2## min [ 3.1 , log 10 ( E - cadherin ) ] = log 10 ( E - cadherin ) whenever log 10 ( E - cadherin ) < 3.1 and = 3.1 whenever log 10 ( E - cadherin ) ≧ 3.1 ; ##EQU00005.3## and * signifies multiplication . ##EQU00005.4##
[0217] 24. The method of statement 23, wherein:
[0218] log10(18s RNA) is log10 of 18S RNA quantity/100,000 in the test sample;
[0219] log10(Vimentin) is log10 of the normalized vimentin mRNA quantity in the test sample;
[0220] log10(NKCC2)] is log10 of the normalized NKCC2 mRNA quantity in the test sample; and
[0221] log10(E-cadherin) is log10 of the normalized E-cadherin mRNA quantity in the test sample.
[0222] 25. The method of statement 23 or 24, wherein the vimentin mRNA quantity, the NKCC2 mRNA quantity, and the E-cadherin mRNA quantity is divided by the 18S rRNA quantity divided by 100,000 (i.e., [18S rRNA]/100,000) before generating the log10(Vimentin), the log10(NKCC2), and the log10(E-cadherin) values, respectively.
[0223] 26. The method of any of statements 23-25, wherein the composite score varies from about 1 to 8, and a normal (healthy) composite score is about 3.5.
[0224] 27. The method of any of statements 23-26, wherein a test sample with a composite score of about 4.7 indicates a subject has fibrosis.
[0225] 28. The method of any of statements 23-27, wherein a test sample with a composite score of about 4.7 to about 6.5 indicates a subject has mild to moderate fibrosis; and/or a test sample with a composite score of about 6.5 or more indicates a subject has moderate to severe fibrosis.
[0226] 29. The method of any of statements 1-28, further comprising treating a subject from which the fibrotic kidney sample was obtained.
[0227] 30. The method of any of statements 1-29, further comprising treating a subject from which the fibrotic kidney sample was obtained by administering a therapeutic agent to the subject.
[0228] 31. The method of any of statements 1-30, further comprising treating a subject from which the fibrotic kidney sample was obtained by administering to the subject a therapeutic agent selected from an agent that treats the underlying cause(s) of kidney fibrosis, an agent that delays the progression of kidney fibrosis, an agent that ameliorates the symptoms of kidney fibrosis, or a combination thereof.
[0229] 32. The method of any of statements 1-31, further comprising replacing a kidney in a subject from which the fibrotic kidney sample was obtained.
[0230] 33. A method comprising:
[0231] (a) measuring quantities of vimentin RNA, NKCC2 RNA, E-cadherin RNA and 18S rRNA in a test sample of cells obtained from a subject's urine to generate a vimentin RNA quantity value [vimentin], a NKCC2 RNA quantity value [NKCC2], an E-cadherin RNA quantity value [E-cadherin], and an 18S rRNA quantity value [18S rRNA];
[0232] (b) identifying the subject as a patient who would benefit from treatment of kidney fibrosis when:
[0233] (i) the log10([vimentin]/[18S rRNA/105]) value is greater than about 5.0;
[0234] (ii) the log10([NKCC2]/[18S rRNA]/105) value is less than about 3.0; or
[0235] (iii) the log10([E-cadherin]/[18S rRNA/105]) value is greater than about 3.0.
[0236] 34. The method of statement 33, further comprising treating the patient who would benefit from treatment of kidney fibrosis.
[0237] 35. The method of statement 33 or 34, further comprising treating the patient who would benefit from treatment of kidney fibrosis by administering a therapeutic agent to the patient.
[0238] 36. The method of any of statements 33-35, further comprising treating the patient who would benefit from treatment of kidney fibrosis by administering to the patient a therapeutic agent selected from an agent that treats the underlying cause(s) of kidney fibrosis, an agent that delays the progression of kidney fibrosis, an agent that ameliorates the symptoms of kidney fibrosis, or a combination thereof.
[0239] 37. The method of any of statements 33-36, further comprising replacing a kidney in the patient who would benefit from treatment of kidney fibrosis.
[0240] 38. The method of any of statements 33-37, further comprising any of the methods of statements 1-32.
[0241] 39. A method comprising: treating kidney fibrosis in a subject when a sample of urinary cells from the subject has a vimentin mRNA quantity that is higher, a NKCC2 mRNA quantity that is lower, or an E-cadherin mRNA that is higher than in healthy urinary cells.
[0242] 40. A method comprising: treating kidney fibrosis in a subject when a sample of urinary cells from the subject has:
[0243] (i) a log10([vimentin]/[18S rRNA]) value is greater than about 5.0;
[0244] (ii) a log10([NKCC2]/[18S rRNA]) value is less than about 3.0;
[0245] (iii) a log10([E-cadherin]/[18S rRNA]) value is greater than about 3.0; or
[0246] (iv) a combination thereof.
[0247] 41. A method comprising: treating kidney fibrosis in a subject when a sample of urinary cells from the subject has:
[0248] (i) a log10([vimentin]/[18S rRNA/105]) value greater than about 5.0;
[0249] (ii) a log10([NKCC2]/[18S rRNA/105]) value less than about 3.0;
[0250] (iii) a log10([E-cadherin]/[18S rRNA/105]) value greater than about 3.0; or
[0251] (iv) a combination thereof.
[0252] 42. The method of any of statements 39-41, further comprising any of the methods of statements 1-32. The claims summarize features of the invention.
Sequence CWU
1
1
8011847DNAHomo sapiens 1gtccccgcgc cagagacgca gccgcgctcc caccacccac
acccaccgcg ccctcgttcg 60cctcttctcc gggagccagt ccgcgccacc gccgccgccc
aggccatcgc caccctccgc 120agccatgtcc accaggtccg tgtcctcgtc ctcctaccgc
aggatgttcg gcggcccggg 180caccgcgagc cggccgagct ccagccggag ctacgtgact
acgtccaccc gcacctacag 240cctgggcagc gcgctgcgcc ccagcaccag ccgcagcctc
tacgcctcgt ccccgggcgg 300cgtgtatgcc acgcgctcct ctgccgtgcg cctgcggagc
agcgtgcccg gggtgcggct 360cctgcaggac tcggtggact tctcgctggc cgacgccatc
aacaccgagt tcaagaacac 420ccgcaccaac gagaaggtgg agctgcagga gctgaatgac
cgcttcgcca actacatcga 480caaggtgcgc ttcctggagc agcagaataa gatcctgctg
gccgagctcg agcagctcaa 540gggccaaggc aagtcgcgcc tgggggacct ctacgaggag
gagatgcggg agctgcgccg 600gcaggtggac cagctaacca acgacaaagc ccgcgtcgag
gtggagcgcg acaacctggc 660cgaggacatc atgcgcctcc gggagaaatt gcaggaggag
atgcttcaga gagaggaagc 720cgaaaacacc ctgcaatctt tcagacagga tgttgacaat
gcgtctctgg cacgtcttga 780ccttgaacgc aaagtggaat ctttgcaaga agagattgcc
tttttgaaga aactccacga 840agaggaaatc caggagctgc aggctcagat tcaggaacag
catgtccaaa tcgatgtgga 900tgtttccaag cctgacctca cggctgccct gcgtgacgta
cgtcagcaat atgaaagtgt 960ggctgccaag aacctgcagg aggcagaaga atggtacaaa
tccaagtttg ctgacctctc 1020tgaggctgcc aaccggaaca atgacgccct gcgccaggca
aagcaggagt ccactgagta 1080ccggagacag gtgcagtccc tcacctgtga agtggatgcc
cttaaaggaa ccaatgagtc 1140cctggaacgc cagatgcgtg aaatggaaga gaactttgcc
gttgaagctg ctaactacca 1200agacactatt ggccgcctgc aggatgagat tcagaatatg
aaggaggaaa tggctcgtca 1260ccttcgtgaa taccaagacc tgctcaatgt taagatggcc
cttgacattg agattgccac 1320ctacaggaag ctgctggaag gcgaggagag caggatttct
ctgcctcttc caaacttttc 1380ctccctgaac ctgagggaaa ctaatctgga ttcactccct
ctggttgata cccactcaaa 1440aaggacactt ctgattaaga cggttgaaac tagagatgga
caggttatca acgaaacttc 1500tcagcatcac gatgaccttg aataaaaatt gcacacactc
agtgcagcaa tatattacca 1560gcaagaataa aaaagaaatc catatcttaa agaaacagct
ttcaagtgcc tttctgcagt 1620ttttcaggag cgcaagatag atttggaata ggaataagct
ctagttctta acaaccgaca 1680ctcctacaag atttagaaaa aagtttacaa cataatctag
tttacagaaa aatcttgtgc 1740tagaatactt tttaaaaggt attttgaata ccattaaaac
tgcttttttt tttccagcaa 1800gtatccaacc aacttggttc tgcttcaata aatctttgga
aaaactc 18472466PRTHomo sapiens 2Met Ser Thr Arg Ser Val
Ser Ser Ser Ser Tyr Arg Arg Met Phe Gly1 5
10 15Gly Pro Gly Thr Ala Ser Arg Pro Ser Ser Ser Arg
Ser Tyr Val Thr 20 25 30Thr
Ser Thr Arg Thr Tyr Ser Leu Gly Ser Ala Leu Arg Pro Ser Thr 35
40 45Ser Arg Ser Leu Tyr Ala Ser Ser Pro
Gly Gly Val Tyr Ala Thr Arg 50 55
60Ser Ser Ala Val Arg Leu Arg Ser Ser Val Pro Gly Val Arg Leu Leu65
70 75 80Gln Asp Ser Val Asp
Phe Ser Leu Ala Asp Ala Ile Asn Thr Glu Phe 85
90 95Lys Asn Thr Arg Thr Asn Glu Lys Val Glu Leu
Gln Glu Leu Asn Asp 100 105
110Arg Phe Ala Asn Tyr Ile Asp Lys Val Arg Phe Leu Glu Gln Gln Asn
115 120 125Lys Ile Leu Leu Ala Glu Leu
Glu Gln Leu Lys Gly Gln Gly Lys Ser 130 135
140Arg Leu Gly Asp Leu Tyr Glu Glu Glu Met Arg Glu Leu Arg Arg
Gln145 150 155 160Val Asp
Gln Leu Thr Asn Asp Lys Ala Arg Val Glu Val Glu Arg Asp
165 170 175Asn Leu Ala Glu Asp Ile Met
Arg Leu Arg Glu Lys Leu Gln Glu Glu 180 185
190Met Leu Gln Arg Glu Glu Ala Glu Asn Thr Leu Gln Ser Phe
Arg Gln 195 200 205Asp Val Asp Asn
Ala Ser Leu Ala Arg Leu Asp Leu Glu Arg Lys Val 210
215 220Glu Ser Leu Gln Glu Glu Ile Ala Phe Leu Lys Lys
Leu His Glu Glu225 230 235
240Glu Ile Gln Glu Leu Gln Ala Gln Ile Gln Glu Gln His Val Gln Ile
245 250 255Asp Val Asp Val Ser
Lys Pro Asp Leu Thr Ala Ala Leu Arg Asp Val 260
265 270Arg Gln Gln Tyr Glu Ser Val Ala Ala Lys Asn Leu
Gln Glu Ala Glu 275 280 285Glu Trp
Tyr Lys Ser Lys Phe Ala Asp Leu Ser Glu Ala Ala Asn Arg 290
295 300Asn Asn Asp Ala Leu Arg Gln Ala Lys Gln Glu
Ser Thr Glu Tyr Arg305 310 315
320Arg Gln Val Gln Ser Leu Thr Cys Glu Val Asp Ala Leu Lys Gly Thr
325 330 335Asn Glu Ser Leu
Glu Arg Gln Met Arg Glu Met Glu Glu Asn Phe Ala 340
345 350Val Glu Ala Ala Asn Tyr Gln Asp Thr Ile Gly
Arg Leu Gln Asp Glu 355 360 365Ile
Gln Asn Met Lys Glu Glu Met Ala Arg His Leu Arg Glu Tyr Gln 370
375 380Asp Leu Leu Asn Val Lys Met Ala Leu Asp
Ile Glu Ile Ala Thr Tyr385 390 395
400Arg Lys Leu Leu Glu Gly Glu Glu Ser Arg Ile Ser Leu Pro Leu
Pro 405 410 415Asn Phe Ser
Ser Leu Asn Leu Arg Glu Thr Asn Leu Asp Ser Leu Pro 420
425 430Leu Val Asp Thr His Ser Lys Arg Thr Leu
Leu Ile Lys Thr Val Glu 435 440
445Thr Arg Asp Gly Gln Val Ile Asn Glu Thr Ser Gln His His Asp Asp 450
455 460Leu Glu46532151DNAHomo sapiens
3gcctctccaa aggctgcaga agtttcttgc taacaaaaag tccgcacatt cgagcaaaga
60caggctttag cgagttatta aaaacttagg ggcgctcttg tcccccacag ggcccgaccg
120cacacagcaa ggcgatggcc cagctgtaag ttggtagcac tgagaactag cagcgcgcgc
180ggagcccgct gagacttgaa tcaatctggt ctaacggttt cccctaaacc gctaggagcc
240ctcaatcggc gggacagcag ggcgcgtcct ctgccactct cgctccgagg tccccgcgcc
300agagacgcag ccgcgctccc accacccaca cccaccgcgc cctcgttcgc ctcttctccg
360ggagccagtc cgcgccaccg ccgccgccca ggccatcgcc accctccgca gccatgtcca
420ccaggtccgt gtcctcgtcc tcctaccgca ggatgttcgg cggcccgggc accgcgagcc
480ggccgagctc cagccggagc tacgtgacta cgtccacccg cacctacagc ctgggcagcg
540cgctgcgccc cagcaccagc cgcagcctct acgcctcgtc cccgggcggc gtgtatgcca
600cgcgctcctc tgccgtgcgc ctgcggagca gcgtgcccgg ggtgcggctc ctgcaggact
660cggtggactt ctcgctggcc gacgccatca acaccgagtt caagaacacc cgcaccaacg
720agaaggtgga gctgcaggag ctgaatgacc gcttcgccaa ctacatcgac aaggtgcgct
780tcctggagca gcagaataag atcctgctgg ccgagctcga gcagctcaag ggccaaggca
840agtcgcgcct gggggacctc tacgaggagg agatgcggga gctgcgccgg caggtggacc
900agctaaccaa cgacaaagcc cgcgtcgagg tggagcgcga caacctggcc gaggacatca
960tgcgcctccg ggagaaattg caggaggaga tgcttcagag agaggaagcc gaaaacaccc
1020tgcaatcttt cagacaggat gttgacaatg cgtctctggc acgtcttgac cttgaacgca
1080aagtggaatc tttgcaagaa gagattgcct ttttgaagaa actccacgaa gaggaaatcc
1140aggagctgca ggctcagatt caggaacagc atgtccaaat cgatgtggat gtttccaagc
1200ctgacctcac ggctgccctg cgtgacgtac gtcagcaata tgaaagtgtg gctgccaaga
1260acctgcagga ggcagaagaa tggtacaaat ccaagtttgc tgacctctct gaggctgcca
1320accggaacaa tgacgccctg cgccaggcaa agcaggagtc cactgagtac cggagacagg
1380tgcagtccct cacctgtgaa gtggatgccc ttaaaggaac caatgagtcc ctggaacgcc
1440agatgcgtga aatggaagag aactttgccg ttgaagctgc taactaccaa gacactattg
1500gccgcctgca ggatgagatt cagaatatga aggaggaaat ggctcgtcac cttcgtgaat
1560accaagacct gctcaatgtt aagatggccc ttgacattga gattgccacc tacaggaagc
1620tgctggaagg cgaggagagc aggatttctc tgcctcttcc aaacttttcc tccctgaacc
1680tgagggaaac taatctggat tcactccctc tggttgatac ccactcaaaa aggacacttc
1740tgattaagac ggttgaaact agagatggac aggttatcaa cgaaacttct cagcatcacg
1800atgaccttga ataaaaattg cacacactca gtgcagcaat atattaccag caagaataaa
1860aaagaaatcc atatcttaaa gaaacagctt tcaagtgcct ttctgcagtt tttcaggagc
1920gcaagataga tttggaatag gaataagctc tagttcttaa caaccgacac tcctacaaga
1980tttagaaaaa agtttacaac ataatctagt ttacagaaaa atcttgtgct agaatacttt
2040ttaaaaggta ttttgaatac cattaaaact gctttttttt ttccagcaag tatccaacca
2100acttggttct gcttcaataa atctttggaa aaactcaaaa aaaaaaaaaa a
21514464PRTHomo sapiens 4Met Ser Thr Arg Ser Val Ser Ser Ser Ser Tyr Arg
Arg Met Phe Gly1 5 10
15Gly Pro Gly Thr Ala Ser Arg Pro Ser Ser Ser Arg Ser Tyr Val Thr
20 25 30Thr Ser Thr Arg Thr Tyr Ser
Leu Gly Ser Ala Leu Arg Pro Ser Thr 35 40
45Ser Arg Ser Leu Tyr Ala Ser Ser Pro Gly Gly Val Tyr Ala Thr
Arg 50 55 60Ser Ser Ala Val Arg Leu
Arg Ser Ser Val Pro Gly Val Arg Leu Leu65 70
75 80Gln Asp Ser Val Asp Phe Ser Leu Ala Asp Ala
Ile Asn Thr Glu Phe 85 90
95Lys Asn Thr Arg Thr Asn Glu Lys Val Glu Leu Gln Glu Leu Asn Asp
100 105 110Arg Phe Ala Asn Tyr Ile
Asp Lys Val Arg Phe Leu Glu Gln Gln Asn 115 120
125Lys Ile Leu Leu Ala Glu Leu Glu Gln Leu Lys Gly Gln Gly
Lys Ser 130 135 140Arg Leu Gly Asp Leu
Tyr Glu Glu Glu Met Arg Glu Leu Arg Arg Gln145 150
155 160Val Asp Gln Leu Thr Asn Asp Lys Ala Arg
Val Glu Val Glu Arg Asp 165 170
175Asn Leu Ala Glu Asp Ile Met Arg Leu Arg Glu Lys Leu Gln Glu Glu
180 185 190Met Leu Gln Arg Glu
Glu Ala Glu Asn Thr Leu Gln Ser Phe Arg Gln 195
200 205Asp Val Asp Asn Ala Ser Leu Ala Arg Leu Asp Leu
Glu Arg Lys Val 210 215 220Glu Ser Leu
Gln Glu Glu Ile Ala Phe Leu Lys Lys Leu His Glu Glu225
230 235 240Glu Ile Gln Glu Leu Gln Ala
Gln Ile Gln Glu Gln His Val Gln Ile 245
250 255Asp Val Asp Val Ser Lys Pro Asp Leu Thr Ala Ala
Leu Arg Asp Val 260 265 270Arg
Gln Gln Tyr Glu Ser Val Ala Ala Lys Asn Leu Gln Glu Ala Glu 275
280 285Glu Trp Tyr Lys Ser Lys Phe Ala Asp
Leu Ser Glu Ala Ala Asn Arg 290 295
300Asn Asn Asp Ala Leu Arg Gln Ala Lys Gln Glu Ser Thr Glu Tyr Arg305
310 315 320Arg Gln Val Gln
Ser Leu Thr Cys Glu Val Asp Ala Leu Lys Gly Thr 325
330 335Asn Glu Ser Leu Glu Arg Gln Met Arg Glu
Met Glu Glu Asn Phe Ala 340 345
350Val Glu Ala Ala Asn Tyr Gln Asp Thr Ile Gly Arg Leu Gln Asp Glu
355 360 365Ile Gln Asn Met Lys Glu Glu
Met Ala Arg His Leu Arg Glu Tyr Gln 370 375
380Asp Leu Leu Asn Val Lys Met Ala Leu Asp Ile Glu Ile Ala Thr
Tyr385 390 395 400Arg Lys
Leu Leu Glu Gly Glu Glu Ser Arg Ile Ser Leu Pro Leu Pro
405 410 415Asn Phe Ser Ser Leu Asn Leu
Arg Glu Thr Asn Leu Asp Ser Leu Pro 420 425
430Leu Val Asp Thr His Ser Lys Arg Leu Ile Lys Thr Val Glu
Thr Arg 435 440 445Asp Gly Gln Val
Ile Asn Glu Thr Ser Gln His His Asp Asp Leu Glu 450
455 46051795DNAHomo sapiens 5ctttgaagaa catcctgaag
attatatcgg agacaatata tcaagaatct atttattgaa 60tcatctagaa caaaagccag
gagctcccta atggaagcac attagtgttt attttgatga 120agaaatatat agatttttta
aaacaaccac aaagtagata gctcagtaaa aaatcaattt 180tggaagatgt cactgaacaa
ctcttccaat gtatttctgg attcagtgcc cagtaatacc 240aatcgctttc aagttagtgt
cataaatgag aaccatgaga gcagtgcagc tgcagatgac 300aatactgacc caccacatta
tgaagaaacc tcttttgggg atgaagctca gaaaagactc 360agaatcagct ttaggcctgg
gaatcaggag tgctatgaca atttcctcca aagtggagaa 420actgctaaaa cagatgccag
ttttcacgct tatgattctc acacaaacac atactatcta 480caaacttttg gccacaacac
catggatgcc gttcccaaga tagagtacta tcgtaacacc 540ggcagcatca gtgggcccaa
ggtcaaccga cccagcctgc ttgagattca cgagcaactc 600gcaaagaatg tggcagtcac
cccaagttca gctgacagag ttgctaacgg tgatgggata 660cctggagatg aacaagctga
aaataaggaa gatgatcaag ctggtgttgt gaagtttgga 720tgggtgaaag gtgtgctggt
aagatgcatg ctgaacatct ggggagtcat gctcttcatt 780cgcctctcct ggattgttgg
agaagctgga attggtcttg gagttctcat aattcttctt 840tccaccatgg taacttctat
tactgggttg tcaacttctg cgatagcaac taacgggttt 900gttcgtggag gtggggccta
ctatcttatt tccagaagtt tagggcccga gttcggtggg 960tcaataggcc tgatctttgc
ttttgctaat gcagtggctg ttgctatgta tgtggtggga 1020tttgctgaga ctgtagtaga
tcttcttaag gagagtgatt cgatgatggt ggatccaacc 1080aatgacatcc ggattatagg
ctccatcaca gtggtgattc ttctaggaat ttcagtagct 1140ggaatggaat gggaggcaaa
ggcccaagtc attcttctgg tcattcttct aattgctatt 1200gcaaacttct tcattggaac
tgtcattcca tccaacaatg agaaaaagtc cagaggtttc 1260tttaattacc aagcatcaat
atttgcagaa aactttgggc cacgcttcac aaagggtgaa 1320ggcttcttct ctgtctttgc
catttttttc ccagcagcta ctgggattct tgctggtgcc 1380aatatctcag gagatttgga
ggcactgagg aaacaaggag cttcacctct ccctcaagga 1440gctcagagtc gaaggaggag
acagacttcc cttatatgaa ttagaacaag caagagtaga 1500atcaagtgca aaggaaagag
gaagcagaaa ttgcctgtcc cctcaaaaag taaaggaaga 1560ctttcagaag aggggacact
caatccaggt tttgagggat gaacaggagt ttgccgacag 1620gacaaagaag agacggacat
ttgaaacaga aggaatggga tgtaagaagg caccaagaaa 1680gatgctgcta atgagaatta
ttttatgtgc agagtagtgt atgtaatcct tcattaatat 1740attaataaac atatttataa
ataaaaaaaa aaaaaaaaaa aaaaaaaaaa aaaaa 17956430PRTHomo sapiens
6Met Ser Leu Asn Asn Ser Ser Asn Val Phe Leu Asp Ser Val Pro Ser1
5 10 15Asn Thr Asn Arg Phe Gln
Val Ser Val Ile Asn Glu Asn His Glu Ser 20 25
30Ser Ala Ala Ala Asp Asp Asn Thr Asp Pro Pro His Tyr
Glu Glu Thr 35 40 45Ser Phe Gly
Asp Glu Ala Gln Lys Arg Leu Arg Ile Ser Phe Arg Pro 50
55 60Gly Asn Gln Glu Cys Tyr Asp Asn Phe Leu Gln Ser
Gly Glu Thr Ala65 70 75
80Lys Thr Asp Ala Ser Phe His Ala Tyr Asp Ser His Thr Asn Thr Tyr
85 90 95Tyr Leu Gln Thr Phe Gly
His Asn Thr Met Asp Ala Val Pro Lys Ile 100
105 110Glu Tyr Tyr Arg Asn Thr Gly Ser Ile Ser Gly Pro
Lys Val Asn Arg 115 120 125Pro Ser
Leu Leu Glu Ile His Glu Gln Leu Ala Lys Asn Val Ala Val 130
135 140Thr Pro Ser Ser Ala Asp Arg Val Ala Asn Gly
Asp Gly Ile Pro Gly145 150 155
160Asp Glu Gln Ala Glu Asn Lys Glu Asp Asp Gln Ala Gly Val Val Lys
165 170 175Phe Gly Trp Val
Lys Gly Val Leu Val Arg Cys Met Leu Asn Ile Trp 180
185 190Gly Val Met Leu Phe Ile Arg Leu Ser Trp Ile
Val Gly Glu Ala Gly 195 200 205Ile
Gly Leu Gly Val Leu Ile Ile Leu Leu Ser Thr Met Val Thr Ser 210
215 220Ile Thr Gly Leu Ser Thr Ser Ala Ile Ala
Thr Asn Gly Phe Val Arg225 230 235
240Gly Gly Gly Ala Tyr Tyr Leu Ile Ser Arg Ser Leu Gly Pro Glu
Phe 245 250 255Gly Gly Ser
Ile Gly Leu Ile Phe Ala Phe Ala Asn Ala Val Ala Val 260
265 270Ala Met Tyr Val Val Gly Phe Ala Glu Thr
Val Val Asp Leu Leu Lys 275 280
285Glu Ser Asp Ser Met Met Val Asp Pro Thr Asn Asp Ile Arg Ile Ile 290
295 300Gly Ser Ile Thr Val Val Ile Leu
Leu Gly Ile Ser Val Ala Gly Met305 310
315 320Glu Trp Glu Ala Lys Ala Gln Val Ile Leu Leu Val
Ile Leu Leu Ile 325 330
335Ala Ile Ala Asn Phe Phe Ile Gly Thr Val Ile Pro Ser Asn Asn Glu
340 345 350Lys Lys Ser Arg Gly Phe
Phe Asn Tyr Gln Ala Ser Ile Phe Ala Glu 355 360
365Asn Phe Gly Pro Arg Phe Thr Lys Gly Glu Gly Phe Phe Ser
Val Phe 370 375 380Ala Ile Phe Phe Pro
Ala Ala Thr Gly Ile Leu Ala Gly Ala Asn Ile385 390
395 400Ser Gly Asp Leu Glu Ala Leu Arg Lys Gln
Gly Ala Ser Pro Leu Pro 405 410
415Gln Gly Ala Gln Ser Arg Arg Arg Arg Gln Thr Ser Leu Ile
420 425 43072557DNAHomo sapiens
7agtgaatttt gaagattgca ccggtcgaca aaggacagcc tatttttccc tcgacacccg
60attcaaagtg ggcacagatg gtgtgattac agtcaaaagg cctctacggt ttcataaccc
120acagatccat ttcttggtct acgcctggga ctccacctac agaaagtttt ccaccaaagt
180cacgctgaat acagtggggc accaccaccg ccccccgccc catcaggcct ccgtttctgg
240aatccaagca gaattgctca catttcccaa ctcctctcct ggcctcagaa gacagaagag
300agactgggtt attcctccca tcagctgccc agaaaatgaa aaaggcccat ttcctaaaaa
360cctggttcag atcaaatcca acaaagacaa agaaggcaag gttttctaca gcatcactgg
420ccaaggagct gacacacccc ctgttggtgt ctttattatt gaaagagaaa caggatggct
480gaaggtgaca gagcctctgg atagagaacg cattgccaca tacactctct tctctcacgc
540tgtgtcatcc aacgggaatg cagttgagga tccaatggag attttgatca cggtaaccga
600tcagaatgac aacaagcccg aattcaccca ggaggtcttt aaggggtctg tcatggaagg
660tgctcttcca ggaacctctg tgatggaggt cacagccaca gacgcggacg atgatgtgaa
720cacctacaat gccgccatcg cttacaccat cctcagccaa gatcctgagc tccctgacaa
780aaatatgttc accattaaca ggaacacagg agtcatcagt gtggtcacca ctgggctgga
840ccgagagagt ttccctacgt ataccctggt ggttcaagct gctgaccttc aaggtgaggg
900gttaagcaca acagcaacag ctgtgatcac agtcactgac accaacgata atcctccgat
960cttcaatccc accacgtaca agggtcaggt gcctgagaac gaggctaacg tcgtaatcac
1020cacactgaaa gtgactgatg ctgatgcccc caatacccca gcgtgggagg ctgtatacac
1080catattgaat gatgatggtg gacaatttgt cgtcaccaca aatccagtga acaacgatgg
1140cattttgaaa acagcaaagg gcttggattt tgaggccaag cagcagtaca ttctacacgt
1200agcagtgacg aatgtggtac cttttgaggt ctctctcacc acctccacag ccaccgtcac
1260cgtggatgtg ctggatgtga atgaagcccc catctttgtg cctcctgaaa agagagtgga
1320agtgtccgag gactttggcg tgggccagga aatcacatcc tacactgccc aggagccaga
1380cacatttatg gaacagaaaa taacatatcg gatttggaga gacactgcca actggctgga
1440gattaatccg gacactggtg ccatttccac tcgggctgag ctggacaggg aggattttga
1500gcacgtgaag aacagcacgt acacagccct aatcatagct acagacaatg gttctccagt
1560tgctactgga acagggacac ttctgctgat cctgtctgat gtgaatgaca acgcccccat
1620accagaacct cgaactatat tcttctgtga gaggaatcca aagcctcagg tcataaacat
1680cattgatgca gaccttcctc ccaatacatc tcccttcaca gcagaactaa cacacggggc
1740gagtgccaac tggaccattc agtacaacga cccaacccaa gaatctatca ttttgaagcc
1800aaagatggcc ttagaggtgg gtgactacaa aatcaatctc aagctcatgg ataaccagaa
1860taaagaccaa gtgaccacct tagaggtcag cgtgtgtgac tgtgaagggg ccgctggcgt
1920ctgtaggaag gcacagcctg tcgaagcagg attgcaaatt cctgccattc tggggattct
1980tggaggaatt cttgctttgc taattctgat tctgctgctc ttgctgtttc ttcggaggag
2040agcggtggtc aaagagccct tactgccccc agaggatgac acccgggaca acgtttatta
2100ctatgatgaa gaaggaggcg gagaagagga ccaggacttt gacttgagcc agctgcacag
2160gggcctggac gctcggcctg aagtgactcg taacgacgtt gcaccaaccc tcatgagtgt
2220cccccggtat cttccccgcc ctgccaatcc cgatgaaatt ggaaatttta ttgatgaaaa
2280tctgaaagcg gctgatactg accccacagc cccgccttat gattctctgc tcgtgtttga
2340ctatgaagga agcggttccg aagctgctag tctgagctcc ctgaactcct cagagtcaga
2400caaagaccag gactatgact acttgaacga atggggcaat cgcttcaaga agctggctga
2460catgtacgga ggcggcgagg acgactaggg gactcgagag aggcgggccc cagacccatg
2520tgctgggaaa tgcagaaatc acgttgctgg tggtttt
25578637PRTHomo sapiens 8Met Glu Ile Leu Ile Thr Val Thr Asp Gln Asn Asp
Asn Lys Pro Glu1 5 10
15Phe Thr Gln Glu Val Phe Lys Gly Ser Val Met Glu Gly Ala Leu Pro
20 25 30Gly Thr Ser Val Met Glu Val
Thr Ala Thr Asp Ala Asp Asp Asp Val 35 40
45Asn Thr Tyr Asn Ala Ala Ile Ala Tyr Thr Ile Leu Ser Gln Asp
Pro 50 55 60Glu Leu Pro Asp Lys Asn
Met Phe Thr Ile Asn Arg Asn Thr Gly Val65 70
75 80Ile Ser Val Val Thr Thr Gly Leu Asp Arg Glu
Ser Phe Pro Thr Tyr 85 90
95Thr Leu Val Val Gln Ala Ala Asp Leu Gln Gly Glu Gly Leu Ser Thr
100 105 110Thr Ala Thr Ala Val Ile
Thr Val Thr Asp Thr Asn Asp Asn Pro Pro 115 120
125Ile Phe Asn Pro Thr Thr Tyr Lys Gly Gln Val Pro Glu Asn
Glu Ala 130 135 140Asn Val Val Ile Thr
Thr Leu Lys Val Thr Asp Ala Asp Ala Pro Asn145 150
155 160Thr Pro Ala Trp Glu Ala Val Tyr Thr Ile
Leu Asn Asp Asp Gly Gly 165 170
175Gln Phe Val Val Thr Thr Asn Pro Val Asn Asn Asp Gly Ile Leu Lys
180 185 190Thr Ala Lys Gly Leu
Asp Phe Glu Ala Lys Gln Gln Tyr Ile Leu His 195
200 205Val Ala Val Thr Asn Val Val Pro Phe Glu Val Ser
Leu Thr Thr Ser 210 215 220Thr Ala Thr
Val Thr Val Asp Val Leu Asp Val Asn Glu Ala Pro Ile225
230 235 240Phe Val Pro Pro Glu Lys Arg
Val Glu Val Ser Glu Asp Phe Gly Val 245
250 255Gly Gln Glu Ile Thr Ser Tyr Thr Ala Gln Glu Pro
Asp Thr Phe Met 260 265 270Glu
Gln Lys Ile Thr Tyr Arg Ile Trp Arg Asp Thr Ala Asn Trp Leu 275
280 285Glu Ile Asn Pro Asp Thr Gly Ala Ile
Ser Thr Arg Ala Glu Leu Asp 290 295
300Arg Glu Asp Phe Glu His Val Lys Asn Ser Thr Tyr Thr Ala Leu Ile305
310 315 320Ile Ala Thr Asp
Asn Gly Ser Pro Val Ala Thr Gly Thr Gly Thr Leu 325
330 335Leu Leu Ile Leu Ser Asp Val Asn Asp Asn
Ala Pro Ile Pro Glu Pro 340 345
350Arg Thr Ile Phe Phe Cys Glu Arg Asn Pro Lys Pro Gln Val Ile Asn
355 360 365Ile Ile Asp Ala Asp Leu Pro
Pro Asn Thr Ser Pro Phe Thr Ala Glu 370 375
380Leu Thr His Gly Ala Ser Ala Asn Trp Thr Ile Gln Tyr Asn Asp
Pro385 390 395 400Thr Gln
Glu Ser Ile Ile Leu Lys Pro Lys Met Ala Leu Glu Val Gly
405 410 415Asp Tyr Lys Ile Asn Leu Lys
Leu Met Asp Asn Gln Asn Lys Asp Gln 420 425
430Val Thr Thr Leu Glu Val Ser Val Cys Asp Cys Glu Gly Ala
Ala Gly 435 440 445Val Cys Arg Lys
Ala Gln Pro Val Glu Ala Gly Leu Gln Ile Pro Ala 450
455 460Ile Leu Gly Ile Leu Gly Gly Ile Leu Ala Leu Leu
Ile Leu Ile Leu465 470 475
480Leu Leu Leu Leu Phe Leu Arg Arg Arg Ala Val Val Lys Glu Pro Leu
485 490 495Leu Pro Pro Glu Asp
Asp Thr Arg Asp Asn Val Tyr Tyr Tyr Asp Glu 500
505 510Glu Gly Gly Gly Glu Glu Asp Gln Asp Phe Asp Leu
Ser Gln Leu His 515 520 525Arg Gly
Leu Asp Ala Arg Pro Glu Val Thr Arg Asn Asp Val Ala Pro 530
535 540Thr Leu Met Ser Val Pro Arg Tyr Leu Pro Arg
Pro Ala Asn Pro Asp545 550 555
560Glu Ile Gly Asn Phe Ile Asp Glu Asn Leu Lys Ala Ala Asp Thr Asp
565 570 575Pro Thr Ala Pro
Pro Tyr Asp Ser Leu Leu Val Phe Asp Tyr Glu Gly 580
585 590Ser Gly Ser Glu Ala Ala Ser Leu Ser Ser Leu
Asn Ser Ser Glu Ser 595 600 605Asp
Lys Asp Gln Asp Tyr Asp Tyr Leu Asn Glu Trp Gly Asn Arg Phe 610
615 620Lys Lys Leu Ala Asp Met Tyr Gly Gly Gly
Glu Asp Asp625 630 63594815DNAHomo
sapiens 9agtggcgtcg gaactgcaaa gcacctgtga gcttgcggaa gtcagttcag
actccagccc 60gctccagccc ggcccgaccc gaccgcaccc ggcgcctgcc ctcgctcggc
gtccccggcc 120agccatgggc ccttggagcc gcagcctctc ggcgctgctg ctgctgctgc
aggtctcctc 180ttggctctgc caggagccgg agccctgcca ccctggcttt gacgccgaga
gctacacgtt 240cacggtgccc cggcgccacc tggagagagg ccgcgtcctg ggcagagtga
attttgaaga 300ttgcaccggt cgacaaagga cagcctattt ttccctcgac acccgattca
aagtgggcac 360agatggtgtg attacagtca aaaggcctct acggtttcat aacccacaga
tccatttctt 420ggtctacgcc tgggactcca cctacagaaa gttttccacc aaagtcacgc
tgaatacagt 480ggggcaccac caccgccccc cgccccatca ggcctccgtt tctggaatcc
aagcagaatt 540gctcacattt cccaactcct ctcctggcct cagaagacag aagagagact
gggttattcc 600tcccatcagc tgcccagaaa atgaaaaagg cccatttcct aaaaacctgg
ttcagatcaa 660atccaacaaa gacaaagaag gcaaggtttt ctacagcatc actggccaag
gagctgacac 720accccctgtt ggtgtcttta ttattgaaag agaaacagga tggctgaagg
tgacagagcc 780tctggataga gaacgcattg ccacatacac tctcttctct cacgctgtgt
catccaacgg 840gaatgcagtt gaggatccaa tggagatttt gatcacggta accgatcaga
atgacaacaa 900gcccgaattc acccaggagg tctttaaggg gtctgtcatg gaaggtgctc
ttccaggaac 960ctctgtgatg gaggtcacag ccacagacgc ggacgatgat gtgaacacct
acaatgccgc 1020catcgcttac accatcctca gccaagatcc tgagctccct gacaaaaata
tgttcaccat 1080taacaggaac acaggagtca tcagtgtggt caccactggg ctggaccgag
agagtttccc 1140tacgtatacc ctggtggttc aagctgctga ccttcaaggt gaggggttaa
gcacaacagc 1200aacagctgtg atcacagtca ctgacaccaa cgataatcct ccgatcttca
atcccaccac 1260gtacaagggt caggtgcctg agaacgaggc taacgtcgta atcaccacac
tgaaagtgac 1320tgatgctgat gcccccaata ccccagcgtg ggaggctgta tacaccatat
tgaatgatga 1380tggtggacaa tttgtcgtca ccacaaatcc agtgaacaac gatggcattt
tgaaaacagc 1440aaagggcttg gattttgagg ccaagcagca gtacattcta cacgtagcag
tgacgaatgt 1500ggtacctttt gaggtctctc tcaccacctc cacagccacc gtcaccgtgg
atgtgctgga 1560tgtgaatgaa gcccccatct ttgtgcctcc tgaaaagaga gtggaagtgt
ccgaggactt 1620tggcgtgggc caggaaatca catcctacac tgcccaggag ccagacacat
ttatggaaca 1680gaaaataaca tatcggattt ggagagacac tgccaactgg ctggagatta
atccggacac 1740tggtgccatt tccactcggg ctgagctgga cagggaggat tttgagcacg
tgaagaacag 1800cacgtacaca gccctaatca tagctacaga caatggttct ccagttgcta
ctggaacagg 1860gacacttctg ctgatcctgt ctgatgtgaa tgacaacgcc cccataccag
aacctcgaac 1920tatattcttc tgtgagagga atccaaagcc tcaggtcata aacatcattg
atgcagacct 1980tcctcccaat acatctccct tcacagcaga actaacacac ggggcgagtg
ccaactggac 2040cattcagtac aacgacccaa cccaagaatc tatcattttg aagccaaaga
tggccttaga 2100ggtgggtgac tacaaaatca atctcaagct catggataac cagaataaag
accaagtgac 2160caccttagag gtcagcgtgt gtgactgtga aggggccgct ggcgtctgta
ggaaggcaca 2220gcctgtcgaa gcaggattgc aaattcctgc cattctgggg attcttggag
gaattcttgc 2280tttgctaatt ctgattctgc tgctcttgct gtttcttcgg aggagagcgg
tggtcaaaga 2340gcccttactg cccccagagg atgacacccg ggacaacgtt tattactatg
atgaagaagg 2400aggcggagaa gaggaccagg actttgactt gagccagctg cacaggggcc
tggacgctcg 2460gcctgaagtg actcgtaacg acgttgcacc aaccctcatg agtgtccccc
ggtatcttcc 2520ccgccctgcc aatcccgatg aaattggaaa ttttattgat gaaaatctga
aagcggctga 2580tactgacccc acagccccgc cttatgattc tctgctcgtg tttgactatg
aaggaagcgg 2640ttccgaagct gctagtctga gctccctgaa ctcctcagag tcagacaaag
accaggacta 2700tgactacttg aacgaatggg gcaatcgctt caagaagctg gctgacatgt
acggaggcgg 2760cgaggacgac taggggactc gagagaggcg ggccccagac ccatgtgctg
ggaaatgcag 2820aaatcacgtt gctggtggtt tttcagctcc cttcccttga gatgagtttc
tggggaaaaa 2880aaagagactg gttagtgatg cagttagtat agctttatac tctctccact
ttatagctct 2940aataagtttg tgttagaaaa gtttcgactt atttcttaaa gctttttttt
ttttcccatc 3000actctttaca tggtggtgat gtccaaaaga tacccaaatt ttaatattcc
agaagaacaa 3060ctttagcatc agaaggttca cccagcacct tgcagatttt cttaaggaat
tttgtctcac 3120ttttaaaaag aaggggagaa gtcagctact ctagttctgt tgttttgtgt
atataatttt 3180ttaaaaaaaa tttgtgtgct tctgctcatt actacactgg tgtgtccctc
tgcctttttt 3240ttttttttaa gacagggtct cattctatcg gccaggctgg agtgcagtgg
tgcaatcaca 3300gctcactgca gccttgtcct cccaggctca agctatcctt gcacctcagc
ctcccaagta 3360gctgggacca caggcatgca ccactacgca tgactaattt tttaaatatt
tgagacgggg 3420tctccctgtg ttacccaggc tggtctcaaa ctcctgggct caagtgatcc
tcccatcttg 3480gcctcccaga gtattgggat tacagacatg agccactgca cctgcccagc
tccccaactc 3540cctgccattt tttaagagac agtttcgctc catcgcccag gcctgggatg
cagtgatgtg 3600atcatagctc actgtaacct caaactctgg ggctcaagca gttctcccac
cagcctcctt 3660tttatttttt tgtacagatg gggtcttgct atgttgccca agctggtctt
aaactcctgg 3720cctcaagcaa tccttctgcc ttggcccccc aaagtgctgg gattgtgggc
atgagctgct 3780gtgcccagcc tccatgtttt aatatcaact ctcactcctg aattcagttg
ctttgcccaa 3840gataggagtt ctctgatgca gaaattattg ggctctttta gggtaagaag
tttgtgtctt 3900tgtctggcca catcttgact aggtattgtc tactctgaag acctttaatg
gcttccctct 3960ttcatctcct gagtatgtaa cttgcaatgg gcagctatcc agtgacttgt
tctgagtaag 4020tgtgttcatt aatgtttatt tagctctgaa gcaagagtga tatactccag
gacttagaat 4080agtgcctaaa gtgctgcagc caaagacaga gcggaactat gaaaagtggg
cttggagatg 4140gcaggagagc ttgtcattga gcctggcaat ttagcaaact gatgctgagg
atgattgagg 4200tgggtctacc tcatctctga aaattctgga aggaatggag gagtctcaac
atgtgtttct 4260gacacaagat ccgtggtttg tactcaaagc ccagaatccc caagtgcctg
cttttgatga 4320tgtctacaga aaatgctggc tgagctgaac acatttgccc aattccaggt
gtgcacagaa 4380aaccgagaat attcaaaatt ccaaattttt ttcttaggag caagaagaaa
atgtggccct 4440aaagggggtt agttgagggg tagggggtag tgaggatctt gatttggatc
tctttttatt 4500taaatgtgaa tttcaacttt tgacaatcaa agaaaagact tttgttgaaa
tagctttact 4560gtttctcaag tgttttggag aaaaaaatca accctgcaat cactttttgg
aattgtcttg 4620atttttcggc agttcaagct atatcgaata tagttctgtg tagagaatgt
cactgtagtt 4680ttgagtgtat acatgtgtgg gtgctgataa ttgtgtattt tctttggggg
tggaaaagga 4740aaacaattca agctgagaaa agtattctca aagatgcatt tttataaatt
ttattaaaca 4800attttgttaa accat
481510882PRTHomo sapiens 10Met Gly Pro Trp Ser Arg Ser Leu Ser
Ala Leu Leu Leu Leu Leu Gln1 5 10
15Val Ser Ser Trp Leu Cys Gln Glu Pro Glu Pro Cys His Pro Gly
Phe 20 25 30Asp Ala Glu Ser
Tyr Thr Phe Thr Val Pro Arg Arg His Leu Glu Arg 35
40 45Gly Arg Val Leu Gly Arg Val Asn Phe Glu Asp Cys
Thr Gly Arg Gln 50 55 60Arg Thr Ala
Tyr Phe Ser Leu Asp Thr Arg Phe Lys Val Gly Thr Asp65 70
75 80Gly Val Ile Thr Val Lys Arg Pro
Leu Arg Phe His Asn Pro Gln Ile 85 90
95His Phe Leu Val Tyr Ala Trp Asp Ser Thr Tyr Arg Lys Phe
Ser Thr 100 105 110Lys Val Thr
Leu Asn Thr Val Gly His His His Arg Pro Pro Pro His 115
120 125Gln Ala Ser Val Ser Gly Ile Gln Ala Glu Leu
Leu Thr Phe Pro Asn 130 135 140Ser Ser
Pro Gly Leu Arg Arg Gln Lys Arg Asp Trp Val Ile Pro Pro145
150 155 160Ile Ser Cys Pro Glu Asn Glu
Lys Gly Pro Phe Pro Lys Asn Leu Val 165
170 175Gln Ile Lys Ser Asn Lys Asp Lys Glu Gly Lys Val
Phe Tyr Ser Ile 180 185 190Thr
Gly Gln Gly Ala Asp Thr Pro Pro Val Gly Val Phe Ile Ile Glu 195
200 205Arg Glu Thr Gly Trp Leu Lys Val Thr
Glu Pro Leu Asp Arg Glu Arg 210 215
220Ile Ala Thr Tyr Thr Leu Phe Ser His Ala Val Ser Ser Asn Gly Asn225
230 235 240Ala Val Glu Asp
Pro Met Glu Ile Leu Ile Thr Val Thr Asp Gln Asn 245
250 255Asp Asn Lys Pro Glu Phe Thr Gln Glu Val
Phe Lys Gly Ser Val Met 260 265
270Glu Gly Ala Leu Pro Gly Thr Ser Val Met Glu Val Thr Ala Thr Asp
275 280 285Ala Asp Asp Asp Val Asn Thr
Tyr Asn Ala Ala Ile Ala Tyr Thr Ile 290 295
300Leu Ser Gln Asp Pro Glu Leu Pro Asp Lys Asn Met Phe Thr Ile
Asn305 310 315 320Arg Asn
Thr Gly Val Ile Ser Val Val Thr Thr Gly Leu Asp Arg Glu
325 330 335Ser Phe Pro Thr Tyr Thr Leu
Val Val Gln Ala Ala Asp Leu Gln Gly 340 345
350Glu Gly Leu Ser Thr Thr Ala Thr Ala Val Ile Thr Val Thr
Asp Thr 355 360 365Asn Asp Asn Pro
Pro Ile Phe Asn Pro Thr Thr Tyr Lys Gly Gln Val 370
375 380Pro Glu Asn Glu Ala Asn Val Val Ile Thr Thr Leu
Lys Val Thr Asp385 390 395
400Ala Asp Ala Pro Asn Thr Pro Ala Trp Glu Ala Val Tyr Thr Ile Leu
405 410 415Asn Asp Asp Gly Gly
Gln Phe Val Val Thr Thr Asn Pro Val Asn Asn 420
425 430Asp Gly Ile Leu Lys Thr Ala Lys Gly Leu Asp Phe
Glu Ala Lys Gln 435 440 445Gln Tyr
Ile Leu His Val Ala Val Thr Asn Val Val Pro Phe Glu Val 450
455 460Ser Leu Thr Thr Ser Thr Ala Thr Val Thr Val
Asp Val Leu Asp Val465 470 475
480Asn Glu Ala Pro Ile Phe Val Pro Pro Glu Lys Arg Val Glu Val Ser
485 490 495Glu Asp Phe Gly
Val Gly Gln Glu Ile Thr Ser Tyr Thr Ala Gln Glu 500
505 510Pro Asp Thr Phe Met Glu Gln Lys Ile Thr Tyr
Arg Ile Trp Arg Asp 515 520 525Thr
Ala Asn Trp Leu Glu Ile Asn Pro Asp Thr Gly Ala Ile Ser Thr 530
535 540Arg Ala Glu Leu Asp Arg Glu Asp Phe Glu
His Val Lys Asn Ser Thr545 550 555
560Tyr Thr Ala Leu Ile Ile Ala Thr Asp Asn Gly Ser Pro Val Ala
Thr 565 570 575Gly Thr Gly
Thr Leu Leu Leu Ile Leu Ser Asp Val Asn Asp Asn Ala 580
585 590Pro Ile Pro Glu Pro Arg Thr Ile Phe Phe
Cys Glu Arg Asn Pro Lys 595 600
605Pro Gln Val Ile Asn Ile Ile Asp Ala Asp Leu Pro Pro Asn Thr Ser 610
615 620Pro Phe Thr Ala Glu Leu Thr His
Gly Ala Ser Ala Asn Trp Thr Ile625 630
635 640Gln Tyr Asn Asp Pro Thr Gln Glu Ser Ile Ile Leu
Lys Pro Lys Met 645 650
655Ala Leu Glu Val Gly Asp Tyr Lys Ile Asn Leu Lys Leu Met Asp Asn
660 665 670Gln Asn Lys Asp Gln Val
Thr Thr Leu Glu Val Ser Val Cys Asp Cys 675 680
685Glu Gly Ala Ala Gly Val Cys Arg Lys Ala Gln Pro Val Glu
Ala Gly 690 695 700Leu Gln Ile Pro Ala
Ile Leu Gly Ile Leu Gly Gly Ile Leu Ala Leu705 710
715 720Leu Ile Leu Ile Leu Leu Leu Leu Leu Phe
Leu Arg Arg Arg Ala Val 725 730
735Val Lys Glu Pro Leu Leu Pro Pro Glu Asp Asp Thr Arg Asp Asn Val
740 745 750Tyr Tyr Tyr Asp Glu
Glu Gly Gly Gly Glu Glu Asp Gln Asp Phe Asp 755
760 765Leu Ser Gln Leu His Arg Gly Leu Asp Ala Arg Pro
Glu Val Thr Arg 770 775 780Asn Asp Val
Ala Pro Thr Leu Met Ser Val Pro Arg Tyr Leu Pro Arg785
790 795 800Pro Ala Asn Pro Asp Glu Ile
Gly Asn Phe Ile Asp Glu Asn Leu Lys 805
810 815Ala Ala Asp Thr Asp Pro Thr Ala Pro Pro Tyr Asp
Ser Leu Leu Val 820 825 830Phe
Asp Tyr Glu Gly Ser Gly Ser Glu Ala Ala Ser Leu Ser Ser Leu 835
840 845Asn Ser Ser Glu Ser Asp Lys Asp Gln
Asp Tyr Asp Tyr Leu Asn Glu 850 855
860Trp Gly Asn Arg Phe Lys Lys Leu Ala Asp Met Tyr Gly Gly Gly Glu865
870 875 880Asp
Asp112235DNAHomo sapiensmisc_feature(1)...(2235)n = A,T,C or G
11cgctgctcct cccgtcgccg tccgggcccg tccgtccgtc cgtccgtcgt cctcctcgct
60nnnncggggc gccgggcccg tcctcacngg cccccgnnnn ngtccnggcc cgtcggggcc
120tcgccgcgct ctaccttacc tacctggttg atcctgccag tagcatatgc ttgtctcaaa
180gattaagcca tgcatgtcta agtacgcacg gccggtacag tgaaactgcg aatggctcat
240taaatcagtt atggttcctt tggtcgctcg ctcctctcct acttggataa ctgtggtaat
300tctagagcta atacatgccg acgggcgctg acccccttcg cgggggggat gcgtgcattt
360atcagatcaa aaccaacccg gtcagcccct ctccggcccc ggccgggggg cgggcgccgg
420cggctttggt gactctagat aacctcgggc cgatcgcacg ccccccgtgg cggcgacgac
480ccattcgaac gtctgcccta tcaactttcg atggtagtcg ccgtgcctac catggtgacc
540acgggtgacg gggaatcagg gttcgattcc ggagagggag cctgagaaac ggctaccaca
600tccaaggaag gcagcaggcg cgcaaattac ccactcccga cccggggagg tagtgacgaa
660aaataacaat acaggactct ttcgaggccc tgtaattgga atgagtccac tttaaatcct
720ttaacgagga tccattggag ggcaagtctg gtgccagcag ccgcggtaat tccagctcca
780atagcgtata ttaaagttgc tgcagttaaa aagctcgtag ttggatcttg ggagcgggcg
840ggcggtccgc cgcgaggcga gccaccgccc gtccccgccc cttgcctctc ggcgccccct
900cgatgctctt agctgagtgt cccgcggggc ccgaagcgtt tactttgaaa aaattagagt
960gttcaaagca ggcccgagcc gcctggatac cgcagctagg aataatggaa taggaccgcg
1020gttctatttt gttggttttc ggaactgagg ccatgattaa gagggacggc cgggggcatt
1080cgtattgcgc cgctagaggt gaaattcctt ggaccggcgc aagacggacc agagcgaaag
1140catttgccaa gaatgttttc attaatcaag aacgaaagtc ggaggttcga agacgatcag
1200ataccgtcgt agttccgacc ataaacgatg ccgaccggcg atgcggcggc gttattccca
1260tgacccgccg ggcagcttcc gggaaaccaa agtctttggg ttccgggggg agtatggttg
1320caaagctgaa acttaaagga attgacggaa gggcaccacc aggagtggag cctgcggctt
1380aatttgactc aacacgggaa acctcacccg gcccggacac ggacaggatt gacagattga
1440tagctctttc tcgattccgt gggtggtggt gcatggccgt tcttagttgg tggagcgatt
1500tgtctggtta attccgataa cgaacgagac tctggcatgc taactagtta cgcgaccccc
1560gagcggtcgg cgtcccccaa cttcttagag ggacaagtgg cgttcagcca cccgagattg
1620agcaataaca ggtctgtgat gcccttagat gtccggggct gcacgcgcgc tacactgact
1680ggctcagcgt gtgcctaccc tacgccggca ggcgcgggta acccgttgaa ccccattcgt
1740gatggggatc ggggattgca attattcccc atgaacgagg aattcccagt aagtgcgggt
1800cataagcttg cgttgattaa gtccctgccc tttgtacaca ccgcccgtcg ctactaccga
1860ttggatggtt tagtgaggcc ctcggatcgg ccccgccggg gtcggcccac ggccctggcg
1920gagcgctgag aagacggtcg aacttgacta tctagaggaa gtaaaagtcg taacaaggtt
1980tccgtaggtg aacctgcgga aggatcatta acggagcccg gacggcggcc cgcggcggcg
2040ccgcgccgcg cttccctccg cacacccacc cccccaccgc gacggcgcgt gcgggcgggg
2100ccgtgcccgt tcgttcgctc gctcgttcgt tcgccgcccg gcccggccgc gagagccgag
2160aactcgggag ggagacgggg gagagagaga gagagagaga gagagagaga gagagagaga
2220gaaagaaggg cgtgt
22351222DNAHomo sapiens 12tcagagagag gaagccgaaa ac
221322DNAHomo sapiens 13ccagagacgc attgtcaaca tc
221418DNAHomo sapiens
14ccctgcaatc tttcagac
181521DNAHomo sapiens 15caaatgtcag ccctggagtt c
211624DNAHomo sapiens 16ctgtaggtct ttaccccgat agct
241729DNAHomo sapiens
17atgataccac acgaacacag ctttttgcc
291821DNAHomo sapiens 18tgggacgaca tggaaaagat c
211920DNAHomo sapiens 19cagggtggga tgctcttcag
202031DNAHomo sapiens
20ccactctttc tacaatgagc ttcgtgttgc c
312126DNAHomo sapiens 21gaaagtacac ctgttgtcat tcaaca
262222DNAHomo sapiens 22accttcacgt ctgtcacttc ca
222320DNAHomo sapiens
23ccactggcac cccacgctca
202421DNAHomo sapiens 24aatcagacgg cagcactgtc t
212523DNAHomo sapiens 25gggcgtggtg aactcagtat agt
232615DNAHomo sapiens
26tgtgcccatg atggc
152723DNAHomo sapiens 27ggaccagtac agcttcagca ctg
232820DNAHomo sapiens 28gccctcttga agtcagggtg
202930DNAHomo sapiens
29tgccgcttct acagtttcca tgtggtacac
303020DNAHomo sapiens 30gcgtgctaat ggtggaaacc
203122DNAHomo sapiens 31cggagctctg atgtgttgaa ga
223237DNAHomo sapiens
32acaacgaaat ctatgacaag ttcaagcaga gtacaca
373319DNAHomo sapiens 33gacggccttc tgcaattcc
193426DNAHomo sapiens 34gtataaggtg gtctggttga cttctg
263516DNAHomo sapiens
35agggccaagt tcgtgg
163624DNAHomo sapiens 36gcgaatctga cttacgccat tatt
243720DNAHomo sapiens 37caagagggcc tccagagtcc
203827DNAHomo sapiens
38cccacgcaca actcaatggt actgtcg
273917DNAHomo sapiens 39aggagctgct gacccgg
174021DNAHomo sapiens 40gcttcatctg tccttttccc c
214113DNAHomo sapiens
41ctgcccagct tct
134219DNAHomo sapiens 42cgtgctcagc tcccttctg
194321DNAHomo sapiens 43cctggtgtcc tcttggttct g
214427DNAHomo sapiens
44accaagaccc cagcaccaac catacct
274524DNAHomo sapiens 45ccagaagaac tggtacatca gcaa
244621DNAHomo sapiens 46cgccatactc gaactggaat c
214717DNAHomo sapiens
47acaagaggca tgtctgg
174820DNAHomo sapiens 48gcttcgtcaa cctcgtggaa
204921DNAHomo sapiens 49caaaccggaa ctctcgatgg t
215029DNAHomo sapiens
50atgacaagga attcttccac ccacgctac
295121DNAHomo sapiens 51cgccatacta cctgggcata g
215224DNAHomo sapiens 52gatccagagg aggaagtcag aatc
245332DNAHomo sapiens
53cagatttatg taattgatcc agaaccgtgc cc
325419DNAHomo sapiens 54tgtgtgacga gcccaagga
195520DNAHomo sapiens 55tagttgggtc tgggccaaac
205620DNAHomo sapiens
56cctgccctcg cggcttaccg
205717DNAHomo sapiens 57ccgacggccg agttgac
175824DNAHomo sapiens 58taacggttag cacacactcc tttg
245932DNAHomo sapiens
59accctcacat caagctacaa cttcaagcag aa
326022DNAHomo sapiens 60gactgctcac gttcatcatg gt
226120DNAHomo sapiens 61aatgtggcgt gtgggatctc
206224DNAHomo sapiens
62agagctctgt gacgatgacc cgcc
246320DNAHomo sapiens 63gagaagctga gtgccatgca
206419DNAHomo sapiens 64ggagcccttg tcggatgat
196522DNAHomo sapiens
65tgccattttc ccagccaggt gg
226621DNAHomo sapiens 66tggaggcagg catttcagta a
216717DNAHomo sapiens 67ttcccggcaa cccactt
176825DNAHomo sapiens
68cccgagtgtt ccgatccagt ccagt
256920DNAHomo sapiens 69tcacgagcaa ctcgcaaaga
207021DNAHomo sapiens 70tcccatcacc gttagcaact c
217124DNAHomo sapiens
71tgtggcagtc accccaagtt cagc
247222DNAHomo sapiens 72ggattgaact gctttgcctg tt
227320DNAHomo sapiens 73ggcacagcca ccttgtacgt
207422DNAHomo sapiens
74tttctatttc taggaaggaa tg
227521DNAHomo sapiens 75tgagtgtccc ccggtatctt c
217621DNAHomo sapiens 76cagccgcttt cagattttca t
217727DNAHomo sapiens
77cctgccaatc ccgatgaaat tggaaat
277820DNAHomo sapiens 78gcccgaagcg tttactttga
207924DNAHomo sapiens 79tccattattc ctagctgcgg tatc
248019DNAHomo sapiens
80aaagcaggcc cgagccgcc
19
User Contributions:
Comment about this patent or add new information about this topic:
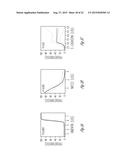 | 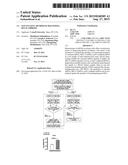 |
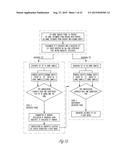 | 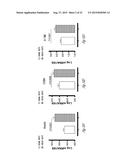 |
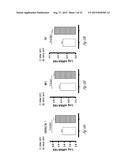 | 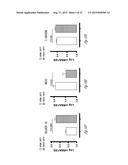 |
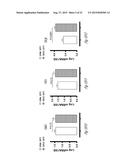 | 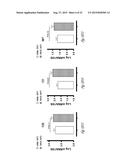 |
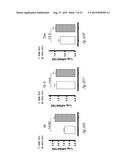 | 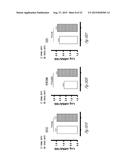 |
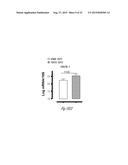 | 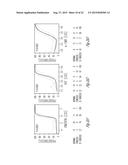 |
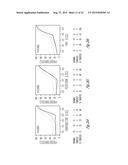 | 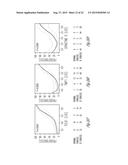 |
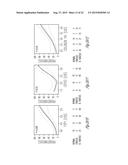 | 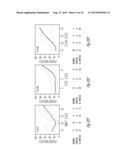 |
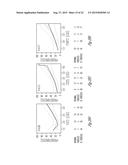 | 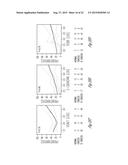 |
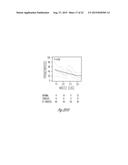 | 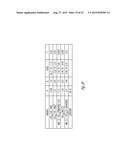 |
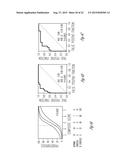 | 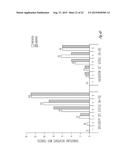 |
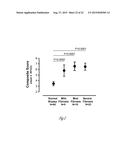 |  |
 |  |
 |  |
 |  |
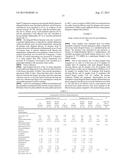 | 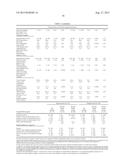 |
 |  |
 |  |
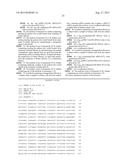 |  |
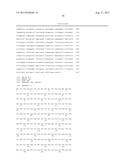 | 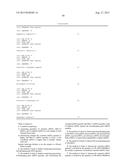 |
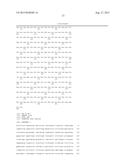 | 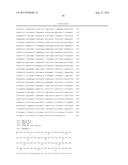 |
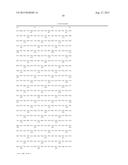 | 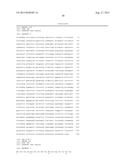 |
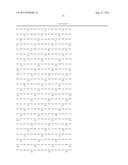 |  |
 |  |
 |  |
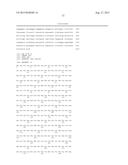 | 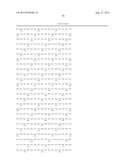 |
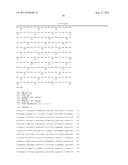 |  |
 |  |
 |  |
 |
| New patent applications in this class: | |
| Date | Title |
|---|---|
| 2022-09-08 | Shrub rose plant named 'vlr003' |
| 2022-08-25 | Cherry tree named 'v84031' |
| 2022-08-25 | Miniature rose plant named 'poulty026' |
| 2022-08-25 | Information processing system and information processing method |
| 2022-08-25 | Data reassembly method and apparatus |
| New patent applications from these inventors: | |
| Date | Title |
|---|---|
| 2015-07-09 | Urine mrna profile and acute dysfunction of kidney allograft |
| 2015-03-26 | Methods of predicting acute rejection outcomes |
| 2014-07-31 | Methods to detect, treat and prevent acute cellular rejection in kidney allografts |