Patent application title: EPIGENETIC PORTRAITS OF HUMAN BREAST CANCERS
Inventors:
François Fuks (Bruxelles, BE)
François Fuks (Bruxelles, BE)
Sarah Dedeurwaerder (Vendeuil, FR)
Christos Sotiriou (Bruxelles, BE)
Christine Desmedt (Meise, BE)
Assignees:
UNIVERSITE LIBRE DE BRUXELLES
UNIVERSITÉ LIBRE DE BRUXELLES
IPC8 Class: AC12Q168FI
USPC Class:
514249
Class name: Hetero ring is six-membered consisting of two nitrogens and four carbon atoms (e.g., pyridazines, etc.) polycyclo ring system having a 1,2- or 1,4-diazine as one of the cyclos 1,4-diazine as one of the cyclos
Publication date: 2013-11-07
Patent application number: 20130296328
Abstract:
The present invention provides new target gene regions for use in
prediction, prognosis, diagnosis and therapy of breast cancer, based on
the differential methylation profile of said targets in samples from
subjects with breast cancer and healthy subjects.Claims:
1. A method for the stratification and prognosis of breast cancer
comprising the steps of: a) analyzing the methylation status of one or
more of the genes selected from the group consisting of: LCK, CD3D, CD6,
ICOS, CD3G, SIT1, CCL5, HCLS1, CD79B, UBASH3A, and LAX1, in a sample of
the subject, and b) comparing the methylation status of said one or more
genes obtained from step a) with the methylation status of a control
sample, wherein a difference in methylation status as detected in step b)
indicates the subject has a good or a bad clinical outcome.
2. The method according to claim 1, wherein the methylation status of one or more CpG regions of said immune genes as defined by SEQ ID Nos 500-512 is analysed.
3. The method according to claim 1, wherein a decreased methylation of said immune genes indicates a better clinical outcome and thus a good prognosis.
4. A method for the classification, stratification, diagnosis, prognosis or prediction of breast cancer comprising the steps of: a) analyzing the methylation status of all 86 CpG regions defined in Table 2 (SEQ ID Nos 1 to 86) in a sample of the subject, and b) comparing the methylation status of said one or more regions obtained from step a) with the methylation status of a control sample, wherein a difference in methylation status as detected in step b) indicates the subject has or is at risk of developing breast cancer.
5. The method according to claim 4, wherein a classifier comprising the methylation profile of the 86 CpG islands identified in Table 2 is used.
6. The method according to claim 5, wherein said breast cancers are classified into one of the six methylation subtypes according to said 86 CpG island classifier.
7. A method for the stratification, prognosis or prediction of breast cancer, or for providing an indication for susceptibility to hormonotherapy comprising the steps of: a) analyzing the methylation status of one or more of the CpG regions defined in Table 5b (SEQ ID Nos 87 to 321) and 5c (SEQ ID Nos 322 to 499), in a sample of the subject, and b) comparing the methylation status of said one or more regions obtained from step a) with the methylation status of a control sample, wherein a difference in methylation status as detected in step b) indicates the susceptibility of the subject to respond to homotherapy.
8. The method according to claim 7, wherein all CpG regions defined in Table 5b (SEQ ID Nos 87 to 321) and/or all CpG regions defined in Table 5c (SEQ ID Nos 322 to 499) are analysed.
9. The method according to claim 7, used to establish whether or not said tumor belongs to the ER-positive or ER-negative subtype.
10. The method according to claim 1, wherein the difference in methylation status is due to hypermethylation or hypomethylation.
11. The method according to claim 1, wherein the sample of the subject is selected from the group comprising: a tissue, cells, a cell pellet, a cell extract, a surgical sample, a biopsy or fine needle aspirate, or is a biological fluid such as: urine, whole blood, plasma, serum, ductal fluid, lymph node fluid, tumour exudate or tumour cavity fluid.
12. The method according to claim 1, wherein the methylation status is analysed by one or more techniques selected from the group consisting of nucleic acid amplification, polymerase chain reaction (PCR), methylation specific PCR (MCP), methylated-CpG island recovery assay (MIRA), combined bisulfite-restriction analysis (COBRA), bisulfite pyrosequenceing, single-strand conformation polymorphism (SSCP) analysis, restriction analysis, microarray analysis, or bead-chip technology.
13. A method of treating breast cancer by targeting one or more genes having aberrant methylation in breast cancer, defined by one or more of the genes selected from the group comprising: LCK, CD3D, CD6, ICOS, CD3G, SIT1, CCL5, HCLS1, CD79B, UBASH3A, and LAX1, or CpG regions defined in Tables 2, 5b or 5c.
14. The method according to claim 13, wherein said targeting implies changing the methylation status by using demethylating or methylating agents, by changing the expression level, or by changing the protein activity of the protein encoded by said one or more genes.
15. The method according to claim 14, wherein said methylating agents are methyl donors such as folic acid, methionine, choline or any other chemicals capable of elevating DNA methylation.
16. A method for identifying an agent that modulates the methylation status of one or more of the genes or gene products having aberrant methylation in breast cancer, defined by one or more of the genes selected from the group comprising: LCK, CD3D, CD6, ICOS, CD3G, SIT1, CCL5, HCLS1, CD79B, UBASH3A, and LAX1, or CpG regions defined in Tables 2, 5b or 5c, comprising the steps of: a) contacting the candidate agent with said one or more genes, and b) analysing the modulation of said one or more gene by the candidate agent.
17. The method according to claim 16, wherein said agent modulates the methylation status, the expression level or the activity of said one or more gene.
18. A method for establishing a reference methylation status profile comprising the steps of: measuring the methylation status of one or more genes having aberrant methylation in breast cancer, defined by one or more of the genes selected from the group comprising: LCK, CD3D, CD6, ICOS, CD3G, SIT1, CCL5, HCLS1, CD79B, UBASH3A, and LAX1, or CpG regions defined in Tables 2, 5b or 5c in a sample of subject.
19. The method according to claim 18, wherein said subject is healthy, thereby producing a reference profile of a healthy subject, or wherein said subject is suffering from breast cancer, or Basal-like, Luminal A, luminal B, HER2-plus or HER2-minus breast cancer, thereby producing a specific breast cancer type reference profile.
20. A methylation status reference profile for the stratification, prognosis, diagnosis or prediction of breast cancer comprising the methylation status of one or more CpG regions from one or more of the genes selected from the group comprising: LCK, CD3D, CD6, ICOS, CD3G, SIT1, CCL5, HCLS1, CD79B, UBASH3A, and LAX1, or CpG regions defined in Tables 2, 5b or 5c, obtainable according to claim 17.
21. A microarray or chip comprising one or more breast cancer specific CpG regions from one or more of the genes selected from the group comprising: LCK, CD3D, CD6, ICOS, CD3G, SIT1, CCL5, HCLS1, CD79B, UBASH3A, and LAX1, or CpG regions defined in Tables 2, 5b or 5c.
22. A method of treating breast cancer comprising determining the methylation status of one or more of the CpG islands from one or more of the genes selected from the group comprising: LCK, CD3D, CD6, ICOS, CD3G, SIT1, CCL5, HCLS1, CD79B, UBASH3A, and LAX1, or CpG regions defined in Tables 2, 5b or 5c in a patient sample, stratifying, prognosticating, diagnosing or predicting clinical outcome for breast cancer based upon the methylation status, selecting patients having a poor clinical outcome, and treating the patients having a poor clinical outcome.
23. A method of stratifying breast cancer patients comprising the steps of: a) analyzing the methylation status of one or more of the CpG islands from one or more of the genes selected from the group comprising: LCK, CD3D, CD6, ICOS, CD3G, SIT1, CCL5, HCLS1, CD79B, UBASH3A, and LAX1, or CpG regions defined in Tables 2, 5b or 5c, in a sample of the subject, and b) comparing the methylation status of said one or more genes obtained from step a) with the methylation status of a control sample selected from the group of healthy, or Basal-like, Luminal A, luminal B, HER2-plus or HER2-minus breast cancer, wherein a corresponding methylation status in steps a) and b) results in the identification of the type of breast cancer.
24. A method of selecting a breast cancer therapy comprising the steps of a) analyzing the methylation status of one or more of the CpG islands from one or more of the genes selected from the group comprising: LCK, CD3D, CD6, ICOS, CD3G, SIT1, CCL5, HCLS1, CD79B, UBASH3A, and LAX1, or CpG regions defined in Tables 2, 5b or 5c, in a sample of the subject, and b) comparing the methylation status of said one or more genes obtained from step a) with the methylation status of a control sample selected from the group of healthy, or Basal-like, Luminal A, luminal B, HER2-plus or HER2-minus breast cancer, wherein a corresponding methylation status in steps a and b results in the identification of the type of breast cancer, and c) identifying the appropriate treatment of the breast cancer in view of the type of cancer identified.
25. A kit for the stratification, prognosis, diagnosis or prediction of breast cancer comprising the microarray according to claim 21, and one or more reference profiles comprising the methylation status of one or more CpG regions from one or more of the genes selected from the group comprising: LCK, CD3D, CD6, ICOS, CD3G, SIT1, CCL5, HCLS1, CD79B, UBASH3A, and LAX1, or CpG regions defined in Tables 2, 5b or 5c.
26. A kit for the stratification, prognosis, diagnosis or prediction of breast cancer comprising means for analyzing the methylation status of one or more CpG regions from one or more of the genes selected from the group comprising: LCK, CD3D, CD6, ICOS, CD3G, SIT1, CCL5, HCLS1, CD79B, UBASH3A, and LAX1, or CpG regions defined in Tables 2, 5b or 5c, and one or more reference profiles according to claim 20.
Description:
FIELD OF THE INVENTION
[0001] The present invention is situated in the medical diagnostics, therapeutics field, more particular in the field of diagnosis of cancer, and methods for treating cancer, based on the new diagnostic tools and targets identified herein.
BACKGROUND OF THE INVENTION
[0002] Breast cancer is a molecularly, biologically and clinically heterogeneous group of disorders. Understanding this diversity is essential to improving diagnosis and optimising treatment. Both genetic and acquired epigenetic abnormalities participate in cancer (Jones P. A. and Baylin S. B. 2007 Cell 128, 683-692; Feinberg, A. P. 2007 Nature 447, 433-440) but information is scant on the involvement of the epigenome in breast cancer and its contribution to the complexity of the disease.
[0003] Previous studies have documented aberrant methylation events in breast carcinogenesis (Sunami, E. et al. 2008 Breast Cancer Res. 10:R46; Feng, W. et al. 2007 Breast Cancer Res. 9:R57; Widschwendter, M. et al. 2004 Cancer Res. 64,3807-3813; Ordway, J. M. et al. PLoS One 19:e1314), but such events have never been precisely related to specific tumour traits. The goal of the present invention is thus to explore the DNA methylation landscapes of phenotypically heterogeneous tumours, to relate this diversity to landscape features, and extract biological and clinical meaningful information.
[0004] DNA methylation occurs as 5-methyl cytosine mostly in the context of CpG dinucleotides, so-called CpG sites. It is the best-studied epigenetic modification and governs transcriptional regulation and silencing (for review see Suzuki M M and Bird A 2008 Nat Rev Genet 9: 465-476). Unlike the relatively sturdy genome, the methylome changes in a dynamic way during development, tissue differentiation and aging. Pathologically altered DNA methylation is well described in various cancers (reviewed in Jones P A and Baylin S B 2007 Cell 128: 683-692). About 75% of human gene promoters are associated with CpG islands, which are clusters of 500 bp to 2 kb length with a comparatively high frequency of CpG dinucleotides. They usually harbour low levels of DNA methylation but can become hypermethylated; this CpG island hypermethylation was demonstrated to abrogate tumour suppressor gene transcription during tumourigenesis. Lately, DNA methylation changes in CpG sites adjoining yet outside of CpG islands, so-called CpG island shores (Irizarry R A et al., 2009 Nat Genet 41: 178-186), are gaining increased attention. Intriguingly, CpG sites in these shore sequences, in addition to those within CpG islands, are proposed to display differential DNA methylation between cancer and normal cells as well as between cells of different tissues.
[0005] The goal of the present invention is to clarify the hitherto poorly understood connection between the global DNA methylation status of the genome of breast cancer patients, i.e. both hyper- and/or hypomethylation with respect to a healthy subject. The invention aims at providing new prognostic and diagnostic tools for identifying breast cancer at a very early stage, for stratifying breast cancer patients. The invention further provides new targets for treatment of breast cancer.
SUMMARY OF THE INVENTION
[0006] The present invention is based on information gathered by the Infinium® Methylation Platform with which 248 frozen breast tissues were profiled: a "main set" of 123 samples (4 normal and 119 infiltrating ductal carcinomas, IDCs), and a "validation set" of 125 samples (8 normal and 117 IDCs) (see Table 1).
[0007] Firstly, the invention shows that the two major phenotypes of breast cancers determined by ER status are widely epigenetically controlled.
[0008] Secondly, the present invention validates 6 methylation-profile-based tumour groups in an independent set of tumours, some of which coinciding with known gene expression tumor subtypes (Perou, C. M. et al. 2000 Nature 406, 747-752; Sorlie, T. et al. 2001 Proc. Natl Acad. Sci. USA 98, 10869-10874; van't Veer, L. J. et al. 2002 Nature 415, 530-535 ; Sotiriou, C. et al. 2003 Proc. Natl Acad. Sci. USA 100, 10393-10398) but also new entities that provides a meaningful basis for refining breast tumour taxonomy.
[0009] Thirdly, the invention shows that DNA methylation profiling can reflect the cell type composition of the tumour microenvironment.
[0010] Lastly, an unexpected strong epigenetic component was highlighted in the regulation of key immune pathways. The invention thus provides a set of immune genes having high prognostic value in specific tumour categories.
[0011] Taken together, by laying the ground for better understanding of breast cancer heterogeneity and improved tumour taxonomy, the precise epigenetic portraits provided by the present invention will contribute to better management of breast cancer patients.
[0012] The invention thus provides a method for the stratification and prognosis of breast cancer comprising the steps of:
[0013] a) analyzing the methylation status of one or more of the genes selected from the group comprising: LCK, CD3D, CD6, ICOS, CD3G, SIT1, CCL5, HCLS1, CD79B, UBASH3A, and LAX1, in a sample of the subject that has a breast cancer, and
[0014] b) comparing the methylation status of said one or more genes obtained from step a) with the methylation status of a control sample,
[0015] wherein a difference in methylation status as detected in step b) indicates the subject has a good or a bad clinical outcome. Preferably, the methylation status of one or more CpG regions or sites as defined by SEQ ID Nos 500-512 is analysed.
[0016] Alternatively, the invention provides a method for the stratification, diagnosis, prognosis or prediction of breast cancer comprising the steps of:
[0017] a) analyzing the methylation status of all 86 CpG regions defined in Table 2 (SEQ ID Nos 1 to 86) in a sample of the subject, and
[0018] b) comparing the methylation status of said one or more regions obtained from step a) with the methylation status of a control sample,
[0019] wherein a difference in methylation status as detected in step b) indicates the subject has or is at risk of developing breast cancer.
[0020] Furthermore, the invention provides a method for the stratification, prognosis or prediction of breast cancer as well as an indication for hormonotherapy response comprising the steps of:
[0021] a) analyzing the methylation status of one or more of the CpG regions defined in Table 5b (ESR1-positive module) and 5c (ESR1-negative module), respectively defined by (SEQ ID Nos 87 to 321 and 322 to 499), in a sample of the subject, and
[0022] b) comparing the methylation status of said one or more regions obtained from step a) with the methylation status of a control sample,
[0023] wherein a difference in methylation status as detected in step b) indicates the susceptibility of the subject to respond to hormonotherapy.
[0024] Preferably, all CpG islands or regions of either the ESR1-positive or -negative modules are analysed. Even more preferably, all regions or islands of both modules are analysed.
[0025] In any of the methods according to the present invention, the difference in methylation status can be due to either hypermethylation or hypomethylation.
[0026] In a preferred embodiment, the sample of the subject is selected from the group comprising: a tissue, cells, a cell pellet, a cell extract, a surgical sample, a biopsy or fine needle aspirate, or is a biological fluid such as: urine, whole blood, plasma, serum, ductal fluid, lymph node fluid, tumour exudate or tumour cavity fluid.
[0027] In a preferred embodiment, the methylation status of the genes selected from the group comprising: LCK, CD3D, CD6, ICOS, CD3G, SIT1, CCL5, HCLS1, CD79B, UBASH3A, and LAX1, is determined. Preferably, the methylation status of one or more of the CpG region of each of said genes is analysed. In one embodiment, said CpG regions are defined by SEQ ID Nos 500 to 512 (Table 13b).
[0028] In a further preferred embodiment, the breast cancer is of the HER-2-positive type, or luminal B-type. In a preferred embodiment of the method of the present invention, the methylation status is analysed by one or more techniques selected from the group consisting of nucleic acid amplification, polymerase chain reaction (PCR), methylation specific PCR (MCP), methylated-CpG island recovery assay (MIRA), combined bisulfite-restriction analysis (COBRA), bisulfite pyrosequenceing, single-strand conformation polymorphism (SSCP) analysis, restriction analysis, microarray analysis, or bead-chip technology.
[0029] The invention further provides for a method of treating breast cancer by targeting one or more genes having aberrant methylation in breast cancer, defined by one or more of the genes selected from the group comprising: LCK, CD3D, CD6, ICOS, CD3G, SIT1, CCL5, HCLS1, CD79B, UBASH3A, and LAX1, or CpG regions defined in Tables 2, 5b or 5c, or 13b.
[0030] In a specific embodiment of said method of treatment, said targeting implies changing the methylation status by using demethylating or methylating agents, by changing the expression level, or by changing the protein activity of the protein encoded by said one or more genes. In preferred embodiments, said methylating agents are methyl donors such as folic acid, methionine, choline or any other chemicals capable of elevating DNA methylation.
[0031] The invention further provides for a method for identifying an agent that modulates the methylation status of one or more of the genes or gene products having aberrant methylation in breast cancer, defined by one or more of the genes selected from the group comprising: LCK, CD3D, CD6, ICOS, CD3G, SIT1, CCL5, HCLS1, CD79B, UBASH3A, and LAX1, or CpG regions defined in Tables 2, 5b or 5c, or 13b, comprising the steps of:
[0032] a) contacting the candidate agent with said one or more genes, and
[0033] c) analysing the modulation of said one or more gene by the candidate agent. In a preferred embodiment of such a method, said agent modulates the methylation status, the expression level or the activity of said one or more gene.
[0034] The invention furthermore provides for a method for establishing a reference methylation status profile comprising the steps of: measuring the methylation status of one or more genes having aberrant methylation in breast cancer, defined by one or more of the genes selected from the group comprising: LCK, CD3D, CD6, ICOS, CD3G, SIT1, CCL5, HCLS1, CD79B, UBASH3A, and LAX1, or CpG regions defined in Tables 2, 5b or 5c, or 13b in a sample of subject. Preferably, said subject is healthy, thereby producing a reference profile of a healthy subject, or said subject is suffering from breast cancer, or Basal-like, Luminal A, luminal B, HER2-plus or HER2-minus breast cancer, thereby producing a specific breast cancer type reference profile.
[0035] The invention also provides a methylation status profile for the stratification, prognosis, diagnosis or prediction of breast cancer comprising the methylation status of one or more CpG regions from one or more of the genes selected from the group comprising: LCK, CD3D, CD6, ICOS, CD3G, SIT1, CCL5, HCLS1, CD79B, UBASH3A, and LAX1, or CpG regions defined in Tables 2, 5b or 5c, or 13b, obtainable according to the method of the present invention.
[0036] The invention also provides a microarray or chip comprising one or more breast cancer specific CpG regions from one or more of the genes selected from the group comprising: LCK, CD3D, CD6, ICOS, CD3G, SIT1, CCL5, HCLS1, CD79B, UBASH3A, and LAX1, or CpG regions defined in Tables 2, 5b or 5c, or 13b.
[0037] In addition, the invention provides for the use of the methylation status of one or more of the CpG islands or regions from one or more of the genes selected from the group comprising: LCK, CD3D, CD6, ICOS, CD3G, SIT1, CCL5, HCLS1, CD79B, UBASH3A, and LAX1, or CpG regions defined in Tables 2, 5b or 5c, or 13b in the stratification, prognosis, diagnosis or prediction of breast cancer.
[0038] The invention further provides a method of stratifying breast cancer patients comprising the steps of:
[0039] a) analyzing the methylation status of one or more of the CpG islands or regions from one or more of the genes selected from the group comprising: LCK, CD3D, CD6, ICOS, CD3G, SIT1, CCL5, HCLS1, CD79B, UBASH3A, and LAX1, or CpG regions defined in Tables 2, 5b or 5c, or 13b, in a sample of the subject, and
[0040] b) comparing the methylation status of said one or more genes obtained from step a) with the methylation status of a control sample selected from the group of healthy, or Basal-like, Luminal A, luminal B, HER2-plus or HER2-minus breast cancer,
[0041] wherein a corresponding methylation status in steps a) and b) results in the identification of the type of breast cancer.
[0042] The invention further provides a method of selecting a breast cancer therapy comprising the steps of
[0043] a) analyzing the methylation status of one or more of the CpG islands or regions from one or more of the genes selected from the group comprising: LCK, CD3D, CD6, ICOS, CD3G, SIT1, CCL5, HCLS1, CD79B, UBASH3A, and LAX1, or CpG regions defined in Tables 2, 5b or 5c, or 13b, in a sample of the subject, and
[0044] b) comparing the methylation status of said one or more genes obtained from step a) with the methylation status of a control sample selected from the group of healthy, or Basal-like, Luminal A, luminal B, HER2-plus or HER2-minus breast cancer,
[0045] wherein a corresponding methylation status in steps a and b results in the identification of the type of breast cancer, and
[0046] c) identifying the appropriate treatment of the breast cancer in view of the type of cancer identified.
[0047] Finally, the invention provides a kit for the stratification, prognosis, diagnosis or prediction of breast cancer comprising the microarray according to the present invention, and one or more reference profiles according to the present invention. Alternatively, said kit of the invention comprises means for analyzing the methylation status of one or more CpG regions from one or more of the genes selected from the group comprising: LCK, CD3D, CD6, ICOS, CD3G, SIT1, CCL5, HCLS1, CD79B, UBASH3A, and LAX1, or CpG regions defined in Tables 2, 5b or 5c, or 13b, and one or more reference profiles according to the present invention.
[0048] The present invention further provides tools for refining breast cancer tumour taxonomy, typing and/or classification, based on the identification of specific clusters of CpG regions that are differentially methylated in different breast cancer subtypes.
[0049] The invention identifies two major clusters of CpG regions, called cluster I and II herein, that enable distinguishing between ER-positive (cluster II) and ER-negative (cluster I) breast cancers and between ESR1 positive (cluster I) or ESR1 negative (cluster II) breast cancers (Tables 5b and 5c).
[0050] In addition, using a classifier comprising the methylation data of 86 CpG regions (Table 2), the invention identifies 6 CpG methylation subclusters, called clusters 1 to 6, that enable the classification of breast cancers into HER2 positive (cluster 2), Basal-like (cluster 3) and Luminal A-type (cluster 6) cancers.
[0051] The present invention thus provides for methods of classifying breast cancers or stratifying breast cancer patients into subgroups of specific types of breast cancer, based on their methylation profile, using any one or more of the above indicated clusters. Based on this classification or stratification, the treatment of the cancer can be adapted, or the prognosis can be predicted.
[0052] In addition, the present invention has identified 11 immune prognostic markers for HER2 overexpressing and Luminal B tumours, namely: LCK, CD3D, CD6, ICOS, CD3G, SIT1, CCL5, HCLS1, CD79B, UBASH3A, and LAX1. Increased expression, which is coupled to decreased methylation results in better clinical outcome and thus a good prognosis. In total, 13 CpG islands or regions were identified in these genes that are differentially methylated in breast cancer versus healthy breast tissue (cf. SEQ ID Nos 500 to 512, Table 13b).
[0053] The present invention further provides tools to trace distinct groups of breast cancers back to specific stem cell/progenitor populations, likely to reflect their cellular origins.
[0054] The present invention further provides DNA methylation profiling which can contribute to cancer screening and prognosis, revealing strong survival markers.
[0055] The present invention showed that the immune component is important in the prognosis of breast cancer, notably T-cell markers whose expression is associated with a better clinical outcome.
[0056] The present invention and its alternative embodiments is further defined by the following description and examples section. The skilled person would be able to design alternative embodiments, building further on the knowledge provided by the present invention.
DESCRIPTION OF THE DRAWINGS
[0057] FIG. 1. High-throughput DNA methylation profiling in human frozen breast tissues. a, Pie chart depicting the number of CpGs differentially methylated between breast tumour and normal samples of the main set, in terms of : (i) CpG location vs CGI (as defined by Bock et al. 2007 PLoS Comput. Biol. 3, 1055-1070) as well as CpG island shores (as defined by Irizarry et al. 2009 Nat. Genet. 41, 178-186); (ii) CpG location vs promoter classes (as defined by Weber et al. 2007 Nat. Genet. 39, 457-466). b, Validation of the bead array method by conventional Bisulphite Genomic Sequencing (BGS). Panel b shows exemplative analysed loci from CDK3, GSTP1, TWIST1 and RIMBP2 in 1 normal (N1) and 3 tumour samples (BCs). Grey arrows indicate the location of the CpG investigated by the bead array, which seems representative of the surrounding CpGs. Data representation was done according to Bock et al., 2005 (Bioinformatics 21, 4067-4068). Black circle, methylated CpG; white circle, unmethylated CpG; no circle, undetermined sequence. Panel c shows a significant positive correlation (Spearman's rho=0.82; p<0.001) between the Infinium Methylation and BGS data for the CDK3 locus.
[0058] FIG. 2. DNA methylation profiling identifies two main breast tumour categories with different ER statuses. a, ER status is a main discriminator of the two broad tumour groups. Selected clinical data: oestrogen receptor (ER) and HER2 receptor status determined by IHC, tumour grade, tumour size, nodal status, patient's age, and relapse within 5 years. b, Box plots of ESR1 module scores show that the genes of the ESR1-positive module (left part) showed higher methylation and lower expression in cluster I than in cluster II. The opposite was observed for the ESR1-negative module (right part). The ESR1 module has been previously described Desmedt, C. et al., 2008 (Clin. Cancer Res. 14, 5158-5165) and indicated p-values refer to a Mann-Whitney test. c, Barcode plots of the ESR1 module (provided by GSEA analysis) showing an anti-correlation of DNA methylation and expression data. Upper and lower bars designate the positions of ESR1 module genes in methylation and expression rankings, respectively. Dotted lines depict the zero. d, Association between methylation clusters I and II of the main patient set and the clinical data. ERpositive tumours were predominant in cluster II, whereas cluster I seemed to contain a moderately higher number of HER2-positive tumours. Grade 1 tumours were grouped in cluster II. No significant association with tumour size, nodal status, or age was found.
[0059] FIG. 3 Complexity and heterogeneity of breast cancers as revealed by DNA methylation. a, DNA methylation profiling of the main set identifies 6 groups of tumours, termed clusters 1 to 6, displaying differences in terms of "expression subtype composition" and clinical characteristics (see also Table 6). b, Comparison of the methylation group assigned to each tumour of the main set by the unsupervised cluster analysis and the 86 CpG-classifier established by the nearest centroid classification method. c, Correlation plot of main set of tumours with the 6 centroids. Each sample displays the colour of its methylation group assigned by the unsupervised clustering of FIG. 3a. d, Classification of each tumour of the validation set into one of the six methylation groups by means of the 86 CpG-classifier. e, Correlation plot of validation set tumours with the 6 centroids. Each sample was placed in the group with which it presented the highest correlation). Note that the 6 groups obtained for the validation set presented the same "expression subtype composition" and clinical characteristics as the groups obtained for the main set. f, Shows the association between the 6 groups of tumours of the validation set and the clinical data. Clusters 5 and 6 contained exclusively ER-positive tumours, whereas clusters 3 were composed principally of ERnegative tumours. HER2-positive tumours were predominant in clusters 1 and 2. Cluster 6 contained majorly grade 1 tumours. No significant association with tumour size or age was found. g, Characteristics of the 86 CpG-classifier in terms of CpG location vs CGI and vs promoter classes. h, Comparison of gene expression signatures of several normal mammary epithelial subpopulations with gene expression and DNA methylation profiles of our six DNA methylation-based groups of patients in the main set (see section Module/signature scores of additional online Methods). a, b, c, Box plots of mammary stem cell (MaSC), luminal progenitor, and luminal mature signature scores respectively for each of the six methylation breast cancer groups, based on their gene expression profiles. i, Histograms showing the heterogeneity of breast tumours in terms of the number of CpGs differentially methylated compared to normal samples. j, Differential methylation of genes involved in immunity as revealed by GO analysis, with high hypomethylation content in clusters 2 and 3. k, Histologic patterns of breast tumours displaying no lymphocyte infiltration (1) or both stromal and intratumoral infiltration (2). Panel 3 provides a closer look at the intratumoral infiltration presented in panel 2. Black arrows indicate epithelial cells, whereas green and blue arrows indicate stromal and intratumoral lymphocytes, respectively. I, Box plots depicting the higher lymphocyte infiltration in main set tumours belonging to clusters 2 and 3 as compared to tumours belonging to other clusters. m, Box plots illustrating the inverse correlation between LCK and ITGAL methylation and lymphocyte infiltration (Jonckheere-Terpstra test for trends; see also Table 8). n, Methylation status, as assessed by DNA methylation profiling, of immune genes highlighted by GO analysis in breast epithelial cell lines as well as in ex vivo lymphocytes and lymphoid cell lines. o, Association between methylation clusters 1 to 6 of the main patient set and the clinical data. Cluster 6 contained almost exclusively ER-positive tumours, whereas clusters 2 and 3 were composed principally of ER-negative tumours. HER2-positive tumours were predominant in cluster 2 and HER2-negative tumours were predominant in clusters 3 and 6. Cluster 6 contained almost exclusively grade 1 tumours. No significant association with tumour size, nodal status or age was found.
[0060] FIG. 4. Epigenetically regulated immune components are good clinical outcome markers for breast cancers. a, Pie chart depicting the high proportion of immune genes, and in particular of genes involved in T cell biology, among all the genes that appeared significant prognostic markers (FDR<0.1) (univariate Cox regression analysis was performed as described in the Methods and Table 10). b, Box plots illustrating the correlation of methylation (in red) and expression (in blue) status of LAX1 and CD3D with stromal lymphocyte infiltration (Jonckheere-Terpstra test for trends; see also Tables 11 and 12). c, Anti-correlation between the methylation and expression status of the 11 prognostic immune markers in breast epithelial cell lines as well as in ex vivo lymphocytes and lymphoid cell lines, as determined by DNA methylation and gene expression profiling. d, High expression of 11 immune genes is associated with a better clinical outcome in breast cancer. Forest plots showing the log 2 hazard ratio (squares) with the 95% confidence interval (bars) of the relapse-free survival analysis. A negative hazard ratio reveals that a high expression level of the indicated variable is associated with a good outcome, and conversely. e, Subtype-specific prognostic value of immune markers for breast cancer. Exemplative Kaplan-Meier curves for different levels of expression of the LAX1 and CD3D genes in each known "expression subtype" (see also Table 15 for the detailed continuous univariate survival analysis for each subtype).
DETAILED DESCRIPTION OF THE PREFERRED EMBODIMENTS
[0061] As used herein, the singular forms "a", "an", and "the" include both singular and plural referents unless the context clearly dictates otherwise. By way of example, "an antibody" refers to one or more than one antibody; "an antigen" refers to one or more than one antigen.
[0062] The terms "comprising", "comprises" and "comprised of" as used herein are synonymous with "including", "includes" or "containing", "contains", and are inclusive or open-ended and do not exclude additional, non-recited members, elements or method steps.
[0063] The term "and/or" as used in the present specification and in the claims implies that the phrases before and after this term are to be considered either as alternatives or in combination.
[0064] As used herein, the term "level" or "expression level" refers to the expression level data that can be used to compare the expression levels of different genes among various samples and/or subjects.
[0065] The term "amount" or "concentration" of certain proteins refers respectively to the effective (i.e. total protein amount measured) or relative amount (i.e. total protein amount measured in relation to the sample size used) of the protein in a certain sample.
[0066] All documents cited in the present specification are hereby incorporated by reference in their entirety. In particular, the teachings of all documents herein specifically referred to are incorporated herein by reference.
[0067] The term "CpG region" or "CpG site" is a region of genome DNA which shows higher frequency of 5'-CG-3' (CpG) dinucleotides than other regions of genome DNA. Methylation of DNA at CpG dinucleotides, in particularly, the addition of a methyl group to position 5 of the cytosine ring at CpG dinucleotides, is one of the epigenetic modifications in mammalian cells. CpG regions or sites encompass the so called "CpG islands", which often occur in the promoter regions of genes and play a pivotal role in the control of gene expression. In normal tissues CpG islands are usually unmethylated, but a subset of islands becomes differentially methylated (hyper- or hypomethylated) during the development of a disease.
[0068] Detection of methylation state of CpG regions can be done by any known assay currently used in scientific research. Some non-limiting examples are: Methylation-Specific PCR (MSP), which is based on a chemical reaction of sodium bisulfite with DNA, converting unmethylated cytosines of CpG dinucleotides to uracil (UpG), followed by traditional PCR. Methylated cytosines will not be converted by the sodium bisulfite, and specific nucleotide primers designed to overlap with the CpG site of interest will allow determining the methylation status as methylated or unmethylated, based on the amount of PCR product formed. Alternatively, the HELP assay can be used, which is based on the differential ability of restriction enzymes to recognize and cleave methylated and unmethylated CpG DNA sites. Furthermore, ChIP-on-chip assays, based on the ability of commercially prepared antibodies to bind to DNA methylation-associated proteins like MCP2, can be used to determine the methylation status. Also restriction landmark genomic scanning, also based upon differential recognition of methylated and unmethylated CpG sites by restriction enzymes can be used. Methylated DNA immunoprecipitation (MeDIP), analogous to chromatin immunoprecipitation, can be used to isolate methylated DNA fragments for input into DNA detection methods such as DNA microarrays (MeDIP-chip) or DNA sequencing (MeDIP-seq). The unmethylated DNA is not precipitated. Alternatively, molecular break light assay for DNA adenine methyltransferase activity can be used. This is an assay that uses the specificity of the restriction enzyme DpnI for fully methylated (adenine methylation) GATC sites in an oligonucleotide labeled with a fluorophore and quencher. The adenine methyltransferase methylates the oligonucleotide making it a substrate for DpnI. Cutting of the oligonucleotide by DpnI gives rise to a fluorescence increase. Further, methylated-CpG island recovery assay (MIRA) can be used.
[0069] These techniques require the presence of methylated cytosine residues within the recognition sequence that affect the cleavage activity of restriction endonucleases (e.g., HpaII, HhaI) (Singer et al. (1979)). Southern blot hybridization and polymerase chain reaction (PCR)-based techniques can be used with along with this approach.
[0070] In another embodiment, a bisulfite dependent methylation assay is known as a combined bisulfite-restriction analysis (COBRA assay) whereas PCR products obtained from bisulfite-treated DNA can also be analyzed by using restriction enzymes that recognize sequences containing 5'CG, such as TaqI (5'TCGA) or BstUI (5'CGCG) such that methylated and unmethylated DNA can be distinguished.
[0071] In another embodiment, a methylation detection technique is based on the ability of the MBD domain of the MeCP2 protein to selectively bind to methylated DNA sequences. The bacterially expressed and purified His-tagged methyl-CpG-binding domain is immobilized to a solid matrix and used for preparative column chromatography to isolate highly methylated DNA sequences. Restriction endonuclease-digested genomic DNA is loaded onto the affinity column and methylated-CpG island-enriched fractions are eluted by a linear gradient of sodium chloride. PCR or Southern hybridization techniques are used to detect specific sequences in these fractions. In addition, one can make use of MALDI-TOF for DNA methylation analysis. Using a combination of four base specific cleavage reactions, each CpG of a target region can be analyzed individually and is represented by multiple indicative mass signals. Another exemplary method for detecting the methylation status of a gene makes use of a bead chip such as the Infinium® bead chip sold by Illumina Inc. San Diego (US).
[0072] In selected embodiments, the methods for determining the methylation state of (one or more) target gene regions may include treating a target nucleic acid molecule with a reagent that modifies nucleotides of the target nucleic acid molecule as a function of the methylation state of the target nucleic acid molecule, amplifying treated target nucleic acid molecule, fragmenting amplified target nucleic acid molecule, and detecting one or more amplified target nucleic acid molecule fragments, and based upon the fragments, such as size and/or number thereof, identifying the methylation state of a target nucleic acid molecule, or a nucleotide locus in the nucleic acid molecule, or identifying the nucleic acid molecule or a nucleotide locus therein as methylated or unmethylated. Fragmentation can be performed, for example, by treating amplified products under base specific cleavage conditions. Detection of the fragments can be effected by measuring or detecting a mass of one or more amplified target nucleic acid molecule fragments, for example, by mass spectrometry such as MALDI-TOF mass spectrometry. Detection also can be affected, for example, by comparing the measured mass of one or more target nucleic acid molecule fragments to the measured mass of one or more reference nucleic acid, such as measured mass for fragments of untreated nucleic acid molecules. In an exemplary method, the reagent modifies unmethylated nucleotides, and following modification, the resulting modified target is specifically amplified. In some embodiments, the methods for determining the methylation state of (one or more) target gene regions may include treating a target nucleic acid molecule with a reagent that modifies a selected nucleotide as a function of the methylation state of the selected nucleotide to produce a different nucleotide. In particular embodiments, the reagent that modifies unmethylated cytosine to produce uracil is bisulfite. In certain embodiments, the methylated or unmethylated nucleic acid base is cytosine. In another embodiment, a non-bisulfite reagent modifies unmethylated cytosine to produce uracil.
[0073] As used herein, a "nucleic acid target gene region" is a nucleic acid molecule that is examined using the methods disclosed herein. For the purposes of the application, "nucleic acid target gene region", "target gene", "target region", "region" and "gene" may be used interchangeably. A nucleic acid target gene region includes genomic DNA or a fragment thereof, which may or may not be part of a gene, a segment of mitochondrial DNA of a gene or RNA of a gene and a segment of RNA of a gene. Examples of "targets" as defined herein are listed in Tables 2, 5b, 5c or 13 by means of their gene name or Gene ID number. A nucleic target gene region may be further defined by its chromosome position range as is e.g. done in Tables 2, 5b, 5c or 13 for each target sequence identified herewith. The chromosome position ranges provided herein were gathered from the human reference sequence (genome Build hg18/NCBI36, March 2006), which was produced by the International Human Genome Sequencing Consortium.
[0074] As used herein, a "nucleic acid target gene molecule" is a molecule comprising a nucleic acid sequence of the nucleic acid target gene region. The nucleic acid target gene molecule may contain less than 10%, less than 20%, less than 30%, less than 40%, less than 50%, greater than 50%, greater than 60%, greater than 70% greater than 80%, greater than 90% or up to 100% of the sequence of the nucleic acid target gene region. A "target peptide" refers to a peptide encoded by a nucleic acid target gene.
[0075] As used herein, the "methylation state" or "methylation status" of a nucleic acid target gene region refers to the presence or absence of one or more methylated nucleotide bases or the ratio of methylated cytosine to unmethylated cytosine for a methylation site in a nucleic acid target gene region as defined herein.
[0076] For example, a nucleic acid target gene region containing at least one methylated cytosine can be considered methylated (i.e. the methylation state of the nucleic acid target gene region is methylated). A nucleic acid target gene region that does not contain any methylated nucleotides can be considered unmethylated.
[0077] Similarly, the methylation state of a nucleotide locus in a nucleic acid target gene region refers to the presence or absence of a methylated nucleotide at a particular locus in the nucleic acid target gene region.
[0078] For example, the methylation state of a cytosine at the 10th nucleotide in a nucleic acid target gene region is methylated when the nucleotide present at the 10th nucleotide in the nucleic acid target gene region is 5-methylcytosine. Similarly, the methylation state of a cytosine at the 10th nucleotide in a nucleic acid target gene region is unmethylated when the nucleotide present at the 10th nucleotide in the nucleic acid target gene region is cytosine (and not 5-methylcytosine).
[0079] Correspondingly the ratio of methylated cytosine to unmethylated cytosine for a methylation site(s) or locus can provide a methylation state of a nucleic acid target gene region. In certain embodiments the methylation state or status may be expressed as a percentage of methylateable nucleotides (e.g., cytosine) in a nucleic acid (e.g., amplicon or gene region) that are methylated (e.g., about 5%, about 10%, about 15%, about 20%, about 25%, about 30%, about 35%, about 40%, about 45%, about 50%, about 55%, about 60%, about 65%, about 70%, about 75%, about 80%, about 85%, about 90%, about 95% or about 100% methylated; greater than 80% methylated, between 20% to 80% methylated, or less than 20% methylated). A nucleic acid may be "hypermethylated," which refers to the nucleic acid having a greater number of methylateable nucleotides that are methylated relative to a control or reference. A nucleic acid may be "hypomethylated," which refers to the nucleic acid having a smaller number of methylateable nucleotides that are methylated relative to a control or reference. The methylation status or state is determined in a CpG island or region in certain embodiments. Examples of target CpG islands or regions according to the present invention are listed in Tables 2, 5b, 5c or 13 and in SEQ ID Nos 1-512.
[0080] As used herein, a "characteristic methylation state" refers to a unique, or specific data set comprising the methylation state of at least one of the methylation sites of one or more nucleic acid(s), nucleic acid target gene region(s), gene(s) or group of genes of a sample obtained from a subject. It can be the combined data of the methylation state of a panel of multiple target genes according to the present invention in said sample, as compared to a reference sample from e.g. a healthy subject.
[0081] As used herein, "methylation ratio" refers to the number of instances in which a molecule or locus is methylated relative to the number of instances the molecule or locus is unmethylated.
[0082] Methylation ratio can be used to describe a population of individuals or a sample from a single individual.
[0083] For example, a nucleotide locus having a methylation ratio of 50% is methylated in 50% of instances and unmethylated in 50% of instances. Such a ratio can be used, for example, to describe the degree to which a nucleotide locus or nucleic acid region is methylated in a population of individuals. Thus, when methylation in a first population or pool of nucleic acid molecules is different from methylation in a second population or pool of nucleic acid molecules, the methylation ratio of the first population or pool will be different from the methylation ratio of the second population or pool. Such a ratio also can be used, for example, to describe the degree to which a nucleotide locus or nucleic acid region is methylated in a single individual. For example, such a ratio can be used to describe the degree to which a nucleic acid target gene region of a group of cells from a tissue sample are methylated or unmethylated at a nucleotide locus or methylation site.
[0084] As used herein, a "methylated nucleotide" or a "methylated nucleotide base" refers to the presence of a methyl moiety on a nucleotide base, where the methyl moiety is not present in a recognized typical nucleotide base. Cytosine does not contain a methyl moiety on its pyrimidine ring, however 5-methylcytosine contains a methyl moiety at position 5 of its pyrimidine ring. In this respect, cytosine is not a methylated nucleotide and 5-methylcytosine is a methylated nucleotide.
[0085] As used herein, a "methylation site" is a nucleotide within a nucleic acid, nucleic acid target gene region or gene that is susceptible to methylation either by natural occurring events in vivo or by an event instituted to chemically methylate the nucleotide in vitro.
[0086] As used herein, a "methylated nucleic acid molecule" refers to a nucleic acid molecule that contains one or more methylated nucleotides that is/are methylated.
[0087] As used herein "CpG island" refers to a G:C-rich region of genomic DNA containing a greater number of CpG dinucleotides relative to total genomic DNA, as defined in the art. It should be noted that differential methylation of the target genes according to the invention is not limited to CpG islands only, but can be in so-called "shores" or can be lying completely outside a CpG island region, called herein more generally a "CpG region" or "CpG site".
[0088] As used herein, a first nucleotide that is "complementary" to a second nucleotide refers to a first nucleotide that base-pairs, under high stringency conditions to a second nucleotide. An example of complementarity is Watson-Crick base pairing in DNA (e.g., A to T and C to G) and RNA (e.g., A to U and C to G). Thus, for example, G base-pairs, under high stringency conditions, with higher affinity to C than G base-pairs to G, A or T, and, therefore, when C is the selected nucleotide, G is a nucleotide complementary to the selected nucleotide.
[0089] As used herein, the term "correlates" as between a specific diagnosis or a therapeutic outcome of a sample or of an individual and the changes in methylation state of a nucleic acid target gene region refers to an identifiable connection between a particular diagnosis or therapy of a sample or of an individual and its methylation state.
[0090] As used herein, a "subject" includes, but is not limited to, an animal, plant, bacterium, virus, parasite and any other organism or entity that has nucleic acid. Among animal subjects are mammals, including primates, such as humans. As used herein, "subject" may be used interchangeably with "patient" or "individual".
[0091] As used herein, a "methylation" or "methylation state" correlated with a disease, disease outcome or outcome of a treatment regimen refers to a specific methylation state of a nucleic acid target gene region or nucleotide locus that is present or absent more frequently in subjects with a known disease, disease outcome or outcome of a treatment regimen, relative to the methylation state of a nucleic acid target gene region or nucleotide locus than otherwise occur in a larger population of individuals (e.g., a population of all individuals).
[0092] As used herein, "sample" refers to a composition containing a material to be detected, and includes e.g. "biological samples", which refer to any material obtained from a living source, for example an animal such as a human or other mammal that can suffer from breast cancer. The biological sample can be in any form, including a solid material such as a tissue, cells, a cell pellet, a cell extract, a surgical sample, a biopsy or fine needle aspirate, or it can be in the form of a biological fluid such as urine, whole blood, plasma, or serum, or any other fluid sample produced by the subject such as ductal fluids, lymph node fluids, tumour exudates or tumour cavity fluids. In addition, the sample can be solid samples of tissues or organs, such as collected tissues, including breast tissue. Samples can include pathological samples such as a formalin-fixed sample embedded in paraffin. If desired, solid materials can be mixed with a fluid or purified or amplified or otherwise treated. Samples examined using the methods described herein can be treated in one or more purification steps in order to increase the purity of the desired cells or nucleic acid in the sample. Samples also can be examined using the methods described herein without any purification steps to increase the purity of desired cells or nucleic acid. In particular, herein, the samples include a mixture of matrix used for mass spectrometric analyses and a biopolymer, such as a nucleic acid. Preferably, said sample is a breast cancer biopsy, or is whole blood, plasma or serum of a subject. The sample can furthermore be a test cell obtainable from tissues or fluids including detached tumour cells or free nucleic acids that are released from dead tumour cells. Nucleic acids include RNA, genomic DNA, mitochondrial DNA, and possibly protein-associated nucleic acids. Any nucleic acid specimen in purified or non-purified form obtained from such test cell can be utilized in the methods of the present invention.
[0093] The term "breast cancer" described in the methods or uses or kits of the invention encompasses in principle all cancers of breast-related tissue, including ducts, glands or lobules and infiltrating lymph and/or blood vessels. Specific examples of breast cancer are for example: Ductal Carcinoma In-Situ (DCIS), a type of early breast cancer confined to the inside of the ductal system. Infiltrating Ductal Carcinoma (IDC) is the most common type of breast cancer representing 78% of all malignancies. These lesions appear as stellate (star like) or well-circumscribed (rounded) areas on mammograms. The stellate lesions generally have a poorer prognosis. Medullary Carcinoma accounts for 15% of all breast cancer types. It most frequently occurs in women in their late 40s and 50s, presenting with cells that resemble the medulla (gray matter) of the brain. Infiltrating Lobular Carcinoma (ILC) is a type of breast cancer that usually appears as a subtle thickening in the upper-outer quadrant of the breast. This breast cancer type represents 5% of all diagnosis. Often positive for estrogen and progesterone receptors, these tumors respond well to hormone therapy. Tubular Carcinoma makes up about 2% of all breast cancer diagnosis, tubular carcinoma cells have a distinctive tubular structure when viewed under a microscope. Typically this type of breast cancer is found in women aged 50 and above. It has an excellent 10-year survival rate of 95%. Mucinous Carcinoma (Colloid) represents approximately 1% to 2% of all breast carcinoma. This type of breast cancer's main differentiating features are mucus production and cells that are poorly defined. It also has a favorable prognosis in most cases. Inflammatory Breast Cancer (IBC) is a rare and very aggressive type of breast cancer that causes the lymph vessels in the skin of the breast to become blocked. This type of breast cancer is called "inflammatory" because the breast often looks swollen and red, or "inflamed". IBC e.g. accounts for 1% to 5% of all breast cancer cases in the United States. Breast cancer subtypes can furthermore be identified on the basis of gene expression by applying the Subtype Classification Model as described by Desmedt et al., 2008 (Clin. Cancer Res. 14, 5158-5165) and Wirapati et al.,2008 (Breast Cancer Res. 10:R65).
[0094] The invention is illustrated by the following non-limiting examples.
EXAMPLES
[0095] Materials and Methods
[0096] Breast Tissues Selection Criteria
[0097] The main sample set is constituted of 119 archival frozen breast cancer samples from patients diagnosed at the Jules Bordet Institute in Brussels between 1995 and 2003. These samples were selected according to the following criteria:
[0098] 1/ sufficient presence of invasive cells as defined by pathologist. The current practice of pathologists is to examine by microscopy a representative slide of a given tumour sample and to estimate the proportion of the tumour that contains epithelial cancer cells (measured as <<% area>>). Any sample below an arbitrary threshold of an estimated value of "90%" was rejected. Although this is a current practice of pathologists and has been for many years, it is important to notice that this "area" criterion is not quantitatively accurate;
[0099] 2/ >2 pg yield of high quality DNA available;
[0100] 3/ balanced distribution of the four main "breast cancer expression subtypes" determined by IHC; and
[0101] 4/ balanced distribution of patients with and without relapses within each subtype. Four samples of normal breast tissues with sufficient high-quality DNA were selected as well for this main series.
[0102] The validation sample set is constituted of 117 frozen breast cancer samples from patients diagnosed at the Jules Bordet Institute in Brussels between 2004 and 2009. For patient data, see Table 1. The Ethics committee of the Jules Bordet Institute approved the present research project.
TABLE-US-00001 TABLE 1 Characteristics of breast tissue samples of the main patient set. Characteristic Number of patients Tumour size ≦2 cm 44 >2 cm 75 Nodal status Negative 64 Positive 55 Grade 1 25 2 9 3 85 ER Negative 54 Positive 64 Unknown 1 HER2 Negative 88 Positive 31 Subtype IHC Basal-like 31 HER2+ 31 Luminal A 25 Luminal B 32 Subtype GEP Basal-like 22 HER2+ 21 Luminal A 23 Luminal B 22 Unknown 31 Age <50 years 38 >years 81 Relapse No 68 Yes 51
[0103] DNA Methylation Profiling
[0104] Genomic DNA from the clinical frozen samples was extracted from twenty 10-μm sections using the Qiagen-DNeasy Blood &Tissue Kit according to the supplier's instructions (Qiagen, Hilden, Germany). This included a proteinase K digestion at 55° C. overnight. For breast epithelial cell lines and lymphocyte samples, genomic DNA was extracted with the QIAamp DNA Mini Kit (Qiagen, Hilden, Germany) including the recommended proteinase K and RNase A digestions. DNA was quantitated with the NanoDrop® ND-1000 UV-Vis Spectrophotometer (NanoDrop Technologies, Wilmington, Del., USA). Site-specific CpG methylation was analysed using Infinium® HumanMethylation27 beadarray-based technique. This array was developed to assay 27,578 CpG sites selected from more than 14,000 genes. Genomic DNA (1 μg) was treated with sodium bisulphite using the Zymo EZ DNA Methylation Kit® (Zymo Research, Orange, USA) according to the manufacturer's procedure, with the alternative incubation conditions recommended when using the Illumina Infinium® Methylation Assay. The methylation assay was performed from 4 μL converted gDNA at 50 ng/μL according to the Infinium® Methylation Assay Manual protocol. The quality of bead array data was checked with the GenomeStudio® Methylation Module software. All samples passed this quality control. Methylation raw data are available online (http://www.ncbi.nlm.nih.gov/geo/query/acc.cgi?token=bvonpyugyawqq- to&acc=GSE20713).
[0105] Gene Expression Profiling
[0106] For tumours of the main set as well as cell lines and ex vivo samples, RNA was isolated by the Trizol method (Invitrogen) or the Tripure method (Roche) according to manufacturers' instructions and purified on RNeasy mini-columns (Qiagen). The quality of the RNA obtained from each tumour sample was assessed on the basis of the RNA profile generated by the Bioanalyzer (Agilent Inc.). Total RNA (100 ng) was first reverse-transcribed into doublestranded cDNA. This cDNA was transcribed in vitro. After purification of the aRNA, 12.5 μg were fragmented and labelled prior to hybridisation to the Affymetrix HG133 Plus 2.0 GeneChip. Among the clinical samples of the main set, thirty initially profiled for DNA methylation were not profiled for gene expression because of low tumour-cell content (<70% tumour cells, n=11), no tumour left at all in the samples (n=4), low-quality RNA (n=13), or low RNA quantity (n=2). In addition, the CD4+ lymphocyte clone R12C9 was not profiled for gene expression because of low RNA quantity. The quality of the microarray data was checked using the `yaqcaffy` package of the R statistical software (http://www.r-project.org/). On the basis of the results, two samples were excluded from further analysis. Gene expression raw data are available online (http://www.ncbi.nlm.nih.gov/geo/query/acc.cgi?token=bvonpyugyawqqto&acc=- GSE20713).
[0107] Histopathologic Analysis of the Lymphocyte Infiltration
[0108] Histopathologic analysis of tumours in order to evaluate both stromal and intratumoral lymphocyte infiltration was performed on hematoxylin and eosin-stained sections, as previously described (Denkert, C. et al., 2010 J. Clin. Oncol. 28, 105-113).
[0109] Culture of Breast Epithelial and Lymphoid Cell Lines
[0110] MCF10A cells were cultured in DMEM/F12 (1:1) medium (Gibco); MCF-7, SKBR3 and MDA-MB-231 were cultured in DMEM medium (Gibco); T47D, ZR-75-1 and MDA-MB-361 were cultured in RPMI medium (Gibco); and BT20 were cultured in MEM medium (Gibco). For all breast epithelial cell lines, media were supplemented with 10% fetal calf serum (Gibco). The lymphoid clones CD4+ R12C9 and CD8+ WEIS3E5 were maintained in Isocove Dubelcco medium supplemented with 10% human serum HS54, L-Arginine, LAsparagine, L-glutamine, 2-mercaptoethanol and methyltryptophane and 10 ng/mL of IL-7 and 50 U/mL of IL-2.
[0111] Isolation of ex vivo Lymphocytes
[0112] Blood mononuclear cells from an hemochromatosis patient were isolated with density gradient centrifugation using Lymphoprep (Axis-Shield PoCAS, Oslo, Norway), and extensively washed in cold phosphate-buffered saline containing 2 mM EDTA, to eliminate platelets. CD3+ and CD20+ cells were purified with magnetic microbeads using the CD3 Isolation Kit or CD20 Isolation Kit (Miltenyi Biotec, Bergisch Gladbach, Germany) in an AUTOMACS magnetic sorter (Miltenyi), following the manufacturer's instructions. Cell purities were higher than 99 and 92% for the CD3+ and CD20+ cells, respectively, as determined with standard flow cytometry.
[0113] Unsupervised Clustering
[0114] In a first step, as a completely unsupervised approach, hierarchical clustering was performed on all 123 breast tissues of the main set (119 IDCs and 4 normal breast tissues) on the basis of the 10% most variant CpGs between all samples. This has been done also for all samples of the validation set. In both cases, the normal samples were in a single cluster, distinguishable from the breast cancer samples. In a second step, hierarchical clustering was performed only on the 119 IDCs of the main set on the basis of a reduced list of CpGs differentially methylated between IDC and normal tissues. Among the 6,309 CpGs identified as being differentially methylated between IDC and normal samples, those showing a 20% methylation difference in at least 30% of the IDCs as compared to the normal breast samples were chosen. This ensured selection of a reasonable number of CpGs (2,985) having potentially informative variance in our dataset and yielded clusters showing good stability. Complete linkage and distance correlations were used for clustering arrays and CpGs. The stability of the clustering was estimated with the `pvclust` R package (Suzuki, R. & Shimodaira, H. 2006 Bioinformatics 22, 1540-1542), available on CRAN (http://cran.r-project.org/web/packages/pvclust/). The uncertainty in hierarchical clustering was measured by bootstrap stability probabilities ranging from 0 to 1, with 0 indicating poor stability and 1 indicating a very high stability. The bootstrap probability value of a cluster is the frequency that it appears in the bootstrap replicates. These stability values quantify how strong a cluster is supported by data. The criteria used to select the 6 methylation clusters defined in the present invention were: (i) a stability probability of minimum 0.75, and (ii) a minimum number of samples of 8.
[0115] Module/Signature Scores
[0116] The calculation of module/signature scores is described in Desmedt et al., 2008 (Clin. Cancer Res. 14, 5158-5165) and Wirapati et al., 2008 (Breast Cancer Res. 10:R65). Briefly, a signature score, denoted by Rs, was defined as the weighted combination of all the gene expressions in the corresponding signature:
R s = i .di-elect cons. Q w i x i n Q ##EQU00001##
[0117] where Q is the set of genes in the signature, nQ is the number of genes in Q, xi is the expression of gene i, and wi is either -1 or +1 depending on the sign of the statistic/coefficient published in the original study. For the particular cases of the two divided "ESR1 positive" and "ESR1 negative" modules, wi is always equal to +1. For DNA methylation data, signature scores were calculated in a manner similar to that of gene expression data with an additional mapping procedure: each CpG probe was mapped to the corresponding gene through Entrez Gene ID. Each signature score was scaled so that quantiles 2.5% and 97.5% equaled -1 and +1, respectively. This scaling was robust to outliers and ensured that the signature score lay approximately within the [-1,+1] interval, allowing comparison of datasets based on different microarray technologies and normalizations.
[0118] Breast Cancer "Expression Subtype" Determination
[0119] Two approaches were used to determine "breast cancer expression subtypes". First, on the basis of an IHC determination, basal-like tumours were defined as negative for ER and HER2 receptors and as histological grade 3, HER2 tumours as overexpressing the HER2 receptor, and luminal tumours as ER positive and HER2 negative. This last group was divided into luminal A and B tumours corresponding respectively to histological grade 1 and grade 3 tumours. Secondly, the subtypes were identified on the basis of gene expression by applying the Subtype Classification Model as described by Desmedt et al., 2008 (Clin. Cancer Res. 14, 5158-5165) and Wirapati et al.,2008 (Breast Cancer Res. 10:R65). The only difference was in the use of the single probes "205225_at", "216836_s_at" and "208079_s_at" instead of the full ESR1, ERBB2 and AURKA modules, respectively. This simplified version of the Subtype Classification Model was chosen as this model showed excellent performance when applied to the Affymetrix dataset, while reducing the number of genes in the clustering model (data not shown). The `genefu` R package was used, available on CRAN (http://cran.r-project.org/web/packages/genefu/).
[0120] Establishment of the 86 CpG-Classifier
[0121] To transfer class discovery results from one data set to another in order to independently confirm the results, the nearest centroid classification method was used (Sorlie, T. et al., 2003 Proc. Natl Acad. Sci. USA 100, 8418-8423; Lusa, L. et al., 2007 J. Natl Cancer Inst. 99, 1715-1723) for assigning new samples of the validation set to one of the 6 clusters. This method is based on the similarity of the DNA methylation profile of a new sample to the DNA methylation profile of the previously identified clusters. A centroid was defined as the vector containing the median methylation values of all the samples assigned to that cluster in the original hierarchical clustering in the main set. For each new sample, a Spearman rank correlation was calculated between its methylation data and the six centroids; the predicted cluster was defined as the category having the highest correlation value. For training the classifier, those patients in the main set not belonging to any of the 6 most robust clusters were excluded. The Kruskal-Wallis non parametric test was used to find the differently methylated CpGs between the six clusters.
[0122] A ranked CpG list was constructed according to the Kruskal-Wallis test statistic values. In order to find the minimal number of CpGs to be used for the nearest centroid classifier, different classifiers were created from this list and the proportion of correctly classified samples from the main set as compared to the original clustering was calculated. We started with a classifier using the top 5 CpGs most differentially methylated CpGs between the 6 clusters from this list and added one by one an additional CpG from this list up to a total of 1519 (the number of CpGs for which the FDR-adjusted pvalue was 0). At the end, the minimal number of CpGs that yielded the maximum percentage of correct classification (96.38%) was given by 86 (see FIG. 3n and Table 2). Finally, the resulting 86-CpG classifier was applied to the validation dataset to classify the new patients into one of the 6 clusters.
TABLE-US-00002 TABLE 2 SEQ ID NO Name Symbol Gene_ID Synonym Accession 1 cg27610561 SLC2A10 GeneID: 81031 GLUT10; NM_030777.3 MGC126706; 2 cg21570818 FUT5 GeneID: 2527 FUC-TV; NM_002034.2 3 cg08887581 C1orf64 GeneID: 149563 MGC24047; RP11- NM_178840.2 5P18.4; 4 cg14023451 GPLD1 GeneID: 2822 GPIPLD; PIGPLD; NM_001503.2 GPIPLDM; PIGPLD1; MGC22590; 5 cg05215575 FLJ25410 GeneID: 124404 NM_144605.1 6 cg11037787 PLA2G2A GeneID: 5320 MOM1; PLA2; NM_000300.2 PLA2B; PLA2L; PLA2S; PLAS1; sPLA2; 7 cg02671171 RPH3AL GeneID: 9501 NOC2; NM_006987.2 8 cg00294382 IL23A GeneID: 51561 P19; SGRF; IL-23; NM_016584.2 IL-23A; IL23P19; MGC79388; 9 cg02643667 TFF1 GeneID: 7031 pS2; BCEI; HPS2; NM_003225.2 HP1.A; pNR-2; D21S21; 10 cg21137417 SPP2 GeneID: 6694 SPP24; NM_006944.2 11 cg05089968 MGC35308 GeneID: 285800 NM_175922.3 12 cg19456540 SIX6 GeneID: 4990 Six9; OPTX2; NM_007374.1 13 cg14430151 FLJ35725 GeneID: 152992 FLJ12891; NM_152544.1 14 cg04457051 SCOC GeneID: 60592 SCOCO; NM_032547.1 HRIHFB2072; 15 cg08097882 POU4F1 GeneID: 5457 BRN3A; RDC-1; NM_006237.2 FLJ13449; 16 cg25942450 TLX3 GeneID: 30012 RNX; HOX11L2; NM_021025.2 MGC29804; 17 cg08658594 TAS2R13 GeneID: 50838 TRB3; T2R13; NM_023920.2 18 cg02170525 CD8A GeneID: 925 CD8; MAL; p32; NM_001768.4 Leu2; 19 cg02880679 MBTD1 GeneID: 54799 SA49P01; NM_017643.1 FLJ20055; MGC126785; 20 cg13271951 FAM57B GeneID: 83723 FP1188; NM_031478.3 DKFZP434I2117; 21 cg08285151 HDAC9 GeneID: 9734 HD7; HDAC; NM_058176.1 HDRP; MITR; HDAC7; HDAC7B; HDAC9B; HDAC9FL; KIAA0744; DKFZp779K1053; 22 cg05436658 PRKCB1 GeneID: 5579 PKCB; PRKCB; NM_002738.5 PRKCB2; MGC41878; PKC- beta; 23 cg02148642 RGPD5 GeneID: 84220 RGP5; BS-63; NM_032260.2 DKFZp686I1842; 24 cg26189983 TNFRSF1B GeneID: 7133 p75; TBPII; NM_001066.2 TNFBR; TNFR2; CD120b; TNFR80; TNF-R75; p75TNFR; TNF-R- II; 25 cg10707565 CUBN GeneID: 8029 IFCR; MGA1; NM_001081.2 gp280; cubilin; 26 cg23801057 P2RX7 GeneID: 5027 P2X7; MGC20089; NM_002562.4 27 cg23092823 PODN GeneID: 127435 PCAN; SLRR5A; NM_153703.3 MGC24995; 28 cg03503295 DNAH5 GeneID: 1767 HL1; PCD; CILD3; NM_001369.1 DNAHC5; KIAA1603; 29 cg09448880 PGLYRP3 GeneID: 114771 PGRPIA; PGRP- NM_052891.1 Ialpha; 30 cg22194129 CLEC4C GeneID: 170482 DLEC; HECL; NM_130441.2 BDCA2; CD303; CLECSF7; CLECSF11; PRO34150; MGC125791; MGC125792; MGC125793; 31 cg17108819 CD8A GeneID: 925 CD8; MAL; p32; NM_001768.4 Leu2; 32 cg01017147 DNM3 GeneID: 26052 Dyna III; NM_015569.2 KIAA0820; MGC70433; 33 cg18752854 TNS1 GeneID: 7145 TNS; MGC88584; NM_022648.3 34 cg19589427 TNFSF18 GeneID: 8995 TL6; AITRL; NM_005092.2 GITRL; hGITRL; MGC138237; 35 cg21475402 BCAN GeneID: 63827 BEHAB; CSPG7; NM_198427.1 MGC13038; 36 cg10300684 FOXG1B GeneID: 2290 BF1; QIN; FKH2; NM_005249.3 HFK1; FKHL1; FKHL4; HBF-1; 37 cg17095936 TBX19 GeneID: 9095 TPIT; TBS19; TBS19; NM_005149.1 dJ747L4.1; 38 cg01335367 C12orf34 GeneID: 84915 FLJ14721; NM_032829.1 39 cg24525573 C1orf64 GeneID: 149563 MGC24047; RP11- NM_178840.2 5P18.4; 40 cg15604467 POU4F1 GeneID: 5457 BRN3A; RDC-1; NM_006237.2 FLJ13449; 41 cg05181279 RIG GeneID: 10530 XM_932493.1 42 cg19018097 FLJ30934 GeneID: 254122 MGC42112; NM_152760.2 MGC57276; 43 cg06119575 TAL2 GeneID: 6887 NM_005421.1 44 cg14686321 FLJ31951 GeneID: 153830 DKFZp686M11215; NM_144726.1 45 cg10541755 EIF5A2 GeneID: 56648 EIF-5A2; eIF5AII; NM_020390.5 46 cg10334928 STON2 GeneID: 85439 STN2; STNB; NM_033104.2 STNB2; 47 cg11354906 SFRP2 GeneID: 6423 NT_016354.18 48 cg06436504 DOC1 GeneID: 11259 GIP90; NM_182909.1 49 cg17619823 ADRB3 GeneID: 155 BETA3AR; NM_000025.1 50 cg27196745 PTPRO GeneID: 5800 PTPU2; GLEPP1; NM_002848.2 PTP-U2; 51 cg02399455 SRI GeneID: 6717 SCN; NM_198901.1 52 cg11802013 CCND1 GeneID: 595 BCL1; PRAD1; NT_078088.3 U21B31; D11S287E; cyclin D1; 53 cg02595219 KCNE3 GeneID: 10008 HOKPP; MiRP2; NM_005472.3 MGC129924; DKFZp781H21101; 54 cg00596686 STS GeneID: 412 ES; ASC; ARSC; NM_000351.3 SSDD; ARSC1; 55 cg27491887 KCNQ1 GeneID: 3784 LQT; RWS; WRS; NT_009237.17 LQT1; ATFB1; KCNA8; KCNA9; Kv1.9; Kv7.1; KVLQT1; 56 cg05158615 NPY GeneID: 4852 PYY4; NM_000905.2 57 cg20980592 MEP1A GeneID: 4224 PPHA; NM_005588.1 58 cg13696012 BPIL1 GeneID: 80341 RYSR; LPLUNC2; NM_025227.1 C20orf184; dJ726C3.2; 59 cg00953256 CCND1 GeneID: 595 BCL1; PRAD1; NT_078088.3 U21B31; D11S287E; cyclin D1; 60 cg07426960 CCND1 GeneID: 595 BCL1; PRAD1; NT_078088.3 U21B31; D11S287E; cyclin D1; 61 cg01109219 RASGRP3 GeneID: 25780 GRP3; KIAA0846; NM_170672.1 62 cg10968815 BPIL1 GeneID: 80341 RYSR; LPLUNC2; NM_025227.1 C20orf184; dJ726C3.2; 63 cg15046693 CEBPG GeneID: 1054 GPE1BP; IG/EBP- NM_001806.2 1; 64 cg23391785 DNM3 GeneID: 26052 Dyna III; NM_015569.2 KIAA0820; MGC70433; 65 cg00051623 CASP1 GeneID: 834 ICE; P45; IL1BC; NM_033294.2 66 cg13755070 FLI1 GeneID: 2313 EWSR2; SIC-1; NM_002017.2 67 cg02657438 STON2 GeneID: 85439 STN2; STNB; NM_033104.2 STNB2; 68 cg13144783 CCR1 GeneID: 1230 CD191; CKR-1; NM_001295.2 HM145; CMKBR1; MIP1aR; SCYAR1; 69 cg18129786 ZNF445 GeneID: 353274 ZNF168; NM_181489.4 MGC126535; 70 cg02723533 CCND1 GeneID: 595 BCL1; PRAD1; NT_078088.3 U21B31; D11S287E; cyclin D1; 71 cg10964421 TNFRSF10D GeneID: 8793 DCR2; CD264; NT_023666.17 TRUNDD; TRAILR4; 72 cg24199834 POU4F2 GeneID: 5458 BRN3B; BRN3.2; NM_004575.1 Brn-3b; 73 cg14003512 PLGLB2 GeneID: 5342 PLGP1; NM_002665.3 74 cg23642747 INA GeneID: 9118 NEF5; NF-66; NM_032727.2 TXBP-1; MGC12702; 75 cg01424107 CDX2 GeneID: 1045 CDX3; CDX-3; NM_001265.2 76 cg02100848 C3orf32 GeneID: 51066 NM_015931.1 77 cg05056120 EBF GeneID: 1879 COE1; EBF1; NM_024007.2 OLF1; O/E-1; 78 cg00839584 IL1A GeneID: 3552 IL1; IL-1A; IL1F1; NM_000575.3 IL1-ALPHA; 79 cg02681442 FOXG1B GeneID: 2290 BF1; QIN; FKH2; NM_005249.3 HFK1; FKHL1; FKHL4; HBF-1; 80 cg06653796 LIME1 GeneID: 54923 LIME; LP8067; NM_017806.1 FLJ20406; dJ583P15.4; RP4- 583P15.5; 81 cg21296230 GREM1 GeneID: 26585 DRM; PIG2; NM_013372.5 DAND2; IHG-2; GREMLIN; CKTSF1B1; MGC126660; 82 cg11547724 HPX GeneID: 3263 NM_000613.1 83 cg17240454 SPDEF GeneID: 25803 PDEF; bA375E1.3; NM_012391.1 RP11-375E1_A.3; 84 cg08047907 C1orf114 GeneID: 57821 FLJ25846; RP1- NM_021179.1 206D15.2; 85 cg17667972 KRT4 GeneID: 3851 K4; CK4; CYK4; NM_002272.1 FLJ31692; 86 cg07935264 IL1B GeneID: 3553 IL-1; IL1F2; IL1- NM_000576.2 BETA;
[0123] Relapse-Free Survival Analysis
[0124] For the meta-analysis performed on publicly available gene expression data, only the genes displaying a high anti-correlation between their methylation and expression status (Pearson's coefficient below than -0.7) in our main set of patients were selected. Among the 85 genes meeting this criterion, several were eliminated because they were not represented on the microarray platforms (9) or because information for these genes was available for less than 700 patients (15). Six other genes were excluded from this meta-analysis because they did not display differential methylation between normal breast samples and IDCs in our population. The prognostic value of individual CpGs or genes was estimated by univariate Cox regression. Multivariate Cox regression was used to test the independent prognostic values of CpGs or genes of interest in the presence of traditional clinical variables. Cox models were stratified by datasets to account for the possible heterogeneity in patient selection or other potential confounders, as implemented in the `survival` R package available on CRAN (http://cran.r-project.org/web/packages/survival). The significance of individual hazard ratios was estimated by Wald's test. For univariate analysis, the p-values were corrected for multiple testing by means of the false discovery rate (FDR) and variables with a FDR below than 0.1 were considered prognostic. For multivariate analysis, variables with a p-value below than 0.05 were considered prognostic.
[0125] Annotation of Infinium Array in Terms of CpG Location
[0126] Additional annotations of the Infinium array were added to the ones provided by Illumina regarding the location of the CpG (i) versus CGI (CpG inside a CGI, CpG island shore, other CpG) and (ii) versus promoter classes (High-, Intermediated or Low-CpG-density promoter).
[0127] CpG Location Versus CGI
[0128] CpGs were classified according to their position relatively to CpG islands (i.e. CpG inside a CGI, CpG island shore or other CpG). Two classifications were established, and this in function of the CGI definition used: the UCSC definition (CpG_Island_UCSC classification) or the improved and revisited definition of Bock et al., 2007 PLoS Comput. Biol. 3, 1055-1070 (CpG_Island_Revisited classification). A CpG was considered as a CpG island shore if it was located inside a 2 kb region around a CGI (as defined by Irizarry et al., 2009 Nat. Genet. 41, 178-186). A CpG located neither in a CGI nor in a 2 kb region around a CGI was considered as other CpG. The revisited classification by Bock et al. for all analyses.
[0129] CpG Location Versus Promoter Classes
[0130] Promoters represented on the Infinium array were categorized using their CpG content as defined by Weber et al., 2007 (Nat. Genet. 39, 457-466). First, regions from -700 to +500 bp surrounding the transcription start site (TSS) were extracted using the UCSC genome browser data (Rhead et al., 2010 Nucleic Acids Res. 38, D613-619). Then, using the DNA sequences corresponding to those promoter fragments, the CpG ratio and the GC content were calculated in sliding windows of 500 bp with 5 bp offsets. Finally, according to the definition provided by Weber et al., 2007, the promoters were classified as HCPs (High-CpG-density promoters) if a least one 500 by window contains a CpG ratio >0.75 and a GC content >0.55 was found; as LCPs (Low-CpGdensity promoters) if no 500 bp window has reached a CpG ratio of 0.48; or as ICPs (Intermediate-CpG-density promoters) otherwise.
[0131] Methylation Difference Criterion
[0132] Several indications led us to choose 20% as the methylation difference criterion. First, it seemed that the Infinium assay gave values ranging from 0 to 0.2 for unmethylated CpGs. Second, a recent study has shown that for more than 90% of the loci, the sensitivity of methylation difference detection is 0.2 (Bibikova, M. et al., 2009 Epigenomics 1, 177-200).
[0133] Class Comparison Analyses in the Main Set of Patients
[0134] A two-sided Mann-Whitney test (also called Wilcoxon-Mann-Whitney test) was employed to test the null hypothesis (HO) assumption of equality of the methylation values in two defined groups of data. The loss of power induced by multiple tests was corrected by the false discovery rate (FDR) approach (Benjamini, Y. & Hochberg, Y. 1995 J R Stat Soc Series B 57, 289-300). For normal samples we considered the mean of methylation values, because of the small sample size and the low variance. For tumour samples, because of their higher heterogeneity, we considered the median value, less sensitive to extreme values.
[0135] Between IDCs and Normal Breast Tissue Samples
[0136] A particular CpG was considered hyper- or hypo-methylated in IDCs as compared to normal breast tissue samples according to the following two criteria: 1/ the CpG had to show at least a 20% methylation difference in IDCs as compared to normal breast tissue samples in at least 10% of the IDCs; 2/ to be considered hypermethylated, the CpG had to show at least ten times more hypermethylation events than hypomethylation events in breast cancer. Conversely, to be considered hypomethylated, it had to show at least ten times more hypomethylation events than hypermethylation events in breast cancer.
[0137] Between the Two Main Clusters, I and II
[0138] CpGs differentially methylated between clusters I and II were determined according to these two criteria: 1/ they had to show a methylation difference of at least 20% between the two groups; 2/ the FDR-corrected Wilcoxon p-value for the concerned CpGs had to be lower than 0.1.
[0139] Between Each Methylation Subcluster and Normal Breast Tissue Samples
[0140] The criteria for determining that a given methylation subcluster showed differential methylation with respect to normal breast tissue samples were: 1/ The CpGs concerned had to show a difference in methylation of at least 20% between the two groups; 2/ the Wilcoxon p-value for the CpGs concerned had to be lower than 0.01. Here, the FDR criterion as described above was not used, because of the small number of samples composing each group.
[0141] Bisulphite Genomic Sequencing
[0142] Methylation status of four CpG sites--cg07471052, cg11566244, cg22498251 and cg09847584--located respectively near the transcription start sites of the CDK3, GSTP1, TWIST1 and RIMBP2 genes, was examined by bisulphite genomic sequencing applied to 1 normal (N1) and 3 breast cancer (BC10, BC32 and BC109) samples. Primers were designed manually and sequences are provided in Table 3. The PCR amplified fragments were purified by QIAquick® Gel Extraction kit (Qiagen), cloned into the pCR®II-TOPO® vector (Invitrogen, Carlsbad, Calif., USA), and used to transform competent Escherichia coli TOP10 cells. Clones were selected by blue/white colonie screening and amplified. Plasmids were purified with the Qiagen-MiniPrep kit (Qiagen). The PCR products were sequenced by Genoscreen (Lille, France) and CpG methylation status were analysed with the BiQ Analyzer software as described by Bock et al.,2005 (Bioinformatics 21, 4067-4068).
TABLE-US-00003 TABLE 3 Primers used for bisulphite genomic sequencing (Respective SEQ ID Nos 513-529) Annealing Gene PCR round Sequence 5'-3' temperature CDK3 PCR1 Forward: gtttagaggggttttttgattatttg 50° C. Reverse: aactcctacaactccaaaaaattc PCR2 Forward: gagggaatagttggaatgtattttg 45° C. Reverse: ctaaactactatttcctactaactac GSTP1 PCR1 Forward: ggtttagagtttttagtatggggtt 50° C. Reverse: actctaaccctaatctaccaacaa PCR2 Forward: aggtaggagtatgtgtttggtag 50° C. Reverse: tcaaaaatacaaaaaaaaaacaaaa TWIST1 PCR1 Forward: ggtttggtttttggaattttaaggg 50° C. Reverse: aaaacaacaatatcattaacctaac PCR2 Forward: gtttatttgattattgggtgggttt 50° C. Reverse: ctataacaacaacaataacaacaac RIMBP2 PCR1 Forward: aaatatgggggtattattttatatg 50° C. Reverse: ccttactattaaaaatacaaatacc PCR2 Forward: atgaattgaaggatgttatttaggg 50° C. Reverse: aaacttccaaacaaaaataaccaac
[0143] Bisulphite Pyrosequencing
[0144] 750 ng of genomic DNA were bisulphite-converted using the EZ DNA Methylation® kit (Zymo Research) as for DNA methylation profiling. One third of the converted DNA was used as template for each subsequent PCR. To ensure sufficient amount of PCR product for sequencing nested PCRs were performed. PCR primers for pre-amplification (EF, ER primers) were deduced manually or with the help of "BiSearch Primer Design and Search Tool" (http://bisearch.enzim.hu) and checked for tendency to form oligomers, hairpin loops etc. using the Generunner software (version 3.05, Hastings Software Inc.). Primers for nested amplification and sequencing were deduced manually or using PyroMark® Assay Design 2.0 software (Qiagen). Pre-amplification PCRs were conducted with 3 mM MgCl2, 1 mM of each dNTP, 12% (v/v) DMSO, 500 nM of each primer (EF+ER primers, see Table 4) and optionally 500 mM Betaine in heated-lid thermocyclers under the following conditions: 95° C. 3:00; 25 cycles of [94° C. 0:30; 51° C. 0:40; 72° C. 1:30]; 72° C. 5:00. Nested amplifications (F, RBio primers) were performed with the HotStarTaq PCR kit (Qiagen) using 2% (v/v) of the pre-amplification PCR as template under the following conditions: 95° C. 15:00; 45 cycles of [94° C. 0:30; 55° C. 0:30; 72° C. 0:30]; 72° C. 10:00. Amplification success was assessed with agarose gel electrophoresis and pyrosequencing of the PCR products (S primers) was performed with the Pyromark® Q24 system (Qiagen).
TABLE-US-00004 TABLE 4 Primers used for bisulphite pyrosequencing (Respective SEQ ID Nos 530 to 575) primer name primer sequence (5' to 3') CD3D_EF TGTGTAAATGTGGTTGTATTGTTAATAGG CD3D_ER CATCATATTACTCAAACTAATCTCAAACTCC CD3D-F2 GTGATTTGGTTTTATTTATTGGATGAGT CD3D-R2Bio [Btn]AATAAACCTCACTCCCATCAAT CD3-S2 GGTTTTATTTATTGGATGAGTTT CD3D-S2A-cg077 GGTTTGGTATTGGTTATTTTTT CD3G_EF GGTATTTGTATTTGTAGTTTTGTTGAGG CD3G_ER TTCTCCTCCATAAAACACTATTTCTCTC CD3G-F1 TGATGGGTGGAGTTAGTTTAGT CD3G-R1Bio [Btn]AAACCCTTCCCCTATTCCATA CD3G-S1 GGTTGGTTGTTAAGGG CD6_EF2 GGGGAAGTGTGTTTGTATGGATG CD6_ER AAACCACATATCTAAAACTATCTCTAACTACTAC CD6-F1 AGGTAGTTGGGGTTTTTTTTATTAG CD6-R1Bio [Btn]CTACCCTTTACTATTCTTATTCCTATATC CD6-S1 ATATTTATAGGTTGGGTTTG CD79B_EF TAGGTAGGAGAGGAATTGGGGTTATAG CD79B_ER CATCCACAAAAAACCCCAACTATACTAC CD79B-F1 AGTTGGAGATGAGAGTAAATTTTATAGG CD79B-R1Bio [Btn]AATACCTCCCCTAAATCCCAATTTACAT CD79B-S1 GGTTGGGTATAGGAGATA HCLS1_EF TTATTGTTAAAATTTTGTAAAAGATTAGGTATAG HCLS1_ER TTCCTCCTCAACTCTTACTCTATATTTCC HCLS1-F1 AGGATGGGGTGGTAGGAAAT HCLS1-R1Bio [Btn]CCTCCACCTATACAAACCTCTATTCTA HCLS1-S1 GGGTGGTAGGAAATG ICOS_EF TAAGTAGGTAATTTAAAAATTTAATGGTTTGATG ICOS_ER CCTCTATCTTCAAAATCATCAATAATCCATAC ICOS-F1 GAGGTTTGATTTTATGTTTGTTAGAAATAG ICOS-R1Bio [Btn]TCCCAAAAAACCCACTTCC ICOS-S1 TTTGTTAGAAATAGTTAATAGTTTT LCK_EF GGTTTATGGTGGTAGGAAGTTTGG LCK_ER TTAACACCTAACTATCCATATACCTAATATCC LCK-F1 GTTAGGTTAGGTTAGGAGGATTAT LCK-R1Bio [Btn]CCAACCACAAAAAACTACTACATC LCK-S2 GAGAGTTGGTATTGGGGG SIT1_EF GTAGTGTGTTTGTGGATTTTTATATTTGTAG SIT1_ER ATCTAATCAACAACTTATCCTTCCTCCTAC SIT1-F1 GTGGGTTTTTTTAGGGGTTGTGA SIT1-R1Bio [Btn]TCTCAATCAACCCATCCCTATTA SIT1-S1 GTTGTGAAGTTGTTATTTTTTATTT UBASH3A-EF2 TGGTGGAAATAGTTAGGATTGGTG UBASH3A-ER CAATATCTTACCCTACAAAATACACTACTTTAAC UBASH3A-F1 GGTTTAAGGGTAGGAAGAGATGG UBASH3A-R1Bio [Btn]ACTAACTAAACCCCCAAATCTCTAAACAAT UBASH3A-S1 GTAGGAAGAGATGGTAG
[0145] Gene Set Enrichment Analysis (GSEA)
[0146] GSEA is a powerful analytical method first developed to determine if the members of a given gene set are significantly enriched among the genes most differentially expressed between two sample groups (Mootha, V. K. et al.2003 Nat. Genet. 34, 267-273). Here this method was applied to both the methylation and expression data to assess the possibility that ER biology might be regulated by DNA methylation. For this, it was hypothesized that the ESR1 module genes were more highly methylated in cluster I ("ER-negative tumours") than in cluster II ("ER-positive tumours"). For this analysis, the ESR1 module described by Desmedt et al., 2008 (Clin. Cancer Res. 14, 5158-5165) had to be divided into two submodules: an ESR1-positive module, containing all ESR1 module genes whose expression correlates positively with ESR1 expression, and an ESR1-negative module containing those whose expression correlates negatively with ESR1 expression. All 14,475 genes represented on the bead array were ranked from the most hypermethylated to the most hypomethylated in cluster I with respect to cluster II. The signal-to-noise ratio (the difference in means of the two classes divided by the sum of the standard deviations of the two classes) was used to perform the ranking. When a gene was represented by several probes on the bead array, the most variant one was selected for this analysis. The 20,606 genes represented on the Affymetrix array were ranked according to the same method. The goal of this GSEA analysis was to determine whether the ESR1 module genes are randomly distributed throughout the ranked lists (suggesting no enrichment of these gene sets in one of the two clusters) or primarily found at the top or bottom (suggesting an enrichment of these gene sets in one of the two clusters). A running sum statistic, corresponding to the enrichment score, was calculated for each gene set on the basis of the ranks of the investigated gene set members, relative to those of the non-members. The significance of such enrichments was estimated by calculating a permutation-based p-value corrected for multiple tests by the false discovery rate (FDR) approach. This analysis was performed with the freely accessible software GSEA-P, provided by the Broad Institute (http://www.broadinstitute.org/gsea/). This GSEA technique has been described in detail by Subramanian et al., 2005 (Proc. Natl Acad. Sci. USA 102, 15545-15550).
[0147] Correlation Between Methylation and Expression Data
[0148] The correlation between methylation and expression data in the main set of patients was evaluated by Pearson's correlation test between each Infinium methylation probe and the most variant Affymetrix expression probe for the gene concerned. Infinium methylation probes presenting values with a range lower than 20% were excluded from this analysis. The range was calculated by subtracting the smallest methylation value from the greatest one for each probe.
[0149] Gene Ontology Analysis
[0150] Gene ontology analysis was done with DAVID (http://david.abcc.ncifcrf.gov/), a web-accessible program providing a comprehensive set of functional annotation tools for understanding the biological meaning of large lists of genes (Huang, D. W. et al., 2009 Nat. Protoc. 4, 44-57). Only genes differentially methylated between each subcluster and normal breast samples and displaying an acceptable anti-correlation between their methylation and expression status (Pearson's coefficient below than -0.4) were selected for this analysis. This ensured the selection of genes whose expression is affected by methylation changes, facilitating the biological interpretation of results.
[0151] Collection of Publicly Available Gene Expression Datasets
[0152] Gene expression datasets were retrieved from public databases or authors' websites. We used normalized data (log2 intensity in single-channel platforms or log 2 ratio in dual-channel platforms). Hybridization probes were mapped to Entrez GeneID as described33 using RefSeq and Entrez database version 2007 Jan. 21. When multiple probes were mapped to the same GeneID, the one with the highest variance in a particular dataset was selected. Ten breast cancer microarray datasets were used. Distant metastasis-free survival (DMFS) was used as survival endpoint. We censored the survival data at 10 years in order to have comparable follow-up across the different studies as described (Desmedt, C. et al., 2008 Clin. Cancer Res. 14, 5158-516517,34; Haibe-Kains, B. et al., 2008 Bioinformatics 24, 2200-2208).
[0153] Treatment of Breast Cancer Epithelial Cell Lines with 5-aza-2'-deoxycytidine
[0154] Breast cancer epithelial cell lines MCF-7, MDA-MB-231, MDA-MB-361, T47D, SKBR3, BT20 and ZR-75-1 were treated with 1 μM of 5-aza-2'-deoxycytidine (Sigma) during 4 days. Medium containing the drug was refreshed every day.
[0155] Additional Statistical Analyses
[0156] Spearman's correlation was used to compare Infinium data with bisulphite genomic sequencing or pyrosequencing data. The Mann-Whitney U test and the Kruskal-Wallis test were used to test for differences of a continuous variable between two or multiple subgroups, respectively. Chi-square tests were used to compare discrete variables and the p-values were estimated by the likelihood ratio or Fisher's Exact test (for comparison of binary variables). The Phi coefficient was used to determine the strength of associations between the "known expression subtypes" of breast cancer and our DNA methylation-based clusters. The values range from 0 to 1, and can be interpreted in a similar way to Spearman's rank correlation coefficient. The significance of such associations was computed by means of a chi-square test.
Example 1
Infinium Methylation Platform Analysis of DNA Methylation Profiling of Two Independent Sets of Frozen Breast Tissue Samples
[0157] A "main set" of 123 samples (4 normal and 119 infiltrating ductal carcinomas, IDCs), and a "validation set" of 125 samples (8 normal and 117 IDCs) (FIG. 1a; see Supplementary Tables S1, S2 and S15) were analysed using the Infinium® methylation platform. The high-throughput Infinium technique, based on hybridization of bisulphite-converted gDNA on methylation-specific DNA oligomers, allows quantification of methylation levels at 27,578 CpG sites located within the promoter regions (and preferentially within CpG islands) of 14,475 consensus coding sequences and well-known cancer genes (Bibikova, M. et al. 2009 Epigenomics 1, 177-200).
[0158] When applied to the main set of breast tissues, this method revealed 6,309 CpGs showing differential methylation between normal samples and IDCs. Validation of these data is depicted in Table 5 and FIG. 1b-c. In terms of CpG location with respect to CpG islands (CGI), we found the hypermethylated CpGs to be mostly located inside CGI, whereas the hypomethylated CpGs were located principally outside of CGI (FIG. 1a, left part). More than a fourth of the CpG island shores presented on the array displayed differential methylation between normal samples and IDCs, suggesting an important role of differential methylation of CpG island shores in cancer, consistently with earlier work Irizarry, (R. A. et al., 2009 Nat. Genet. 41, 178-186). Further, besides the well-described differential methylation of High-CpG-density promoters (HCPs)1, we found even more pronounced methylation changes at Intermediate- and Low- CpG-density promoters (ICPs and LCPs, respectively) (FIG. 1a, right part). Notably, ICPs (also called weak HCPs) seem to be highly susceptible to de novo DNA methylation (FIG. 1a, right part), in agreement with previous studies (Weber, M. et al., 2007 Nat. Genet. 39, 457-466).
TABLE-US-00005 TABLE 5 Methylation frequencies of representative CpGs provided by this Infinium study and their correlation with previously reported data. Reported Correlation Strand Infinium methylation Infinium analysed methylation data frequency, vs. reported Illumina by Coding frequency, % % (number); methylation Gene ID Infinium strand (number).sup.Δ technique° data* RASSF1A cg00777121 Top Bottom 71 (85/119) 70 (19/27); MSP42 ++ 56 (14/25); MSP43 ++ 58 (52/90); MSP8 ++ cg08047457 Top Bottom 72 (86/119) 65 (11/17); MSP44 ++ cg21554552 Bottom Bottom 70 (83/119) 65 (11/17); MSP44 ++ CCND2 cg25425078 Bottom Top 9 (11/119) 46 (49/106); MSP45 + 28 (10/36); MSP46 + 55 (71/130); MSP + APC cg16970232 Top Top 39 (46/119) 45 (19/42); MSP4 ++ 28 (15/54); MSP48 ++ 39 (51/130); MSP7 ++ 49(74/151) MSP49 ++ cg20311501 Bottom Top 35 (42/119) 45 (19/42); MSP47 ++ 28 (15/54); MSP48 ++ 39 (51/130); MSP ++ 49 (74/151); MSP49 ++ RARβ2 cg27486427 Top Top 12 (14/119) 17 (15/90); BPS8 ++ 0 (0/21); BPS50 + cg26124016 Bottom Top 4 (5/119) 23 (37/160); MSP51 + CDH13 cg08747377 Top Top 17 (20/119) 33 (18/55); MSP52 ++ SDHB cg24305835 Top Bottom 0 (0/119) 0 (0/72); MS-HRM53 ++ cg03861428 Bottom Bottom 0 (0/119) 0 (0/72); MS-HRM53 ++ FH cg06806184 Top Bottom 0 (0/119) 0 (0/72); MS-HRM53 ++ .sup.ΔEach tumour identified as positive shows at least 20% hypermethylation of the indicated CpG site as compared to the mean methylation level of normal samples. °For MSP data, to avoid any discrepancy due to a different location of PCR primers and of the CpG investigated by the Infinium technique, we selected only CpGs included in the primer sequences used for the MSP analyses. *Based on the hypothesis that all reference papers check methylation on the coding strand and that methylation is symmetrical between the two strands. MSP: Methylation-Specific PCR; BPS: Bisulphite PyrosSequencing; MS-HRM: Methylation-Sensitive High Resolution Melting MSP: Methylation-Specific PCR; BPS: Bisulphite PyroSequencing; MS-HRM: Methylation-Sensitive High Resolution Melting indicates data missing or illegible when filed
Example 2
Establishing DNA Methylation Profiles That Might Have Biological and Clinical Relevance
[0159] An unsupervised hierarchical cluster analysis was performed of the 119 IDCs of the main set, using a reduced list of CpGs showing differential methylation between normal samples and IDCs (2,985 of them). There emerged two major clusters (I and II), with a significant correlation between cluster membership and both tumour grade and oestrogen receptor (ER) status (FIG. 2). Clusters I and II were enriched in ER-negative and ER-positive tumours, respectively. Importantly, gene expression studies have revealed that clinical biomarkers like ER and HER2 are just the tip of the iceberg, reflecting whole sets of tumour features not obviously related to the marker status. This reality can be captured with gene co-expression modules, i.e. comprehensive lists of genes connected to different biological processes and showing highly correlated expression. One of the most discriminating co-expression modules is the ESR1 module (Desmedt, C. et al., 2008 Clin. Cancer Res. 14, 5158-5165). It comprises ERpathway genes but also genes involved in other biological processes distinguishing ERpositive from ER-negative tumours. We therefore next examined to what extent ESR1 genes might be regulated at the epigenetic level. We divided the previously described ESR1 module in two sub-modules, an "ESR1-positive" and an "ESR1-negative" module comprising, respectively, the genes whose expression correlates positively or negatively with that of ESR1 (cf. Tables 5b and 5c). As shown in box plots and barcode plots derived from Gene Set Enrichment Analysis, ESR1-positive-module genes showed higher methylation levels in cluster I than in cluster II (Mann-Whitney test: p<0.001; see FIG. 2c,d). Conversely, ESR1-negative-module genes showed significantly higher methylation levels in cluster II than in cluster I (Mann-Whitney test: p<0.001; see FIG. 2b,c). Gene expression microarray analysis revealed a significant anti-correlation between the DNA methylation levels of these genes and their corresponding gene expression levels (FIG. 2b,c). Overall, the above results are striking: they suggest, for the first time, that whole sets of genes, involved in processes far beyond ER biology and whose expression status distinguishes ER-positive from ER-negative tumours, are epigenetically regulated. In FIG. 2d, the clinical parameters were linked to the methylation-based clustering identified above, showing that ERpositive tumours were predominant in cluster II, whereas cluster I seemed to contain a moderately higher number of HER2-positive tumours. Grade 1 tumours were grouped in cluster II. No significant association with tumour size, nodal status, or age was found.
TABLE-US-00006 TABLE 5B CpG islands of the ESR1-positive module: SEQ Entrez ID Gene Methylation Expression No. ID SYMBOL Affy_ID coefficient Illumina_ID Enrichment Enrichment 87 60481 ELOVL5 208788_at 0.58255236 cg00024396 Cluster II 88 55163 PNPO 218511_s_at 0.25550698 cg00177698 Cluster II 89 1389 CREBL2 201990_s_at 0.46886638 cg00261552 90 5193 PEX12 205094_at 0.46553499 cg00425792 Cluster II 91 2013 EMP2 204975_at 0.42107786 cg00451635 Cluster I Cluster II 92 7764 ZNF217 203739_at 0.27600069 cg00476577 93 79921 TCEAL4 202371_at 0.54197015 cg00662775 Cluster II 94 26504 CNNM4 218900_at 0.29928358 cg00711916 Cluster II 95 21 ABCA3 204343_at 0.47676852 cg00949442 Cluster II 96 57758 SCUBE2 219197_s_at 0.70630729 cg01081263 Cluster I Cluster II 97 6834 SURF1 204295_at 0.36049855 cg01309153 98 51181 DCXR 217973_at 0.29980425 cg01350700 Cluster II 99 55224 ETNK2 219268_at 0.40059475 cg01566404 Cluster II 100 4682 NUBP1 203978_at 0.24451989 cg01808090 101 5241 PGR 208305_at 0.5079683 cg01987509 Cluster II 102 4255 MGMT 204880_at 0.30601436 cg02330106 103 214 ALCAM 201951_at 0.3571957 cg02582608 Cluster II 104 7031 TFF1 205009_at 0.6449711 cg02643667 Cluster I Cluster II 105 9501 RPH3AL 221614_s_at 0.48934572 cg02671171 Cluster II 106 6019 RLN2 214519_s_at 0.34013126 cg02875297 Cluster II 107 10307 APBB3 204650_s_at 0.3461012 cg02995853 Cluster II 108 51368 TEX264 218548_x_at 0.43540945 cg03019000 Cluster I Cluster II 109 3169 FOXA1 204667_at 0.74774031 cg03026462 Cluster I Cluster II 110 64080 RBKS 57540_at 0.50109894 cg03177025 Cluster II 111 10267 RAMP1 204916_at 0.33122019 cg03270167 Cluster II 112 60686 C14orf93 219009_at 0.24607044 cg03565081 Cluster II 113 5191 PEX7 205420_at 0.3969911 cg03807235 114 582 BBS1 218471_s_at 0.60797534 cg03851112 Cluster II 115 54847 SIDT1 219734_at 0.45717531 cg03977782 Cluster II 116 126353 C19orf21 212925_at 0.4486083 cg04245402 Cluster II 117 9633 MTL5 219786_at 0.56176337 cg04438497 Cluster II 118 11122 PTPRT 205948_at 0.44195895 cg04541293 Cluster II 119 50865 HEBP1 218450_at 0.44656123 cg04588079 Cluster I Cluster II 120 753 C18orf1 207996_s_at 0.42386263 cg04633384 Cluster II 121 10614 HEXIM1 202815_s_at 0.5516074 cg04700814 Cluster I Cluster II 122 7033 TFF3 204623_at 0.61621987 cg04806409 Cluster II 123 8187 ZNF239 206261_at 0.27306458 cg04825431 124 771 CA12 204508_s_at 0.76966447 cg04826883 Cluster II 125 51207 DUSP13 219963_at 0.29595767 cg04834572 Cluster II 126 55188 RIC8B 219446_at 0.34248633 cg04916200 Cluster II 127 22885 ABLIM3 205730_s_at 0.44622382 cg05026186 Cluster II 128 81563 C1orf21 221272_s_at 0.48956231 cg05135156 Cluster II 129 10265 IRX5 210239_at 0.44423877 cg05266781 Cluster I Cluster II 130 79603 LASS4 218922_s_at 0.44467496 cg05346899 Cluster II 131 79885 HDAC11 219847_at 0.50364052 cg05446471 Cluster I 132 11226 GALNT6 219956_at 0.3952831 cg05565537 Cluster II 133 79669 C3orf52 219474_at 0.38844228 cg05570980 Cluster II 134 10519 CIB1 201953_at 0.31818779 cg05641961 135 23171 GPD1L 212510_at 0.54491467 cg05662500 Cluster II 136 819 CAMLG 203538_at 0.47069771 cg05705583 Cluster II 137 1632 DCI 209759_s_at 0.5213171 cg05824432 Cluster II 138 10079 ATP9A 212062_at 0.32828286 cg05851042 139 23107 MRPS27 212145_at 0.40636664 cg05903630 Cluster II 140 12 SERPINA3 202376_at 0.43012865 cg06190732 Cluster II 141 2625 GATA3 209602_s_at 0.80840445 cg06230736 Cluster II 142 8405 SPOP 208927_at 0.27075407 cg06291334 143 6652 SORD 201563_at 0.3946522 cg06424894 Cluster II 144 55793 FAM63A 221856_s_at 0.58660889 cg06433658 Cluster I 145 9052 GPRC5A 203108_at 0.34643392 cg06776256 Cluster I Cluster II 146 8722 CTSF 203657_s_at 0.43611 cg06817264 Cluster II 147 5269 SERPINB6 211474_s_at 0.46113414 cg06945625 Cluster II 148 1101 CHAD 206869_at 0.5267707 cg06958829 Cluster I Cluster II 149 2066 ERBB4 214053_at 0.70552413 cg07015629 Cluster II 150 51306 C5orf5 218518_at 0.5288126 cg07048066 Cluster II 151 25915 C3orf60 209177_at 0.27572801 cg07109801 Cluster II 152 7138 TNNT1 213201_s_at 0.33161148 cg07189381 Cluster II 153 51604 PIGT 217770_at 0.51423124 cg07294870 Cluster II 154 8416 ANXA9 210085_s_at 0.6000835 cg07337598 Cluster I Cluster II 155 55218 EXDL2 218363_at 0.40149833 cg07366967 Cluster II 156 22977 AKR7A3 206469_x_at 0.49969396 cg07447773 Cluster I Cluster II 157 10002 NR2E3 208388_at 0.40777521 cg07890954 Cluster II 158 89927 C16orf45 212736_at 0.49149582 cg07977490 Cluster II 159 54820 NDE1 218414_s_at 0.28208014 cg08081725 Cluster I 160 8310 ACOX3 204242_s_at 0.2875821 cg08083689 Cluster II 161 6787 NEK4 204634_at 0.43835459 cg08090396 Cluster II 162 55450 CAMK2N1 218309_at 0.37066024 cg08398233 Cluster I Cluster II 163 10309 UNG2 210021_s_at 0.34040691 cg08514736 Cluster II 164 55733 HHAT 219687_at 0.57829406 cg09276883 Cluster II 165 25790 CCDC19 220308_at 0.2863511 cg09451092 Cluster I 166 3295 HSD17B4 201413_at 0.49793269 cg09486093 Cluster II 167 5016 OVGP1 205432_at 0.34020467 cg09558502 168 1877 E4F1 218524_at 0.40033795 cg09615982 169 5816 PVALB 205336_at 0.22735879 cg09863066 Cluster II 170 5825 ABCD3 202850_at 0.47855837 cg09869791 Cluster II 171 3667 IRS1 204686_at 0.57148821 cg10098888 Cluster I Cluster II 172 2530 FUT8 203988_s_at 0.50553001 cg10225525 Cluster II 173 7993 UBXD6 215983_s_at 0.38287893 cg10301990 Cluster II 174 5174 PDZK1 205380_at 0.54605106 cg10321723 Cluster I Cluster II 175 1501 CTNND2 209618_at 0.27327605 cg10331779 Cluster I Cluster II 176 3622 ING2 205981_s_at 0.29062248 cg10348863 Cluster II 177 6926 TBX3 219682_s_at 0.4677582 cg10530281 Cluster II 178 54903 MKS1 218630_at 0.24804067 cg10728503 179 51004 COQ6 218760_at 0.40443291 cg10784821 Cluster II 180 79170 ATAD4 219127_at 0.37327143 cg10878307 Cluster I Cluster II 181 2954 GSTZ1 209531_at 0.33474043 cg11193041 Cluster II 182 4602 MYB 204798_at 0.72436025 cg11579069 Cluster II 183 23158 TBC1D9 212956_at 0.81885393 cg11843691 Cluster II 184 9120 SLC16A6 207038_at 0.54887717 cg11879514 Cluster II 185 9674 KIAA0040 203143_s_at 0.53208827 cg11908570 Cluster II 186 23245 ASTN2 215407_s_at 0.43227295 cg12024292 Cluster II 187 5327 PLAT 201860_s_at 0.44627615 cg12091331 Cluster I Cluster II 188 1345 COX6C 201754_at 0.53994131 cg12125691 Cluster II 189 56521 DNAJC12 218976_at 0.65414762 cg12315959 Cluster II 190 2813 GP2 214324_at 0.3462389 cg12554476 Cluster I Cluster II 191 5783 PTPN13 204201_s_at 0.39210976 cg12647643 Cluster II 192 7286 TUFT1 205807_s_at 0.32428768 cg12729048 Cluster II 193 4485 MST1 205614_x_at 0.35745042 cg12788313 Cluster II 194 55650 PIGV 51146_at 0.42058252 cg12806381 Cluster II 195 79818 ZNF552 219741_x_at 0.61082014 cg12983442 Cluster II 196 6833 ABCC8 210246_s_at 0.43299799 cg13185308 Cluster II 197 4036 LRP2 205710_at 0.35025477 cg13436799 Cluster II 198 55699 IARS2 217900_at 0.23087069 cg13530946 199 54898 ELOVL2 213712_at 0.52925655 cg13562911 Cluster II 200 427 ASAH1 210980_s_at 0.47414718 cg13563405 Cluster II 201 347902 AMIGO2 222108_at 0.36104055 cg13640200 Cluster II 202 23613 PRKCBP1 209049_s_at 0.29980727 cg13699808 Cluster II 203 8309 ACOX2 205364_at 0.4083166 cg13705284 Cluster I Cluster II 204 8382 NMES 206197_at 0.55521067 cg13707560 Cluster I Cluster II 205 863 CBFA2T3 208056_s_at 0.34439279 cg13745346 Cluster II 206 64087 MCCC2 209624_s_at 0.46285733 cg13793354 Cluster II 207 323 APBB2 213419_at 0.5072429 cg13842258 Cluster II 208 25823 TPSG1 220339_s_at 0.37387841 cg13997068 Cluster II 209 56674 TMEM9B 218065_s_at 0.52812741 cg14205126 Cluster II 210 29116 MYLIP 220319_s_at 0.37379359 cg14298379 Cluster II 211 23541 SEC14L2 204541_at 0.44986387 cg14452140 Cluster I Cluster II 212 10140 TOB1 202704_at 0.36762247 cg14494812 Cluster I 213 64428 NARFL 218742_at 0.20385725 cg14711016 214 6720 SREBF1 202308_at 0.41745005 cg14808739 Cluster II 215 79622 C16orf33 218493_at 0.31308351 cg14820573 Cluster II 216 6548 SLC9A1 209453_at 0.26654189 cg15076659 217 51097 SCCPDH 201825_s_at 0.59486345 cg15210596 Cluster II 218 2099 ESR1 205225_at 1 cg15626350 Cluster I Cluster II 219 64215 DNAJC1 218409_s_at 0.30939108 cg15818800 Cluster II 220 4350 MPG 203686_at 0.34167694 cg16003913 Cluster II 221 25980 C20orf4 218089_at 0.20311663 cg16016641 Cluster II 222 79602 ADIPOR2 201346_at 0.29463646 cg16245844 Cluster II 223 3306 HSPA2 211538_s_at 0.3956746 cg16319578 Cluster II 224 23552 CCRK 205271_s_at 0.28188064 cg16386080 225 55316 RSAD1 218307_at 0.3299015 cg16413777 226 5002 SLC22A18 204981_at 0.498451 cg16873863 Cluster II 227 9518 GDF15 221577_x_at 0.40270729 cg16929104 Cluster I Cluster II 228 5104 SERPINA5 209443_at 0.55261579 cg16937611 Cluster II 229 8870 IER3 201631_s_at 0.29324048 cg17067528 230 9722 NOS1AP 215153_at 0.22934089 cg17096191 Cluster II 231 83464 APH1B 221036_s_at 0.38272656 cg17207590 Cluster I 232 10273 STUB1 217934_x_at 0.41337688 cg17328659 233 58495 OVOL2 211778_s_at 0.50985425 cg17404915 Cluster I Cluster II 234 4285 MIPEP 36830_at 0.35646337 cg17436805 Cluster II 235 9851 KIAA0753 204711_at 0.33776741 cg17452257 236 2737 GLI3 205201_at 0.52149467 cg17530977 Cluster II 237 81539 SLC38A1 218237_s_at 0.2417025 cg17726022 238 629 CFB 202357_s_at 0.32594788 cg17741572 Cluster I Cluster II 239 27239 GPR162 205056_s_at 0.26732712 cg17805404 240 2203 FBP1 209696_at 0.66601785 cg17814481 Cluster I Cluster II 241 23528 ZNF281 218401_s_at 0.37912728 cg17918239 Cluster II 242 1153 CIRBP 200810_s_at 0.64437699 cg18194038 Cluster II 243 51706 CYB5R1 202263_at 0.48001447 cg18275051 Cluster II 244 25864 ABHD14A 210006_at 0.4312276 cg18328933 Cluster I Cluster II 245 2743 GLRB 205280_at 0.48052565 cg18344745 Cluster I Cluster II 246 7163 TPD52 201691_s_at 0.26346165 cg18459342 247 4435 CITED1 207144_s_at 0.37530465 cg18468467 Cluster II 248 51466 EVL 217838_s_at 0.65340496 cg18621299 Cluster II 249 51103 NDUFAF1 204125_at 0.35312245 cg18705301 Cluster II 250 23303 KIF13B 202962_at 0.5418989 cg18875839 Cluster II 251 8537 BCAS1 204378_at 0.47126093 cg18917378 Cluster I Cluster II 252 7494 XBP1 200670_at 0.70660634 cg18940763 Cluster I Cluster II 253 11094 C9orf7 219223_at 0.43895474 cg19123107 Cluster II 254 283232 TMEM80 221951_at 0.33473355 cg19515518 Cluster I Cluster II 255 1733 DIO1 206457_s_at 0.27714605 cg19526600 Cluster II 256 10202 DHRS2 214079_at 0.39469825 cg19538485 Cluster II 257 55663 ZNF446 219900_s_at 0.50264354 cg19649173 Cluster II 258 123872 LRRC50 222068_s_at 0.42313282 cg19706682 Cluster II 259 1555 CYP2B6 206754_s_at 0.63122768 cg19756068 260 7905 REEP5 208873_s_at 0.52513099 cg19863003 261 6697 SPR 203458_at 0.37404256 cg19889780 Cluster I Cluster II 262 10421 CD2BP2 202257_s_at 0.43847209 cg19981839 263 185 AGTR1 205357_s_at 0.44871963 cg20530314 Cluster I Cluster II 264 18 ABAT 209459_s_at 0.68431164 cg20587543 Cluster I Cluster II 265 23635 SSBP2 203787_at 0.26127225 cg20757912 Cluster II 266 987 LRBA 212692_s_at 0.66720446 cg20850582 Cluster II 267 9185 REPS2 205645_at 0.44296576 cg20855303 Cluster II 268 27165 GLS2 205531_s_at 0.25483734 cg20877313 Cluster I Cluster II 269 51364 ZMYND10 205714_s_at 0.46588534 cg20881888 Cluster II 270 10551 AGR2 209173_at 0.68249398 cg21201572 Cluster I Cluster II 271 9 NAT1 214440_at 0.68994857 cg21363706 Cluster I Cluster II 272 7802 DNALI1 205186_at 0.72206464 cg21488617 Cluster I Cluster II 273 55859 BEX1 218332_at 0.31558982 cg21509846 Cluster II 274 9368 SLC9A3R1 201349_at 0.4058525 cg21922841 Cluster I Cluster II 275 3572 IL6ST 204863_s_at 0.56616896 cg21950518 Cluster II 276 10827 C5orf3 218588_s_at 0.42777389 cg22230395 Cluster II 277 54961 SSH3 219919_s_at 0.58016018 cg22285621 Cluster I Cluster II 278 1917 EEF1A2 204540_at 0.430875 cg22463915 Cluster II 279 112398 EGLN2 220956_s_at 0.39209521 cg22671726 Cluster II 280 11098 PRSS23 202458_at 0.40863082 cg23214764 Cluster II 281 51161 C3orf18 219114_at 0.55310088 cg23320649 Cluster II 282 10127 ZNF263 203707_at 0.45998317 cg23412875 Cluster II 283 10884 MRPS30 218398_at 0.47959606 cg23455614 Cluster II 284 55614 C20orf23 219570_at 0.48672644 cg23455897 Cluster II 285 2947 GSTM3 202554_s_at 0.47749254 cg23472215 Cluster II 286 2232 FDXR 207813_s_at 0.35785196 cg23727583 Cluster II 287 2674 GFRA1 205696_s_at 0.58482365 cg23898073 Cluster I Cluster II 288 6666 SOX12 204432_at 0.2889763 cg23922081 Cluster II 289 9091 PIGQ 204144_s_at 0.44802235 cg24014020 Cluster I Cluster II 290 54880 BCOR 219433_at 0.22960544 cg24183173 Cluster II 291 54970 TTC12 219587_at 0.2915526 cg24264506 Cluster II 292 2155 F7 207300_s_at 0.29179115 cg24269657 Cluster I Cluster II 293 5357 PLS1 205190_at 0.24732622 cg24278076 Cluster II 294 27250 PDCD4 212593_s_at 0.42229844 cg24371157 Cluster II 295 1960 EGR3 206115_at 0.37300819 cg24403722 Cluster II 296 2800 GOLGA1 203384_s_at 0.43241773 cg24412846 297 786 CACNG1 206612_at 0.32528848 cg24459563 Cluster II 298 3760 KCNJ3 207142_at 0.28982426 cg24693368 Cluster I Cluster II 299 54894 RNF43 218704_at 0.28044127 cg24835159 Cluster I Cluster II 300 55245 C20orf44 217935_s_at 0.29225728 cg24906992 Cluster II 301 2891 GRIA2 205358_at 0.32540262 cg25148589 Cluster II 302 1047 CLGN 205830_at 0.36939216 cg25323711 Cluster II 303 11001 SLC27A2 205768_s_at 0.50448727 cg25417405 Cluster I Cluster II 304 56683 C21orf59 218123_at 0.30298336 cg25505974 Cluster II 305 1847 DUSP5 209457_at 0.27703245 cg25524473 Cluster I 306 1718 DHCR24 200862_at 0.38017698 cg25536676 Cluster I 307 5441 POLR2L 202586_at 0.29070545 cg25748127 Cluster II 308 10406 WFDC2 203892_at 0.31031891 cg25799986 Cluster I Cluster II 309 80347 COASY 201913_s_at 0.44198549 cg25831111 Cluster II 310 26018 LRIG1 211596_s_at 0.59172338 cg26131019 Cluster II 311 1360 CPB1 205509_at 0.34649378 cg26361780 Cluster II 312 5860 QDPR 209123_at 0.46688046 cg26689483 Cluster II 313 55333 SYNJ2BP 219156_at 0.35415298 cg26709859 Cluster II 314 27134 TJP3 213412_at 0.54277553 cg27022827 Cluster II 315 4488 MSX2 205555_s_at 0.29546364 cg27096144 Cluster I Cluster II 316 25837 RAB26 219562_at 0.52616496 cg27176536 Cluster II 317 10040 TOM1L1 204485_s_at 0.38262454 cg27210390 Cluster I Cluster II 318 27124 PIB5PA 213651_at 0.49391158 cg27324619 Cluster I Cluster II 319 6583 SLC22A4 205896_at 0.32318426 cg27372468 Cluster II 320 3315 HSPB1 201841_s_at 0.40616865 cg27376817 Cluster II 321 51809 GALNT7 218313_s_at 0.49150358 cg27433088 Cluster II 57496 MKL2 218259_at 0.64903192 NA Cluster II 55638 NA 218692_at 0.62980086 NA Cluster II 54463 NA 218532_s_at 0.60166971 NA Cluster II 54502 NA 218035_s_at 0.59729022 NA Cluster II 57613 KIAA1467 213234_at 0.59084268 NA Cluster II
55686 MREG 219648_at 0.57186844 NA Cluster II 23324 MAN2B2 214703_s_at 0.55505861 NA Cluster II 8100 IFT88 204703_at 0.55028445 NA Cluster II 79641 ROGDI 218394_at 0.54629249 NA Cluster II 400451 NA 51158_at 0.53742018 NA Cluster II 28958 CCDC56 218026_at 0.52364146 NA Cluster II 122616 C14orf79 213512_at 0.50858013 NA Cluster II 23327 NEDD4L 212448_at 0.50237131 NA 7568 ZNF20 213916_at 0.47419152 NA Cluster II 54812 AFTPH 217939_s_at 0.45517045 NA Cluster II 8399 PLA2G10 207222_at 0.44184663 NA Cluster II 399665 FAM102A 212400_at 0.4260898 NA Cluster II 80223 RAB11FIP1 219681_s_at 0.40904171 NA Cluster II 92104 TTC30A 213679_at 0.40345151 NA Cluster II 79629 OCEL1 205441_at 0.40233192 NA Cluster II 55184 C20orf12 219951_s_at 0.39674387 NA Cluster II 54458 PRR13 217794_at 0.39227943 NA 11042 NA 215043_s_at 0.38838153 NA Cluster II 374 AREG 205239_at 0.37561015 NA 79719 NA 202851_at 0.36402063 NA Cluster II 55258 NA 219044_at 0.35827387 NA Cluster II 55293 UEVLD 220775_s_at 0.34468884 NA Cluster II 51735 RAPGEF6 219112_at 0.32626789 NA 22976 PAXIP1 212825_at 0.3149759 NA 23059 CLUAP1 204577_s_at 0.30808191 NA Cluster II 80279 CDK5RAP3 218740_s_at 0.29508624 NA 7769 ZNF226 219603_s_at 0.29151808 NA Cluster II 55101 NA 218038_at 0.26654972 NA Cluster II 8987 NA 203986_at 0.24350432 NA Cluster II 57586 SYT13 221859_at 0.23947239 NA Cluster II 23366 NA 213424_at 0.23429518 NA Cluster II 58513 EPS15L1 221056_x_at 0.23324627 NA Cluster II 29104 N6AMT1 220311_at 0.22248446 NA Cluster II 79446 WDR25 219609_at 0.2086421 NA Cluster II SEQ CpG SEQ CpG SEQ CpG ID Island Promoter ID Island Promoter ID Island Promoter No. Revisited Class No. Revisited Class No. Revisited Class 87 true HCP 101 shore LCP 115 true HCP 88 true HCP 102 true HCP 116 true ICP 89 true HCP 103 true HCP 117 shore ICP 90 true HCP 104 true ICP 118 true HCP 91 shore HCP 105 shore ICP 119 true HCP 92 shore LCP 106 true ICP 120 true HCP 93 true ICP 107 true HCP 121 shore HCP 94 true HCP 108 shore HCP 122 shore ICP 95 true HCP 109 true HCP 123 false ICP 96 true HCP 110 true HCP 124 true HCP 97 true HCP 111 true HCP 125 false ICP 98 true HCP 112 shore HCP 126 true HCP 99 shore HCP 113 true HCP 127 true HCP 100 true HCP 114 shore ICP 128 true HCP 129 true HCP 175 true HCP 221 true HCP 130 true HCP 176 true HCP 222 true HCP 131 true HCP 177 true HCP 223 true 132 false ICP 178 shore LCP 224 true HCP 133 true HCP 179 false HCP 225 true HCP 134 true HCP 180 false ICP 226 shore ICP 135 true HCP 181 true HCP 227 true ICP 136 true HCP 182 true HCP 228 false ICP 137 true HCP 183 true HCP 229 true HCP 138 shore HCP 184 true HCP 230 true HCP 139 true HCP 185 true HCP 231 true HCP 140 false ICP 186 true HCP 232 true HCP 141 true HCP 187 false ICP 233 true HCP 142 true HCP 188 shore HCP 234 true HCP 143 shore HCP 189 false LCP 235 shore HCP 144 false ICP 190 false ICP 236 true ICP 145 true ICP 191 true HCP 237 true HCP 146 true HCP 192 true HCP 238 shore ICP 147 shore HCP 193 shore ICP 239 shore ICP 148 true HCP 194 true HCP 240 shore HCP 149 true HCP 195 true HCP 241 shore HCP 150 true HCP 196 true HCP 242 true HCP 151 true ICP 197 true HCP 243 true HCP 152 false ICP 198 shore HCP 244 true HCP 153 true HCP 199 true HCP 245 true HCP 154 false ICP 200 true ICP 246 true HCP 155 false LCP 201 true HCP 247 true HCP 156 true HCP 202 shore ICP 248 false ICP 157 shore ICP 203 false ICP 249 true HCP 158 true HCP 204 true ICP 250 true HCP 159 shore HCP 205 true ICP 251 false ICP 160 true HCP 206 true HCP 252 true HCP 161 true HCP 207 true HCP 253 true HCP 162 true HCP 208 false ICP 254 true HCP 163 true HCP 209 true HCP 255 true ICP 164 true HCP 210 true HCP 256 false ICP 165 shore ICP 211 true ICP 257 true HCP 166 true HCP 212 false LCP 258 true HCP 167 false ICP 213 true HCP 259 false ICP 168 true HCP 214 shore HCP 260 true HCP 169 shore ICP 215 false HCP 261 true HCP 170 true HCP 216 true HCP 262 true HCP 171 true HCP 217 true HCP 263 true HCP 172 false LCP 218 true 264 true HCP 173 true HCP 219 true HCP 265 true HCP 174 false ICP 220 shore ICP 266 true HCP 267 true HCP 287 true HCP 307 true HCP 268 true HCP 288 true HCP 308 true ICP 269 true HCP 289 shore HCP 309 shore ICP 270 false ICP 290 true HCP 310 true HCP 271 false ICP 291 true ICP 311 false LCP 272 true ICP 292 shore ICP 312 shore HCP 273 true ICP 293 false LCP 314 true ICP 274 true HCP 294 true HCP 315 true HCP 275 true HCP 295 true HCP 316 true HCP 276 true HCP 296 shore HCP 317 true HCP 277 true ICP 297 true ICP 318 false ICP 278 true HCP 298 true HCP 319 true HCP 279 true HCP 299 false ICP 320 true HCP 280 true HCP 300 true HCP 321 shore HCP 281 shore ICP 301 shore HCP 282 true HCP 302 true HCP 283 true HCP 303 shore HCP 284 true HCP 304 true HCP 285 true HCP 305 true HCP 286 true HCP 306 true HCP
TABLE-US-00007 TABLE 5C CpG islands of the ESR1-negative module: SEQ Entrez ID Gene Methylation NO. ID SYMBOL Affy_ID coefficient Illumina_ID Enrichment 322 51442 VGLL1 215729_s_at -0.66129561 cg21462299 323 26227 PHGDH 201397_at -0.64928809 cg07090813 Cluster II 324 6648 SOD2 215223_s_at -0.62622708 cg14515483 325 221061 C10orf38 212771_at -0.61911622 cg04451988 326 53335 BCL11A 219497_s_at -0.61751635 cg22166290 Cluster II 327 4478 MSN 200600_at -0.59183487 cg09778422 Cluster II 328 6664 SOX11 204914_s_at -0.57838974 cg20008332 Cluster II 329 10950 BTG3 205548_s_at -0.57803585 cg14380517 Cluster II 330 83439 TCF7L1 221016_s_at -0.57685166 cg02508567 Cluster II 331 8543 LMO4 209204_at -0.56711672 cg10912077 Cluster II 332 2617 GARS 208693_s_at -0.56419322 cg15693363 333 2296 FOXC1 213260_at -0.56246613 cg04504095 334 2568 GABRP 205044_at -0.55883521 cg21652012 Cluster II 335 3945 LDHB 201030_x_at -0.55557485 cg06437004 Cluster II 336 5613 PRKX 204061_at -0.55539077 cg09094355 Cluster II 337 1054 CEBPG 204203_at -0.55314581 cg15046693 Cluster II 338 4783 NFIL3 203574_at -0.55143972 cg15919045 339 3868 KRT16 209800_at -0.54949798 cg27478659 Cluster II 340 55765 C1orf106 219010_at -0.54180004 cg15250507 341 5937 RBMS1 207266_x_at -0.53974436 cg14325649 342 3898 LAD1 203287_at -0.53550815 cg25947945 343 2173 FABP7 205029_s_at -0.52941225 cg05798712 344 9435 CHST2 203921_at -0.5239671 cg00995327 Cluster II 345 6663 SOX10 209842_at -0.52250076 cg06614002 Cluster II 346 1476 CSTB 201201_at -0.52228528 cg14095850 347 10982 MAPRE2 202501_at -0.5193823 cg07020962 348 8685 MARCO 205819_at -0.51838499 cg02431964 349 7371 UCK2 209825_s_at -0.51709149 cg03036064 85377 MICALL1 221779_at -0.51653462 NA 350 79650 C16orf57 218060_s_at -0.51270039 cg07398350 351 1116 CHI3L1 209395_at -0.5075254 cg07423149 Cluster II 352 8645 KCNK5 219615_s_at -0.50676541 cg02128567 Cluster II 353 23321 TRIM2 202341_s_at -0.50510712 cg12793610 Cluster II 354 25841 ABTB2 213497_at -0.50152319 cg01888411 Cluster II 355 5806 PTX3 206157_at -0.50095406 cg15565872 Cluster II 356 4953 ODC1 200790_at -0.50017862 cg05741384 Cluster II 357 8842 PROM1 204304_s_at -0.49873779 cg20576510 358 6715 SRD5A1 211056_s_at -0.49787464 cg16935609 Cluster II 359 8581 LY6D 206276_at -0.49652701 cg07572435 Cluster II 360 3613 IMPA2 203126_at -0.49271114 cg00008713 Cluster II 361 3383 ICAM1 202638_s_at -0.4921546 cg22874046 362 1410 CRYAB 209283_at -0.49071498 cg15227610 Cluster II 363 22929 SEPHS1 208941_s_at -0.49031224 cg17854497 364 7851 MALL 209373_at -0.48905517 cg09113530 Cluster II 365 375035 SFT2D2 214838_at -0.48888168 cg12739647 366 1824 DSC2 204750_s_at -0.48878224 cg00566759 367 6280 S100A9 203535_at -0.48574767 cg16139316 Cluster II 55544 RBM38 212430_at -0.48523095 NA 368 8531 CSDA 201161_s_at -0.48379436 cg03876622 11013 TMSL8 205347_s_at -0.48243815 NA 369 7545 ZIC1 206373_at -0.47973354 cg05073035 Cluster II 370 5317 PKP1 221854_at -0.47574048 cg09009380 Cluster II 371 7368 UGT8 208358_s_at -0.47320635 cg25892041 372 11254 SLC6A14 219795_at -0.46793656 cg00894577 373 8326 FZD9 207639_at -0.46571299 cg20692569 Cluster II 374 59342 SCPEP1 218217_at -0.46539062 cg07833382 375 7388 UQCRH 202233_s_at -0.46334012 cg21576698 376 10479 SLC9A6 203909_at -0.46218527 cg06657741 377 6769 STAC 205743_at -0.46154415 cg19055231 Cluster II 378 23 ABCF1 200045_at -0.45941767 cg18015044 Cluster II 379 9929 JOSD1 201751_at -0.45878624 cg26380756 Cluster II 380 54149 C21orf91 220941_s_at -0.45741133 cg01284306 381 1827 DSCR1 208370_s_at -0.45318343 cg20206574 382 57348 TTYH1 219415_at -0.45165274 cg10187559 64764 CREB3L2 212345_s_at -0.44888154 NA 383 55975 KLHL7 220238_s_at -0.44715312 cg09234859 Cluster II 384 6376 CX3CL1 203687_at -0.44647627 cg20427865 Cluster II 385 4851 NOTCH1 218902_at -0.44628024 cg20042228 Cluster II 386 4321 MMP12 204580_at -0.44026565 cg03179866 387 8884 SLC5A6 204087_s_at -0.43982908 cg01620785 388 51806 CALML5 220414_at -0.43692661 cg24392574 389 1299 COL9A3 204724_s_at -0.43453156 cg06497752 390 419 ART3 210147_at -0.43304415 cg22252999 Cluster II 391 2919 CXCL1 204470_at -0.43103914 cg02029926 392 57110 HRASLS 219984_s_at -0.43040468 cg17878972 Cluster II 393 25825 BACE2 217867_x_at -0.42961248 cg16334795 Cluster II 394 8190 MIA 206560_s_at -0.42956164 cg25152942 Cluster II 395 2824 GPM6B 209170_s_at -0.42759793 cg21229055 Cluster II 396 4828 NMB 205204_at -0.42674501 cg19517291 397 3066 HDAC2 201833_at -0.42527142 cg18387216 5321 PLA2G4A 210145_at -0.42416523 NA 398 10477 UBE2E3 210024_s_at -0.42413489 cg00949554 399 136 ADORA2B 205891_at -0.42306361 cg03729431 Cluster II 400 3576 IL8 202859_x_at -0.422638 cg18302652 401 5971 RELB 205205_at -0.42058475 cg02727285 Cluster II 402 55240 STEAP3 218424_s_at -0.41466295 cg04749104 403 25818 KLK5 222242_s_at -0.41340419 cg04349727 2171 FABP5 202345_s_at -0.41219044 NA 404 23650 TRIM29 211002_s_at -0.41153904 cg13625403 79627 OGFRL1 219582_at -0.41147589 NA 405 7436 VLDLR 209822_s_at -0.4101615 cg05523047 3892 KRT86 215189_at -0.40898783 NA 406 10874 NMU 206023_at -0.40879552 cg01943185 Cluster II 79605 PGBD5 219225_at -0.40705584 NA 407 8985 PLOD3 202185_at -0.40629339 cg25527547 60487 TRMT11 218877_s_at -0.40566142 NA 408 1381 CRABP1 205350_at -0.40429027 cg19777470 Cluster II 409 1356 CP 204846_at -0.40404337 cg17439694 Cluster II 410 3097 HIVEP2 212641_at -0.40364447 cg22858308 Cluster II 411 10656 KHDRBS3 209781_s_at -0.40340408 cg25945374 412 10575 CCT4 200877_at -0.40322219 cg19716462 Cluster II 413 4071 TM4SF1 215034_s_at -0.4024996 cg08124030 414 6948 TCN2 204043_at -0.40164819 cg04081402 415 10644 IGF2BP2 218847_at -0.40137448 cg18234011 416 3418 IDH2 210046_s_at -0.40013914 cg17925542 Cluster II 417 9200 PTPLA 219654_at -0.39972249 cg23868119 418 3872 KRT17 205157_s_at -0.39795768 cg27236973 Cluster II 419 7159 TP53BP2 203120_at -0.3957261 cg16028934 420 10200 MPHOSPH6 203740_at -0.39554753 cg16119274 Cluster II 706 TSPO 202096_s_at -0.39169845 NA 421 688 KLF5 209211_at -0.39113342 cg12848131 422 1672 DEFB1 210397_at -0.39076646 cg19033555 423 23336 DMN 212730_at -0.39034362 cg13191049 Cluster II 424 57180 ACTR3B 218868_at -0.38659759 cg10896886 425 3294 HSD17B2 204818_at -0.38270805 cg20373326 426 28960 DCPS 218774_at -0.38267717 cg03830408 427 2982 GUCY1A3 221942_s_at -0.38254572 cg02210887 428 54619 CCNJ 219470_x_at -0.3811175 cg04590978 Cluster II 429 57211 GPR126 213094_at -0.37693751 cg11176095 Cluster II 430 1117 CHI3L2 213060_s_at -0.37689236 cg10045881 Cluster II 431 7345 UCHL1 201387_s_at -0.37679195 cg24715245 Cluster II 432 54913 RPP25 219143_s_at -0.37237191 cg09619786 433 2627 GATA6 210002_at -0.37081347 cg19496782 434 875 CBS 212816_s_at -0.36357167 cg22633722 Cluster II 435 6364 CCL20 205476_at -0.36319472 cg09425228 934 CD24 209772_s_at -0.36282951 NA 436 274 BIN1 210202_s_at -0.36200933 cg25228746 437 11202 KLK8 206125_s_at -0.35998705 cg19149785 438 11170 FAM107A 209074_s_at -0.35901803 cg06638451 Cluster II 439 5271 SERPINB8 206034_at -0.35808395 cg27100123 440 5268 SERPINB5 204855_at -0.35802733 cg20837735 8563 THOC5 209418_s_at -0.35724536 NA 441 5100 PCDH8 206935_at -0.35519567 cg20366906 Cluster II 442 56938 ARNTL2 220658_s_at -0.35442683 cg01986577 Cluster II 443 10525 HYOU1 200825_s_at -0.35389917 cg07330718 444 23532 PRAME 204086_at -0.35189188 cg05208878 Cluster II 445 6261 RYR1 205485_at -0.35082856 cg15517609 446 6723 SRM 201516_at -0.3457862 cg21379816 Cluster II 447 3595 IL12RB2 206999_at -0.34467894 cg01356829 Cluster II 448 3574 IL7 206693_at -0.34389077 cg23538854 449 6564 SLC15A1 207254_at -0.34318347 cg10694152 Cluster II 450 2591 GALNT3 203397_s_at -0.34242172 cg15739581 451 2770 GNAI1 209576_at -0.34021112 cg05806233 Cluster II 452 8986 RPS6KA4 204632_at -0.33810477 cg24970539 453 54438 GFOD1 219821_s_at -0.3377583 cg00194146 454 25984 KRT23 218963_s_at -0.33772871 cg06378617 455 51302 CYP39A1 220432_s_at -0.33695618 cg19557537 Cluster II 456 7037 TFRC 207332_s_at -0.33653368 cg22956956 457 390 RND3 212724_at -0.33533047 cg11626656 458 8324 FZD7 203706_s_at -0.33206439 cg12618251 Cluster II 459 9982 FGFBP1 205014_at -0.33016268 cg13929970 Cluster II 460 827 CAPN6 202965_s_at -0.32896134 cg19688503 Cluster II 461 2348 FOLR1 204437_s_at -0.32727835 cg03699566 462 6271 S100A1 205334_at -0.32519543 cg14467840 463 9258 MFHAS1 213457_at -0.3244714 cg15819853 Cluster II 464 9510 ADAMTS1 222162_s_at -0.31714081 cg00472814 Cluster II 465 22943 DKK1 204602_at -0.31707767 cg07684796 Cluster II 466 2861 GPR37 209631_s_at -0.31562942 cg23428445 467 55506 H2AFY2 218445_at -0.31488076 cg17163751 468 6277 S100A6 217728_at -0.31127446 cg09413557 469 65983 GRAMD3 218706_s_at -0.31070593 cg08704509 470 3096 HIVEP1 204512_at -0.30420168 cg07782113 471 8792 TNFRSF11A 207037_at -0.30152349 cg01765461 472 3400 ID4 209291_at -0.29901729 cg17252960 Cluster II 473 1475 CSTA 204971_at -0.29629654 cg26928972 Cluster II 474 26278 SACS 213262_at -0.29589301 cg25206802 475 4188 MDFI 205375_at -0.29462263 cg05345286 476 1525 CXADR 203917_at -0.29399348 cg00744433 Cluster II 477 9022 CLIC3 219529_at -0.29342331 cg15387123 478 9508 ADAMTS3 214913_at -0.29195187 cg13643796 479 23318 ZCCHC11 212704_at -0.2874469 cg07347137 Cluster II 480 202 AIM1 212543_at -0.28250629 cg24194539 481 83988 NCALD 211685_s_at -0.27863454 cg01484156 79745 CLIP4 219944_at -0.27836222 NA 482 64849 SLC13A3 205243_at -0.27379455 cg18468842 483 5562 PRKAA1 209799_at -0.27248266 cg10786880 Cluster II 484 79852 ABHD9 220013_at -0.27078394 cg05488632 Cluster II 485 6496 SIX3 206634_at -0.2645826 cg13163729 Cluster II 486 5803 PTPRZ1 204469_at -0.26445918 cg25167643 487 4691 NCL 200610_s_at -0.25948109 cg26862286 488 1644 DDC 205311_at -0.25539982 cg04144768 489 23266 LPHN2 206953_s_at -0.25295037 cg08235271 55790 NA 219049_at -0.25042614 NA 490 1783 DYNC1LI2 203590_at -0.24622451 cg21610192 4139 MARK1 221047_s_at -0.24475937 NA 926 CD8B 215332_s_at -0.24348476 NA 491 10331 B3GNT3 204856_at -0.24063883 cg03316864 492 6304 SATB1 203408_s_at -0.23571514 cg00674922 493 2920 CXCL2 209774_x_at -0.23251798 cg16890267 Cluster II 494 2588 GALNS 206335_at -0.23243233 cg08781448 495 50805 IRX4 220225_at -0.23224835 cg03963198 496 5737 PTGFR 207177_at -0.2231448 cg03495868 Cluster II 497 3779 KCNMB1 209948_at -0.21564509 cg22646937 498 8785 MATN4 207123_s_at -0.20822884 cg14448104 499 10810 WASF3 204042_at -0.18215567 cg07744166 Cluster II SEQ CpG_ SEQ CpG_ ID Island_ Promoter_ Expression ID Island_ Promoter_ Expression No. Revisited Class Enrichment No. Revisited Clas Enrichment 322 false ICP Cluster I 331 true HCP Cluster I 323 true ICP Cluster I 332 true HCP Cluster I 324 true HCP Cluster I 333 true HCP Cluster I 325 true HCP Cluster I 334 false ICP Cluster I 326 shore HCP Cluster I 335 true ICP Cluster I 327 shore HCP Cluster I 336 shore HCP Cluster I 328 true HCP Cluster I 337 shore HCP 329 true HCP Cluster I 338 true HCP Cluster I 330 true HCP Cluster I 339 true ICP Cluster I 340 true HCP Cluster I 388 true HCP Cluster I 341 shore HCP 389 true HCP Cluster I 342 true HCP Cluster I 390 false LCP Cluster I 343 false ICP Cluster I 391 true ICP Cluster I 344 true HCP Cluster I 392 true HCP Cluster I 345 true ICP Cluster I 393 false HCP Cluster I 346 true HCP Cluster I 394 false ICP Cluster I 347 true HCP Cluster I 395 shore HCP Cluster I 348 false ICP Cluster I 396 shore HCP Cluster I 349 true HCP Cluster I 397 true HCP Cluster I Cluster I Cluster I 350 true ICP Cluster I 398 true HCP Cluster I 351 false ICP Cluster I 399 true HCP 352 true HCP Cluster I 400 false LCP Cluster I 353 false ICP Cluster I 401 shore HCP Cluster I 354 true HCP Cluster I 402 true HCP Cluster I 355 true ICP Cluster I 403 shore ICP Cluster I 356 true HCP Cluster I Cluster I 357 false ICP Cluster I 404 true ICP Cluster I 358 false HCP Cluster I Cluster I 359 shore ICP Cluster I 405 true HCP Cluster I 360 true HCP Cluster I Cluster I 361 true HCP Cluster I 406 true HCP Cluster I 362 shore ICP Cluster I Cluster I 363 true HCP Cluster I 407 shore HCP 364 shore HCP Cluster I Cluster I 365 true HCP Cluster I 408 true Cluster I 366 true HCP Cluster I 409 false LCP Cluster I 367 false ICP Cluster I 410 shore ICP Cluster I Cluster I 411 true HCP Cluster I 368 true HCP Cluster I 412 true HCP Cluster I 413 true ICP Cluster I
396 true HCP Cluster I 414 false ICP Cluster I 370 true HCP Cluster I 415 true HCP Cluster I 371 false LCP Cluster I 416 true HCP Cluster I 372 false ICP Cluster I 417 true HCP Cluster I 373 true HCP Cluster I 418 true ICP Cluster I 374 true HCP Cluster I 419 true HCP Cluster I 375 true HCP Cluster I 420 true HCP Cluster I 376 true HCP Cluster I Cluster I 377 true HCP Cluster I 421 true HCP Cluster I 378 true HCP 422 false ICP Cluster I 379 true HCP 423 true HCP Cluster I 380 shore HCP Cluster I 424 true HCP Cluster I 381 true HCP Cluster I 435 false ICP Cluster I 382 shore HCP Cluster I 426 true HCP Cluster I Cluster I 427 false ICP Cluster I 383 true HCP 428 true HCP Cluster I 384 false ICP Cluster I 429 true HCP Cluster I 385 true HCP Cluster I 430 false ICP Cluster I 386 false LCP Cluster I 431 true HCP Cluster I 387 shore HCP Cluster I 432 true HCP Cluster I 433 true HCP Cluster I 482 false ICP 434 true HCP Cluster I 483 true HCP 435 false LCP Cluster I 484 true HCP Cluster I 485 true ICP Cluster I 436 shore HCP Cluster I 486 true HCP Cluster I 437 true ICP Cluster I 487 shore HCP 438 false ICP Cluster I 488 false ICP 439 shore ICP Cluster I 489 true HCP Cluster I 440 shore ICP Cluster I Cluster I Cluster I 490 true HCP 441 true HCP Cluster I 442 true HCP Cluster I Cluster I 443 true HCP Cluster I 491 true ICP Cluster I 444 true ICP Cluster I 492 true ICP 445 shore ICP Cluster I 493 true HCP Cluster I 446 true HCP Cluster I 494 true HCP 447 shore HCP Cluster I 495 true HCP 448 true ICP Cluster I 496 true HCP Cluster I 449 true HCP Cluster I 497 false ICP Cluster I 450 false LCP Cluster I 498 true ICP Cluster I 451 true HCP Cluster I 499 true HCP 452 true HCP 453 shore HCP Cluster I 454 false ICP Cluster I 455 true HCP Cluster I 456 true HCP Cluster I 457 true ICP Cluster I 458 true HCP Cluster I 459 false ICP Cluster I 460 false ICP Cluster I 461 false ICP 462 false ICP Cluster I 463 true HCP Cluster I 464 true HCP Cluster I 465 true HCP Cluster I 466 true HCP Cluster I 467 true HCP 468 true HCP 469 shore HCP 470 true HCP 471 true HCP Cluster I 472 true HCP Cluster I 473 false LCP Cluster I 474 false LCP Cluster I 475 true HCP Cluster I 476 false HCP Cluster I 477 true ICP Cluster I 478 true HCP Cluster I 479 true HCP Cluster I 480 true ICP Cluster I 481 false LCP Cluster I Cluster I
Example 3
Refining the Methylation-Based Taxonomy of the Tumour Set
[0160] As shown in FIG. 3a, the unsupervised analysis of recurrent methylation patterns yielded 6 distinct entities (clusters 1 to 6). These methylation clusters were next compared to known breast cancer "expression subtypes". Currently, on the basis of gene expression profiles, four subtypes are distinguished: basal-like breast cancers (corresponding mostly to ER-negative and HER2-negative), HER2-positive cancers characterized by increased expression of several genes of the HER2 amplicon, and two luminal-like subtypes, low-grade luminal A and high-grade luminal B, which are predominantly ER-positive (Sotiriou, C. & Piccart, M. J. 2007 Nat. Rev. Cancer 7, 545-553). IHC and gene expression profiling (FIG. 3a and Table 6) revealed a significant preponderance of HER2-overexpressing tumours in cluster 2, basal-like tumours in cluster 3, and luminal A tumours in cluster 6. Interestingly, no single "expression subtype" appeared to dominate in methylation clusters 1, 4, and 5: cluster 1 contained HER2, basal-like as well as luminal B tumours; cluster 4 appeared to be a mix of HER2 and luminal B tumours; and cluster 5 contained both luminal A and B tumours (FIG. 3a). In FIG. 3f, the correlation with clinical parameters was made. Clusters 5 and 6 contained exclusively ER-positive tumours, whereas clusters 3 were composed principally of ERnegative tumours. HER2-positive tumours were predominant in clusters 1 and 2. Cluster 6 contained majorly grade 1 tumours. No significant association with tumour size or age was found.
TABLE-US-00008 TABLE 6 Association between the 6 methylation clusters identified in the main set of patients and the "known expression subtypes". Upper table indicates the p-values provided by Fisher's Exact test to evaluate the association between each methylation group and each "known expression subtype" determined by immunochemistry (IHC) as well as the Phi value in brackets. Lower table indicates the likelihood ratio pvalues provided by Chi square test to evaluate the association between each methylation group and each "known expression subtype" determined by gene expression (GE) as well as the Phi value in brackets. HER2 Basal-like Luminal A Luminal B "Known expression subtypes" (IHC) Methylation Cluster 1 0.17 (Phi = 0.178) 0.502 (Phi = -0.092) 0.111 (Phi = -0.201) 0.471 (Phi = 0.089) groups Cluster 2 <0.001 (Phi = 0.448) 1 (Phi = -0.034) 0.172 (Phi = -0.172) 0.009 (Phi = -0.286) Cluster 3 0.103 (Phi = -0.186) <0.001 (Phi = 0.491) 0.009 (Phi = -0.275) 0.769 (Phi = -0.054) Cluster 4 0.692 (Phi = 0.053) 0.675 (Phi = -0.104) 0.344 (Phi = -0.160) 0.091 (Phi = 0.198) Cluster 5 0.266 (Phi = -0.144) 0.433 (Phi = -0.122) 1 (Phi = 0.026) 0.033 (Phi = 0.257) Cluster 6 0.002 (Phi = -0.333) 0.033 (Phi = -0.237) <0.001 (Phi = 0.736) 0.751 (Phi = -0.077) "Known expression subtypes" (GE) Methylation Cluster 1 0.1 (Phi = 0.238) 0.059 (Phi = 0.250) 0.266 (Phi = 0.163) 0.253 (Phi = 0.168) groups Cluster 2 <0.001 (Phi = 0.445) 0.499 (Phi = 0.123) 0.038 (Phi = 0.219) 0.327 (Phi = 0.149) Cluster 3 0.001 (Phi = 0.366) <0.001 (Phi = 0.735) 0.004 (Phi = 0.315) 0.189 (Phi = 0.196) Cluster 4 0.592 (Phi = 0.113) 0.119 (Phi = 0.177) 0.723 (Phi = 0.092) 0.477 (Phi = 0.134) Cluster 5 0.297 (Phi = 0.165) 0.027 (Phi = 0.256) 0.273 (Phi = 0.185) 0.098 (Phi = 0.261) Cluster 6 0.004 (Phi = 0.318) 0.003 (Phi = 0.323) <0.001 (Phi = 0.503) 0.087 (Phi = 0.254)
[0161] To validate these six methylation clusters, the Infinium methylation assay was applied to an independent validation set of 117 breast tumours and the efficient nearest centroid classification method (Sorlie, T. et al., 2003 Proc. Natl Acad. Sci. USA 100, 8418-8423; Lusa, L. et al., 2007 J. Natl Cancer Inst. 99, 1715-1723) was used to assign, on the basis of DNA methylation profile similarities, each new sample to one of the 6 clusters. Focusing first on the main set, an 86 CpG-classifier was established that consists of a list of 86 key CpGs, this being the minimum number of CpGs required to retrieve the 6 unsupervised-analysis-based clusters (FIGS. 3b and 3c, Table 2). From this list of 86 CpGs, we calculated 6 centroids (i.e. profiles consisting of the median methylation value for each of the 86 CpGs) for each of the 6 methylation groups. Then, by computing the Spearman correlation of each tumour of the 6 validation set with each calculated centroid, each new sample was classified into one of the 6 methylation clusters (Supplementary FIG. 3c). Remarkably essentially all tumours of the validation set showed a strong correlation with one of the 6 methylation groups (FIG. 3d and FIG. 3e). Furthermore, IHC performed on the independent validation set showed a very similar "expression subtype composition" for each of the 6 groups as in the case of the main set (FIG. 3d, FIG. 3f and Table 7). It is noteworthy that the 86 CpG-classifier contained CpGs related to genes well-known to be implicated in breast cancer, such as: the oestrogen-inducible gene (TFF1), cyclin D1 (CCND1), secreted frizzled-related protein 2 (SFRP2), caspase 1 (CASP1), POU class 4 homeobox 1 (POU4F1) and interleukin 1, alpha and beta (IL1A and IL1B) (see Table 2 for the full list). Note also that this classifier contained majorly CpGs located in ICPs as well as LCPs (FIG. 3g). Taken together, these results reveal the existence of breast cancer groups that go beyond the currently known "expression subtypes" and suggest that methylation profiling may provide a basis for improving tumour taxonomy. Further, these observations suggest that methylation patterns distinguished here reflect the cell type of origin of the studied tumours (see FIG. 3h). Cluster 3 displayed the highest luminal progenitor signature score (p=0.001 versus clusters 2 and 4; p<0.001 versus other clusters; b), whereas the luminal mature signature score was higher for clusters 1, 4, 5, and 6 (p<0.001 for each of these clusters versus clusters 2 and 3, except for cluster 4 versus cluster 2 where p=0.019; c). Cluster 2 was not associated with any of the 3 signatures. d, e, f, Box plots of MaSC, luminal progenitor, and luminal mature signature scores, respectively, for each of the six methylation breast cancer groups, based on their DNA methylation profiles. A strong anti-correlation was observed between gene expression and DNA methylation data for the luminal progenitor and mature signatures (compare e with b and f with c, respectively) (respective Pearson's coefficients: -0.59, p=1.10-9 and -0.70, p=6.10-14). It was weaker for the MaSC signature (compare d with a; Pearson's coefficient: -0.47, p=4.10-6).
TABLE-US-00009 TABLE 7 Association between the 6 methylation groups obtained for the validation set of tumours and the "known expression subtypes". The table indicates the p-values provided by Fisher's Exact test to evaluate the association between each methylation group of the validation set and each "known expression subtype" determined by immunochemistry (IHC) as well as the Phi value in brackets. "Known expression subtypes" (IHC) HER2 Basal-like Luminal A Luminal B Methylation Cluster 1 <0.001 (Phi = 0.413) 0.339 (Phi = -0.112) 0.037 (Phi = -0.194) 0.511 (Phi = -0.083) groups Cluster 2 0.012 (Phi = 0.261) 0.170 (Phi = -0.147) 0.453 (Phi = -0.107) 1 (Phi = 0.012) Cluster 3 0.002 (Phi = -284) <0.001 (Phi = 0.673) 0.023 (Phi = -0.225) 0.017 (Phi = -0.223) Cluster 4 0.021 (Phi = 0.241) 0.276 (Phi = -0.119) 0.115 (Phi = -0.158) 0.692 (Phi = -0.051) Cluster 5 0.296 (Phi = -0.128) 0.01 (Phi = -0.241) 0.735 (Phi = 0.048) 0.001 (Phi = 0.326) Cluster 6 0.014 (Phi = -0.221) <0.001 (Phi = -0.341) <0.001 (Phi = 0.556) 0.798 (Phi = 0.028)
Example 4
Probing the Biological Significance of the Six Methyaltion Clusters
[0162] For this, the number of differentially methylated targets (as compared to normal samples) was quantified characterizing each of the above clusters in the main set. The number of targets was found to vary greatly between clusters, being lowest for cluster 3 (276 CpGs) and highest for cluster 4 (1,378 CpGs; FIG. 3i). Next, a gene ontology (GO) analysis was performed focusing on the genes in each cluster showing both differential methylation (as compared to normal samples) and a significant anti-correlation between methylation and expression. This revealed differential methylation of several genes involved in immunity, with different clusters showing distinct "epigenetic immune profiles" (FIG. 3j). In particular, tumours of clusters 2 (HER2-enriched) and 3 (basallike-enriched) showed hypomethylation of several immune genes (FIG. 3j). Because in this study whole tumour tissues were considered, the samples were constituted principally of epithelial cells, but also of cells from the surrounding stroma, including immune cells. Hence, the observed hypomethylation of immune genes in clusters 2 and 3 could indicate an infiltration of these tumours by immune cells, such as lymphocytes. This hypothesis proved correct. As shown in FIG. 3k, histologic analysis was performed, as previously described (Denkert, C. et al., 2010 J. Clin. Oncol. 28, 105-113), to determine stromal and intratumoral lymphocyte infiltration. Remarkably, the tumours of clusters 2 and 3 were much more infiltrated by lymphocytes than those of the other clusters (FIG. 3l). Furthermore, the methylation status of most of the immune genes highlighted by the GO analysis correlated inversely with the level of lymphocyte infiltration (FIG. 3m and Table 8).
TABLE-US-00010 TABLE 8 Spearman correlation between methylation status of immune genes described in FIG. 3 and the stromal and intratumoral lymphocyte infiltration. intratumoral stromal lymphocyte lymphocyte infiltration infiltration Gene_Name Illumina_ID rho p-value rho p-value AIM2 cg10636246 -0.378 <0.001 -0.309 0.001 PSMB8 cg16890093 -0.447 <0.001 -0.457 <0.001 TNFSF8 cg27631256 -0.451 <0.001 -0.436 <0.001 LCP2 cg17127769 -0.288 0.003 -0.237 0.014 ITGAL cg14176836 -0.484 <0.001 -0.452 <0.001 HCLS1 cg00141162 -0.508 <0.001 -0.534 <0.001 CD6 cg09902130 -0.586 <0.001 -0.635 <0.001 CD79B cg07973967 -0.461 <0.001 -0.468 <0.001 LCK cg17078393 -0.554 <0.001 -0.584 <0.001 EBI2 cg09626634 -0.243 0.012 -0.377 <0.001 GBP4 cg27285720 -0.379 <0.001 -0.343 <0.001 CST7 cg11804789 -0.436 <0.001 -0.412 <0.001 BST2 cg16363586 -0.163 0.095 -0.144 0.141 IL2RA cg11733245 -0.324 0.001 -0.287 0.003 PTPN22 cg00916635 -0.391 <0.001 -0.365 <0.001 IL18BP cg16749930 -0.61 <0.001 -0.626 <0.001 ADA cg20622019 -0.408 <0.001 -0.33 0.001 IL21R cg19423311 -0.377 <0.001 -0.173 0.076 LY75 cg10107725 -0.37 <0.001 -0.28 0.004 HLA-DOB cg04576021 -0.399 <0.001 -0.305 0.001 LAIR1 cg06238491 -0.455 <0.001 -0.317 0.001 SYK cg23447996 -0.264 0.006 -0.238 0.014 CEBPG cg15046693 -0.406 <0.001 -0.366 <0.001 GAL cg04464446 -0.283 0.003 -0.265 0.006 GBP4 cg21365602 -0.503 <0.001 -0.426 <0.001 CCL5 cg10315334 -0.572 <0.001 -0.559 <0.001 TLR9 cg21578541 -0.412 <0.001 -0.395 <0.001 TLR1 cg03430998 -0.567 <0.001 -0.526 <0.001
[0163] In addition, DNA methylation profiling of normal and breast cancer epithelial cell lines as well as ex vivo T and B lymphocytes and lymphoid cell lines revealed that a high number of the studied immune genes were highly methylated in breast cancer and normal epithelial cell lines but barely methylated in lymphocytes (FIG. 3n). These data strongly suggest that hypomethylation of immune genes detected in cluster-2 and -3 tumours reflect the celltype composition of the tumour microenvironment, and in particular a lymphocyte infiltration of these tumours. A closer look at these genes revealed, in cluster 2, hypomethylation of genes involved in T cell biology, e.g. genes encoding T cell markers, like the CD6 antigen, and T cell activation markers, like the LCK tyrosine kinase or the PTPN22 tyrosine phosphatase involved in T cell receptor signalling. These data might indicate that cluster-2 tumours, more readily than those of the other clusters, induce an antitumour T-cell response, with mobilization of T lymphocytes in the neoplastic environment.
[0164] Next, the clinical relevance of the above-mentioned epigenetic changes in breast carcinogenesis was analysed. To this end, a univariate survival analysis was performed of all 6,309 CpGs identified in the present invention (i.e. as being differentially methylated between normal breast samples and tumours). As suspected, the main set appeared too small to allow interpretable results. Therefore the more abundant gene expression data publicly available was used and only untreated patients were selected in order to evaluate the true prognostic value of biomarkers (between 730 and 952 samples, depending on the gene considered; Table 9).
TABLE-US-00011 TABLE 9 Publicly available gene expression data sets used for the meta-analysis. Reference Dataset Technology Survival Patients Probes 54 VDX Affymetrix RFS, DMFS 344 22,283 55 NKI Agilent RFS, DMFS, OS 345 24,481 56 MSK Affymetrix DMFS 99 22,283 57 UNT Affymetrix RFS, DMFS 137 22,283 58 CAL Affymetrix RFS, DMFS, OS 118 22,283 59 TBG Affymetrix RFS, DMFS, OS 198 22,283 60 NCH Agilent RFS, DMFS, OS 135 17,086 61 MAINZ Affymetrix DMFS 200 22,283 62 EMC2 Affymetrix DMFS 204 54,675 63 DFHCC Affymetrix DMFS 115 54,675 The column "Survival" indicates the type of survival data available for each dataset. RFS: Relapse-Free Survival, DMFS: Distant Metastasis-Free Survival, OS: Overall Survival.
[0165] Next, 55 genes were selected showing a strong anti-correlation between their methylation and expression status, and subjected to a univariate Cox regression analysis. Strikingly, no less than 32 of these genes (58%) emerged as significant prognostic markers (Table 10).
[0166] Furthermore, 13 of the 32 genes are involved in immunity and 9, particularly, in T lymphocyte biology (CD3D, CD3G, CD6, LCK, LAX1, SIT1, RHOH, UBASH3A and ICOS; FIG. 4a). Several of them, like for example LAX1, SIT1, or UBASH3A, have never been highlighted before as survival markers in breast cancer.
[0167] Consistently with the data presented in FIG. 3k-n, low methylation of the above genes correlated with high lymphocyte infiltration (except for RHOH and BST2, so these were not subsequently considered) (FIG. 4b and Table 11). When looking at the expression levels of these genes, the opposite was found, that is, high gene expression correlated with high lymphocyte infiltration (FIG. 4b and Table12). This anti-correlation between the methylation and expression status of the immune genes was also found in breast epithelial cell lines as well as in ex vivo lymphocytes and T lymphoid cell lines, as determined by DNA methylation and gene expression profiling (FIG. 4c). This is in keeping with the strong anti-correlation observed between methylation and expression status of these genes in the whole tumour samples. Furthermore, some of these genes (CD3D, CD3G, ICOS and UBASH3A) appeared highly methylated in ex vivo B lymphocytes and not in T lymphocytes samples (FIG. 4c), again indicating that the observed lymphocyte infiltration (FIG. 4b) mostly involves T lymphocytes, as suggested in FIG. 4a.
TABLE-US-00012 TABLE 10 Univariate Cox regression meta-analysis on publicly available gene expression data sets. Variable Hazard.Ratio lower.95 upper.95 P.value fdr n grade 4.319051475 2.70533636 6.895336906 8.81E-10 0 730 CD37 0.637528005 0.508909569 0.798652612 9.02E-05 0.003 951 LAX1 0.607735237 0.469490691 0.786686777 0.000155589 0.003 755 HCLS1 0.66628668 0.534778159 0.830134762 0.000295162 0.004 951 size 1.775376859 1.283496655 2.455762528 0.00052471 0.005 832 RHOH 0.670647193 0.535050445 0.840607948 0.000527206 0.005 952 CD3G 0.704601714 0.56878791 0.87284481 0.001351572 0.012 952 PTPRCAP 0.693100838 0.549253821 0.874620717 0.002010176 0.015 952 CCR7 0.717640112 0.578403622 0.890394373 0.002571111 0.017 887 ARHGAP25 0.79414017 0.679183693 0.928553814 0.003863567 0.02 950 CCL5 0.733823788 0.594450738 0.905873806 0.003978873 0.02 952 BST2 0.747004293 0.61181789 0.912061288 0.004187743 0.02 945 PSCDBP 0.738332573 0.599602639 0.909160421 0.004279438 0.02 890 CD3D 0.769590125 0.639626249 0.925960999 0.005519609 0.022 952 NME5 0.7465137 0.607158777 0.91785333 0.005553296 0.022 951 HEM1 0.745091977 0.603876135 0.919331005 0.006061245 0.022 951 CENTB1 0.753031335 0.61460319 0.922637891 0.00620265 0.022 952 SLC44A4 0.716555934 0.562123142 0.91341624 0.00711915 0.024 755 ICOS 0.776943611 0.644775259 0.936204307 0.007980999 0.024 950 PPP1R16B 0.757698984 0.616947476 0.930561794 0.008136743 0.024 887 CIDEB 0.765412525 0.618428587 0.947330614 0.01399867 0.04 952 UBASH3A 0.816472324 0.693874277 0.960731761 0.014584306 0.04 952 CD6 0.791045558 0.653436134 0.957634637 0.016220318 0.042 944 TRAF3IP3 0.79027337 0.648137351 0.963579706 0.019981307 0.05 881 DNALI1 0.803318339 0.666106667 0.968794318 0.021922321 0.053 952 PADI3 1.282586832 1.027770903 1.600579446 0.027639763 0.064 950 SIT1 0.786510638 0.632504795 0.978014693 0.030779914 0.064 950 CD52 0.798287393 0.65008143 0.980281442 0.031552946 0.064 949 node 1.854933997 1.051885878 3.271058394 0.032782279 0.064 273 GPR171 0.797959507 0.64844202 0.981952673 0.033006747 0.064 950 MAGEA10 1.251763319 1.018281633 1.538779996 0.033009551 0.064 951 LCK 0.80314799 0.652889033 0.987988251 0.038050335 0.071 951 SP140 0.801792991 0.648901416 0.990708273 0.040712689 0.074 886 CD79B 0.796167392 0.638244197 0.993166126 0.043305166 0.076 951 BIN2 0.814941986 0.664344694 0.999677496 0.049639411 0.085 946 PTPN7 0.792341795 0.626269948 1.002451932 0.05243348 0.087 951 PDZK1 0.813311899 0.654827403 1.010153578 0.061677068 0.1 952 HMGCS2 0.823324053 0.6700983 1.011586651 0.064267705 0.101 946 TRAF1 0.860049164 0.714185188 1.035704152 0.111836932 0.172 952 PIK3CG 0.852864273 0.693732209 1.048498915 0.130918607 0.196 952 CCBP2 0.851353503 0.684907289 1.058249487 0.147091806 0.215 952 CALML5 1.152320561 0.948006825 1.400667843 0.154512732 0.221 946 SCRG1 1.186854771 0.928265972 1.517479138 0.171850684 0.24 952 age 0.843892288 0.634787305 1.121878442 0.242671976 0.331 832 er 0.879914817 0.674422359 1.148019599 0.34581516 0.461 885 S100A1 1.100038426 0.877702372 1.378695761 0.407879927 0.532 887 ACTG2 1.102117932 0.858132785 1.415473174 0.446300424 0.561 952 SCNN1A 0.919786588 0.740823935 1.141981688 0.448825642 0.561 946 CRYAB 1.09273719 0.860375019 1.3878536 0.467187455 0.572 952 LDHC 1.076690314 0.874736682 1.325269714 0.485677672 0.583 950 MIA 0.935507087 0.744206524 1.175982045 0.56789208 0.668 952 SYCP2 1.050297885 0.852423577 1.294105041 0.644966227 0.744 945 KRT20 1.031559368 0.878831436 1.210829161 0.703897252 0.797 951 TNS4 1.030114858 0.842888781 1.258928396 0.771886907 0.852 952 SOX10 0.969305349 0.777727696 1.208074322 0.781407858 0.852 952 CHRNA9 0.973691818 0.790085795 1.199965577 0.802531225 0.855 948 TDRD1 1.033987152 0.784876022 1.362163451 0.812158367 0.855 690 RBP1 0.980931649 0.789362527 1.218992372 0.862125942 0.892 952 TFF1 0.988606991 0.822817223 1.187801805 0.902625469 0.918 942 TFF3 1.010010328 0.830061805 1.228969766 0.92074585 0.921 952
[0168] The meta-analysis in table 10 above was performed on the genes displaying high anti-correlation between their methylation and expression status (Pearson's coefficient below than -0.7), as described in the Supplementary Methods. The prognostic value of the classical markers (grade, tumour size, nodal status, age of the patient at diagnosis, ER status) was also evaluated. Lower.95 and Upper.95 indicate the 95% confidence interval of the hazard ratio, and n, the number of patients.
TABLE-US-00013 TABLE 11 Spearman correlation between methylation status of immune genes described in Figure 4 and the stromal and intratumoral lymphocyte infiltration. intratumoral stromal lymphocyte lymphocyte infiltration infiltration Gene_Name Illumina_ID rho p-value rho p-value LCK cg17078393 -0.554 <0.001 -0.584 <0.001 CD3D cg24841244 -0.480 <0.001 -0.563 <0.001 CD3D cg07728874 -0.548 <0.001 -0.622 <0.001 CD6 cg07380416 -0.589 <0.001 -0.649 <0.001 CO6 cg09902130 -0.586 <0.001 -0.635 <0.001 ICOS cg15344028 -0.583 <0.001 -0.579 <0.001 CD3G cg15880738 -0.480 <0.001 -0.514 <0.001 SIT1 cg15518883 -0.536 <0.001 -0.598 <0.001 BST2 cg16363586 -0.163 0.095 -0.144 0.141 CCL5 cg10315334 -0.572 <0.001 -0.559 <0.001 HCLS1 cg00141162 -0.508 <0.001 -0.534 <0.001 RHOH cg00804392 -0.123 0.212 -0.262 0.007 RHOH cg11903057 -0.068 0.489 -0.198 0.041 CD79B cg07973967 -0.461 <0.001 -0.468 <0.001 UBASH3A cg00134539 -0.360 <0.001 -0.310 0.001 LAX1 cg10117369 -0.404 <0.001 -0.434 <0.001
TABLE-US-00014 TABLE 12 Spearman correlation between expression status of immune genes described in Figure 4 and the stromal and intratumoral lymphocyte infiltration. intratumoral stromal lymphocyte lymphocyte infiltration infiltration Gene_Name Affy_ID rho p-value rho p-value LCK 204891_s_at 0.508 <0.001 0.624 <0.001 CD3D 213539_at 0.472 <0.001 0.606 <0.001 CD6 213958_at 0.451 <0.001 0.582 <0.001 ICOS 210439_at 0.571 <0.001 0.63 <0.001 CD3G 206804_at 0.423 <0.001 0.54 <0.001 SIT1 205484_at 0.545 <0.001 0.642 <0.001 BST2 201641_at 0.033 0.77 0.118 0.297 CCL5 1405_i_at 0.545 <0.001 0.634 <0.001 HCLS1 202957_at 0.471 <0.001 0.542 <0.001 RHOH 204951_at -0.013 0.907 0.173 0.124 CD79B 205297_s_at 0.563 <0.001 0.613 <0.001 UBASH3A 220418_at 0.434 <0.001 0.551 <0.001 LAX1 207734_at 0.526 <0.001 0.646 <0.001
[0169] Next, the association between the above 11 immune genes and clinical outcome was analysed. High expression of all of them was associated with a better outcome (FIG. 4d), and interestingly, a multivariate analysis revealed that all of them, except CD6, seem to have an independent prognostic value to currently used clinical indicators (Tables 13 and 14). A detailed survival analysis of the 11 immune genes revealed a subtype-specific prognostic value of these genes.
TABLE-US-00015 TABLE 13 Multivariate Cox regression meta-analysis on publicly available gene expression data sets. This analysis was performed on the 11 immune genes appearing as good prognostic markers in the univariate Cox regression provided in Supplementary Table S25 and displaying a good correlation with stromal and intratumoral infiltration (Supplementary Tables S26 and S27). Lower.95 and Upper.95 indicate the 95% confidence interval of the hazard ratio, and n, the number of patients. Variable Hazard.Ratio Lower.95 Upper.95 P. value n age 0.782098169 0.57957839 1.055383632 0.107962559 741 size 1.340020576 0.961479484 1.867595902 0.083981212 741 grade 4.398033207 2.686723253 7.199363041 3.85E-09 741 er 0.925961144 0.676930243 1.266606197 0.63032068 741 node 1.993075765 1.136034208 3.496682561 0.016187435 741 SIT1 0.6599917 0.502365102 0.867076638 0.002842138 741 age 0.947747159 0.666485182 1.347703897 0.765118789 546 size 1.296223628 0.813921483 2.064321596 0.274489122 546 grade 4.923533758 2.464824018 9.834854125 6.32E-06 546 er 0.824491233 0.558241611 1.217726842 0.33207764 546 node 5.23442121 1.237767511 22.13595458 0.024455015 546 LAX1 0.446127817 0.310119717 0.641784505 1.36E-05 546 age 0.815730376 0.605709362 1.098573158 0.179926027 742 size 1.350261099 0.968961036 1.881608204 0.076108607 742 grade 4.270712254 2.62015025 6.961044754 5.74E-09 742 er 0.898932232 0.655768704 1.232262462 0.507900025 742 node 1.985456613 1.130239988 3.487788438 0.017039196 742 HCLS1 0.602372212 0.460056401 0.788712603 0.000227835 742 age 0.791016381 0.586069628 1.067632386 0.125464002 743 size 1.336212924 0.957464668 1.864784192 0.088312944 743 grade 4.447305084 2.707212296 7.305863133 3.81E-09 743 er 0.883656243 0.644025948 1.212448594 0.44346137 743 node 2.028490613 1.15797223 3.553430785 0.013408473 743 CD3D 0.667293158 0.543518382 0.819255013 0.000111334 743 age 0.814972815 0.603243078 1.101016677 0.182534825 741 size 1.455661468 1.04379377 2.030046903 0.026929076 741 grade 4.396887623 2.686037542 7.197449948 3.87E-09 741 er 0.869706949 0.63578294 1.189698764 0.382491166 741 node 1.855844417 1.061416677 3.244869404 0.030079032 741 ICOS 0.640822787 0.520023632 0.789683042 2.97E-05 741 age 0.843106773 0.623527268 1.140012743 0.267567194 735 size 1.400276591 1.000264809 1.960255439 0.049819954 735 grade 4.103756115 2.4933814 6.754207057 2.79E-08 735 er 0.98494381 0.718402528 1.350377081 0.924928239 735 node 1.96365591 1.107469501 3.481761375 0.020927592 735 CD6 0.875910603 0.739643346 1.037282885 0.124615675 735 age 0.810235146 0.599268909 1.0954698 0.171489956 742 size 1.350831988 0.967991343 1.885086135 0.076955251 742 grade 4.097163474 2.511916282 6.682845544 1.61E-08 742 er 0.909139677 0.664161613 1.244478657 0.552087671 742 node 2.037337019 1.162122985 3.571689214 0.012972722 742 CD79B 0.664381808 0.502243714 0.878862541 0.004175719 742 age 0.781222718 0.577860841 1.05615209 0.108527271 742 size 1.355296369 0.971945329 1.889847293 0.073098388 742 grade 4.268909828 2.609544229 6.983438303 7.49E-09 742 er 0.874992826 0.63607609 1.20364915 0.411792841 742 node 1.986145103 1.13538492 3.474392075 0.016173634 742 LCK 0.673584038 0.518662828 0.874779203 0.003044328 742 age 0.793768255 0.587825226 1.071862885 0.131780585 743 size 1.361230624 0.980008306 1.89074807 0.065840561 743 grade 4.645701264 2.839822777 7.599960255 9.58E-10 743 er 0.777853284 0.561584487 1.077408201 0.130686899 743 node 1.944247797 1.112078104 3.399131305 0.019665701 743 CCL5 0.551404359 0.428004708 0.710381828 4.11E-06 743 age 0.81183076 0.601704913 1.095336216 0.172537127 743 size 1.353550939 0.969870861 1.889014526 0.07506301 743 grade 4.307262419 2.625996736 7.064940063 7.30E-09 743 er 0.926305947 0.678170929 1.265230741 0.630383585 743 node 1.944462487 1.1116814 3.401095279 0.019747903 743 UBASH3A 0.741503992 0.62442346 0.880537337 0.000647399 743 age 0.792286599 0.587059106 1.069258699 0.127966947 743 size 1.305194443 0.936821995 1.818416458 0.115431743 743 grade 4.52739965 2.77339849 7.390696887 1.55E-09 743 er 0.833481525 0.606620946 1.145182104 0.261157201 743 node 1.863800138 1.06402145 3.264737712 0.029485291 743 CD3G 0.552580273 0.423133705 0.721627594 1.33E-05 743
TABLE-US-00016 TABLE 13b Further info on the Immune genes and the Illumina ID's found to be correlating to Breast cancer as described above: Seq id no Gene_Name Affy_ID Illumina ID GeneID 500 LCK 204891_s_at cg17078393 3932 501 CD3D 213539_at cg24841244 915 502 CD3D 213539_at cg07728874 915 503 CD6 213958_at cg07380416 923 504 CD6 213958_at cg09902130 923 505 ICOS 210439_at cg15344028 29851 506 CD3G 206804_at cg15880738 917 507 SIT1 205484_at cg15518883 27240 508 CCL5 1405_i_at cg10315334 6352 509 HCLS1 202957_at cg00141162 3059 510 CD79B 205297_s_at cg07973967 974 511 UBASH3A 220418_at cg00134539 52247 512 LAX1 207734_at cg10117369 54900
TABLE-US-00017 TABLE 14 Immune markers appear significant in a multivariate analysis with all the classical markers used clinically, as shown for the LAX1 and CD3D genes used as examples (see also Table 15 for the complete analysis). Lower Variable Hazard ratio 95% CI Upper 95% CI P-value n Age 0.948 0.666 1.348 0.765 546 Size 1.296 0.814 2.064 0.274 546 Grade 4.923 2.465 9.835 6 10-6 546 ER 0.824 0.558 1.218 0.332 546 Node 5.234 1.238 22.136 0.024 546 LAX1 0.446 0.31 0.642 1 10-5 546 Age 0.791 0.586 1.068 0.125 743 Size 1.336 0.957 1.865 0.088 743 Grade 4.447 2.707 7.306 4 10-9 743 ER 0.884 0.644 1.212 0.443 743 Node 2.028 1.158 3.553 0.013 743 CD3D 0.667 0.543 0.819 1 10-4 743 n, Number of patients; CI, Confidence interval.
[0170] Most of these markers showed high prognostic value in HER2-overexpressing and luminal B tumours, but none of them had an impact in luminal A tumours; only a few seemed to have prognostic value in basal-like tumours (FIG. 4e and Table 15). Overall, these results show that the presence of these markers, associated with a better prognosis, reflects an antitumour T-cell response, specific for certain tumour categories. In addition, these data highlight the importance of DNA methylation analyses in revealing components of breast cancers, like the immune component described here, that were not that apparent on the basis of classical gene expression analyses (the latter having revealed principally the cell proliferation component as the major prognostic marker for breast cancer).
TABLE-US-00018 TABLE 15 Univariate Cox regression meta-analysis on publicly available gene expression data sets specific for each "known expression subtype". Lower.95/upper.95, 95% confidence interval of the hazard ratio; n, number of patients. Variable Hazard.Ratio Lower.95 Upper.95 P.value fdr n BASAL-LIKE CD6 0.571415127 0.35980797 0.907470858 0.017721616 0.032784991 213 CCL5 0.601220984 0.379386705 0.952765786 0.030315366 0.053412788 213 CD3G 0.614974481 0.393006583 0.962308592 0.033325393 0.056047253 213 LAX1 0.552834594 0.319001003 0.958072497 0.03463195 0.055712264 178 CD3D 0.599642986 0.363138343 0.99017831 0.045658689 0.070390478 213 age 0.557241661 0.295973189 1.049143235 0.070085346 0.103726313 172 LCK 0.632048217 0.376236164 1.061793059 0.083020423 0.113768734 213 HCLS1 0.694316555 0.449956311 1.071382857 0.099266112 0.131173074 213 grade 2.333835064 0.60915775 8.941503419 0.216206627 0.266654849 155 ICOS 0.765441762 0.47602165 1.230828665 0.270037378 0.322302669 213 er 1.325149161 0.603157506 2.911379334 0.483286797 0.55880034 208 UBASH3A 0.84970099 0.528860792 1.365183019 0.500797496 0.561500251 213 SIT1 0.851938648 0.532926849 1.361911981 0.5031992 0.547599137 213 CD79B 0.864632082 0.524298487 1.425883645 0.568758172 0.601258636 213 node 0.631158808 0.081569127 4.883728148 0.659341077 0.677656114 211 size 0.93955348 0.449321006 1.964654956 0.86842147 0.868421495 172 HER2 ICOS 0.665653573 0.520062316 0.85200305 0.001230088 0.002167298 142 node 4.604533941 1.787955465 11.85808776 0.001556726 0.00261813 142 LAX1 0.379778681 0.20236605 0.712727492 0.002575214 0.004142736 105 CD3D 0.517574299 0.306380997 0.87434651 0.013820016 0.020453623 142 LCK 0.533630219 0.318779166 0.893286769 0.01688217 0.024024626 142 CD3G 0.574943427 0.345611487 0.956449529 0.033053232 0.045295168 142 size 1.904053799 1.009143609 3.592571797 0.046804702 0.061849073 126 UBASH3A 0.639066456 0.399576092 1.022098029 0.061659162 0.078668587 142 HCLS1 0.651479447 0.405250274 1.047316924 0.076877637 0.094815753 142 CCL5 0.637778183 0.387309781 1.050221372 0.077159864 0.092094034 142 SIT1 0.656499672 0.410184716 1.050726179 0.079472098 0.091889612 141 CD79B 0.720339802 0.411022928 1.262434273 0.251839036 0.282364994 142 CD6 0.875933541 0.692310708 1.108258994 0.269768688 0.2935718 138 age 1.410285548 0.750438055 2.650325787 0.285499481 0.301813751 126 er 1.106033277 0.63703866 1.920306706 0.720323254 0.740332246 136 grade 1.137095166 0.400598853 3.22763135 0.809271597 0.809271574 106 Luminal A grade 5.162337792 2.065135769 12.90459053 0.000445859 0.000824839 275 size 1.850306583 0.961583288 3.560413844 0.065378974 0.115191519 318 CD3D 0.697135966 0.472866537 1.027771088 0.068507829 0.115217708 345 UBASH3A 0.768113097 0.566321462 1.041807117 0.089776717 0.14442341 345 SIT1 0.663341846 0.408478686 1.077222434 0.09706223 0.14963761 345 CCL5 0.672449535 0.410573335 1.101358365 0.114925908 0.170090348 345 CD79B 0.741453969 0.470759597 1.167801977 0.196817333 0.280086219 344 HCLS1 0.74338516 0.437839466 1.262155511 0.272229064 0.373054653 345 CD3G 0.792669997 0.498933534 1.259337528 0.325256661 0.429803461 345 LAX1 0.753425631 0.414668811 1.368924226 0.352748307 0.450058192 270 CD6 0.871687669 0.520960507 1.458535496 0.601065641 0.741314292 344 LCK 1.080613746 0.681066064 1.714556239 0.742025194 0.857966661 344 er 1.123321638 0.342705919 3.682024241 0.847750681 0.950508296 319 age 0.968467546 0.541901248 1.730812379 0.913873178 0.994509041 318 node 1.046039154 0.288465738 3.793164203 0.945400879 0.999423802 344 ICOS 0.993065905 0.572015048 1.724045364 0.98027602 1.007505894 344 Luminal B LAX1 0.44407418 0.283660793 0.695203153 0.000385645 0.000713443 209 CD3G 0.529767867 0.354645182 0.791365587 0.001917346 0.003378181 255 HCLS1 0.565073005 0.387754045 0.823479484 0.002970425 0.004995715 254 CD3D 0.609672758 0.432610365 0.85920473 0.00470061 0.007561851 255 LCK 0.603241335 0.420086816 0.866249772 0.006187718 0.009539398 255 UBASH3A 0.553322892 0.350383338 0.873803601 0.011128892 0.01647076 255 CCL5 0.626047812 0.430208929 0.911036093 0.014415646 0.020514574 255 grade 2.774788889 1.191228926 6.463454012 0.018002961 0.024670724 210 SIT1 0.617616772 0.411098071 0.927881943 0.020320012 0.025925532 254 ICOS 0.666539915 0.46455092 0.956354706 0.027648847 0.034100246 255 CD6 0.757102121 0.544668538 1.052389814 0.097710234 0.116621897 255 CD79B 0.764181861 0.529362845 1.10316378 0.151056463 0.174659044 255 size 1.475566638 0.834659682 2.608604382 0.180809598 0.196763396 233 age 0.777738033 0.503583487 1.201144327 0.257001758 0.271687567 233 er 1.524385366 0.6055743 3.837267771 0.370748167 0.381046712 239 node 1.321194737 0.438253574 3.982980711 0.620797266 0.620797276 255
Sequence CWU
1
1
5741122DNAHomo Sapiens 1tggattcatc cctcattcac tccacgcttg ggtttggaca
ccaccacata ccaggcacta 60cgctaggctt gggatgggcc gaagaacaaa acagaacagg
tcttttgttt accttctagg 120ag
1222122DNAHomo Sapiens 2atcacatcac cagcaatctc
cctcctaggt agaagcccca aagaattaac aacaaaagga 60cgcaaacaga tacttgtaca
cccatggtca cagcagcctg actcacaaca gaacaaacag 120cc
1223122DNAHomo Sapiens
3tagctctggc aggagaggag ctgtcctagg ccactcttcc aggatgtggc tcccccactg
60cgggaccaga ccttttatac tgaccggatc cggattctct gagtgcattc caccaggagc
120ca
1224122DNAHomo Sapiens 4accgcttctc tctaagcagg tcactgaccg aggaaaccaa
gcctcatttc aaaataatat 60cgttttccaa tgaagtcaac tgtccaacta ctgtttagct
tcaccagaac agcaaacaaa 120ct
1225122DNAHomo Sapiens 5acagcactta cttcacaggg
cttgattatt aaacaagtta acatctttgg gctcctagaa 60cgatgccatg tgcagagtca
ggactgggta aatatttgct aaagcaatct cttcatgttt 120tt
1226122DNAHomo Sapiens
6ttcataaagt aaatatcttt ttcattgctc tccagcacat gctaagaatt tagcttccac
60cgccttaagt aaacactctg cgataccagt cctaaaaaag tcactgtggc aggggctgtg
120gt
1227122DNAHomo Sapiens 7gagagatcct tgtcatcttc cttctccctg caggagggtg
tcagggtgta agtgctccct 60cgctgtgcag gggttcattt cattcatttc attacccttg
ccctcctcga ggtacctccg 120gg
1228122DNAHomo Sapiens 8gaaaaacaac aggaagcagc
ttacaaactc ggtgaacaac tgagggaacc aaaccagaga 60cgcgctgaac agagagaatc
aggctcaaag caagtggaag tgggcagaga ttccaccagg 120ac
1229122DNAHomo Sapiens
9aatcagtgga gattattgtc tcagaggatc cccgggcctc cttaggcaaa tgttatctaa
60cgctctttaa gcaaacagag cctgccctat aaaatccggg gctcgggcgg cctctcatcc
120ct
12210122DNAHomo Sapiens 10acctgagcaa gaccagtagt tcattccaag agcaaacata
atcaatatct tcatcatcat 60cgtcatcttc tccattctgg aaatcatgat tgtaatcgag
agacagagag tgtctctcta 120tg
12211122DNAHomo Sapiens 11tccacaaagt actttccatc
agatacactt ttctgatgga aaccaggtgt gtgatggtta 60cggccccagg ttagctccag
agcacattca actgtgggta aacacaaatg tgccctgtgc 120ca
12212122DNAHomo Sapiens
12tggttttcca ggatatgata gagctcgcgg tagttgccac cgtgaaaggc cacgatggct
60cgtgcgcgta gcaccgactc attcttgttg agggcctcgc aggccgcagg ggccacgggc
120ag
12213122DNAHomo Sapiens 13ctggcagctc aggacaagta gaccagccag caggacacag
atcttcctac ccggctgatt 60cggagacgag accaagctgt tgctgaggac gacagccctg
ctctggtcac tccggaggct 120ga
12214122DNAHomo Sapiens 14ctagtgtaaa ttgtgcttag
accaataaca catttaaaat tatagagctt ttcatcacta 60cggagatgct cttgcctatg
ataggaacga tggctacatc tgaagctgag caaatttatc 120tt
12215122DNAHomo Sapiens
15gccagccgcc gcgaccgccg cggctgcagc ctccgaaggg aggccgggtg agccggcgta
60cgcactttcc cgcggacttt cggagtgttt gtggatatac atgccaagcc gccacgatga
120tg
12216122DNAHomo Sapiens 16acggcgcggc catggagcgc ccggcgcctc tcgtcgcact
gaaactttgc caagagtgcg 60cgggcccgac aggctctgtg tcatctttct tgaaccgaac
ctggagtttc cgctgctaat 120tc
12217122DNAHomo Sapiens 17tgtccagtgg agttcttctt
ccttctcctt tttctgctcc ttctttcatt gttggctcaa 60cgtcaaagca gaaatctcta
aagtttgctg atcgatcttc acataactgt tctggtgata 120tc
12218122DNAHomo Sapiens
18cttttcagcc ctcagtgccc attttgccaa taaaaagtcc caaggtgaca gtacaagaga
60cgcctttagt gaaggcaaag gaagggacac tcccctcctt tgctgcctac tctcgccctc
120ac
12219122DNAHomo Sapiens 19ctcaaatgat ccacccacct cagcctccca aagtgctggg
aatacaggtg tgagccacag 60cgcccagcca gaagattttt aatagaagta aatagaaagt
gaagcaataa gtgagtaaat 120aa
12220122DNAHomo Sapiens 20gtggtgttcc ccggactctt
cctcctctcc aagaacacgc tccagcggct gccccagcta 60cgctgggagg aggccgacgc
agtcattgtc tcagccaggt aaaccacttt ctttcccctc 120ag
12221122DNAHomo Sapiens
21gtattggttc taaaataata ctggaagctt ttgctcataa tgtggtttct gcctcaccca
60cgcacagcaa tcctggtgtt ctatttttgt tgcctgtttc tcaggctaca ctgcagttgg
120ct
12222122DNAHomo Sapiens 22ggctgcgggg ccgccgccga gcgagggcga ggagagcacc
gtgcgcttcg cccgcaaagg 60cgccctccgg cagaagaacg tgcatgaggt caagaaccac
aaattcaccg cccgcttctt 120ca
12223122DNAHomo Sapiens 23atttgtttgc tttaattttt
cagactgact ccctagaggt cgcttcttgt ttgcatagtt 60cgtcagtcaa acatcagtta
aagccaatat ggtttccacc atctgctgct ggatctatgt 120gc
12224122DNAHomo Sapiens
24acacctggtc ctgctcttca gacacaggac cctggtattt ctaagaaatc ggaaaaccgt
60cgcccagagg aaaaggaagt cttttgaaga gggtgcccgg cgtgggcagt ggggcagcgc
120cc
12225122DNAHomo Sapiens 25ttacttactg ttggagattg atgcttcttt tttgtctctg
cagctcaagt tctccagctt 60cgccatttac ttcagcaaat attaataagg taagcaaact
ccaaagaaaa ggtaaagaca 120tg
12226122DNAHomo Sapiens 26tccaacaaag ttaggtttgt
tgacctattc agtgagggac accacccacc agaagagcta 60cgcacatcac caaacaaagg
aaaacagcaa tttattatag gattccgagg aaagtggagt 120tg
12227122DNAHomo Sapiens
27cccccacccc ttcctccctc cagctgtccc ggctgggaag cagccgcgta gacagataga
60cggactccag accgccagct gagaccttta gctcaactag tggttggcac taagctgggg
120cg
12228122DNAHomo Sapiens 28ctacaatgtt taggattggg aggagacagc tctggaagca
tagcgtcact cgagttttaa 60cggtaaggtg ctgttgtctg tacctttgca tgtgtgtttt
ggattatcat ctgtcacacc 120tg
12229122DNAHomo Sapiens 29ctgggaaact taggacaagt
gactcaaact ctctgaggcc cagtgttctg atgataagtg 60cgggtctcat aggtcattgt
gagactactt agtgaatatc catggagtcc tcagcaaaaa 120cc
12230122DNAHomo Sapiens
30tcctgcctca ggccgtgagt acatgcagct gaactgctgt cagtcttatc tgtccagtgt
60cgggtgttgt gtgtccagcc acccataacc ctgggttggg actccctccc tcaccaaccg
120gg
12231122DNAHomo Sapiens 31accggctccc gcgcgcctcc cctcgcgccc gagcttcgag
ccaagcagcg tcctggggag 60cgcgtcatgg ccttaccagt gaccgccttg ctcctgccgc
tggccttgct gctccgtgag 120tt
12232122DNAHomo Sapiens 32tgacatccat ctaaggccct
gagtggtctg accttactta attcttcatc tgtaatgact 60cgtcctcccc agccccgcat
aagcacaggt agagtctgta gggtttaccg ccccgataca 120cc
12233122DNAHomo Sapiens
33gtgatgatga taataataat aatatagcaa ctctcagctt ttctacagca ctctgctttc
60cgctgtttcc aactcatttt gtgactggag gccaggaatc tcacttctga acctgctttt
120tt
12234122DNAHomo Sapiens 34cagctaacat ttagcatttt ctgatacctt ttatctcaaa
acctttagat aaacttcaaa 60cgccatgtca tgacaatatt agaattgtat ttacattatg
tatacacatc tcttccttcc 120aa
12235122DNAHomo Sapiens 35gcagccccgc cgcccgccgt
ggggtcgggg acagggagaa gggagtgcct gcctggtctg 60cgccccccgc ctgtcagccc
ttgcctcgag gctctggggc acccaactcg tcgactcctg 120ac
12236122DNAHomo Sapiens
36tttttttttt ttttctaatt cctgaggggt ggttgctgct tttgctacat gacttgccag
60cgcccgagcc tgcggtccaa ctgcgctgct gccggagcgc tcagtgccgc cgctgccgcc
120cg
12237122DNAHomo Sapiens 37cttggcagga gagatgagac cccttgaata ttgaagaggc
tgccgctctt cactcagagg 60cggcgggatc tgattaaaca tgcttacagg aacgactgtc
tccaatggct ttcctccagc 120ca
12238122DNAHomo Sapiens 38cccagaggct tggaaatcca
ggagccacag gaagcagtga gctttctgcg gagccggatc 60cggtggagcc aattcaccag
caggtcccgg cagcaactct tctacaacag attcctgccc 120gt
12239122DNAHomo Sapiens
39gggagccaca tcctggaaga gtggcctagg acagctcctc tcctgccaga gctaggcagg
60cgccgaagta gccgcatggc cccgtcagaa gaccccaggg actggagagc caacctcaaa
120gg
12240122DNAHomo Sapiens 40ctcgtccggc cgcgaccagc gcgtgggagc cgctcttata
gtgaccacca gcaaggacag 60cgcaggtgat gcacctgtag ctacccgggc atgcgcactg
cccgcctcac ctttcccacc 120gt
12241122DNAHomo Sapiens 41attatttacc tgacagggca
aaagagattt tgcagatgca attaaggtta aggaccttga 60cgtgggaaga ttgtgattat
ttacctgaca gggcaaaaga gattttgcag atgcaattaa 120gg
12242122DNAHomo Sapiens
42gtgtccctta aaagctgggg cctgggacag gaacgacaga caatgcagcc aatggcgtca
60cgcgcggtgc cccgctaccc aatcgaaagg cgtggctgag ggaaacgcgg tgggaaccgc
120cc
12243122DNAHomo Sapiens 43ccaagctgag gaagctcatc cccactcacc ctccagacaa
aaagctgagc aaaaatgaaa 60cgcttcgcct ggcaatgagg tatatcaact tcttggtcaa
ggtcttgggg gagcaaagcc 120tg
12244122DNAHomo Sapiens 44tctctctgtt ccttaagttg
aaagatggcc tttgtattca gagtagactc cctgtctttg 60cggtttggga gatgatgaga
aaccacagaa ttgctagtag tttatgtgga gatcaggtac 120at
12245122DNAHomo Sapiens
45tcgccggctt ctgcggtggg gcgatggggg ccgcaacctg ctgtttccag cacggaggag
60cgcccagggc gggtgtcccc accctcagcg agctcctctg cgacttctca tcccacctcc
120cc
12246122DNAHomo Sapiens 46aaaaattaaa aaggataacc atcacattac actgaatcca
cataggtcta gggcttttag 60cgctgcccac aagaaggctt ggggtggttt ccaacttgcc
ttacttcact ctgttcctgt 120ca
12247122DNAHomo Sapiens 47aatccgagga gggctggtca
ctactttctg ggtctggttt tgcgttgaga atgcccctca 60cgcgcttgct ggaagggaat
tctggctgcg ccccctcccc tagatgccgc cgctcgcccg 120cc
12248122DNAHomo Sapiens
48ggcatgaccc cttctttgac acccataacc caaggcactg taaacattcg ctattattaa
60cgctgtgttg gactcaaact tgaatgcctg cctgttccat ttagtgtcac aggagacacg
120ag
12249122DNAHomo Sapiens 49agcgctgcgc ccggacagct gtggtcctgg tgtgggtcgt
gtcggccgcg gtgtcgtttg 60cgcccatcat gagccagtgg tggcgcgtag gggccgacgc
cgaggcgcag cgctgccact 120cc
12250122DNAHomo Sapiens 50gctgctgtca ttttatgggt
cggcagccag agtgagagtg tccctgctgc cagaggacta 60cggcgggctg ggcgcggggt
ccccgcctct cgctcaccac acagaccccg cgcctcctct 120gg
12251122DNAHomo Sapiens
51gcttggttat tgcccatccc cattcgcatc tcagtccctt tatccagcca atcttgatgt
60cgcaaagttt acacagaacc agagataaat agagaagcca gacttgtgga gagaggaggg
120ga
12252122DNAHomo Sapiens 52ggcggctggg tctgtgcatt tctggttgca ccgcggcgct
tcccagcacc aacatgtaac 60cggcatgttt ccagcagaag acaaaaagac aaacatgaaa
gtctagaaat aaaactggta 120aa
12253122DNAHomo Sapiens 53cctccgccca gctccttggc
ctcccccggc tgtgggctcc gacccttccg tcccctgcag 60cgcctgcttc ctggaccaga
gaccgaaagc ctctcgctcc gctgggcctc agcaagccca 120gc
12254122DNAHomo Sapiens
54tggcccatgt cactggcctg ttcctgctgt aagtttcata acactgctgc tagcataaac
60cgcttgggta tcagattgtg tctgcattta tctttgacac aaatcatacc gaaggggaga
120ag
12255122DNAHomo Sapiens 55tcctccctgg gaggccttga ggaaatctcc ctgcccagca
gatttccgac gtggtgttca 60cgtggtgttc acggtgccgg ccggacccca gccgagacca
gattcctccc gaaatggctt 120tt
12256122DNAHomo Sapiens 56aaggaaagca gggatcgggc
actgcccgag ggcagatact tgggctttgg tgttgtccag 60cgcgctcgga gtgcgctgcc
tcgctcacgc ggtcccaggc cccgcttctt caggcagtgc 120ct
12257122DNAHomo Sapiens
57cttagtgttt gtcctcgaaa gagtcaatga tgttatcttt gacaaccttt attggcacta
60cggtacatat ggaagggtca aagtttctaa tacgaccgtc agggtaaagt ctaaacggta
120tt
12258122DNAHomo Sapiens 58tggttgcaag tgttttccct gcaaacatgg cctttgccaa
agtgtctcat cccacatgtg 60cgctggggct gccacgtagc cagtagccag gcccagctcc
caaccactac aagcccctgg 120gg
12259122DNAHomo Sapiens 59gcgggcccac gtggttgggg
ccctgccctg gcagggtcat cctgtgctcg gaggccatct 60cgggcacagg cccaccccgc
cccacccctc cagaacacgg ctcacgctta cctcaaccat 120cc
12260122DNAHomo Sapiens
60tggtaaaacc ccagcgtggt gcctgcctct ttgcttcctg ggctggccgt gagccaggga
60cgcgtgtcct ggtgccctag aaccagggca gggtggcagg cttggcggat gtgggaggcc
120gc
12261122DNAHomo Sapiens 61ctgtctgtca acagtgtttg ttttagccac ccagtaagtg
tttgttttag ctgctcttta 60cgtgagtaac actttgagaa gaagcacaag gaatttctcc
ataggagggg ctacttaaag 120ag
12262122DNAHomo Sapiens 62ccatagctgc ctagccccag
gggcttgtag tggttgggag ctgggcctgg ctactggcta 60cgtggcagcc ccagcgcaca
tgtgggatga gacactttgg caaaggccat gtttgcaggg 120aa
12263122DNAHomo Sapiens
63cgggttctcc tggcgagttt taagtcacac tggatcgctg cttattttca gagatcacct
60cgcacccatg cacctggaag gcacccaaag agaatcattt taagaaattc acttcatctc
120ac
12264122DNAHomo Sapiens 64tgcccgtcca cgttccaacg gcccgcagcg gggtcgcccc
actgccgcat ccttactccg 60cgccctgcgc gcttacctgc ccacgaagtt ctcgagcacc
gagctcttgc cggcgctctg 120gc
12265122DNAHomo Sapiens 65gtttatcttt tgttagaatc
ctcaagcagt gcatctagtc attcatttag caaacatata 60cggacgacat tgctctaggt
gccagaggtt cagtcaaaac atatcatggt cctttcccct 120tt
12266122DNAHomo Sapiens
66tcttatctcc caggagcaag tatcctgtgt gcgcagcgca tgaatgtgtc tgggcatctc
60cgcgtatatt tatatagtgt gtgatgcgaa aagcaggacc agcaggggag gaagaggggg
120tg
12267122DNAHomo Sapiens 67cctttttaat tttttgtttg tttgtttgtt aaacagattt
ctgcctggca gattaaccaa 60cggcaagaga ggctgatctg tctacattct gagtactgcc
cttggcaaga cacctagaac 120ag
12268122DNAHomo Sapiens 68gtcaggatct tgaaacttga
attcataaaa acccagaaag ccccagaaac aaagacttca 60cggacaaagt cccttggaac
cagagtaagt gtcacttgtc ttttctgtct tatctgttac 120tg
12269122DNAHomo Sapiens
69gagtaaagca aagcctcagg gcacagatgg gcatcatcaa tgcccatctg aaagatcaat
60cgtcaacatg ttgcagcctg ccactaggaa gcacaaacca gaggactacc aggacagcag
120ct
12270122DNAHomo Sapiens 70ccaccagcct ttggcctctc gatacacaca acatccagga
cttgtgccct tgccccatca 60cgacagacaa agcgtccctc aaggcccccg cgtggttcag
acagacgccg cagccaggat 120gg
12271122DNAHomo Sapiens 71tcaggggaag agtggggtgc
ccgggctggg caggagcgac cgggccgcga gggagcagag 60cgcgcgctcc ccctggctgt
cccgtgcggc gaggaccgca ctgagctgcc ccagaggaag 120tt
12272122DNAHomo Sapiens
72cagctagcgg caagcggagt caggcatccg ttcagactga cagcagaggc ggcgaaggag
60cgcgtagccg agatcaggcg tacagagtcc ggaggcggcg gcgggtgagc tcaacttcgc
120ac
12273122DNAHomo Sapiens 73gagtaaacgc atccacagac cagatagtca aattaagtta
atgattctct cagacaccca 60cgccactggc tcagcagggt tcaaacatga ccttgaataa
agggtcctta caaaatgatt 120ga
12274122DNAHomo Sapiens 74gagtcgcccc tttccgcagc
gcttctcccc aagaatcgac tgcttcggaa gtgactcgag 60cggaggggtg cctaaacgac
tgaggtttcc catccggaaa ccacacagct ctgtcgcatc 120cc
12275122DNAHomo Sapiens
75agttctgcgg cgccaggttg aggccgccag agtggcgcac ggagctaggg tacatgctca
60cgtccttgtc caggaggtag ctcacgtaca tggtggcgag ggtccgggag cagacctcac
120ca
12276122DNAHomo Sapiens 76ccgaggaggg ctctgtgtgc ttggatcaag gactcaacag
ggaaggtggg agagttctgt 60cgcactttgg acactgtgtg tcatcctgat catgtgattg
tttgattttc cttctgggga 120tg
12277122DNAHomo Sapiens 77cttcctcagg aatttgagct
ggggatctgc atcctggcca ttgcagtcct ttagcatcct 60cgccgcgccc tgagcgcgct
ggaggctcgc aggctgcgcc ctcccagggc tgatgccgcg 120tc
12278122DNAHomo Sapiens
78caaacgccaa tgaaatgact ccctctctgg ctggcagctt aagcctgagt cagtcttctt
60cgccttttgt aattgtctta agtaggcgtg gctacgtggc tacaagtgcg tcgtcaaaac
120gg
12279122DNAHomo Sapiens 79aaaatttttt tacagcccta gtgtgcgcct gtagctcgga
aaattaattg tggctatagc 60cgcctcgatc gctgtctccc cagcctcgcc gcggccgctc
cgggacgcgc ccgcccgccg 120cc
12280122DNAHomo Sapiens 80gtgcgcctct agcccgcact
gttctgacag cctaactcac aacccctcca cacacgaaga 60cgtgagcaga gctggcacag
aacccccaaa cccacagggc caggtccgcc tgcctcacca 120ag
12281122DNAHomo Sapiens
81ggtgcgttgt tcgcgggggt gaattgtgaa gaaccatcgc ggggtccttc ctgctgaggc
60cgcggacacc gtgacctcgc tgctctgggt ctgcagggaa acgtaggaaa aaaagttgtc
120ag
12282122DNAHomo Sapiens 82ggcagctgcc ccccaacccc cttcagcaat tttcaagcag
taactgggct acactgctga 60cgtccagctg tgactctcac actggcaatg ggtccaggca
tccataagtc agggaagtga 120gt
12283122DNAHomo Sapiens 83gtctccccct ccttgctggg
ggatccatgc cctgacagct aggggactca ttcattcact 60cgctcattca ctcgttcatt
ggttgctgca tagccactca gctcatatta cgtgcaaggc 120gc
12284122DNAHomo Sapiens
84aagctgaggt ttctaagggg acgactaagg aatccacgca tcactaacgt tatagagact
60cgcgaagtgc cgctgtgttg gttgtgaaat ttccctcttg tagctgtctc tcgtcagatt
120ta
12285122DNAHomo Sapiens 85acaccccatc acccatcctc tcaccccaca gaatgtggag
ttagacagcc tgagtttgag 60cgcacagcct gccacctcct agctctgcaa accggagcaa
gtcaccctct gaggcccagt 120tg
12286122DNAHomo Sapiens 86ccagagcagc ctgttgtgcc
ttgtgcctcg aagaggtttg gtatctgcca gtttctccct 60cgctgttttt atggctttca
aaagcagaag taggaggctg agaaatttct ctgttgaata 120cc
12287122DNAHomo Sapiens
87cggttccacg tgtctctggg aaattttttt cccctttctt cctaataagc ctgcgtggaa
60cgcagagcct gcgcaatagc cccggtgaag ttgtcgatgc cctgaactct ggttttttta
120ct
12288122DNAHomo Sapiens 88gccagtcgcc caaccaagct aacaggtcct aagtcctcgg
agccaatgag tttccaggat 60cggaggaggg agacagacac ggagaggtca ttggttggag
cttttcggta acgaggccaa 120tt
12289122DNAHomo Sapiens 89gtcacgggga cgagggacca
gttcaggaat ggcagagcgg accctggagg cggccccaaa 60cgcctccctt cgccgccgcc
gcctcctcct ccccctccat gacagtctct gggtgtttac 120ag
12290122DNAHomo Sapiens
90tcgtgccact gtgagcccgg gacacaaggg ctgactccag ctgttggctt tgagtatccc
60cgcccgcgcc cgtccttgct cgctgacccc aggcgaggcg caaacaaccc acgacgccac
120gt
12291122DNAHomo Sapiens 91tataggtcgg aaggtggtaa tacgtccaca atgtttggct
catggtacct gctccataga 60cgtcagccat tgttattttt atcatctcac ctggagtcct
ggccttggtg cgagatgccc 120ag
12292122DNAHomo Sapiens 92ttttggttca ctggatattc
gaaacctcaa tccactgttc aaatcccagc ttgctttcaa 60cgactttctg ccttcaacaa
gcactgggtg gggcttccta gtccaaacaa caaataggga 120aa
12293122DNAHomo Sapiens
93ggaagcggct ggctaggagg cggggcgtgg ggcggtggaa ctcctgggct gcggcattca
60cgtgatctgc acgggcgcag atgtaggcac cggtccgagt gcctgccctc tgtccccgcg
120gc
12294122DNAHomo Sapiens 94tgccagccta agccctcagg tttccttttt ctttttctac
atcaggaaaa gcacttttct 60cgccctgcct gcagagcggg ccacccctag ctgcaggtga
gggacgggag aggagcctcc 120ca
12295122DNAHomo Sapiens 95gacgggagtg gggaggtggg
tcggggtgtc cctgggccgg accgggtcgt gggactgggt 60cgccccaggc aggagagcct
gggaggggcg ggcccccttg gcgtggcagg gagaggtgga 120gt
12296122DNAHomo Sapiens
96cggcaagttc tgctgatggc ttcggggtgg gctccagaga cttttctgtc agcggaacag
60cgcctgttcc gatctgggaa ttaccctgaa gcagcaacaa gcctaggttt tcagcagaga
120ac
12297122DNAHomo Sapiens 97gatggcgatg cactgatggg ggtccactgg gacttacatt
tacacagagc tcgctggtac 60cgccggccct gggtgtgcct cagcacgtgt tctgggcact
tgttgatgtg ccgcagggtg 120ag
12298122DNAHomo Sapiens 98accacatcgt ctttttgcaa
taatcttggc agggaaaaat atgctagcca gggtccacta 60cgtcgatttc aagcacggaa
gatgggtcac accaggcact tcaaaagacc cgtccctgag 120gc
12299122DNAHomo Sapiens
99tcaccatgcc ttgctttggc ccttagctgc gccaggcatt tggctgtcct ccccaggacg
60cgcgagggtc tgtccacttc acaccccgaa tgccaagcaa agcactgggc tcgggtacac
120cg
122100122DNAHomo Sapiens 100gttcctgttg aggccttgcc cttttctcac ccgtgtccgg
agtggccccc gctccagaag 60cgcacagccg ctggttgggg catccctgac atgaagcccc
tctgcccgcc tgggcgctgt 120cg
122101122DNAHomo Sapiens 101ttttgtaaca tgagtatgac
tctaaaatct caatacccac tagcagttat tccacatttc 60cgcctaaatc tcccagcagc
cactaatatg ctttttgtac ctgtgatttg gctattttgg 120at
122102122DNAHomo Sapiens
102ggagagcggc tgagtcaggc tctggcagtg tctaggccat cggtgactgc agcccctgga
60cggcatcgcc caccacaggc cctggaggct gcccccacgg ccccctgaca gggtctctgc
120tg
122103122DNAHomo Sapiens 103tcctcctccc tcccggtcaa caccagccca cgggcccttc
ggctgctcct ccggggacaa 60cgaccctctg tttccaggag acacttgagt aattcggaaa
ggtgtaagcg gttcttttcg 120ct
122104122DNAHomo Sapiens 104aatcagtgga gattattgtc
tcagaggatc cccgggcctc cttaggcaaa tgttatctaa 60cgctctttaa gcaaacagag
cctgccctat aaaatccggg gctcgggcgg cctctcatcc 120ct
122105122DNAHomo Sapiens
105gagagatcct tgtcatcttc cttctccctg caggagggtg tcagggtgta agtgctccct
60cgctgtgcag gggttcattt cattcatttc attacccttg ccctcctcga ggtacctccg
120gg
122106122DNAHomo Sapiens 106ggacaggcac acaggcccag gtgtgtaggc cacagcagct
gcagtcctga aaggctgcaa 60cgtcccgacc tccaggagag accaggccca ggatgcctcg
cctgtttttt ttccacctgc 120ta
122107122DNAHomo Sapiens 107catcgcgccc cggtcgtgag
tgcgctcaca cgcagcctga gactcgacgg gagggggtca 60cgtggaagta tctgagagag
gcgtacttgg ccactaggaa agcacctccc cctttccaaa 120aa
122108122DNAHomo Sapiens
108cctcaaattt ctgaggacct acaaactaca aagcactctt ctaggggccc aaagataaaa
60cgctcccctc gtgaaaatcc cggacttttg gtgggaggtg gggaaggtga caactatgct
120ca
122109122DNAHomo Sapiens 109cgcgggaagt gagcgggctg cctctgcgag gcaagtgcag
ttgagctgat gtggatctta 60cgtcgcttga gtgcccacct cctcgtcctc tccccatttg
tccgccgcac aaagacgctc 120gc
122110122DNAHomo Sapiens 110gcaggtcttt ggggagcgct
ttgagtaata ttagagcttt cactaaaccc tggcctatta 60cgtcccctcc cctgagattt
acctttatat actcaagttc tttcatgcca ggaaggtagg 120ct
122111122DNAHomo Sapiens
111tatggaaatt agtcaacact gacaatctgt cgcctgcagc agttgcttgt ttgcaaatca
60cgtcttttgc agaaatgagg ccagcccttt tcgggacact tccatcgctt tttttctttt
120tt
122112122DNAHomo Sapiens 112atttttgtgg ttgagggact ttaaaaattt agccgcttgg
gaagtacaga attttttaag 60cgggctgaag ggataatgta aatttctgcc acaggcaaca
tcgaaggaag cagagagatt 120tg
122113122DNAHomo Sapiens 113cagttgtgtg caagtgcata
tacgtgtagc ctagtagccc gtgtccttgt tccttgagac 60cgcgctgcct ccgccacgtg
tcacacgccc aggcacacgt ccccgtaggg agagccgggg 120ga
122114122DNAHomo Sapiens
114aagctggtac aggtcactct gaacataagg tacagaacgt ctgggtacaa gtccaggctc
60cgccactggc tcaccgagcg acctccagac acacatatgc acatcttagg cctcggtttc
120cc
122115122DNAHomo Sapiens 115aacccagccg gccagggctg gcagcgtgct gacgaagggc
cgatcaaata ctgatgctgc 60cgcctggggt ctccactgga ggtcacgggt ggagagtagg
gcggactgga gaagtggaga 120tg
122116122DNAHomo Sapiens 116ccctggatcc caagtgccgc
caggcaagca gaccccgccc acagacacat gacgctccca 60cgccaaatgt ggatccaacc
gccccacaca ggatccccgc ccggcccggc ccggggcgcc 120cc
122117122DNAHomo Sapiens
117tggccagaaa aatataactg aagcccaagg tcagaagcca agctaggcag tcccacttag
60cgctgcccga gttgatgggg acctcagttt ccccacctga gcctggatcg gctgaacctg
120gg
122118122DNAHomo Sapiens 118ggcaggcggc tgctggccag ggtctcgggc acaccctgag
atgagaattt catctaagag 60cgcgcgcgcg cacacacaca caacccactc acactcttct
gggcgcatcg ctgaccgcgc 120ca
122119122DNAHomo Sapiens 119ggcagccctg cgggcctacc
ttgtcccctt tgcttaggac ctgccaaggc cacgtctcta 60cgcttccgaa cagcgagttc
ttgatcatgc ccaacatgtt gtagccgaga cgctcccgac 120gc
122120122DNAHomo Sapiens
120gctgggtgct tgtcgcttcc tgtttattcc aaggtgaggg gcagagagaa attcaacaca
60cgcctgcttc ctccggggct cggagaccca gcctaagtgc aacagcagca gccccagaca
120at
122121122DNAHomo Sapiens 121ctggaaaata agtgacttgt ccaaggtcac atgacaacca
tggggcagtt ctggctagag 60cgctggtctt tgtgaccccc cccgtgccat ttttctttct
gtcacaaaca caaaacccat 120tt
122122122DNAHomo Sapiens 122ccaggaccag ccccagcatg
cagagcgctc tggcagccat gaccaccgtg ggctccggga 60cgcagctcag gactcgcttc
atggtccagg aggcctcatt tatgcaccgt tgtttgcaca 120gc
122123122DNAHomo Sapiens
123cttaatctcc acagtgccaa tgatctcagc cacatttcat caaactgtaa taaccataat
60cgggactagt ccactacctg gacccctcta ctcttaaaat atgaatctct ctaatatcct
120ac
122124122DNAHomo Sapiens 124accgttcact ggggccgggc tggaaggctg ttcctttaag
atcaccagca ggagcacggc 60cgccgcgtgc aggctgcgcc ggggcatctt cgcgggctcc
tgcggggcgg gcgcgggctg 120tg
122125122DNAHomo Sapiens 125gcgaccaaga actgcctctc
cacgtcccca cccccatgcc ccttggccag ctaccactca 60cgcatctcct atgaaaaggt
tgggccaaac ttcgtccaca cggctgcaag aagacttccc 120tg
122126122DNAHomo Sapiens
126tgaggggggt ggggaaggat gcgatgtgca agcacggagg gcggcccggg ggtgcgatac
60cgcacgcccg gggccaggac tctttacctt gtcgctgtaa tccctcagga cccgctcgat
120ag
122127122DNAHomo Sapiens 127acggcccctc ctaatgatgt ttcttttcct atcattgtcg
agcccttaga accccaggat 60cgagggaggg aaaacaagcg ctcaagcact ccctcgttgg
tcccaggaca caaggcctcg 120tc
122128122DNAHomo Sapiens 128ggtccacaaa gaactggacg
gatgcagtgg tggatggcga tctctctgga ccactccgga 60cgcgcccagc agacgcagcc
tacgccttta ggtcctagga ggctgagaag ggtggggaga 120gg
122129122DNAHomo Sapiens
129cggctctctt ttgcgagcaa ctcttgagtc caaggcctgg gcgaagctgg cggagacaat
60cgcccaagtt tgaaggggcc gcgaagcttg gcgggggagg tcggtgttgg cgcctaggcc
120cg
122130122DNAHomo Sapiens 130tgggttcaaa ggggagagat aaggcgcaga ctagaaacgc
taggctggac ccgggccagg 60cgcgccgcgg ggcagagatg ggcggagcgg gaacgggggc
gggggcgaga atgggggggc 120gg
122131122DNAHomo Sapiens 131ctcgggaggg agctgctttc
tgccgaggct gccccagctg tgcgtctgtc tttttccaca 60cggtaggcta cacacaaccc
agctgtacca gcatgtgcca gagacacgct ggccaatcgt 120gt
122132122DNAHomo Sapiens
132cagcagagag gaggccacag agaagccgtg gctgaagtcc ctggtgagcc ggaaggatca
60cgtcctggac ctcatgctgg aggccatgaa caaccttaga gattcaatgc ccaagctcca
120aa
122133122DNAHomo Sapiens 133ctccagagcc gaaggctgtt tttctgattt gttcagggcg
ctgcctgcta tgcctttccc 60cgcgcctgca gatgcagacc atctccgttt aggggctgcc
tgggtgccgg gctgtggtaa 120gg
122134122DNAHomo Sapiens 134cggggtcgga ggcagggttc
aaggcagcac ttacaggagg atctcctgct tcgtcaggaa 60cgtcaagtcc tggaaggcaa
agccagagcg gggattagcg gaccgctggg aggccgcggc 120cg
122135122DNAHomo Sapiens
135cagcctccac cgggaaccag gggcgcgagt cgctgctcag tggcctgggc ctgcatgtgg
60cgcggcggga gctgctgcct agggccgcgc agcgacgggg ggtgaggact acatgtcccg
120ac
122136122DNAHomo Sapiens 136ttcctcatcc ttaacttctc tacggcaaag tatacggctg
atgtgttcct aggctttcct 60cgcgttttgt gcgtttttat tcaaattaga atttcccatt
gaaacctttc gtgcacattc 120ta
122137122DNAHomo Sapiens 137gggtcaggac ccgcgggggt
ccgcgctcgc ggggtgctgt cggagaacca cgtctgtcga 60cgctcggttt gtgtttagaa
cccaagtttc gaaacagaac cttgccgctc tacctgggtt 120cg
122138122DNAHomo Sapiens
138ccactgcact ccagcctggg cgacagaggg agattctgtt tcaaaaagaa aaaaaagaaa
60cggcgtccaa catgatcagt cattagatgt aactatgtaa aagtcagctt tagattagtt
120ta
122139122DNAHomo Sapiens 139tctctcccat ccctcccctc cttccctagg ctaaagccgc
ggatacctcc gagagggcag 60cggcagctga cagagccgga gcctcccacc ccaggataca
ccaaaatctg cagcgcctgc 120ag
122140122DNAHomo Sapiens 140tcctgcagag aactcctccc
cctgcttggg aaatgccagg acaaccaagt gttctgttct 60cggactggaa atgaccagat
gataatttct ggtaatacgg gcttgttaga cctactcaaa 120ta
122141122DNAHomo Sapiens
141tttttacagg gaatgcattc tttctgaaag tatcaagacg gcgccaggca gctcagtgtt
60cgcagacagc tgtggcgcga cgcaacttaa ggaggttcta gtgtcatccg cgccgggggg
120ga
122142122DNAHomo Sapiens 142cccgctgcga ggtgcgagga ccaaatagag gcgtaacaag
ccaagggtcg gagtgggcaa 60cggaacagtt aaaggcattt cacaacagcg atttaggtct
gcaagcagtt tatggagtac 120ca
122143122DNAHomo Sapiens 143gacctagacc tactgtatca
gaatctctgt gctggtcctg agaatgtgca ttctcaacag 60cgcctcacat tccccacccc
aattcttctg cagctaacgt ttgagagcgc tggtctggtg 120cc
122144122DNAHomo Sapiens
144aggtgctcca ggtcgctcag agagtcttca ggattcctga gtcgccgagt ctatggcatg
60cgctccgggc cctgactaca agctggtttt caaaggaagt ttgtggtttt tcttttcttc
120tc
122145122DNAHomo Sapiens 145agtggaggga ggggaaacca ggcaccaaag caaattcctt
catttcataa tttcatctgg 60cgcccccgtt caatcagcct gcattgtcga ggctttagga
gaggcagtta ggaaaggaga 120ga
122146122DNAHomo Sapiens 146cccttgacgg cgcccaaggc
cccgcccgtg cggcgctgcc cattccccat caccagagat 60cggttcgtcc agcgggcagg
ccccatccca atgttaggtc aaagctccta tcccttggac 120cc
122147122DNAHomo Sapiens
147gacctccagt gatccgcctg cctcggcctc ccagtgttgg gattactggc gtgagccccg
60cgcccgcccc tggctggctt ctttgccgca agctgtttca tcagcaaagt ctttgtgacc
120tg
122148122DNAHomo Sapiens 148gtcgcagatg acgtgctgca ggtcgctgtg gcagtggcag
ttctgggggc aggcggccag 60cgccggcagc agaccagcca ggaggccgag gctgagcaag
agcattgggc ggaccatggc 120tg
122149122DNAHomo Sapiens 149gatctgagac ttccaaaaaa
tgaagccggc gacaggactt tgggtctggg tgagccttct 60cgtggcggcg gggaccgtcc
agcccagcga ttctcagtca ggtgggttcc ttctggcact 120cc
122150122DNAHomo Sapiens
150gtgtcctctc tgtttcccaa cctccccata ccgaggaccc cacaacccgc cccgggatgg
60cgcctggctg ctcgcaccct aattcaggac cccaattggt gggagaggaa ccgcggtcct
120ca
122151122DNAHomo Sapiens 151tgagggttcc caaccctgct aagcagttgt ctccaggtca
tgcaccttca gaatggaaag 60cgctttggaa tgacacgatc actcccgttg agtgggcacc
cgagaagcca tcgggaatgt 120cg
122152122DNAHomo Sapiens 152cagcaaggct cagcctcaag
attcacagca tctcagacac agcctaggta aggggctctg 60cggagccctg tggtcttcaa
aaaccatgtc cttgggggag ggggcaggag gcaggtgggg 120aa
122153122DNAHomo Sapiens
153taagcatttc ctggtgggtg gaatacgcca tgaactaggt gcggcctcaa gctggttact
60cgccctgcct actccctctc gtgtcctccc agtaccccct tagacccacc agctctgagg
120ga
122154122DNAHomo Sapiens 154gcagctggac ttgaggctgt ctctgcacag agcagcaggt
gaacagccct gtggagcccc 60cgccccgcca tgcagcaact gctccagcct cacagctggc
tccctcaggt ctaaacacag 120cc
122155122DNAHomo Sapiens 155tggcttgctt cattgattta
cattaacctg cctggcgctg tggacacttc agtttgcatc 60cgccttctat gcatcttgta
tatctctcta agttctacct ttttcttttg cttttctgat 120cc
122156122DNAHomo Sapiens
156ctggccccgg ggcagcaccc aaagttttgt cccccccacc gcccccaccc ctgttcacct
60cgcagccttg ggaacaccag gctccttagg cacgtctagc tccggacaac ttttctctcg
120tc
122157122DNAHomo Sapiens 157cgaagcccct cacagcacag gctctggctt gaggagattt
ctcccggggc agccgctgga 60cgcagtttat gatcctctta atctttactg tctccacagg
ggatcaactg gccacacctg 120ca
122158122DNAHomo Sapiens 158tctctctctc tccccaaagt
gcatgcaaac acatatggaa ctgacatagg catccactgt 60cgcacttcaa attaaacaga
cgcacacgac agatattctc acagaaaagc agtcagccaa 120gc
122159122DNAHomo Sapiens
159tactccttta caccaaaagt agaatcttca gcatcattat cttctccaga agcaggagaa
60cgtagtgcac cagaatttgg tcataaactt ggctttgagt cctagtcctg ccccttacta
120ac
122160122DNAHomo Sapiens 160ctgaggacaa tgcgttccac acccgctggc tggctgatgt
ttgattctgt aactatacca 60cgcccagaat tctctcaaaa gggaataaaa cacaggtcaa
attcctcacc cacacactcc 120ac
122161122DNAHomo Sapiens 161tcagggaaag cttcctcttt
ttgtgcactt gtttgtccta aggccgttac aagtattgtt 60cgttcattct gcaaatattt
gttgaccgcc tatgtgccag gccaacaaag tccctgccct 120cc
122162122DNAHomo Sapiens
162gttcgcggcc cccttgtctg acaccccctt tttcccgcgc cgcggcctga acaagggttg
60cggaggtctc ccacccgctg gagcccgttc agacctgacg gaatcccttc ttgcagaatt
120gg
122163122DNAHomo Sapiens 163ttcgcacttt cgagtgcgcg tttgctgccc gccgcagccc
gggcgttgaa ggtagtaaag 60cggccacccg gccgcatcat ggtgaccccc tgtcccacca
gcccctcgag ccccgccgcc 120cg
122164122DNAHomo Sapiens 164gcaccgaact acctcctttc
gcctacaaaa cgtaggtggg gaccactggt gttggaatga 60cggcccacct cgagtttcag
gtgacttcca ctctgcaatt aacttgcagg cagccccaga 120cc
122165122DNAHomo Sapiens
165cgggcacatt agatgactta cccacagtca ccttgctagt tagtggcaaa acaggtacca
60cgacccatta tctggcctcc tcaccagtgc tttttttttt tttttttttt tttgagacgg
120ag
122166122DNAHomo Sapiens 166atgctgtttc tctaggtcag caactaaacc cagaaaacgt
ttattgagtg aatgatgaaa 60cgacaggtga atagatgaac gcaaggtgtc gagttaacta
ttcttctaca caagtcctag 120ca
122167122DNAHomo Sapiens 167cacacacaca caccccagtg
ccaggatcag taatttatga gagtcacagt gaccccagaa 60cgacctggcc tccctctcca
acaaagcaac agcaccaggt tggcactgaa taccaggaag 120ag
122168122DNAHomo Sapiens
168ggggcggggc ggcagaagga cctatgttcg aggctgcact cggatttgag agccagagaa
60cgcgaggggc gagcggactg gcggctgcta ggcagccgcg ccccagcgct tccgtaccta
120ag
122169122DNAHomo Sapiens 169gaatggtcta aggacacatg gtaaagcaat agcagagcag
ggtacacccc tggactcact 60cgtgtggagt tcagtgactc tctgggtgat cctccctggt
gcctgggacc cagctctatc 120ag
122170122DNAHomo Sapiens 170cctggcgaat ccaatcccca
tcctcaatca cacatccacg tccccaaaac aaatccttca 60cggtctgaag atgagatggc
aaaaccagaa cacacccaga aagttgacac agaagggggt 120ga
122171122DNAHomo Sapiens
171gtgcctggga gcctgaggcc gaggagggtc ccggcgtagt aaaggggcgg caaccccaaa
60cgggccaggc atcaaaatga gacagcatta aaccgagtga catctctgtg ggtccttagt
120gc
122172122DNAHomo Sapiens 172gtgatgttta gaaccttttg ggggattcct tctctctcag
aatttaacct ggcaagagaa 60cgactgagtt ctaggaattt tcttgtctgg agagagtaaa
ataaatgtat tttttaaaag 120ct
122173122DNAHomo Sapiens 173aggacgtgcg tgttaggggg
caggtatttg gagccaggcc ccactttcga gttgtctttc 60cgcaggaacc agagactgcg
gacggggcca ggaaccagga accgttaggg agataaggaa 120gg
122174122DNAHomo Sapiens
174ggaaaaggaa aagaaagaag gtagttcagg ccccggtggc cagcaccctc aaggaggaca
60cgagcagttc ttacctggag atggaagagg agctgctctg ttcgttcact caggaattct
120gt
122175122DNAHomo Sapiens 175ccctcgcacc ctggtccttt gttgcaggct gacatctgcc
ccaccagagt caactgtcag 60cgccttgcac gtgaattagg gaagcggagt aacctggggt
tccatccctt cccgggtccc 120tt
122176122DNAHomo Sapiens 176cgggtttcgt ggcccttccc
ctacgctgga atcttctgtg tcatttaggg ggaggggatg 60cgggacggca tctgtttgac
aacgcattgg tcccacagac agcctttaaa aacaactgct 120tt
122177122DNAHomo Sapiens
177agaaggtcgg gctgcgctgt gggctgcggg gagccggagg cctcttgatt ggctctttga
60cgctttcgga ccaattgtgt tgctgcatag gcgtggtttt cacaggtcga gtgctggggg
120at
122178122DNAHomo Sapiens 178gaagtggtgc tggtttggct caagcatttg attcactctg
ttgtctttgg aggtggacac 60cgcccagagg aagacgaaga ggaggagatt gtgattgggt
ggcaggagaa gctctttagc 120ca
122179122DNAHomo Sapiens 179gtggttttag tatatacaca
gagttgtgca actaccatca caattttaga acaccttcat 60cgcccttaaa agaaatgcca
cacgctttag tggtcactcc ctatttcccc taaccctcca 120ca
122180122DNAHomo Sapiens
180ctcacagaac ccagctggta tggaggggcc tctcctggga cacccatgtg catgctatag
60cgctggccac caaagacagg gggtggcagg ctgtcccatg aggcctttca tggccccaaa
120gc
122181122DNAHomo Sapiens 181accttgtgat ccgcccgcct cggcctccca aagtgctggg
attacaggcg tgagccaccg 60cgcccggccc ggggactctt aaaatacaaa cattactgga
aggtcacctc ctgctagggc 120ca
122182122DNAHomo Sapiens 182ctcttccatt catcagtctc
tggagcggct tctgctgccg aggcaggggc tccaggtcct 60cggagggtct gacagcccct
cagatgatcc cggaacgaat tcccacctgc tcccgggagc 120ct
122183122DNAHomo Sapiens
183gctgtggtgt gaattagttg gtctaagctt ttgggccgct tccaacttct ctattgctca
60cgccctacag gtcaaggaaa gaagtgatgt aatgcactta gctaggccac tttaattaca
120at
122184122DNAHomo Sapiens 184gaggttattc ccaaaaatat tcgctctgac agttaggaat
gcccagggcc accgggatga 60cgcgctcgcg ccggtgtggg tagctgagag ttgaatgtcc
gtgaccctgg tacagttggg 120tc
122185122DNAHomo Sapiens 185ccccgcgcgt acctgccgct
gccgccgagg gcagcgccct ctgtgttccc tgccttccta 60cgggccgacg cctggcatag
ttgaggtttc gctccaactc tgtcctgccc ctgatgtcac 120ag
122186122DNAHomo Sapiens
186ggggccagaa cagcccggct tcagtcagtt gtggggtcgg cgttagacgg tggagttcga
60cgcccctctg tccattagca attagtgcta gcacaaggcc tggatggagg ggagaggaag
120gt
122187122DNAHomo Sapiens 187agcacagccc atcctggctt cgggccaggc tgattattca
cagccgtgat gtcattgaat 60cgcaggaatt tggaagtggg atgggacctt aagaatcatc
ttcctttaga gtcctagtgt 120cc
122188122DNAHomo Sapiens 188cgcaggtgac agccgaagtt
catttcgtgg tctgcttctt tcctgtgtga ccttgcaaaa 60cgggcttgac ctccttattt
atcgacctct ttatcttctt agtaaattga agatattagt 120cg
122189122DNAHomo Sapiens
189attacaggca tgatccacag cgcccagcca ataacacagt cttgattttt atggagctta
60cgctctgatg gaggaagaca gctgaaaaac atgcaaaaaa aaaaaaaaaa aaaaaaaaca
120cg
122190122DNAHomo Sapiens 190aattgcaata aaaagacggc ccacagcagg ctgcattccc
atggctggcc agaggaggaa 60cgctttgtgt tctcatcgga ggtaagtcct gctttaagcc
ccaggaggct tcctcctaat 120cc
122191122DNAHomo Sapiens 191tttcgcgttc ttcggactag
ccagaggctc aggttggtga ccgagcggca gagttcctag 60cgcctgcagt gtggtgaact
ccaactttta ggccaagttg aaaatgcagc cgacgacccc 120ca
122192122DNAHomo Sapiens
192gctcagggac ccagtcgctt gagctcattc tcttatgacc caatgtggct gcccaaaaga
60cgcctgagac ccgcggccca agcacgggct cgccggcgcc gagtcccagg caggagccgc
120ag
122193122DNAHomo Sapiens 193tggcccctca tggctcctgt caccaggtct caggtcaggg
tccagcaggc cctgagctga 60cgtgtggagc cagagccacc caatcccgta gggacaggtt
tcacaacttc ccggatgggg 120ct
122194122DNAHomo Sapiens 194tgcgggtcag cctccgacta
caagagcctc ggcccacacc gggaactcag tgaacgtcag 60cgggagctgg ggcaagagca
ctgactctga gacagcagcc tccgctcact atttgaaggc 120gg
122195122DNAHomo Sapiens
195agagtcacgt ctgtgcaaag agaagaacga ctctcgacct cctggatcca gtcaccacca
60cggtcccaac acagcgctcc aaggactccc taacgccaat ggaaatggtc gctactaaag
120gg
122196122DNAHomo Sapiens 196accaccacca caaggtaacg ttctgcccca cttttctcat
ccatgttggg tggagacttg 60cgccatccct cggctctcta catccatccg caccacgccc
aggtgaactc acactcggga 120cc
122197122DNAHomo Sapiens 197tccttccccg ggaggtgggc
gcgcgtagca caccgcaccg gcagcgcctc tgctagcgaa 60cgctccttta ggtctgcacc
tccgccagct cctagtggcc aaaagcctgc ccccacgccc 120ga
122198122DNAHomo Sapiens
198gaaaagcaga cgccatttgg cttaatggat ttggctatca tctctcctga tttcctggaa
60cgcagacctt acaagtaaac agcctagtgc aggagctcag tccaaatcaa tgacttccca
120ta
122199122DNAHomo Sapiens 199gtggcgagag caggttcggg ggtccggagg gtcggagggt
gggctgcgcg cgggaatggc 60cgccgcgaag gaggggcggc ttcctcgggc atcccgggcg
cccggccccg tgcatgcaac 120ag
122200122DNAHomo Sapiens 200tgccgagatt tcggcagcgt
gctgagcttc atcaaagcat taaaacaatg ctgcttgaga 60cgtcagaggc tcatccagga
agtgcaaccc agagggcagg atttcctgct ggactttgaa 120at
122201122DNAHomo Sapiens
201aggaatcccc ggacctctta gagctttgct ttggggcaag ggccaaggag gctttgcctg
60cgccaagtgc agttgactgt ctgggtttac aaaataaacc cagaagcagc ctgacgtctc
120cg
122202122DNAHomo Sapiens 202ttaacataag tgctctgggg gtgagtgtgg cacggccagc
cacagagaaa tcacactgct 60cgcccacaat tcggatgtct cagagggagg gggaaaaaag
atggttaaaa agtcgagctt 120ac
122203122DNAHomo Sapiens 203cctggtcttc cctgatcttt
cactgtgtgc ccttcaggca ctcaagctgt taatatcaca 60cgagcttaat aggctcccct
gagatggtcc tcatgtgaaa ggattgctct gtaaggtgta 120cg
122204122DNAHomo Sapiens
204tacagggtct caataatagg attcctacta tgtccaaatc gagccccggc ttttcgtata
60cgatgtcacc aaggcaggaa ggactatggg ctcacataac cagaggccaa ggggcgaccc
120ga
122205122DNAHomo Sapiens 205gaggtttccc ggcctcagac aggccagagg tgtggagccc
gcagacccag ggccggctca 60cgggcatctg tgctattttg atttgatttg atttgagttt
taggtcacgt ttgcacgcag 120tt
122206122DNAHomo Sapiens 206tccctgcttc cagacttatt
ctcctgcctt aggtacagtc actatcgtga tattatctat 60cgctgtgtca acacaacacc
aatccaagcc caaccgcagc tctctcactg ccgcaccgct 120tc
122207122DNAHomo Sapiens
207cgctgcagat gccgcggcag ctgctgcagg tgtggctgcg gctgagcggg cagcagtggc
60cgcggagccc cggggccggg agcagaggag aagccgccgg gggaacccgc agccgctcgc
120cg
122208122DNAHomo Sapiens 208tgacaaccac tctttgagaa gtccctgtcc ccacgtccgg
cagcaggtcc tgtgctcgtg 60cggcagatca gatgggcacc acttcacggc ccagcctggg
ttggcccttc ctaaccgtcc 120tg
122209122DNAHomo Sapiens 209accggccttg cggaaactgg
gtctgccaac ctgctccttg gcccattcct gacagccata 60cgcctggcct cacagctccg
gcagaccccc gccgccacca gccccgcccc tcccgactgc 120cc
122210122DNAHomo Sapiens
210taaacacctc caagctgcca ctgttcttca aatatcttgg atcactctga gcacgcattt
60cggttgtgaa agcaaaaagg aaaaggagca acccaaagcc taaagaaaac tgttctcgtc
120cg
122211122DNAHomo Sapiens 211gcccctgccc cagggcccgg ctgccagtcc cgaggatgaa
tgttgccttt gtgccctcag 60cggcctccgg ggactcacaa gcaaccactt gtccccaggt
ggcaccgcca cggctgctca 120ga
122212122DNAHomo Sapiens 212gatcgaccca tttgaggttt
cttaccaaat tggtgaaaag ggaccagtga aggtgcttta 60cgtggatgat aataatgaaa
atggatgtga gttggataag gagatcaaaa acagctttaa 120cc
122213122DNAHomo Sapiens
213ccgccctccc tggcctcagt ttccttgttg gtaagaagcg ggcctcagtg tctgaggccc
60cgcgcccggg tcgatagagt ccctgacggc ccagaccggg ctcccgggat tcggatctca
120tt
122214122DNAHomo Sapiens 214cagcttgtga tgatccaggg cagcctggct ctgatctaaa
gcacagctac ctcttccttg 60cggcccctat cctggctgct cctgggaata agtgccaaat
ctggggtcag acagccctgg 120gg
122215122DNAHomo Sapiens 215gagccaccac gcctggccag
aataccttta ctttttagca gttagaatat gttggtgcta 60cgtcagtctt aatgtttgca
tgctactcca gtttgtactg tgttgtggga gtttggagtt 120tg
122216122DNAHomo Sapiens
216gaatatacag agaacctcac taacgcgagt aaaatgccga ctacttacaa aacgatttca
60cgtccacatc tgcagtctca taagggcttt cgaataatcc tgtgaagaat gtattattag
120tt
122217122DNAHomo Sapiens 217ggcagcgcat cttctagccc tgctggaagc tggaggcggc
agccggttgt ccttgttgca 60cgtgggggtg gagcaaagag tgcgagaaaa tctgcggatg
gcctcgggga tggcccaccc 120cg
122218122DNAHomo Sapiens 218tgggctggca ggagattatt
tttaagcact tgtgcttcca tatggcttgt tttaaactcg 60cgggacacct acaaatttcc
ggctgtcaga agtcacatgc cagcaatccg ctccagcgcg 120ga
122219122DNAHomo Sapiens
219cgccgggcgc tgcctctaca gctgtgtgta ggcctggggg cgagggtctt cggaacgtag
60cgctggctgc ggccccgccc gcctacccac ccgcccgtcc ggcagccggc tcccgccgcc
120tc
122220122DNAHomo Sapiens 220aaggagcacc tgaaaaggcc ttgaagagca actgggcacc
tggccgcgtc aggtgggaga 60cgctgggcag gacagacgca caggccatgt gtctggagcc
ctcagatgag tgtgacacct 120gg
122221122DNAHomo Sapiens 221gctttagtga ccatgactgc
ttgagcccaa agtaagatgg ctggtggctg tgtttctgga 60cggggatata aaatgcatag
gttaatgaaa gttgttcaca attcagaagc taaaacgaga 120aa
122222122DNAHomo Sapiens
222gcttggggtc ggggggaggt gagagctgag gggcgaatgt ccctggcgcg ggcgggagag
60cgcgctctcg gcccggcccg caacttgatt cctaactctg acctgccgcc cggcgcgcct
120tg
122223122DNAHomo Sapiens 223gggagctgag ttgctggtag tgcccgtggt gcttggttcg
aggtggccgt tagttgactc 60cgcggagttc atctccctgg ttttcccgtc ctaacgtcgc
tcgcctttca gtcaggatgt 120ct
122224122DNAHomo Sapiens 224tagcctggga cccagccgct
ggggtagggg accaagccag ctgtgcggag ggaagcgcaa 60cggcccaaag taggtttaga
atatgagtag gttttaaaaa ctgtactgga tgtaaaaagg 120ga
122225122DNAHomo Sapiens
225gttggcttgc ctctctcctg ccagaatgca acctggcttt atgcacctag atgtccccag
60cgcccagttc tgagccaggc acatcaaatg tcaaggaatt gactgaacaa actaagagct
120cc
122226122DNAHomo Sapiens 226tccacatgaa cccttactca atggggcagg tgtgagggac
tgtccccaac aggttccaga 60cgcctcctgg gttccctggg gagggcttag aggatgaagc
ggcaggagga gatgggatga 120gt
122227122DNAHomo Sapiens 227gaggagggcg ggactgagca
ggcggagacg gacaaagtcc ggggactata aaggccggtc 60cggcagcatc tggtcagtcc
cagctcagag ccgcaacctg cacagccatg cccgggcaag 120aa
122228122DNAHomo Sapiens
228tcataggtaa gatggaaata attacaccct ctggatggtg tgactgaaga ttaaatacag
60cgggtgctct cactcagcac atctggccat gtctgcagac acatttggtt gccacaactg
120ga
122229122DNAHomo Sapiens 229gggtggagac ttgacatgca caatcctagg cgcccaactg
cacgttgtga gtgtgtgagt 60cgtgagtggg ggtgggtgag atcccgggct gcaggcacat
gtcgaggcat gtggcacctg 120ga
122230122DNAHomo Sapiens 230ctagctcagc ctagtttcct
ttttttaacg gtcaaattct gagccggagc tactgatggc 60cgcggcggca tggccttgaa
gtttttgttt ttgtttttgg agagggggga ggggccgtgt 120tt
122231122DNAHomo Sapiens
231agcacctgac tgtgcgtctc cttctgggag cttggtaaat accggactct ggtgtcccat
60cgcagtcatc acctgcctct tacttgcaca taccacatcc cccctcctct gatgagtctc
120tc
122232122DNAHomo Sapiens 232ccgccccgcc gatgccacgc cccaatgaag acccgcgcta
cggaggccct gccctcgggg 60cgggccgccc ttcacagtca agctgccagg ccagcagccg
ctccagctcc ctgtcacatg 120ct
122233122DNAHomo Sapiens 233ggggaaaaag tttcataagg
tggaatagaa aaggcaccag gaaacttggg actgagcatg 60cgccctgcaa cataacggtg
tcaacaagct cgctacctgt ccgaccggtt ccggcggccg 120gg
122234122DNAHomo Sapiens
234gtgctagaat gctgtgcgtc ggaaggctgg gcggcttggg agccagagca gcagctctgc
60cgccccgccg ggcgggccgg ggaagcctcg aagccgggat ccgggcccga agggtcagca
120cc
122235122DNAHomo Sapiens 235catagtccta catttaattt tttagtaatc actgttcttg
caaacactta aaaaaccttg 60cggactatgg cttaatctac taattaccct gtgcaaagtt
tcaaagtgtg actaagatat 120aa
122236122DNAHomo Sapiens 236ccgcccgttt tcccgctgct
actcaagaaa gtaactgtcc cctgctgctc tgtgtaaacg 60cggcacctta aatgattatt
gcatggacca cggttacttt gtgtgtctgt gcgcgctgcc 120cc
122237122DNAHomo Sapiens
237aatccgccag gccacgccaa gctccctgcc caacccttac tgacgggggc cacattttcc
60cggcctccgc agccagacct tgacacaaag gacatcaaac tgccgagggt aaaaaccccg
120ga
122238122DNAHomo Sapiens 238ctgacagtct tttggtcttg agtcttcagg gtgctccagg
accccgtaga tctgcaggta 60cgtgtctgca cagggtacgg gtagaagcca gaaggacaca
cgtactccag tgcctggccc 120tc
122239122DNAHomo Sapiens 239ctagctcctc agtccccaac
aacaccagct gcctcttgga gcttgtgttc gtgttgaaaa 60cgggaagggg tgggggcagg
acatgaacca tttcaccaat gaagccggtt cccagccatc 120ct
122240122DNAHomo Sapiens
240agccacacgg ggcaggagct gcagagctaa agccaggcca tgtggactgg ctgcgggttt
60cgctgcctag ctggtggcat tgagcaagtt acttaacctt tctgaacttc cgttttatga
120tt
122241122DNAHomo Sapiens 241gcaacggtac cactaattgc ggtttcaaag caggctcctc
ccataaatgc aaaggatatg 60cgcccattat tagtgcttcc aaattcaaag ggataacata
agcacctgtt ttaataaatg 120tt
122242122DNAHomo Sapiens 242caagttggca cagctcccag
tgccagactt ccaagtctag ttctcagagc cactgggtgg 60cggccattcc cagccagtga
atgctttgtc tgtgtcagca ctgaccgccc ccttaaatag 120cc
122243122DNAHomo Sapiens
243cacgctaaat tgggggattg gaaatctctt gagtctgcgg gtgctgagcg gagagtgtaa
60cgatgaacca gagacaggct caaagtagag cagaagggcc tgaagttaat cattgtgcag
120tc
122244122DNAHomo Sapiens 244ccagtagagc gggtcagatg ttgccaacct ctgcagagta
gcaataagca gtaaacgcca 60cgctctgcac agcctcccag tgctgggcct ggtcgccacg
cggagccttg ggctgggaca 120gg
122245122DNAHomo Sapiens 245accccaagca atcccagctc
cttgaaaggt tttttctttt tgtaccgaca ctatcattcc 60cgcccttcgt ccccaactcc
tttagtcccc taaggagtga ggggggtaca catttctgct 120cg
122246122DNAHomo Sapiens
246atctccaagg cctcggagga aacttttgat tttataaata acttgatggt ggaaggcaaa
60cgccatcccg gttcccaagc aggctccacg cagcctccat ggccgagtcc atctcctcgc
120cg
122247122DNAHomo Sapiens 247ccaccaactc gcccacgagc caggacatgt gctaataatg
ccctaagccg gttataaaga 60cgtggaaatt gaggggagaa aaaaaaaggg aaaaaaaggg
tctgtccttc ctgggattcc 120ta
122248122DNAHomo Sapiens 248gcacttagag gcttgaggtt
gccagctgtg gggggttggg cctgtgcagt gcctctcagc 60cgcccacgct ggtggggctc
tgcagtgtta gcttcttgtt tctctatttt ctacctaggt 120tt
122249122DNAHomo Sapiens
249gaccaccacg cacctggaca gcagcccctc ctaccagccc ttcccgagtc tcgccccaca
60cggtcgccag ttgctcaggg catctgtttg taccttgtgc acacctctct taaagcactt
120tt
122250122DNAHomo Sapiens 250tttgctacaa cttacctaca gcaatgacgg cttttgtaaa
ttacacacca ttcttgctct 60cgcagccagt attgagaagt aagccttcaa gagctgatac
ctcttctgaa aaacaattga 120at
122251122DNAHomo Sapiens 251ggcactgggc agcacgcact
ggagacccag gaccctgtgc aggagcagct ccgggtgaca 60cgaggggact gaagatactc
ccacaggggc tcagcaggta actgctttca gatcctttag 120gc
122252122DNAHomo Sapiens
252ggccattgtg gcgtgagggt ggccaggtgt ttgtgaaaga ggggccccca gagagcagca
60cgggagcgat ttatacacac gaatattaac atggagaagt ccgagaaacc cccgtaaata
120tg
122253122DNAHomo Sapiens 253tttttcttat aagctgtcca gacctggctt gaaaacccat
cccatggcaa ggcagggatt 60cgctggccgc ggttggctct atcttgatct gagcaagccg
ctggacgtcc ctagttatct 120tc
122254122DNAHomo Sapiens 254cgctgccgca gccttcgcag
gcaagtgcgc ccgccggcct ctcgcctcgt ccggttcccg 60cgcgcctacc ccgcgcgcct
gccccgcaca actgtcccag gtgaccagcc cgccacacct 120gt
122255122DNAHomo Sapiens
255accaccgggc agtttggggc cagaccccct agctcagtcg tgtcctctag tcgctgccaa
60cggaccttca agacgaacca gaaatactgg gtgctgaaaa aggttggtat ccagttgtcg
120tg
122256122DNAHomo Sapiens 256tgtacggaat tgatgggttc ttggcctcac tgacttcaag
aatgaagttg cagacccttg 60cggtgagtat tacggttctt aaagatggtg tgtccagagt
tgttcattcc tctcggtgca 120tt
122257122DNAHomo Sapiens 257cgttgcgcgg agtcgaggga
tggccacagc atcccggccc tgaaggtctg cagtgaaaga 60cgcccacctg gacgggcctg
agagaccagg cctgacaccc ggcctatccg agggatgctc 120ga
122258122DNAHomo Sapiens
258ataacaataa taataatggt agcaagcaac gctctgcagt aggggcttct ctcgccattt
60cgtactgagg aggaaacata cttaagaggt tacaaaactt gcaccaaaca gataaccctc
120gg
122259122DNAHomo Sapiens 259tagggtggcg ctgaaccagg agtagcaaga gtcctgtgag
gagtgcaagg aagaggagga 60cgctgagttc catggtcctg gtctgactgc cctgcaccct
gctgcagcct ccaactgggc 120ct
122260122DNAHomo Sapiens 260ctgccctcca gccccgcgac
cctcagcctg ggcagccccc gcggggtcct ccgatgccca 60cgctttccgg gaggccagcc
tgatccctga atatgctgct tgtcccgtct gtctccgact 120cc
122261122DNAHomo Sapiens
261acttcaattc ctaaacaggc ataagcttca ttcagggtgt tcactggcca cgaccaggga
60cgcccagcac ccagtgcagg gcctgccctg gaagaggtca gtagtgcaaa gttagggctg
120ga
122262122DNAHomo Sapiens 262gggcggccct ttaagcagat gcgctccagt ttttctccag
agcctctact gcttgaatga 60cggactcgaa gctacttccg gccatttctc acgcccagtc
agagtccagg aattcttagg 120tt
122263122DNAHomo Sapiens 263ctcacgaccc ctcgctaggc
ggggttcggg accaggtgaa cgctgatctg atagttgaca 60cgggacgact gtggcatcat
ccttgctgcc gtcaatatcc cgagagggag gaggttgggc 120cg
122264122DNAHomo Sapiens
264attccgactc tggagctcca gagaccggat ccgagacgcg ggtggaggtg gagttacact
60cgcctgcagc cctgagggtg taaatggccc attaagatcc aggttaaatc aacctatgga
120gc
122265122DNAHomo Sapiens 265ggcggagaga acagccagtt gtttaaaatc cttctagagc
agtttctaat tccccccttg 60cgcccgggtt cggagggggg agggggaagg agagcgggtg
gagggaggag agcggagagg 120ga
122266122DNAHomo Sapiens 266tcaggtgcct gagagaggtg
cttcactcct cccactgggc cgagcattta gaataatcac 60cgcccccttc ccccgccttt
tcctgccctg gatctccgcc gccacctcgg tctcgctgct 120cc
122267122DNAHomo Sapiens
267cagcactggg cgaggagctg agctgcgaag gaggctggtg tcccccgggg acaagggcgt
60cgccgccatc cccggctgca gagtcctctc tctcagaact ggccgaggcc tccgggtccc
120tg
122268122DNAHomo Sapiens 268ccctccttgg cgggggcgtc cggcaccacc tcagtgaggc
cgcggcgcag ggcagagaga 60cgccacacag ccaccagccg cagcaccagg atcagtaagg
ctcctgggac agggcagggg 120ac
122269122DNAHomo Sapiens 269cggggtccgg cggatcctgg
gcagcagccg gggtggggat gctgtcacat tcggggacga 60cggaccccga cggtgccaaa
gtctgggaca ggacagttgc gggacggttg gggagcgtca 120gt
122270122DNAHomo Sapiens
270tcaggagcct tacctggatt tcctcaccca cctgccttgt gtgagtcggc ggctaggatg
60cggtccaagc ttctgagtgt gccagcacag ctgagtctct atttatgcac cagggcatac
120ct
122271122DNAHomo Sapiens 271ttgcattcag gtagattatt tggaagatga tttaaggacg
taccagtgca ggagttgtcg 60cgggacagtg agaccagggc agtttgacaa tcaataaagg
gtgcatcatt ggcaagctac 120ct
122272122DNAHomo Sapiens 272ttccatggtg acggcaaaca
aggcccacac tggacagggc agctgctggg ttgctactct 60cgcctccgcc atgattccgc
ccgcagactc tttgctcaag tacgacaccc cagtgctggt 120ga
122273122DNAHomo Sapiens
273tctccaatct gagggcccac aagtggcatc atcgctttgc ggttggagtt tacccatctt
60cggttatttg ggagggtctg tacccttcct ttcccccacc ccaaaccccc ttcctctggc
120ct
122274122DNAHomo Sapiens 274gcaacagccg ctccctctca actggagctg cacccaggct
ttggctaaag gctgttaaaa 60cgttggccag gtgcggtggc tcacgtctgt aatcccaggg
cggatcacct gaggtcagga 120gt
122275122DNAHomo Sapiens 275gtcggcctgg caggcgcggc
ccccggttca gctgcgccgg ggcggcccag cgcgactccg 60cgggcctttt ggctgctcgc
cccggctccg gaacactgtc agatccttct ccgcagaggt 120ag
122276122DNAHomo Sapiens
276tgcgctctca cttcttccca cattcaagaa tggggtccca aacgagagat tcgacgtaaa
60cgtccgctcc caactaagtt ctcaggcgct gacaacgaca agaattcctc acacaaacgt
120ag
122277122DNAHomo Sapiens 277gagggggccc cggggctcgg gctggagggc gctgggggcc
tcgagggtct ctggtactgg 60cgccggggca caatccagag ccctgcgcgc cgcccgggct
gcggaggccc cgatctgagc 120gc
122278122DNAHomo Sapiens 278gggaaacagc gccagccaag
ggcgagtcag atccagacag acccaggccc ccccgcccag 60cgccccaccc cgctgcacct
cagcgccttg tagctgatgc tcatatgggg tcaggatgcc 120aa
122279122DNAHomo Sapiens
279gggggcgggg agcgcgcgcc gggcggaggc cgagtggagg gggaggggag ggggtccgag
60cggcccttag gccctgcccc tgtcgcctac tgcgctcaga aggggcctca gggcctgccc
120cg
122280122DNAHomo Sapiens 280ctttgaacac cgcgcatccc cgggtctggc gcgcggcctc
ctgagcgaga ctacggcctt 60cgctgctggg agcacgctgc cagctcgcaa aaagaccagg
tcccctacaa aaggcgaccc 120ct
122281122DNAHomo Sapiens 281ctttgggagg cgatgttaac
agagccccag ggcacgagtt aagggtttgg cccaaggtca 60cgcccgggat cagttgcaaa
gccaagaaaa gaacccggga cttcctatgt gcccagatgt 120gc
122282122DNAHomo Sapiens
282ccaggacttc cccgaggcag gaaccgagcg ccacgcttct caccctatat agaggaccca
60cgcaagactc agacctctgc tcccacgccg gaaatctcag cgcgcaagtt aggcgtccac
120aa
122283122DNAHomo Sapiens 283tggcagcatc tcctcccagc gtcaggtcta agcacacaag
ttcttccttc catctacaaa 60cgcaggaaac cacgactgga gaagttatat gattggctaa
accatgaatg acgcaacata 120ac
122284122DNAHomo Sapiens 284cgatggcatc ggtcaaggtg
gccgtgaggg tccggcccat gaatcgcagg tgagtggggc 60cgcccgcgcc ccgccccctc
gtcgcgcccc cacccagagg aagcctgttt ccagctcccc 120ca
122285122DNAHomo Sapiens
285tgggatattc gtggggtgag tgccgtctca acggtagagc cgctcggtca aagagactga
60cgcggagagg gcgggtctct gggtccgcga tctccagcag gagcagctct acgcgggagc
120ct
122286122DNAHomo Sapiens 286cctgcggagc agtagctagg aacagatcca cttgcaggtt
gctgttccca gccatggctt 60cgcgctgctg gcgctggtgg ggctggtcgg cgtggcctcg
gacccggctg cctcccgccg 120gg
122287122DNAHomo Sapiens 287gcggcgggaa caggagcagg
ccgagggtcc tctggccaga agaaatctgg cctcggaaca 60cgccattctc cgcgccgctt
ccaataacca ctaacatccc taacgagcat ccgagccgag 120gg
122288122DNAHomo Sapiens
288cgctcgggcc caacggacgg cggggggaga aggtcagcgc ggtctcaggc gggctcggcg
60cgcccccgcc gcctccggca agttgcgtcc tggctcacaa cacacattgt tttgcggggg
120cc
122289122DNAHomo Sapiens 289ttacaggcgt gagccaccgc gccaggttgg tgtttatttt
tcaaacaagg cgctgggaaa 60cgcaaattct ccagagctct tgtggagcgg tggcagggag
gggcggctca gccagagatg 120gc
122290122DNAHomo Sapiens 290tggcgcggga tggttgcctc
gagaaggtcg cagccaggag caaagctttg gggctcacaa 60cggactgggc attccaaacg
gtgtaatctt cggcacattt cacccgctcc cattccacct 120tc
122291122DNAHomo Sapiens
291cccgcgcgga gcctgcccca gacgcgcgct gcccgccggg cgcaaagagg ccaggccgca
60cgcactgttg cccagcaacc gctcccaggc gtccgcaagt cccgggccct ccatgcaggt
120cc
122292122DNAHomo Sapiens 292tctggaggct ctcttcaaat atttacatcc acacccaaga
tacagtcttg agatttgact 60cgcatgattg ctatgggaca agttttcatc tgcagtttaa
atctgtttcc caacttacat 120ta
122293122DNAHomo Sapiens 293actggcagaa gaaataccag
gagacaaatt ctgcacgaat gtaaggaaat attctgtcca 60cgtggtccag agacaacccg
gactgcaaca gtgaggttct acacctggaa cactggacct 120gt
122294122DNAHomo Sapiens
294gaaatggagg cagggaccat caggaagctc aaaacctttg cttcagccga gtttgcagaa
60cgccctgtga ggagaatggg tgagctgggt cgaggaagct tcatcctcgt ccccatcccc
120ca
122295122DNAHomo Sapiens 295gagagggccc cagggggtaa tcctcttggg tgcctcagct
ggtgcggtat gaggctgggt 60cgtggggggg gtggggcgtg tgcggggggt ggggtggggg
ctgggctggg gggggatctc 120gg
122296122DNAHomo Sapiens 296tatgaaattg ttttttgcct
aagagcttca cttacaagcg catagaacag aattgatcac 60cgcagcgggt gcctaaattc
acttctccct gggagccctg agcaaaacaa tttgaatgag 120gt
122297122DNAHomo Sapiens
297tggccactaa gtttagtgtg cctggctgag ccagagtggg ctggccttgg ggccgaggga
60cgcgggacgt gctgagcagc tgcccagacg cgtcaggggc ctgagggagg ctgctattaa
120tg
122298122DNAHomo Sapiens 298cccaaactga ctgcttaaaa ttaatgagtt gacaagcgag
tcccaaccca cctgccaact 60cgctggctgc ctaagaagct gcctttacct gcctggacca
gaccctcccc cctccccgcc 120gc
122299122DNAHomo Sapiens 299accttcttac tctgcaacca
aaccaagtgc cccatactac aggtaggtgc cgagaaattc 60cgcagcctga aaaaataatc
catgcaggtc aaaggcagaa atttactccg ggatgagaga 120tg
122300122DNAHomo Sapiens
300gggacccaga gagctaccgt agaaaattac tccttcactc acaaggactc gcaccagcaa
60cgccatgttc ctcaataacc atttccgggt gaagagtgag tttccggtgt ccccttttct
120ac
122301122DNAHomo Sapiens 301gggtgagtgt gtgtgagtgc atgggagggt gctgaatatt
ccgagacact gggaccacag 60cggcagctcc gctgaaaact gcattcagcc agtcctccgg
acttctggag cggggacagg 120gc
122302122DNAHomo Sapiens 302ctacctcctg ttgcgcaatg
attgggtcct gaattttatg taaatcatat ttatgaacaa 60cgtccagtaa taagtgcagc
aagattaggg ctctaggttt tctccagagt tctagatgtt 120aa
122303122DNAHomo Sapiens
303cggtaataac agtgtcatct ccataagcca ttctattagt ggtaacaaat aatagcccca
60cgcctgcaat atctccttta atattcccaa cgtccgctaa gcgcgtctca tcaccattta
120aa
122304122DNAHomo Sapiens 304ccggctgcgt ggcccgcggg tcctgccggc cgagggtcgc
cggatcgcca gcagctgcga 60cgcactaaca gccgctcaca gtccggaatc ccacgctccc
tagcccgcgg tgagcggggg 120aa
122305122DNAHomo Sapiens 305ggaacgcggg tggggaagag
ggggagctct gagtgctgac atttgcagtg ccctcccaag 60cgcacaacaa gccacagggt
gcagactcct gcaggtggtg actctcccgg tcccagggtg 120ta
122306122DNAHomo Sapiens
306gctcaaatga attcgtggaa agtgccccct aaaaatgaaa agatgcctct ggagaccttg
60cgcacaccga gtggcacgac ctgcagaggt taccgccagg tttccatcct ccgcgcccgg
120ga
122307122DNAHomo Sapiens 307ccggggctct cggcgctgag ttcgggggtc ccattctgga
cgcggcccag cccctagggg 60cgccgccctg gcctcagctg cgcaattaca gcccccgccg
gcagctcccc gccccgggct 120cc
122308122DNAHomo Sapiens 308accggggcca agagtgatac
ctgatcctgg gggattgtga aatgacctca tgtggcagcc 60cgcccgcggt gcccgcaaag
ccctccaccc tccccttccc cgctcggctc cacccctacc 120cc
122309122DNAHomo Sapiens
309agcctcctac agcagccagg tacacacaag gcctcagttt ttccatctgt gaaatgggta
60cgtggacaga cctgtccagt agcctcccat gtgagaatcc tcggactgag agggtactag
120ga
122310122DNAHomo Sapiens 310gcgccgctcg ccttgccttc tccttctctg gctgcttttg
cttcggctgg agccggtgac 60cgccgcggcc ggcccgcggg cgccctgcgc ggccgcctgc
acttgcgctg gggactcgct 120gg
122311122DNAHomo Sapiens 311ccaactcgcg gattatgtta
atgtgatttt catcttcaac gttaacacgg aacaccttct 60cgctgaataa tgagataata
gaagcacaga gaattggaaa tgagtaatgt gtccaaattt 120gg
122312122DNAHomo Sapiens
312agagtgtaga aggaaggctc tagaatgaga cagcccagtc ccggttacta gtcatgagac
60cgcgtattga ttacctaacg ccgtaggacc tcggtttccc catttgtaca acggagattc
120tg
122313122DNAHomo Sapiens 313tcacctgtgc tgcactccag ctgacccaag taggaagcca
gacgagctgt aaaacatgaa 60cggaagagtg gattatttgg tcactgagga agagatcaat
cttaccagag ggccctcagg 120ta
122314122DNAHomo Sapiens 314tcgcaaagtg ctgggatgac
gggtgtgagt cactgtgcct ggcctggttt ctcctctcca 60cgtgccctcc cccgccagaa
cccagctgcc tggatactca ctgtagcctg ccctccgccg 120gc
122315122DNAHomo Sapiens
315tgggcggctt cttgtcggac atgagcgcct ccacgctgaa gggcaggctg gagaccttga
60cgcggcgctc ctccgcggcc ccctcggcgc ccccaggccc cgggcctggt ccggccacca
120ct
122316122DNAHomo Sapiens 316tccagtttgg gggtcaccga gctggggtgg tgtgcagcca
gcagagggga ttcaggatcc 60cggggtgact cctggcccag gcctgtcacc ccacagctgg
ctcctggccc caaggcagcc 120ac
122317122DNAHomo Sapiens 317gccctggaga atgtgccttt
aggaataact tcccctaccg agaagtttct ggtgtctcct 60cgtggaggcc caaacactcc
atgcctgact cccgcggttc acctgtttgg ttccactccc 120ca
122318122DNAHomo Sapiens
318atggctgttc cagcctcagc agccagtttg aaggattccc agggggtagc caccttgctt
60cggcctcttc caggctggga agtgggagcc tgtgccttta aattctcagc aggttgaaat
120gg
122319122DNAHomo Sapiens 319tgatgacagc gttctcagga cagtgtcttg tagctggggc
gctccccaag gatgttagaa 60cgttcccggg ggacaggcag gctgttagaa attggggcgc
gaagccgggg accgttcctg 120gg
122320122DNAHomo Sapiens 320gggtattttt agcaggcggt
gtttgaggtc tctattaatg gcaatgaccc gtttgagggc 60cgcccctccc catgcactcc
tcccccagcg ttcaggggcc gtgggcgggg cgaagagggt 120tc
122321122DNAHomo Sapiens
321actccaccct cattgcgtcc ctcagatctg atatttgcca cttgatttct gcttttcaaa
60cgccttttct gcctgtgtta cctaaattac acagtaaagg atattggcaa gtgtttagcc
120aa
122322122DNAHomo Sapiens 322gagagggaaa aactagagat aaaccaaact gactctcagt
tcctgagact gatgtgacat 60cggcttgatc taaaccccaa agctgatgtt ttatttgttg
ttgactctgt gtatggtttt 120gg
122323122DNAHomo Sapiens 323ttctccatct cagccaaagc
tcttacctac acctggtgag catataaaaa gcacaattta 60cgctgactag ctgatgcata
tctgaaatga acggagaaat acacctcatc ctgagagaaa 120aa
122324122DNAHomo Sapiens
324ggttttgggg tatctgggct ccaggcagaa gcacagcctc cccgacctgc cctacgacta
60cggcgccctg gaacctcaca tcaacgcgca gatcatgcag ctgcaccaca gcaagcacca
120cg
122325122DNAHomo Sapiens 325acccccgggc gcatccagac gagcccccgc cgcagcggcg
acagcagctg gagctgcccg 60cgcccccgcc cgacccagcc cccgatcccc ggcccccgaa
gcctccgccc gggtcacccc 120gc
122326122DNAHomo Sapiens 326ttttggatgt caaaaggcac
tgatgaagat attttctctg gagtctcctt ctttctaacc 60cggctctccc gatgtgaacc
gagccgtcgt ccgcccgccg ccgccgccgc cgccgccgcc 120gc
122327122DNAHomo Sapiens
327gcctcaggga gcagaactga gatccatgga tggaagccat agagaaaagg agttcagaca
60cggcaagaac tttctaagag ccagagctgt ctagagaagg aaaagatagg tagtgagctc
120cc
122328122DNAHomo Sapiens 328cgctggaaaa tgctgaagga cagcgagaag atcccgttca
tccgggaggc ggagcggctg 60cggctcaagc acatggccga ctaccccgac tacaagtacc
ggccccggaa aaagcccaaa 120at
122329122DNAHomo Sapiens 329agggcccaac taggagtgcc
aacaaccgcc taaaatacag cagggcggct gcacggttaa 60cgtgcgtgta attgactaca
gcaagaagga tgaggatctg tccataaatg ccaagttccc 120ct
122330122DNAHomo Sapiens
330cagcgggaat cgagagtggg gggctgtccc agcgggcaca taccttcggc gaaatagtcc
60cgcggcttct ggaaagtgtc ccggacgggc tgcgggcgcc tctccgcctg cggaggagac
120ac
122331122DNAHomo Sapiens 331ccccgagtct cgtttcagtc atccctttgt ccttccccgg
attggcaggt tttattattc 60cgcctgaaca atccggccgc ccagtggctg agggtcgctg
acgtcggagg cagagccggg 120ga
122332122DNAHomo Sapiens 332gtgtcactcg tataaaaacc
tatgctttga aggttctcgt gtgtctcggc ctgcaggtct 60cgctcagagc tgtgtccctg
aacatccacc ctgctggggt ggcttgacgc acttctgtgc 120aa
122333122DNAHomo Sapiens
333ccgagcgagg gtggggggcg gcgggcggcg cggggcggcg gcgagcgggg gccatgcagg
60cgcgctactc cgtgtccagc cccaactccc tgggagtggt gccctacctc ggcggcgagc
120ag
122334122DNAHomo Sapiens 334ctgggaccga gggagggggc aggcctggac tctgctgaac
acctaatgag catcagggag 60cgccactgca ggacgagcag cagagccaag attagagccc
ctgctgtcct cactacagcc 120ac
122335122DNAHomo Sapiens 335tttggggcgc agggggggcc
gtgccctggc ggaggagcag aaggcagagg gtagcagctg 60cggctcagcg gagagacttg
ttgcatttgc agctaaaacc aggccctact tgtccttggt 120gg
122336122DNAHomo Sapiens
336cttccccgcc ccttccaagt agaaatctag aatcaccaga gtcctacagc aaaaccagga
60cgctgaactc atcccgaaga cccggcagcc cctcttgggg atccgccctc attccaaatt
120ct
122337122DNAHomo Sapiens 337cgggttctcc tggcgagttt taagtcacac tggatcgctg
cttattttca gagatcacct 60cgcacccatg cacctggaag gcacccaaag agaatcattt
taagaaattc acttcatctc 120ac
122338122DNAHomo Sapiens 338aaatgtcccg gcgcctctcc
cgagagccgc gacggcccgg agccgggagg gaaagctcca 60cgcacaaaca ccgccccctg
cacaattagg gcgaagatga cggctgcaaa gttgttgcgt 120aa
122339122DNAHomo Sapiens
339gagggccccg ccttccccag ctgcatataa aggtctctgg ggttggaggc agccacagca
60cgctctcagc cttcctgagc acctttcctt ctttcagcca actgctcact cgctcacctc
120cc
122340122DNAHomo Sapiens 340gtttccgcag cccaggcggg acgaagcttc tctcttggtc
ccagtgccgc ctttcattcg 60cgcgctctgg cctggctggg gccagttttc attcctggag
acccctaagt ggaagaatga 120aa
122341122DNAHomo Sapiens 341gcggtgggaa gtgaacgatt
aatcagattt cctcttttcc cttatttccc ctccccctta 60cgaagataaa aactcgggaa
agcaaaagag gtgcccgccc tgcagttctt aagctgggtc 120cc
122342122DNAHomo Sapiens
342ttccaggtag cacagaaagc ctccaccatc cttgcccttt cccctcttta gagacaggag
60cggggatctt ctggtctaat tgccactgca gctcagaaga ccctttacac ctcagcaagc
120ag
122343122DNAHomo Sapiens 343agtgctgcac acctgggttt ccttgcctag agctgtgtgt
tcggggtcct ttggtccagt 60cggaggctgc ggagcggcgg gggttgcctg cgctgtccgc
ccgggcatcc tcccggtgat 120gg
122344122DNAHomo Sapiens 344ccttaggaag tggaaaaccg
tgtcccaagg tgtgcggtcc agctcggggc tgggaggtga 60cgctggtggg ctgggaggga
ggggcggggg gccctgagcc tcaggccacg gcctcgttag 120ga
122345122DNAHomo Sapiens
345cggggccggg acccctgacc cctgacccct gcagcgctgc gccccgccct ccctcgtgcg
60cggcccggac cccgccaccc tgcaggattg cgcctactcc gactgcccct tccctatcgt
120cc
122346122DNAHomo Sapiens 346ctcctgcggc cccgccctct ggcagctgac gtcagagcgc
cggcagcagc accctggtca 60cgtggccagc ctgttgccat ggcaacccgc taactcatca
cctcgcctca attcgcacag 120gg
122347122DNAHomo Sapiens 347tgcaaaatgc agcaataagc
caaacctaga ctttctattg acttgtctat tttcgtatct 60cgctagcaga aagactacat
ttctggtcat ttccattatt ggggaatcgt actttaccat 120tg
122348122DNAHomo Sapiens
348tgacgcctat aaggaagggc tcgccgccgt tgggctgctg gtggttctgc agggtctgct
60cgctgtcccc ggccatggtt cgcgccgccc ctcctcccgc tgcctgtgcg aacggacgca
120cg
122349122DNAHomo Sapiens 349ggtccgcatc ccgtcctcgg actcatcctc ggagccgctg
ctgctgtagc ccaccagggg 60cgccgcgctc atggggcctc atccaagacc accagagcag
gtccaccagc aacctcaacc 120gg
122350122DNAHomo Sapiens 350tgcatcttca gcattcactc
caggcccctg gccaggtgga aactgggcac aatttagtta 60cgtaagccac agtgccctaa
acaaggctgt tgttttcttc ccaggctcag cattgccctg 120ct
122351122DNAHomo Sapiens
351taccagtccg cccgccctcc agcctctgaa aacagctgtt tgaatttgga gctccgcatg
60cgcagtgccc ggtactcacc ccccgcaagc accgctcccc ggacagagtt gcttggccaa
120gt
122352122DNAHomo Sapiens 352agggccaccc tttaactcgg cagcttgatg actataatgg
gcccagttgt ctgcgggctg 60cggggagcta agtccccaga ttggaggagg ctggctctgg
tcttcgatgc acaggagtgg 120cc
122353122DNAHomo Sapiens 353ggcccgcgcg cttaccattg
gcgttcttgc cgcagatgag atgctcatag ggctgcaaga 60cgccccagag ctcggcgtcg
ttgttgatga ccatctccag ggcctcagca gacacctccc 120cg
122354122DNAHomo Sapiens
354ctgagacatt tacatgctgt ttttcggagg tgtccttaaa gggaagggga atgccaggaa
60cgggctgcaa cttggcacca ccgagggagg tcagctttta caaagcacat ccaaggcagg
120cc
122355122DNAHomo Sapiens 355gaactggtcc gcgcacgcgc acgacgccgc aggccccggc
cccggcccgc ggcagctgaa 60cggcagagcc tgtagctgca cagctgtgct tccacctggc
gttcagtacc tcgtgcccga 120ga
122356122DNAHomo Sapiens 356gtgcgtttgg agataaatcc
tatctttccc tgccatcagc acttaccttc tgggaaatca 60cgcggctgta ccacatagag
aaagatatgc actagttcaa agagaatgcc aatgggtcca 120gc
122357122DNAHomo Sapiens
357tacaatgtat taacttagtt ttttagatca gtttgaaact tccttatttt tcaatagcca
60cgcaaaagag attctccatt gcttaaagaa caaatatttt aaggaattgg aggacctgga
120gg
122358122DNAHomo Sapiens 358agtgcgggcc cctgcattgc caaggcctta taggcacggg
ctgggcgggg gtgggcagtc 60cgccagccag cggcattctg cagggctctg tgcaagcgtc
agcccaggac gggcacctgc 120cc
122359122DNAHomo Sapiens 359gcgcgcttga cccagaacag
tacggagttc tgcacgagcc gggggtgggg cctgtctcag 60cgcgcggcgg tggggcgggg
cttggacacg ggcccggctc aacttgaggg aggcggggct 120cg
122360122DNAHomo Sapiens
360ggttgcaact ctgagtagca gaggagctca gcgtcgactg gggcgcgtga tcctttatag
60cgctagccac ctgggggcca aggggcggtg ctgctttccc ggaaacctcg cgccttcccc
120tc
122361122DNAHomo Sapiens 361ttccctgcag attgtcatga accaaaccag aaaggggtat
cctgtagaga agttagggga 60cggaggataa acttgacagt gcatgaaaaa atgtaataaa
tgggatacag aggactatca 120aa
122362122DNAHomo Sapiens 362tgtccttcct attgtttagc
tcggctccgg agttcacggg agcctcgtga aatgtggaga 60cgtcctgcaa agtttcttga
acacttcatg tgcgtggtag gaagtcgagg aaaaaggttt 120ac
122363122DNAHomo Sapiens
363aggccgtggt gggcacccgg gctgtctgca gatagcttgg ctcattgttg gtcctcagta
60cgcagccctc gtagccaagc agcttgggcc tacactctgg gcccagggga gtggctgtcg
120ct
122364122DNAHomo Sapiens 364tctcctcctc ttcttctgca gggctccgcg aagaggtctg
gcactacacg gggcagtggc 60cgcggcgtcc ttttctgccc cgcgcccctt cagcccatcc
tccctgacaa gggggcggcg 120ca
122365122DNAHomo Sapiens 365actcaggagt gagtctttgt
gcagtcaggg cttctgctgg gcagggccgg ctgttaatct 60cgcctggcgg agcggacacc
ggggcgtggt gggggagatg ggccttatag gtggcgtccg 120ct
122366122DNAHomo Sapiens
366gtggaaggtg ttgatgatgg tctctatgtt gcgttccagc tgcgacattt tgcaagtcat
60cgtcttgcac tctgtctgtg taatggaaaa ccaagagttg ggacacttag aagaaaatgc
120tg
122367122DNAHomo Sapiens 367aagcgcagag tagtttgggt gccctatttt acctctcctt
gtcagctgcg ggtgtcaaga 60cgggttgagg gaggagagcc aatgcacccc gctccaacaa
agggtcagca gcgcgggctc 120ct
122368122DNAHomo Sapiens 368ttgtcttttg cggtttatct
tcctggggag aaactttcac ctcctcagcc gggcggtgag 60cgcgagactg atagcagcaa
tcattcctgc agataaatga attgaaagga cgacaccgtc 120cc
122369122DNAHomo Sapiens
369tacctcgatt ggagtggctc agggtggacg actgggaaga cttggacttc tgccgcttga
60cggtcatcat cacctgctcc tgcacgcgct gcctgccaga cgtgcctgtt ttcatctttt
120gg
122370122DNAHomo Sapiens 370ctgccaaaat catcatcgtg ccgccaatta tgtttgaaag
ccatatgtac attttcaaga 60cgctagcctc agccttgcac gagagaggcc accatacagt
gttcctcctc tctgaaggca 120ga
122371122DNAHomo Sapiens 371ttgtatttca aacctaattt
gtctgctttc atttgtgtct cacactgctg tcacatttaa 60cgtttttacc aaaatttgaa
taatcttagc tgatggagta gtaaacatat ctacctacag 120aa
122372122DNAHomo Sapiens
372cctcgccctg cgacgtgtgg cccagcaggt tgggcatgcg ggtcaggttg tagccgatgc
60cgcggcacat ggggatctcc accgcctggc acggcgcagc cccgcgcccg cgctccgggt
120cg
122373122DNAHomo Sapiens 373gctgtttgcc aacgaccagc tggcttaatc tgacttcgca
gatgtagcag tgttggaaaa 60cgtcggttct tttgctgagg gaaggaagag atgggagggg
tagaaagggc ggtggttatt 120cc
122374122DNAHomo Sapiens 374cagcccggca gtccgggatc
cccgggccgt cgccccgctt ggggcctcct tggcccttcc 60cgcctgtccg tcattcgagc
ctccctcgct tgtttaagcc gctccgggcc cccctccact 120cg
122375122DNAHomo Sapiens
375gccgatgttt ctttagccaa aggcagtggg ctagtttaga cggcctttca ttcccggcag
60cgcctgtggg tgcgtgtgac ctgggacaga ggggcaaagg aacctggcag agcgagcttg
120gg
122376122DNAHomo Sapiens 376gtgtgaatgt gtgggcggga aggctgggtc cacagggacg
tggtccagca tcgtgagcag 60cgggtcctac cggacgttca agtcctacag ccctgggcta
actagcaagt ctcagacccc 120ca
122377122DNAHomo Sapiens 377tttgtttttt taaaaagcat
attctagttt ctatctgtaa ctcgtttcta gttctgccac 60cgcgatgccg aaggcgccca
agcagcagct gccggagccc gagtggatcg gggacggaga 120ga
122378122DNAHomo Sapiens
378cggctggacc ccaaccctgc cggccgccgc cgaggtgcgc agcccgcagc cccacaccca
60cggcctttgc aacaccccaa ccgttgaact gcgcccctac acgcccggcg tctgcggctc
120cc
122379122DNAHomo Sapiens 379aggcaggttc atgaaattgt gtaactttcc ttttctgttt
cttaataggg gcactatgaa 60cgaagaggag cagtttgtaa acattgattt gaatgatgac
aacatttgca gtgtttgtaa 120ac
122380122DNAHomo Sapiens 380gagccacagg gagactatgt
ctcgcttaaa ttcccaaaag tgggcccctg tgcttcaaaa 60cgtccccgca tgggaaccac
aaaaacgttg cctccccagt tatcacccca agggcccaag 120ag
122381122DNAHomo Sapiens
381tgggagcact ttcgtacaca gaggacttct tatccatgga attggccgtt ctttgtaaaa
60cgctctgtac ttactagcaa cctttacaca gacatgaagt ttctccataa ggataaaggg
120at
122382122DNAHomo Sapiens 382tctgacttgg gagctacatc ctcggcagac gagaagcact
tttgctcgag aattgtttta 60cgcgcccctc taccaactgc ggaatcgctc gcctgcgaaa
acggaaggag gggcgaggac 120ag
122383122DNAHomo Sapiens 383gtgctgtccc cttgccgccg
ccagagatct gtggcttttt ataatggggt tggctgcctc 60cgcctccagc ccccgcaggc
aggagggtgg gaggggagag gaagggagcc agtgtgcagc 120cg
122384122DNAHomo Sapiens
384tgaatagagt cggttttggt ttcctgttgc ttctccgggc catttatctt ctttcttctt
60cgcctctggc ccacgccggg gcggatgttg gggcgcggag tgtgggctct gcggcgccgc
120gt
122385122DNAHomo Sapiens 385gtggtgctgc ggtgtgagga tagattctac tcaacacccc
ttcaaatcac accataagtt 60cgctgcctcc tgattgtatg gggacggtct ggatggtgcg
gtagggtgca cgtaagagtg 120tg
122386122DNAHomo Sapiens 386acccaatgtc cagggagcgt
gcaaaatttg tcaaaagtgg ccttttattg taaaacgaca 60cgagagctaa tgctgcatgc
ccgttgctgc ctgaatcaga agggcaccat cttggggtga 120gg
122387122DNAHomo Sapiens
387ctggaccacg agctctgaga gcagcaggtt gagggccggt gggcagcagc tcggaggctc
60cgcgaggtgc aggagacgca ggcatggccg gtgagctgac tcctgaggag gaggcccagt
120ac
122388122DNAHomo Sapiens 388ctggcggccg ccggggcgca ggtgagcgcg agctccgggc
tctgaggctg gacgtggagc 60cgcgaccgcc ccagccccga acccgccact ccggggtgcc
cggcgcagcc tcgacgcccc 120ca
122389122DNAHomo Sapiens 389ggccaatagt tgtataatct
tagaattgct gcctacccag ttccttctta ttcttgttcc 60cgccttcaga aagttatgta
agacacttat tttaccctcg ggcttctctt gattgtattt 120gg
122390122DNAHomo Sapiens
390atgcagcccg cgcctcgccc ttcagagtaa ctcctgtgga ctctgagact ctgggatatt
60cgccttctgc cccagatccc tggagggggg ctgagtggca gcctgcgctg aagataccac
120ct
122391122DNAHomo Sapiens 391agaagaagac cccggcttga gagtgaggtg tgctgggcgg
agtgggggag gacctcgagg 60cgccccggca accaaccgtg ttctaaccaa ctggcaagtg
ggaaaagttg acatgactag 120ag
122392122DNAHomo Sapiens 392tccccagcca gctctctgcg
gactgtctaa ttaatactcg tttagccata gacgccaaga 60cgcagaaatg cgttgagtaa
tgcaagcaac gagggttatt ttattttaga tactaaaggc 120ag
122393122DNAHomo Sapiens
393tcttctcttg agttggctta ggtacctggg ctcctccgct gtcccctctg gccacagaag
60cggaggagcc tgtaaagaaa accaccttgg aatttcctgt gctgtggggc aggagaacaa
120gg
122394122DNAHomo Sapiens 394aagggcactt agtacttagc gttgcctcaa tccacagtct
cagttccttt tgttcagata 60cgagtcgtta cttaattcag tggtctcaac cctggctgca
gaggagaaat cagctgggga 120gc
122395122DNAHomo Sapiens 395aaggggcacc ggctggcagt
gggatttagg atctagccca gccctgtctt aaactggctg 60cgcgacctta gccaagtcac
tgacctgtcc gggtctcaag tacatatcta ttaaattaga 120tg
122396122DNAHomo Sapiens
396ggaagagggt ctcgttctaa ctgtgccggg ccgggaacgg gttaagatgc ggccaaatgt
60cggtccctcc tccttcccac ccctcagccc cggcgcccac tcgcgacggc agccgcggaa
120cc
122397122DNAHomo Sapiens 397gggagctcgc gccctcgccc agccgagctc ccacccccgc
ttttttccga aggcgctggg 60cggcgccacc ctccggccgg agcccggcac tgcacaaccc
cctccgactt tcaatgttcc 120ac
122398122DNAHomo Sapiens 398tccgagctcg agcgtgacgg
gaagttgggg caatttgtta gttatccgcc gccaccaaga 60cgcggcacgg cgcctggacc
ggaggggccc cgcgcgggcg cgaactttgg gctcgggcga 120gt
122399122DNAHomo Sapiens
399acaaatagga agtgtgatga ctcaggtttg ccctgagggg atgggccatc agttgcaaat
60cgtggaattt cctctgacat aatgaaaaga tgagggtgca taagttctct agtagggtga
120tg
122400122DNAHomo Sapiens 400gcgttggggt tacaacaacg cacaaaacat aaattctgaa
gctgacacgc tagctttaaa 60cgttccttaa atatcttcat cctcaattta cggttgagga
aactgaggtg tagcgagacc 120tt
122401122DNAHomo Sapiens 401ggtcccggag ttctgctcac
ttcagccgtg tgccgggcac tgcaaatcag gaagtgttgg 60cgccggctgg cgacctcccg
cctggggcca ggggaggagg gtggttggac gctgccaccg 120ct
122402122DNAHomo Sapiens
402ggcctcaagt gattcaccca cctctgcctc ccaaagtgct ggaattacag gcatgagcca
60cggtgcctgg cccaaactgc atatttaaag ggtagagtct gatggcttta ggtacttgtc
120ac
122403122DNAHomo Sapiens 403ggcctcaagt gattcaccca cctctgcctc ccaaagtgct
ggaattacag gcatgagcca 60cggtgcctgg cccaaactgc atatttaaag ggtagagtct
gatggcttta ggtacttgtc 120ac
122404122DNAHomo Sapiens 404tccatgctga agtagttgga
gttcttgtcg tccccggact cgacaaactg gatgatgggt 60cgccgccact cattgcccgc
gaacagggcg ctcctacctt cccctggctt cagggcgctg 120cc
122405122DNAHomo Sapiens
405cagcggctgt gcgctcccta cagtcattac tgtaccctcc cggcagcctc cggcagaaca
60cgcagcagca gcagcagtta gcgctgatgc aactatcgtt gctgttgcca ccgcctcccc
120ac
122406122DNAHomo Sapiens 406tccaccctct ttctctcacc tttacttggc ttctgggact
tcacttggct tctctggtgc 60cgcggggttt cccgcctccc aggcacaggt cgcctcccca
gggcaactag cgacgtagga 120gc
122407122DNAHomo Sapiens 407agcaagtcgc ttaggaagcc
aagttcacag tttggatctt acagagtaat aagaaaggat 60cgaaggctgg ggaaaggtta
cattttgaaa ggcattatac acactgccca ggagtttgaa 120ct
122408122DNAHomo Sapiens
408catgctgagg aaagtggccg tagcggctgc gtccaagccg cacgtggaga tccgccagga
60cggggatcag ttctacatca agacatccac cacggtgcgc accactgaga tcaacttcaa
120gg
122409122DNAHomo Sapiens 409atggtcagag gcataatccc aagtcgtttc aataattcca
atgtaataat gcttttcttt 60cgcccaggct ggggtactac ataaaaacag aaaaatacca
agtatcaaaa tcttcatttt 120tt
122410122DNAHomo Sapiens 410aaactggcct cccctagtga
agtggtgcag caagtcgcag agaagcaata tccaccgcat 60cgtccgagtc cttactcatg
ccaacactca ctctctttcc ctcagcactc attgccacag 120gg
122411122DNAHomo Sapiens
411tcctgggttg tcattctctt aggtcataaa ccggctgtgc ctggacacag ctgagtgagc
60cgcgtctgag ctcatccgct cctggggaga ggccctggga cgccccgcct gtcggtggca
120at
122412122DNAHomo Sapiens 412ctttggcggc ggaaatgttg ctgaagcgga tctgggctgg
cttgtcgcgg tcctgatagg 60cgcctttccc gcggccgccg gcagccccgg cagtcgcccc
gctccggggt gccacattct 120cg
122413122DNAHomo Sapiens 413gcagaccacc atgtgctatg
ggaagtgtgc acgatgcatc ggacattctc tggtggggct 60cgccctcctg tgcatcgcgg
ctaatatttt gctttacttt cccaatgggg aaacaaagta 120tg
122414122DNAHomo Sapiens
414attgtgattg attatatgtt tgactcctca ccagacaaga tctccgttaa ttcagtcatt
60cgttcacaca ttcattcagc gcatactgag ccttttctgt gtcaggccca gtgttagcct
120tt
122415122DNAHomo Sapiens 415ggtgagaggc gagggcaggc tgggagacaa caactttcgc
agcgacttgg ccggggctgg 60cgccctgcgc gttcccgggc cgtgcgctcg ctctgagacc
cgctccccgc cacgctctct 120ga
122416122DNAHomo Sapiens 416gcgcccggcc caaagtgaga
tttcaactct ctctacacca gctggacctg acagcggact 60cgcggaggcg cagacgccgc
cggcggtctt agctcaagaa tgaagcagcc gcactgggct 120aa
122417122DNAHomo Sapiens
417cgcacctgaa cttggcgtgg ctctgccctg cctggccttt tgtaaggcag tttctcaata
60cgcaggcagg gagcgggatc ttcccgccac tcattctttt ctttttagag atgcggtctc
120ag
122418122DNAHomo Sapiens 418gggtggaatg tggtcatgtt tcagactgcc gatggcttcc
acttcccaga caggcccaga 60cggccccgcc agcagccgag agacattcct caatagccca
gtggctgcca agccaccaaa 120gc
122419122DNAHomo Sapiens 419acggcaaatg agatgaaagg
cgaacaatcc gaaagccgga tcactgagga gctctgggaa 60cgcgccgcga gctgaagcca
cacggggaac tccattttgt cgggacaggg tcggtcctgg 120cc
122420122DNAHomo Sapiens
420cctccatccc ttgccatttc ttgagattct tctgtttagc agagatcact cggccagaca
60cgcatcggca gcagcctggg aatgaagcca gcctgcctgg ggcggccccc gccgcgctcc
120cc
122421122DNAHomo Sapiens 421cggcggagga ggggaggttt cgggtggact cctcagacag
cggcaggcag ttttcgaagg 60cgcgcacgaa aagcaaaact cttccgctct tccacacgta
aacgccaacg tcctccgggc 120gg
122422122DNAHomo Sapiens 422ttgctggaga acccagcttg
aggctcagtt tccaggaatg acatccaccc tacactgtca 60cggtggtcca atgagaaccc
catactgcag ccacatggca tgagacaccc agagtggagt 120ga
122423122DNAHomo Sapiens
423cttgcggcag cagctggacg agctgagctg ggccactgcg ctggcggagg gcgagcggga
60cgctctgcgg cgcgagctgc gggagctgca gcgcctggat gcggaggagc gcgccgcccg
120cg
122424122DNAHomo Sapiens 424ccccaccccc actccggcgc gccatcttta gtgctggcag
cgaggcttct tggccccata 60cgtccaacct tgctgctgga gagattgggg tttattttta
actgacttac atgaacgtga 120cc
122425122DNAHomo Sapiens 425agtgggtaat ttaaaccagt
gtgcacttca acataaatac caaggcactt cctatttgac 60cgctctcgcc cctccccacc
ccctgcatac acaacacatg cacatactca cccacaaaca 120ca
122426122DNAHomo Sapiens
426gaggtggctg cgcagtgaag agggaccccc aggcccacgc cccggggtgg gagccgaaga
60cgcccttggg ccacggtagt gttggagccc ttgtttgaat actgacattt taatcatagt
120ta
122427122DNAHomo Sapiens 427taatggtatc aacagacgag gacaacagca acaacaaagt
ctttatacaa gcctgcaaca 60cgtgacaact gcggatcagg catctgaacc cggcctatct
ttccaccgta tcttcctaca 120ct
122428122DNAHomo Sapiens 428ggccactcac ctgctgagaa
ccttcgatgg ctcctcgatg cccgcggagc aaagttccga 60cgcctcagtt tggcgtttaa
aagtcttcac ggcatggatt cggtttacct tacttcacgt 120tg
122429122DNAHomo Sapiens
429gctttgcttc acttttctgc cactttcttt acttaacttt tctgtcttct ctgactagtt
60cgcttgctcg aaaaaatgaa gggattttaa cggggggctg ggaagatggt cacataacat
120tt
122430122DNAHomo Sapiens 430tatccttggc cagcttcttc tgggatacac attctctagg
tcttttatcc actgaggttt 60cgacagcctg tcctacacga aagaagcaag aagtccaggg
acttcccctg gcagacttgt 120ga
122431122DNAHomo Sapiens 431gggaaacgga cggtcgcggc
cagatgggta cgaacccccc gtgcgcagcg cggagtggta 60cggccgggcc cccaaacctt
gcagtctcac tcgccggtga gataatctgg tggttgtgga 120ga
122432122DNAHomo Sapiens
432gcctcctttc gaaaaggacc ccactggatc tcaaggggcc aatgttgcct gagcgaattc
60cgcctgggag gaagggggcg gccacgttgg caaggcatcg tgcctggctc accctaaagc
120gc
122433122DNAHomo Sapiens 433cccctcccca ccctcttttc tctcctcccc tcgatccctc
ctcctcctct tcacctccag 60cgcccagctg ctcgctgagc gcagttccga cccacagcct
ggcacccttc ggcgagcgct 120gt
122434122DNAHomo Sapiens 434gggcgggggg atcaggttca
gcctctgaaa gtccagagca cgatgtttgg gaaacggccc 60cgcccgcggc ctccgggacc
tggcgaagga gccccgcggg gcgcccctgc taccaccctg 120cg
122435122DNAHomo Sapiens
435aatcaaggtg aagctgaggt ttgagcctta cttaaaggct gatattttcc actctaactg
60cggacagtac tgtagcactg ttatagtacc tgctctgaat gttagtctag caactcaggg
120tc
122436122DNAHomo Sapiens 436ctcgatcccg gcgcgttggt tgtaaagtag gaacagtaat
agcacctacc tctagggcca 60cggagaccga atgaaataat gcctgtcaag tcacttagta
cacagtaagc actcagtaat 120gc
122437122DNAHomo Sapiens 437aagagaggcc gaagggcacg
gggtaggggg ttctcgtagg gtcccagcct caatggttcc 60cgccctggac ctccagctgc
cctgactccc ctctggacac taagactccg cccctgaggc 120tc
122438122DNAHomo Sapiens
438ttattctggt atcaataaaa aggaactgtt actatagtaa cagatattcc acttggtgca
60cggccacttc cacgatgcgg aacatcatgt ccaagccaca cgcttgagag gcacaaataa
120at
122439122DNAHomo Sapiens 439actgcggagg gacacaccca ggtttctgag agatgtccag
tagtacacag gtaacatcta 60cggctcgaga caggttagag attttgaaga aataagttaa
aagttgaaac atgaacctat 120gg
122440122DNAHomo Sapiens 440caggcaagcg aggagcacaa
agacctggat gtggaggcga ccgtgtctgg gcagaagcag 60cggtggctca cctgggcagc
accgccacgc ccactgccag cccagctcca cgccccgccc 120cg
122441122DNAHomo Sapiens
441acggtcatcg ggaccctggc cgaggacctg catatgaaag tatcgggtga cacaagcttc
60cgcctgatga agcaattcaa cagctctctg ctccgggtgc gcgaaggcga cgggcagctg
120ac
122442122DNAHomo Sapiens 442agagacgaga gtgtagatga cagagagagg gtcccgagga
agccgttttg cctcctggaa 60cggttgggta aatccagaaa caagatcttt tgggcatcac
ttgacagccc tacatcctat 120gg
122443122DNAHomo Sapiens 443aaaccgagag gagttgtgaa
gggcgcgggt ggggggcgct gccggcctcg tgggtacgtt 60cgtgccgcgt ctgtcccaga
gctggggccg caggagcgga ggcaagaggt agcgggggtg 120ga
122444122DNAHomo Sapiens
444tgctttccct acattcaggg ctgctccttt tgtcgccaat acaaacctgt tgacaggtca
60cgcctgggaa gcgggtgggg tgtcccggag cggtgctgag gcgctgcagg cccggcttct
120gg
122445122DNAHomo Sapiens 445tctcccattt cacagagggc agactgaggc tctgagtggg
gaagttcttg caagatatca 60cgcagcagag cagggatgtg caccagatct cctgacttta
aaaagcacca aacatagtga 120tt
122446122DNAHomo Sapiens 446ccggggtggg acccggggtc
tcctcgggct ctgacgtgtc ctgagggctg acacgtggag 60cggggcgcag actccgactc
ccccacccaa gaggccagcc cgcagtccca gccccagccc 120ag
122447122DNAHomo Sapiens
447gttttccctc ttgcctgaga acaccactta taacacggga cctatacggg agtggtgaca
60cgccatctgt tcaagtttaa cttttttctc attttttaga cagcaaatac aaatggaagt
120tc
122448122DNAHomo Sapiens 448aaaccagctg gcctgaatca aagcaattct gggtaaaaga
cttcccagat gatctctcaa 60cgccttggca acgcttggcg actgggagct agaaccatga
gttgttaatg tgtgcacgga 120ag
122449122DNAHomo Sapiens 449agaggcaaga caagtgcaaa
ggcagccaca aggcttccgc cagttagacg gtgtttctgc 60cgcccctgcc gtcacccgct
gggtcccgtc ccgctccaag cgcactcccg gcccgcaggg 120tg
122450122DNAHomo Sapiens
450gcttctggta aagcattcaa gacaaccaat ttaagtgttg aagagcaaaa ggaaaaggaa
60cgtggggaag ctaaacactg ctttaatgct ttcgcaagtg acaggatttc tttgcaccga
120ga
122451122DNAHomo Sapiens 451ccactgtgcc catctctggt ttcaccaggc tccattcctt
ccccagttcc ctgtttctca 60cggccctgaa accagccgac agggatttgc attttgaaaa
accttgcgtg gctgccggcg 120ct
122452122DNAHomo Sapiens 452ggcattcccg ggcagattcc
tggcttgggg actaatgccc cagaggctcc aggttaccca 60cgggctcagg gatggctccc
acggggtgtt tccagttccc gggagagtcg agtaaggtcc 120cg
122453122DNAHomo Sapiens
453ttattgtaaa cccattttac cagtgatgtg aatgagccgc aatgaaggct aagggacttg
60cgcaaggtga catatataag caacaggcct gcgattggaa tccaggcccc agagtctggg
120ca
122454122DNAHomo Sapiens 454tgagggaact agagagactt gtttggcgag tggtggcaac
cagtgttctg tggatgtgga 60cggttcctgg tcatcaaagt tatggtcagc tctggttcct
gttcgcctgg acccagactt 120ac
122455122DNAHomo Sapiens 455aggccggggg cggagccgca
gagggacccg cggccggcca atcagagacg tagcggagcc 60cggcggacta cattgcccag
taacctcctg ggctccgctg tgtttttcta ttctggggtg 120ta
122456122DNAHomo Sapiens
456atctgttggc gttgacgctt aaatgttgga tattgcactg cggcagtgcc ttgaaatgta
60cgtgcaggat ggaatgttag gtaactatta aagccactct tgtgaagatg tattttgcag
120cc
122457122DNAHomo Sapiens 457gaaggagaga agagccagcc agaaattatc cagcaaatct
atcatggatc ctaatcagaa 60cgtgaaatgc aagatagttg tggtgggaga cagtcagtgt
ggaaaaactg cgctgctcca 120tg
122458122DNAHomo Sapiens 458cgccgggggt ccagagtctt
gggcaaactt tgaagggtgc cggagccgct tgttgctcct 60cgcggcggag ggagccgcac
cgttacgtcc ccgcggggag agcgaggcgg ccctcctcgg 120cg
122459122DNAHomo Sapiens
459attcactcgc actgcctggg attgcactgg atccgtgtgc tcagaacaag gtaagagcct
60cgctccttta acagctttat tacctgctgc cacttctcac tccaccaagg gcctggagtt
120cc
122460122DNAHomo Sapiens 460aatctatcag aatcctcgct gaaagtctta tttctccttg
aaaccgaaag agctttcaaa 60cgtggcttcc tgagtttttc agtttgctgg tgggtgggtc
tggagtgggc atcccgtctg 120ca
122461122DNAHomo Sapiens 461cactacccca tggaggcctg
gctggtgctc acatacaata attaactgct gagtggcctt 60cgcccaatcc caggctccac
tcctgggctc cattcccact ccctgcctgt ctcctaggcc 120ac
122462122DNAHomo Sapiens
462gaagacccct ctccctgaag ctggcaggcc agggactagc ccagtggggc agggtactca
60cggttggcct gggcctgagg tgggagcagg ttctggacag atggccaagg ttgcaaatgt
120gg
122463122DNAHomo Sapiens 463gggccccgcc atggctggga tggacagtgg caacctgaag
accgcgaggc tgtggcggga 60cgccgccctg cgtgccagga agctgcggag caacctgcgc
cagctcacgc ttaccgccgc 120cg
122464122DNAHomo Sapiens 464ctccgccttg gctgcgatgt
tgctcactct gctcagggct ctcccctctc cgtccggtag 60cgcaccctgg ctttgcaata
gcccctggct cggagccgct ttccagcgag tgcaagaacc 120gg
122465122DNAHomo Sapiens
465gagggtggcc gccgagagcc gccgctacca tcgcgacaaa gacccgggta gctcccgctg
60cgcccagagc catcatctca gaaggactca agagggagaa agaaagagaa aatgaccgtc
120ac
122466122DNAHomo Sapiens 466tgggggaggg ggacttgttt ttcttttcct ctagagacct
cggcttgcaa ctggatcaaa 60cgctgtcgaa aggatgtaaa taggcagagc aactgttacc
aagaaggcca ccacccccac 120cc
122467122DNAHomo Sapiens 467tggttatgtg gagaaggagc
aatcccttct ccctcctcct cctccccccg ctactatccg 60cggcccagag aactgccgct
tgccgccatt gacacgcaca gatagaaccc aaagaaaggc 120aa
122468122DNAHomo Sapiens
468cgggatgggg gagcccagca gtgcccactg cacgcctggt gacgagtctc ccctcatctg
60cgcagctcag tttgctcagt ttgctcttcg tgacacgtga ctcggcaagg ggagcaggag
120ga
122469122DNAHomo Sapiens 469agggggattt ttagagggca gccggctcta gataccggaa
atggagacgt ctgagtggga 60cgccctgtca cacaaatgcg ctgtgtgggc tggcctatgc
cccatcctaa attattcaaa 120ca
122470122DNAHomo Sapiens 470ggccgccgct ccccggtccc
ccgctccgtc cgccaccctg ccgccgccca gcagccgcca 60cgctgaaggc cggcgactgg
cgctcacacc acccagcact gaaatattaa acaggggagc 120gg
122471122DNAHomo Sapiens
471tcttagccgc aggctttgat gctgtcattt tctccaaatg cttcttgagc acctactaag
60cgcttgcgcc gggcggtgcc gcgggagaca gcgccgtggg cacctcactt gcggcagata
120ac
122472122DNAHomo Sapiens 472gtgggcgggg ggtctggagt ggccagccaa tcaggcgggc
agtgccacct cggggaatga 60cgctcgggcc aatgggaagg gcactccatt ccgtcaacgc
tgtgggtcgg ggttctgaga 120aa
122473122DNAHomo Sapiens 473tgctttaaaa aaaataaaat
tttgtgttag aagttttaaa acatttggaa attctagttg 60cggcttcaga tttcataatt
cagatgatgc aacaggatgg aaccattgtc aaagagaatg 120ca
122474122DNAHomo Sapiens
474tcccaaaata gcaaacctct aaaatcagga gtccaatggg catgcattca agcctctaat
60cgtagaatgt atttggctgg ccggttggct ggctggctgg ttggttggtt ggttggttgg
120tt
122475122DNAHomo Sapiens 475ccagactttt cgtccctacc cccaccaagc tccctggaac
ggtctccccg cgtctgggga 60cggagaggag aactaataac tggccccttc agccgcccac
ccgcccctgt ccagcttcgc 120tc
122476122DNAHomo Sapiens 476atgcattgaa ccagaaaaga
gaaggggcaa agaaatcagg tatcaagaag accagaattg 60cgcaactgca gtttagcctg
gtgagttgca attctggctg cacatgaaaa ttacttggag 120aa
122477122DNAHomo Sapiens
477tgggagctgc cgcggtcagg cgcgggtggg gacctgggga gctctttaag tctccctgtg
60cgccccgccc tccctggccg aggggcccgc cccgtggagc cacctaggcg ggcagatgaa
120gc
122478122DNAHomo Sapiens 478gagggctggg cgcagcgtgc gggcttttgg gggtagaggg
ttgagttgca cgggaggtta 60cgactcccac tccgggagcc cagtcttgtc acacctaggg
cttcaccagt ctgcgacatt 120cg
122479122DNAHomo Sapiens 479tcggcttcca gctcgggggc
ctcggcagag actaggaacc agactggggc agcactgggg 60cgcccgccac ccccacccac
tccggcaagc gggcgaatca gcgcggctaa cccgcggcgc 120cc
122480122DNAHomo Sapiens
480caaagttagc accttagcag ggtgggcgtg acccttgggg cgggctgtgc agtctgcctg
60cgcggagctg gccgtgtgcg ctgcgccctc ggccggaggc tcacctggca aatcagacgc
120gc
122481122DNAHomo Sapiens 481agtttggaat ttggtttcta tcttgtttgc agcattcata
tttagcaaca ataggaacca 60cgggaaataa cattataact gaaacaaaag ttgggatttt
gcttgtaagt aaaacctttg 120gt
122482122DNAHomo Sapiens 482ggggatgcct cagaaaactt
ataatcatgg cagatgggga aacaaacaca cccttctcca 60cgtggcagca ggaagtgccg
aacaagaggg aaaagcccct tataaaacca tcagatctcg 120tg
122483122DNAHomo Sapiens
483cagccgagaa gcagaaacac gacgggcggg tgaagatcgg ccactacatt ctgggtgaca
60cgctgggggt cggcaccttc ggcaaagtga agggtgagaa ccccgcggga ctaggcttgg
120cc
122484122DNAHomo Sapiens 484gcccaggtgt ttacctggca ctcaggtgag tggtgcgctc
tggctgtttt ctgtcggagc 60cgcccgcctc ttccttcagc gcgtcccaca aatcccgacg
gcacggaggg gccccaggcc 120aa
122485122DNAHomo Sapiens 485gcgagaagtt gagggtgggc
agctggaaca tggacaactc ttccgggggg gccctggagc 60cgccgccgcc gccgccgcct
gctccgccag caccgccgcc tcccgcaccg ttcccgccgc 120cg
122486122DNAHomo Sapiens
486cacagaggag ctgaatgcaa gcgaggaaac gctttaggat tcgcatttcc agacggtctg
60cggcccctcg ccgtgcggct cctctgcttc tcagagtgga gagggagggg gagcgaagga
120aa
122487122DNAHomo Sapiens 487cctccccggt tcatgcgcct cggcctccca aaatgctggg
attgcggatc tgagccaccg 60cgcccggcct gaggtgattt ttaacaagta cagccgtagc
tgcagatatc ctggttctgt 120ag
122488122DNAHomo Sapiens 488tcacactttc ctcccttatt
cacaatagag ctctcattta ttgagcacct attgtgtgcc 60cgccccttta taaaatcaaa
cctggttttt actatgatct gggggaggat gctgttaatt 120ag
122489122DNAHomo Sapiens
489gcaatttaaa aaaatgtaac tttcattaac gagcgcgccg gaaatctcag gtatcaaaga
60cgcattaacc ctggagcgtc ccccgcgcgc cgcagccgga cggaggcagc cgcggcgaac
120ag
122490122DNAHomo Sapiens 490atgaaggcat agagggccaa gtgactgaaa caatatgccg
acaaccccaa agcaccacta 60cgctctccaa agagggcagc atcccaccct caggcgctgg
aggcttgacc actctccagc 120tg
122491122DNAHomo Sapiens 491ggggccaata atctcaacaa
cacaggtaac agtaacagcc aagtctgact aagcggcatc 60cgcctcgggg gtctgatccc
gcccaatctg ggaggggcgc cggggtcccg ggtcgccagc 120tg
122492122DNAHomo Sapiens
492ggacagaaag tctacttctg gctgtcactt gcaatattat tcttcaataa ccccgaataa
60cgcgcattgg gaaggccacc tcgcctccct tccaatcacc cccacccccc tcgccaacaa
120tc
122493122DNAHomo Sapiens 493acagccccgc tcaatcagcg agtctcttct tccctaggag
cgcccctggc cactgaactg 60cgctgccagt gcttgcagac cctgcaggga attcacctca
agaacatcca aagtgtgaag 120gt
122494122DNAHomo Sapiens 494ggttgccatg gcggcggttg
tcgcggcgac gaggtggtgg cagctgttgc tggtgctcag 60cgccgcgggg atgggggcct
cgggcgcccc gcagcccccc aacatcctgc tcctgctcat 120gg
122495122DNAHomo Sapiens
495ttgttacccg gttagaaaag tttgcggagc gcggggatgg actaaccggc tctcctgctt
60cgccctccca gcgcctagaa gcctgcagct ccggagcagt ggccgcgcca cgccggcccc
120ag
122496122DNAHomo Sapiens 496cgcggggcgc catggcacac cgagcggctc cgtcttctgc
tcctcagaga gcccggctgg 60cggcctggga tgacaaggta ccatccctcc agaggctgat
cccaatgcat cggcttcgct 120ta
122497122DNAHomo Sapiens 497gtcactagtc cctggcatat
ccacgctgga gcagctacag ctccctgcct ttggcactta 60cgtgctgtgt gaccctgagc
aagttatggc acctctctgg gcctcagttt ccttttttgt 120tt
122498122DNAHomo Sapiens
498cccctaggaa acccagggga aatgccgcta tgccgacata acagcgccca gcacagcaaa
60cgcagattag acagatgcac tcgcccggca tgtgcctagc acctgggcta ggagatttca
120ca
122499122DNAHomo Sapiens 499ttacaggtag aggacctctg tgcaggagcc ctcaacaccc
agggaggatt aggatataag 60cgcaaactca aaggtactgt aatgggcacc tagcaatcag
aggtgataca agggtctctt 120gg
122500122DNAHomo Sapiens 500aatggggcca gagggctccc
gggctgggca ggtaaggagc gctggtattg ggggcgcagg 60cgccggggtg agaggcctga
tagcagacgg ctgcagctgt gcgggcccag gctccctagg 120ga
122501122DNAHomo Sapiens
501agggcagctc tcacccaggc tgatagttcg gtgacctggc tttatctact ggatgagttc
60cgctgggaga tggaacatag cacgtttctc tctggcctgg tactggctac ccttctctcg
120ca
122502122DNAHomo Sapiens 502tccgctggga gatggaacat agcacgtttc tctctggcct
ggtactggct acccttctct 60cgcaaggtaa ggctactcca ggtgggtggg ggaagggacc
tgagagggac attactgatg 120gg
122503122DNAHomo Sapiens 503tgcagaccaa aaccacaagc
agaacaagca ggcgtgagac actcacaggt tgggtttgat 60cgcatgcgtg tcggagagga
gagagcagag agagacacag gaacaagaac agcaaagggt 120ag
122504122DNAHomo Sapiens
504tctgctctac cctttgctgt tcttgttcct gtgtctctct ctgctctctc ctctccgaca
60cgcatgcgat caaacccaac ctgtgagtgt ctcacgcctg cttgttctgc ttgtggtttt
120gg
122505122DNAHomo Sapiens 505agaagagaaa gaaataccag aggcctgact tcatgtttgc
cagaaacagt taacagtcct 60cgcgttcagt gttcaaagct gacagtgaat tcaggctctc
ggttgttttc tatttgctgg 120aa
122506122DNAHomo Sapiens 506tggagccagt ctagctgctg
cacaggctgg ctggctggct ggctgctaag ggctgctcca 60cgcttttgcc ggaggacaga
gactgacatg gaacagggga agggcctggc tgtcctcatc 120ct
122507122DNAHomo Sapiens
507taacccaggc ctggggactg tgggtcctct taggggctgt gacgctgcta tttctcatct
60cgctggctgc acacttgtcc cagtggacca ggggccggag caggagccat ccggggcagg
120ga
122508122DNAHomo Sapiens 508taaagggcca gcctgagctg cagaggattc ctgcagagga
tcaagacagc acgtggacct 60cgcacagcct ctcccacagg taccatgaag gtctccgcgg
cagccctcgc tgtcatcctc 120at
122509122DNAHomo Sapiens 509ctcaaatttc aggaagtagc
tgtgaggatg gggtggcagg aaatgacgaa aacctgaata 60cggaactgaa gcagcagctc
agtttctcac tccgaagtgg cagcagccag agagggagtc 120gg
122510122DNAHomo Sapiens
510ttctgtacct gagagcagca gcagcaacgc caccatccag tggctgggca caggagacaa
60cgccagcctg gccatggtca ccgctctgtc cccgacccca aacccgtgac aacgtccgag
120gc
122511122DNAHomo Sapiens 511atttctgtgt gcaggcgagc ttcttggcct aagggcagga
agagatggca gcgggggaga 60cgcagctcta cgccaaggtc tccaacaagc tcaagagccg
cagcagcccc tcgctcctgg 120ag
122512122DNAHomo Sapiens 512gcagagtgaa aagagcaaac
cactttgcca gaatggaaac agagagtcag tcaccggaaa 60cgacaccacc aatgtgctaa
tgaagcacag ggcacaggaa actctgctca gctcttaatc 120tg
12251326DNAArtificialPrimer
513gtttagaggg gttttttgat tatttg
2651424DNAArtificialPrimer 514aactcctaca actccaaaaa attc
2451525DNAArtificialPrimer 515gagggaatag
ttggaatgta ttttg
2551626DNAArtificialPrimer 516ctaaactact atttcctact aactac
2651725DNAArtificialPrimer 517ggtttagagt
ttttagtatg gggtt
2551824DNAArtificialPrimer 518actctaaccc taatctacca acaa
2451923DNAArtificialPrimer 519aggtaggagt
atgtgtttgg tag
2352025DNAArtificialPrimer 520tcaaaaatac aaaaaaaaaa caaaa
2552125DNAArtificialPrimer 521ggtttggttt
ttggaatttt aaggg
2552228DNAArtificialPrimer 522aaaacaacaa caatatcatt aacctaac
2852325DNAArtificialPrimer 523gtttatttga
ttattgggtg ggttt
2552425DNAArtificialPrimer 524ctataacaac aacaataaca acaac
2552525DNAArtificialPrimer 525aaatatgggg
gtattatttt atatg
2552625DNAArtificialPrimer 526ccttactatt aaaaatacaa atacc
2552725DNAArtificialPrimer 527atgaattgaa
ggatgttatt taggg
2552825DNAArtificialPrimer 528aaacttccaa acaaaaataa ccaac
2552929DNAArtificialPrimer 529tgtgtaaatg
tggttgtatt gttaatagg
2953031DNAArtificialPrimer 530catcatatta ctcaaactaa tctcaaactc c
3153128DNAArtificialPrimer 531gtgatttggt
tttatttatt ggatgagt
2853222DNAArtificialPrimer 532aataaacctc actcccatca at
2253323DNAArtificialPrimer 533ggttttattt
attggatgag ttt
2353422DNAArtificialPrimer 534ggtttggtat tggttatttt tt
2253528DNAArtificialPrimer 535ggtatttgta
tttgtagttt tgttgagg
2853628DNAArtificialPrimer 536ttctcctcca taaaacacta tttctctc
2853722DNAArtificialPrimer 537tgatgggtgg
agttagttta gt
2253821DNAArtificialPrimer 538aaacccttcc cctattccat a
2153916DNAArtificialPrimer 539ggttggttgt taaggg
1654023DNAArtificialPrimer 540ggggaagtgt gtttgtatgg atg
2354134DNAArtificialPrimer 541aaaccacata
tctaaaacta tctctaacta ctac
3454225DNAArtificialPrimer 542aggtagttgg ggtttttttt attag
2554329DNAArtificialPrimer 543ctacccttta
ctattcttat tcctatatc
2954420DNAArtificialPrimer 544atatttatag gttgggtttg
2054527DNAArtificialPrimer 545taggtaggag
aggaattggg gttatag
2754628DNAArtificialPrimer 546catccacaaa aaaccccaac tatactac
2854728DNAArtificialPrimer 547agttggagat
gagagtaaat tttatagg
2854828DNAArtificialPrimer 548aatacctccc ctaaatccca atttacat
2854918DNAArtificialPrimer 549ggttgggtat
aggagata
1855034DNAArtificialPrimer 550ttattgttaa aattttgtaa aagattaggt atag
3455129DNAArtificialPrimer 551ttcctcctca
actcttactc tatatttcc
2955220DNAArtificialPrimer 552aggatggggt ggtaggaaat
2055327DNAArtificialPrimer 553cctccaccta
tacaaacctc tattcta
2755415DNAArtificialPrimer 554gggtggtagg aaatg
1555534DNAArtificialPrimer 555taagtaggta
atttaaaaat ttaatggttt gatg
3455632DNAArtificialPrimer 556cctctatctt caaaatcatc aataatccat ac
3255730DNAArtificialPrimer 557gaggtttgat
tttatgtttg ttagaaatag
3055819DNAArtificialPrimer 558tcccaaaaaa cccacttcc
1955925DNAArtificialPrimer 559tttgttagaa
atagttaata gtttt
2556024DNAArtificialPrimer 560ggtttatggt ggtaggaagt ttgg
2456132DNAArtificialPrimer 561ttaacaccta
actatccata tacctaatat cc
3256224DNAArtificialPrimer 562gttaggttag gttaggagga ttat
2456324DNAArtificialPrimer 563ccaaccacaa
aaaactacta catc
2456418DNAArtificialPrimer 564gagagttggt attggggg
1856531DNAArtificialPrimer 565gtagtgtgtt
tgtggatttt tatatttgta g
3156630DNAArtificialPrimer 566atctaatcaa caacttatcc ttcctcctac
3056723DNAArtificialPrimer 567gtgggttttt
ttaggggttg tga
2356823DNAArtificialPrimer 568tctcaatcaa cccatcccta tta
2356925DNAArtificialPrimer 569gttgtgaagt
tgttattttt tattt
2557024DNAArtificialPrimer 570tggtggaaat agttaggatt ggtg
2457134DNAArtificialPrimer 571caatatctta
ccctacaaaa tacactactt taac
3457223DNAArtificialPrimer 572ggtttaaggg taggaagaga tgg
2357330DNAArtificialPrimer 573actaactaaa
cccccaaatc tctaaacaat
3057417DNAArtificialPrimer 574gtaggaagag atggtag
17
User Contributions:
Comment about this patent or add new information about this topic:
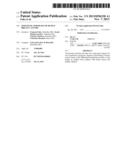 | 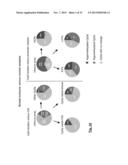 |
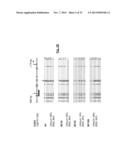 | 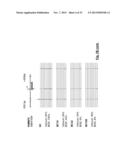 |
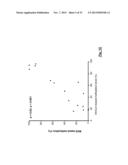 | 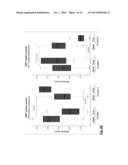 |
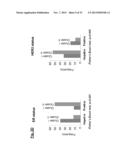 |  |
 |  |
 |  |
 |  |
 |  |
 | 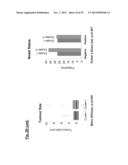 |
 |  |
 |  |
 |  |
 |  |
 |  |
 |  |
 |  |
 |  |
 |  |
 |  |
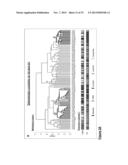 |  |
 |  |
 |  |
 |  |
 |  |
 | 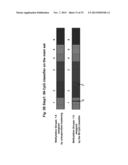 |
 |  |
 |  |
 |  |
 |  |
 |  |
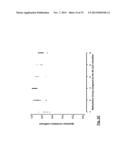 |  |
 |  |
 |  |
 |  |
 |  |
 | 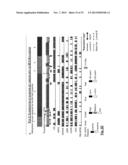 |
 |  |
 |  |
 |  |
 |  |
 |  |
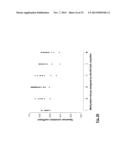 |  |
 | 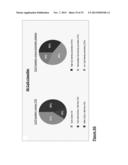 |
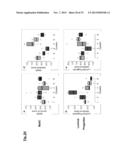 | 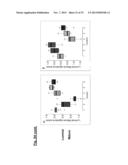 |
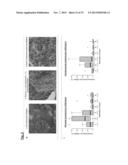 | 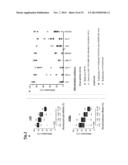 |
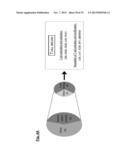 | 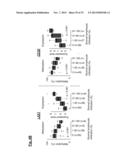 |
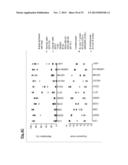 | 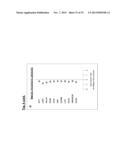 |
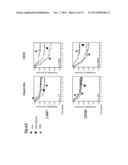 | 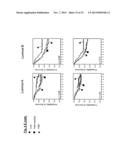 |
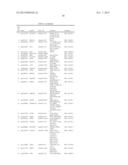 |  |
 | 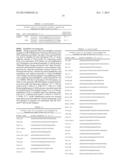 |
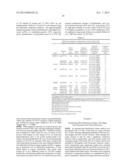 |  |
 |  |
 | 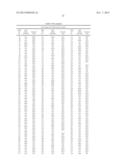 |
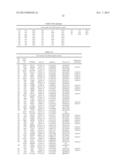 | 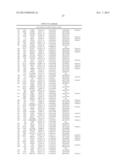 |
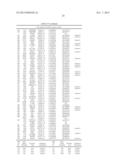 | 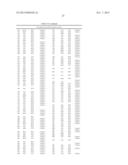 |
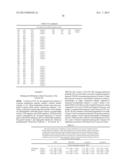 | 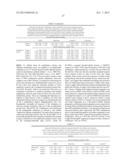 |
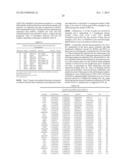 | 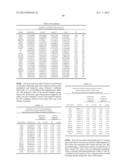 |
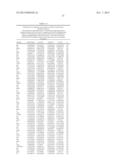 | 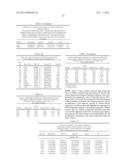 |
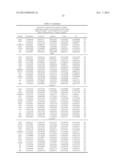 |  |
 |  |
 |  |
 |  |
 |  |
 |  |
 |  |
 |  |
 |  |
 |  |
 |  |
 |  |
 |  |
 |  |
 |  |
 |  |
 |
| Similar patent applications: | |
| Date | Title |
|---|---|
| 2014-03-06 | Methods of diagnosing and treating cancer |
| 2013-12-26 | Diagnostic for colorectal cancer |
| 2014-03-20 | Identification of free-b-ring flavonoids as potent cox-2 inhibitors |
| 2009-12-31 | Muteins of human tear lipocalin |
| 2013-07-18 | Targeted osmotic lysis of cancer cells |
| New patent applications in this class: | |
| Date | Title |
|---|---|
| 2022-05-05 | Compounds and methods for targeting hsp90 |
| 2022-05-05 | Pharmaceutical formulations, processes for preparation, and methods of use |
| 2019-05-16 | Modulators of the integrated stress pathway |
| 2019-05-16 | Compounds for treatment of cancer |
| 2019-05-16 | Sglt-2 inhibitors for treating metabolic disorders in patients with renal impairment or chronic kidney disease |
| New patent applications from these inventors: | |
| Date | Title |
|---|---|
| 2012-03-22 | Gene-based algorithmic cancer prognosis |
| 2012-03-15 | Methods and tools for predicting the efficiency of anthracyclines in cancer |
| 2011-12-15 | Method and tools for prognosis of cancer in her2+partients |
| Top Inventors for class "Drug, bio-affecting and body treating compositions" | |
| Rank | Inventor's name |
|---|---|
| 1 | Anthony W. Czarnik |
| 2 | Ulrike Wachendorff-Neumann |
| 3 | Ken Chow |
| 4 | John E. Donello |
| 5 | Rajinder Singh |