Patent application title: METHODS FOR PREDICTING MULTIPLE MYELOMA TREATMENT RESPONSE
Inventors:
Jerome Moreaux (Montpellier, FR)
Bernard Klein (Montpellier, FR)
IPC8 Class: AC12Q168FI
USPC Class:
Class name:
Publication date: 2015-08-06
Patent application number: 20150218654
Abstract:
The present invention relates to a method of testing whether a patient
suffering of multiple myeloma will respond or not to a DNA
methyltransferase inhibitor (DNMTi) comprising: i. determining the
expression level (ELi) of several genes G1-Gn selected from
table A in a biological sample obtained from said patient ii. comparing
the expression level (ELi) determined at step i) with a predetermined
reference level (ELRi) iii. calculating the DMS score trough the
following formula (I) wherein β1 represent the regression β
coefficient reference value for the gene Gi and Ci=1 if the
expression of the gene Gi (ELi) is higher than the predetermined
reference level (ELRi) or Ci=-1 if the expression of the gene (ELi) is
lower than or equal to the predetermined reference level (ELRi) comparing
the score DMS determined at step iii) with a predetermined reference
value DMSR and concluding that the patient will respond to the DNMTi
when the DMS score is higher than the predetermined reference value
DMSR or concluding that the patient will not respond to the DNMTi
when the DMS score is lower than the predetermined reference value
DMSR.
DMS = i = 1 n β i × Ci ( I )
##EQU00001##Claims:
1. A method of testing whether a patient suffering of from multiple
myeloma will respond or not to a DNA methyltransferase inhibitor (DNMTi)
comprising: i.determining the expression level (ELi) of a plurality of
genes G1-Gn selected from table A in a biological sample
obtained from said patient ii. comparing the expression level (ELi)
determined at step i) with a predetermined reference level (ELRi) iii.
calculating the DMS score trough the following formula DMS = i = 1
n β i × Ci ##EQU00003## wherein β
represents the regression β coefficient reference value for the gene
Gi and Ci=1 if the expression of the gene Gi (ELi) is higher
than the predetermined reference level (ELRi) or Ci=-1 if the expression
of the gene (ELi) is lower than or equal to the predetermined reference
level (ELRi) iv. comparing the DMS score determined at step iii) with a
predetermined reference value DMSR v. and concluding that the
patient will respond to the DNMTi when the DMS score is higher than the
predetermined reference value DMSR or concluding that the patient
will not respond to the DNMTi when the DMS score is lower than the
predetermined reference value DMSR.
2. A method for the treatment of multiple myeloma in a patient in need thereof comprising the steps of: a) testing whether the patient will respond or not to a DNA methyltransferase inhibitor (DNMTi) by performing the method according to claim 1 b) administering the DNA methyltransferase inhibitor, if said patient has as a DMS score higher than the reference value DMSR.
3. The method of claim 1, wherein at least 25 genes from Table A are determined, and wherein said 25 genes are: 202061_s_at SEL1L, 202304_at FNDC3A, 202558_s_at STCH, 203397_s_at GALNT3, 204079_at TPST2, 205483_s_at G1P2, 205552_s_at OAS1, 205718_at ITGB7, 208725_at EIF2S2, 209083_at CORO1A, 209118_s_at TUBA3, 209122_at ADFP, 209417_s_at IF135, 211990_at HLA-DPA1, 214152_at CCPG1, 214179_s_at NFE2L1, 219118_at FKBP11, 221658_s_at IL21R, 222690_s_at TMEM39A, 223129_x_at MYLIP, 224451_x_at ARHGAP9, 224763_at RPL37, 227755_at EST, GenBank AA042983, 228831_s_at GNG7 and 232488_at MGC15875.
4. The method of claim 2, wherein at least 25 genes from Table A are determined, and wherein said 25 genes are: 202061_s_at SEL1L, 202304_at FNDC3A, 202558_s_at STCH, 203397_s_at GALNT3, 204079_at TPST2, 205483_s_at G1P2, 205552_s_at OAS1, 205718_at ITGB7, 208725_at EIF2S2, 209083_at CORO1A, 209118_s_at TUBA3, 209122_at ADFP, 209417_s_at IF135, 211990_at HLA-DPA1, 214152_at CCPG1, 214179_s_at NFE2L1, 219118_at FKBP11, 221658_s_at IL21R, 222690_s_at TMEM39A, 223129_x_at MYLIP, 224451_x_at ARHGAP9, 224763_at RPL37, 227755_at EST, GenBank AA042983, 228831_s_at GNG7 and 232488_at MGC15875.
Description:
FIELD OF THE INVENTION
[0001] The present invention relates to methods for predicting multiple myeloma treatment response.
BACKGROUND OF THE INVENTION
[0002] Malignant transformation requires oncogenic activation and inactivation of tumor suppressor genes, which help cancer cells overriding the normal mechanisms controlling cellular survival and proliferation (1,2). These molecular events are caused by genetic alterations (translocations, amplification, mutations) and also by epigenetic modifications (3). Epigenetic modifications include methylation of DNA cytosine residues and histone modifications and have been shown to be critical in the initiation and progression of cancers (4). DNA methyltransferase inhibitors or HDAC inhibitors are now being used in the treatment of several hematologic malignancies including MM (5-8).
[0003] Multiple myeloma (MM) is a plasma cell neoplasm characterized by the accumulation of malignant plasma cells, termed Multiple Myeloma Cells (MMCs) within the bone marrow (BM). Despite the recent introduction of therapies such as Lenalidomide and Bortezomib, MM remains an almost incurable disease. MM arises through the accumulation of multiple genetic changes that include an aberrant or overexpression of a D-type cyclin gene, cyclin D1 (CCND1) in the case of t(11;14) translocation or gain in 11q13, cyclin D3 (CCND3) in the case of the rare t(6;14) translocation, or cyclin D2 (CCND2) on the background of a translocation involving c-maf (414;16)) or MMSET/FGFR3 (t(4;14)) (9,10).
[0004] Recent studies have shown that epigenetic changes such as DNA methylation play a role by silencing various cancer-related genes in MM. Most of these studies have been performed on limited number of genes using methylation specific PCR (11-18). Among the genes identified with promoter hypermethylation in MM, cyclin-dependent kinase inhibitor 2A (CDKN2A) and transforming growth factor beta receptor 2 (TGFBR2) have been shown to be associated with a poor prognosis in MM patients with discrepant results for CDKN2A (12). Heller at al. have identified several epigenetic inactivated cancer related genes in 3 human myeloma cell lines (HMCLs) and validated the relevance of 10 of these genes in 6 additional HMCLs, premalignant PCs from 24 MGUS patients and MMCs from 111 patients with MM (19). Methylation of secreted protein acidic and rich in cysteine (SPARC) and Bcl2/adenovirus E1B 19 kDa interacting protein 3 (BNIP3) promoters was associated with poor overall survival of MM patients (19). SOCS3 methylation was found to be associated with extramedullary manifestations, plasma cell leukemia and significant shortened survival in MM patients (20). More recently, Morgan et al have shown that the transition of normal plasma cell (PC) and MGUS stage to MM stage is associated with DNA hypomethylation, but the transition of intramedullary MM stage to plasma cell leukemia or HMCL stage is associated with DNA hypermethylation (21). They described 2 specific subgroups of hyperdiploid MM on the basis of their methylation profile, which had a significantly different overall survival (21).
[0005] DNMT inhibitors can be sub-divided into nucleoside analogue and non-nucleoside analogue families. 5-Azacytidine (azacytidine)/5-Aza-2'-deoxycytidine (decitabine) are both nucleoside analogues with Food and Drug Administration approval for use in myelodysplastic syndrome. Clinical trials in myeloma combining these demethylating agents with chemotherapy or other agents are underway (8).
[0006] An important objective for optimizing these clinical trials will be the identification of biomarkers predictive for sensitivity of MMCs to DNMTi. In the present invention, the inventors used gene expression profiling of Multiple Myeloma Cells (MMCs) to build a novel "DNA methylation gene expression score" that makes it possible identification of patients whose MMCs will be targeted by DNMT inhibition.
SUMMARY OF THE INVENTION
[0007] The present invention relates to a method of testing whether a patient suffering of multiple myeloma will respond or not to a DNA methyltransferase inhibitor (DNMTi).
DETAILED DESCRIPTION OF THE INVENTION
[0008] The multiple myeloma treatment response was investigated by the inventors using DNA methyltransferase inhibitors (DNMTi), human multiple myeloma cell lines and primary myeloma cells. The inventors analyzed gene expression profiles of 5 MM cell lines treated with decitabine using microarrays. The inventors identified 127 genes deregulated by decitabine. 47 out of 127 decitabine deregulated genes have prognostic value in inventor's cohort of 206 newly-diagnosed MM patients. The inventors summarized the prognostic information in a DNA methylation score (DM Score or DMS) built using the probe set signal value weighted by the beta coefficient of prognostic genes. The DM Score is predictive for DNMT inhibitor sensitivity of HMCLs and primary myeloma cells in vitro. The DM Score allows identification of myeloma patients that could benefit DNMT inhibitor treatment.
[0009] The inventors also demonstrated that the DM Score is also predictive of myeloma cells sensitivity for another DNMTi, 5-Azacytidine. HMCLs with a high DM Score exhibited significant 3-fold higher 5-Azacytidine sensitivity than HMCLs with a low DM Score and these results were validated in vitro with primary myeloma cells of patients.
Definitions
[0010] The term "patient" denotes a mammal. In a preferred embodiment of the invention, a patient refers to any patient (preferably human) afflicted with multiple myeloma. The term "multiple myeloma" refers to multiple myeloma such as revised in the World Health Organisation Classification C90.
[0011] The term "DNA methyltransferase inhibitors" or "DNMTi" has its general meaning in the art and refers to a multiple myeloma treatment. The term "DNA methyltransferase inhibitors" or "DNMTi" refers to DNA methyltransferase inhibitor that can be sub-divided into nucleoside analogue (5-Azacytidine (azacytidine), 5-Aza-2'-deoxycytidine (decitabine, 5-Aza-CdR), zebularine, 5-Fluoro-2'-deoxycytidine (5-F-CdR), 5,6-Dihydro-5-azacytidine (DHAC)) and non-nucleoside analogue families (Hydralazine, Procainamide, Procaine, EGCG ((-)-epigallocatechin-3-gallate), Psammaplin A, MG98, RG108) (8).
[0012] The term "biological sample" refers to multiple myeloma cells, bone marrow or medullary cell.
[0013] All the genes pertaining to the invention are known per se, and are listed in the below Table A.
TABLE-US-00001 TABLE A Set of predictive genes. Gene β Reference Gene Symbol Gene name Gene ID coefficient level (ELRi) G1 COP1 Caspase-1 dominant- 1552701_a_at 0.669962539 25.72815534 negative inhibitor pseudo- ICE G2 DNAJB9 DnaJ (Hsp40) homolog; 1554462_a_at -0.807267505 87.37864078 subfamily B; member 9 G3 INSIG1 insulin induced gene 1 201625_s_at 0.918185816 10.19417476 G4 SEL1L sel-1 suppressor of lin-12- 202061_s_at -0.683515307 86.40776699 like (C. elegans) G5 FNDC3A fibronectin type III domain 202304_at -0.821182841 76.21359223 containing 3A G6 IFI27 interferon, alpha-inducible 202411_at 0.87241554 60.19417476 protein 27 G7 STCH stress 70 protein 202558_s_at -0.924845543 27.66990291 chaperone; microsome- associated; 60 kDa G8 GALNT3 UDP-N-acetyl-alpha-D- 203397_s_at 0.838104028 30.58252427 galactosamine: polypeptide N- acetylgalactosaminyltransferase 3 (GalNAc-T3) G9 TPST2 tyrosylprotein 204079_at 0.698525183 14.5631068 sulfotransferase 2 G10 KIF21B kinesin family member 204411_at 1.057242019 26.21359223 21B G11 G1P2 Interferon; alpha-inducible 205483_s_at 0.704117799 40.77669903 protein (clone IFI-15K) G12 OAS1 2',5'-oligoadenylate 205552_s_at 0.918506668 12.13592233 synthetase 1 G13 ITGB7 integrin, beta 7 205718_at 1.393658338 11.16504854 G14 SP110 SP110 nuclear body 208012_x_at 0.796781189 13.10679612 protein G15 EIF2S2 eukaryotic translation 208725_at -0.608613084 75.24271845 initiation factor 2, subunit 2 beta G16 CORO1A coronin, actin binding 209083_at 1.116949242 50.48543689 protein, 1A G17 TUBA3 tubulin, alpha 1a 209118_s_at 0.794556227 15.04854369 G18 ADFP Adipose differentiation- 209122_at -0.742527707 73.30097087 related protein G19 IFI35 interferon-induced protein 35 209417_s_at 0.608446212 29.12621359 G20 STAT1 signal transducer and 209969_s_at 0.865200608 20.87378641 activator of transcription 1 G21 HIST1H2BG histone cluster 1, H2bc 210387_at -0.713207906 78.15533981 G22 HLA-DPA1 major histocompatibility 211990_at -0.708484927 79.12621359 complex, class II, DP alpha 1 G23 RECQL RecQ protein-like (DNA 213878_at 0.79702138 19.90291262 helicase Q1-like) G24 CCPG1 cell cycle progression 1 214152_at -0.686867998 48.05825243 G25 NFE2L1 nuclear factor (erythroid- 214179_s_at 0.694584139 12.13592233 derived 2)-like 1 G26 PARP12 poly (ADP-ribose) 218543_s_at 1.257650329 10.19417476 polymerase family, member 12 G27 FKBP11 FK506 binding protein 11; 219118_at -0.88381802 76.69902913 19 kDa G28 EAF2 ELL associated factor 2 219551_at -0.762323817 83.98058252 G29 C6orf48 chromosome 6 open 220755_s_at -0.832289767 23.78640777 reading frame 48 G30 IL21R interleukin 21 receptor 221658_s_at 0.612993436 24.75728155 G31 PGM3 Phosphoglucomutase 3 221788_at -1.227167702 87.86407767 G32 EIF2C2 Eukaryotic translation 222294_s_at -0.657954783 69.90291262 initiation factor 2C; 2 G33 TMEM39A transmembrane protein 222690_s_at 0.787711031 64.5631068 39A G34 SLAMF7 SLAM family member 7 222838_at -0.601257629 64.0776699 G35 MYLIP myosin regulatory light 223129_x_at 0.687458269 22.33009709 chain interacting protein G36 PPAPDC1B phosphatidic acid 223569_at -0.860377506 83.49514563 phosphatase type 2 domain containing 1B G37 ARHGAP9 Rho GTPase activating 224451_x_at -0.731399299 83.98058252 protein 9 /// Rho GTPase activating protein 9 G38 RPL37 ribosomal protein L37 224763_at -1.135732424 88.34951456 G39 GSK3B Glycogen synthase kinase 226183_at -0.772104529 83.98058252 3 beta G40 ELL2 elongation factor; RNA 226982_at -0.687762574 80.09708738 polymerase II; 2 G41 EST, Expression sequence tag, 227755_at -0.79716878 68.93203883 GenBank AA042983 GenBank AA042983 G42 SAMD9 sterile alpha motif domain 228531_at 0.813378182 46.60194175 containing 9 G43 GNG7 guanine nucleotide binding 228831_s_at -0.641328827 80.09708738 protein (G protein); gamma 7 G44 SEC63 SEC63 Homolog 229969_at -1.216057852 85.9223301 (S. cerevisiae) G45 EST, Expression sequence tag, 230570_at -0.659929394 82.52427184 GenBank AI702465 GenBank AI702465 G46 MGC15875 hypothetical protein 232488_at -1.036621429 80.09708738 MGC15875 G47 SFN stratifin 33322_i_at 0.721955343 12.62135922
Methods for Predicting Response
[0014] The present invention relates to a method of testing whether a patient suffering of multiple myeloma will respond or not to a DNA methyltransferase inhibitor (DNMTi) comprising:
[0015] i) determining the expression level (ELi) of several genes G1-Gn selected from table A in a biological sample obtained from said patient
[0016] ii) comparing the expression level (ELi) determined at step i) with a predetermined reference level (ELRi)
[0017] iii) calculating the DMS score trough the following formula
[0017] DMS = i = 1 n β i × Ci ##EQU00002##
wherein βi represent the regression β coefficient reference value for the gene Gi and Ci=1 if the expression of the gene Gi (ELi) is higher than the predetermined reference level (ELRi) or Ci=-1 if the expression of the gene (ELi) is lower than or equal to the predetermined reference level (ELRi)
[0018] iv) comparing the score DMS determined at step with a predetermined reference value DMSR
[0019] v) and concluding that the patient will respond to the DNMTi when the DMS score is higher than the predetermined reference value DMSR or concluding that the patient will not respond to the DNMTi when the DMS score is lower than the predetermined reference value DMSR
[0020] In some embodiments, the levels of at least 25 genes from Table A are determined wherein said genes are:
[0021] 202061_s_at SEL1L
[0022] 202304_at FNDC3A
[0023] 202558_s_at STCH
[0024] 203397_s_at GALNT3
[0025] 204079_at TPST2
[0026] 205483_s_at G1P2
[0027] 205552_s_at OAS1
[0028] 205718_at ITGB7
[0029] 208725_at EIF2S2
[0030] 209083_at CORO1A
[0031] 209118_s_at TUBA3
[0032] 209122_at ADFP
[0033] 209417_s_at IF135
[0034] 211990_at HLA-DPA1
[0035] 214152_at CCPG1
[0036] 214179_s_at NFE2L1
[0037] 219118_at FKBP11
[0038] 221658_s_at IL21R
[0039] 222690_s at TMEM39A
[0040] 223129_x_at MYLIP
[0041] 224451_x_at ARHGAP9
[0042] 224763_at RPL37
[0043] 227755_at EST, GenBank AA042983
[0044] 228831_s_at GNG7
[0045] 232488_at MGC15875
[0046] In some embodiment, the level of 25, 26, 27, 28, 29, 30, 31, 32, 33, 34, 35, 36, 37, 38, 39, 40, 41, 42, 43, 44, 45, 46, or 47 genes from Table A are determined wherein every combinations of genes comprises a minimal set of 25 genes consisting of:
[0047] 202061_s_at SEL1L
[0048] 202304_at FNDC3A
[0049] 202558_s_at STCH
[0050] 203397_s_at GALNT3
[0051] 204079_at TPST2
[0052] 205483_s_at G1P2
[0053] 205552_s_at OAS1
[0054] 205718_at ITGB7
[0055] 208725_at EIF2S2
[0056] 209083_at CORO1A
[0057] 209118_s_at TUBA3
[0058] 209122_at ADFP
[0059] 209417_s_at IF135
[0060] 211990_at HLA-DPA1
[0061] 214152_at CCPG1
[0062] 214179_s_at NFE2L1
[0063] 219118_at FKBP11
[0064] 221658_s_at IL21R
[0065] 222690_s_at TMEM39A
[0066] 223129_x at MYLIP
[0067] 22445 l_x_at ARHGAP9
[0068] 224763_at RPL37
[0069] 227755_at EST, GenBank AA042983
[0070] 228831_s at GNG7
[0071] 232488_at MGC15875
[0072] In some embodiments, the level of the 47 genes of Table A are determined
[0073] Determination of the expression level of the genes can be performed by a variety of techniques. Generally, the expression level as determined is a relative expression level. More preferably, the determination comprises contacting the biological sample with selective reagents such as probes, primers or ligands, and thereby detecting the presence, or measuring the amount, of polypeptide or nucleic acids of interest originally in the biological sample. Contacting may be performed in any suitable device, such as a plate, microtiter dish, test tube, well, glass, column, and so forth. In specific embodiments, the contacting is performed on a substrate coated with the reagent, such as a nucleic acid array or a specific ligand array. The substrate may be a solid or semi-solid substrate such as any suitable support comprising glass, plastic, nylon, paper, metal, polymers and the like. The substrate may be of various forms and sizes, such as a slide, a membrane, a bead, a column, a gel, etc. The contacting may be made under any condition suitable for a detectable complex, such as a nucleic acid hybrid or an antibody-antigen complex, to be formed between the reagent and the nucleic acids or polypeptides of the biological sample.
[0074] In a preferred embodiment, the expression level may be determined by determining the quantity of mRNA.
[0075] Methods for determining the quantity of mRNA are well known in the art. For example the nucleic acid contained in the biological sample is first extracted according to standard methods, for example using lytic enzymes or chemical solutions or extracted by nucleic-acid-binding resins following the manufacturer's instructions. The extracted mRNA is then detected by hybridization (e.g., Northern blot analysis) and/or amplification (e.g., RT-PCR). Preferably quantitative or semi-quantitative RT-PCR is preferred. Real-time quantitative or semi-quantitative RT-PCR is particularly advantageous.
[0076] Other methods of amplification include ligase chain reaction (LCR), transcription-mediated amplification (TMA), strand displacement amplification (SDA) and nucleic acid sequence based amplification (NASBA).
[0077] Nucleic acids having at least 10 nucleotides and exhibiting sequence complementarity or homology to the mRNA of interest herein find utility as hybridization probes or amplification primers. It is understood that such nucleic acids need not be identical, but are typically at least about 80% identical to the homologous region of comparable size, more preferably 85% identical and even more preferably 90-95% identical. In certain embodiments, it will be advantageous to use nucleic acids in combination with appropriate means, such as a detectable label, for detecting hybridization. A wide variety of appropriate indicators are known in the art including, fluorescent, radioactive, enzymatic or other ligands (e.g. avidin/biotin).
[0078] Probes typically comprise single-stranded nucleic acids of between 10 to 1000 nucleotides in length, for instance of between 10 and 800, more preferably of between 15 and 700, typically of between 20 and 500. Primers typically are shorter single-stranded nucleic acids, of between 10 to 25 nucleotides in length, designed to perfectly or almost perfectly match a nucleic acid of interest, to be amplified. The probes and primers are "specific" to the nucleic acids they hybridize to, i.e. they preferably hybridize under high stringency hybridization conditions (corresponding to the highest melting temperature Tm, e.g., 50% formamide, 5× or 6×SCC. SCC is a 0.15 M NaCl, 0.015 M Na-citrate).
[0079] The nucleic acid primers or probes used in the above amplification and detection method may be assembled as a kit. Such a kit includes consensus primers and molecular probes. A preferred kit also includes the components necessary to determine if amplification has occurred. The kit may also include, for example, PCR buffers and enzymes; positive control sequences, reaction control primers; and instructions for amplifying and detecting the specific sequences.
[0080] In a particular embodiment, the methods of the invention comprise the steps of providing total RNAs extracted from a biological samples and subjecting the RNAs to amplification and hybridization to specific probes, more particularly by means of a quantitative or semi-quantitative RT-PCR.
[0081] In another preferred embodiment, the expression level is determined by DNA chip analysis. Such DNA chip or nucleic acid microarray consists of different nucleic acid probes that are chemically attached to a substrate, which can be a microchip, a glass slide or a microsphere-sized bead. A microchip may be constituted of polymers, plastics, resins, polysaccharides, silica or silica-based materials, carbon, metals, inorganic glasses, or nitrocellulose. Probes comprise nucleic acids such as cDNAs or oligonucleotides that may be about 10 to about 60 base pairs. To determine the expression level, a biological sample from a test patient, optionally first subjected to a reverse transcription, is labelled and contacted with the microarray in hybridization conditions, leading to the formation of complexes between target nucleic acids that are complementary to probe sequences attached to the microarray surface. The labelled hybridized complexes are then detected and can be quantified or semi-quantified. Labelling may be achieved by various methods, e.g. by using radioactive or fluorescent labelling. Many variants of the microarray hybridization technology are available to the man skilled in the art (see e.g. the review by Hoheisel, Nature Reviews, Genetics, 2006, 7:200-210)
[0082] In this context, the invention further provides a DNA chip comprising a solid support which carries nucleic acids that are specific to the genes listed in table A.
[0083] Predetermined reference values ELRi or DMSR used for comparison may consist of "cut-off" values.
[0084] For example; each reference ("cut-off") value ELRi for each gene may be determined by carrying out a method comprising the steps of:
[0085] a) providing a collection of samples from patients suffering of multiple myeloma;
[0086] b) determining the expression level of the relevant gene for each sample contained in the collection provided at step a);
[0087] c) ranking the samples according to said expression level
[0088] d) classifying said samples in pairs of subsets of increasing, respectively decreasing, number of members ranked according to their expression level,
[0089] e) providing, for each sample provided at step a), information relating to the actual clinical outcome for the corresponding cancer patient (i.e. the duration of the disease-free survival (DFS) or the overall survival (OS) or both);
[0090] f) for each pair of subsets of tumour tissue samples, obtaining a Kaplan Meier percentage of survival curve;
[0091] g) for each pair of subsets of tumour tissue samples calculating the statistical significance (p value) between both subsets
[0092] h) selecting as reference value ELR for the expression level, the value of expression level for which the p value is the smallest.
[0093] For example the expression level of a gene Gi has been assessed for 100 samples of 100 patients. The 100 samples are ranked according to the expression level of gene Gi. Sample 1 has the highest expression level and sample 100 has the lowest expression level. A first grouping provides two subsets: on one side sample Nr 1 and on the other side the 99 other samples. The next grouping provides on one side samples 1 and 2 and on the other side the 98 remaining samples etc., until the last grouping: on one side samples 1 to 99 and on the other side sample Nr 100. According to the information relating to the actual clinical outcome for the corresponding cancer patient, Kaplan Meier curves are prepared for each of the 99 groups of two subsets. Also for each of the 99 groups, the p value between both subsets was calculated. The reference value ELRi is then selected such as the discrimination based on the criterion of the minimum p value is the strongest. In other terms, the expression level corresponding to the boundary between both subsets for which the p value is minimum is considered as the reference value. It should be noted that according to the experiments made by the inventors, the reference value ELRi is not necessarily the median value of expression levels.
[0094] The man skilled in the art also understands that the same technique of assessment of the DMSR could be used for obtaining the reference value and thereafter for assessment of the response to DNMTi. However in one embodiment, the reference value DMSR is the median value of DMS.
[0095] In one embodiment, the reference value ELRi for the genes are described in table A (right column).
[0096] In one embodiment, the reference value DMSR is -19.7 for determining whether a patient suffering of multiple myeloma will respond to a DNMTi or -15.3 for predicting the survival time of patient suffering of multiple myeloma.
[0097] The regression β coefficient reference values may be easily determined by the skilled man in the art for each gene using a Cox model. The Cox model is based on a modeling approach to the analysis of survival data. The purpose of the model is to simultaneously explore the effects of several variables on survival. The Cox model is a well-recognised statistical technique for analysing survival data. When it is used to analyse the survival of patients in a clinical trial, the model allows us to isolate the effects of treatment from the effects of other variables. The logrank test cannot be used to explore (and adjust for) the effects of several variables, such as age and disease duration, known to affect survival. Adjustment for variables that are known to affect survival may improve the precision with which we can estimate the treatment effect. The regression method introduced by Cox is used to investigate several variables at a time. It is also known as proportional hazards regression analysis. Briefly, the procedure models or regresses the survival times (or more specifically, the so-called hazard function) on the explanatory variables. The hazard function is the probability that an individual will experience an event (for example, death) within a small time interval, given that the individual has survived up to the beginning of the interval. It can therefore be interpreted as the risk of dying at time t. The quantity h0 (t) is the baseline or underlying hazard function and corresponds to the probability of dying (or reaching an event) when all the explanatory variables are zero. The baseline hazard function is analogous to the intercept in ordinary regression (since exp0=1). The regression coefficient β gives the proportional change that can be expected in the hazard, related to changes in the explanatory variables. The coefficient β is estimated by a statistical method called maximum likelihood. In survival analysis, the hazard ratio (HR) (Hazard Ratio=exp(β)) is the ratio of the hazard rates corresponding to the conditions described by two sets of explanatory variables. For example, in a drug study, the treated population may die at twice the rate per unit time as the control population. The hazard ratio would be 2, indicating higher hazard of death from the treatment.
[0098] In one embodiment, the regression β coefficient reference values are described in table A.
[0099] The invention also relates to a kit for performing the methods as above described, wherein said kit comprises means for measuring the expression level of the genes listed in Table A. Typically the kit may include a primer, a set of primers, a probe, a set of probes as above described. In a particular embodiment, the probe or set of probes are labelled as above described. The kit may also contain other suitably packaged reagents and materials needed for the particular detection protocol, including solid-phase matrices, if applicable, and standards.
[0100] In a particular embodiment, the score may be generated by a computer program.
Methods of Treatment
[0101] The method of the invention allows to define a subgroup of patients who will be responsive ("responder") or not ("non responder") to the treatment with a DNA methyltransferase inhibitor.
[0102] A further object of the invention relates to a method for the treatment of multiple myeloma in a patient in need thereof
[0103] In the context of the invention, the term "treating" or "treatment", as used herein, means reversing, alleviating, inhibiting the progress of, or preventing the disorder or condition to which such term applies, or one or more symptoms of such disorder or condition.
[0104] In a particular embodiment, the method comprises the following steps
[0105] a) testing whether the patient will respond or not to a DNA methyltransferase inhibitor (DNMTi) by performing the method according to the invention
[0106] b) administering the DNA methyltransferase inhibitor, if said patient has as score higher than the reference value DMSR (i.e. the patient will respond to the DNA methyltransferase inhibitor).
[0107] A further object of the invention relates to a DNA methyltransferase inhibitor for use in the treatment of multiple myeloma in a patient in need thereof, wherein the patient was being classified as responder by the method as above described.
[0108] The invention will be further illustrated by the following figures and examples. However, these examples and figures should not be interpreted in any way as limiting the scope of the present invention.
FIGURES
[0109] FIG. 1: DNA methylation Score in normal and malignant plasma cells
[0110] (A) DNA methylation Score in normal bone marrow plasma cells (N=7), in premalignant plasma cells of patients with monoclonal gammopathy of undetermined significance (MGUS, N=5), in multiple myeloma cells of patients with intramedullary MM (N=206) and in human myeloma cell lines (N=40). ** Indicate that the score value is significantly different with a P value <0.01. (B) DNA methylation Score in the 8 groups of the molecular classification of multiple myeloma. The DM Score was investigated in the 8 groups of the molecular classification of multiple myeloma in UAMS-TT2 cohort of patients. PR: proliferation, LB: low bone disease, MS: MMSET, HY: hyperdiploid, CD1: Cyclin D1, CD2: Cyclin D2, MF: MAF, MY: myeloid. * Indicate that the score value is significantly higher in the group compared to all the patients of the cohort (P<0.05). ** Indicate that the score value is significantly lower in the group compared to all the patients of the cohort (P<0.05).
[0111] FIG. 2: Prognostic value of DM Score in multiple myeloma.
[0112] Patients of HM cohort were ranked according to increased DM Score and a maximum difference in OS was obtained with DM Score=-15.3 splitting patients in a high risk (34.5%) and low risk (65.5%) groups. The prognostic value of DM Score was tested on an independent cohort of 345 patients from UAMS treated with TT2 therapy (UAMS- TT2 cohort). The parameters to compute the DM Score of patients of UAMS-TT2 cohort and the DM Score cut-off delineating the 2 prognostic groups were those defined with HM cohort.
[0113] FIG. 3: DM Score predicts for sensitivity of human myeloma cell lines to decitabine.
[0114] (A) HMCLs with high DM Score (N=5) exhibit significant higher DNMTi sensitivity compared to HMCLs with low DM Score (N=5). HMCLs were cultured for 4 days in 96-well flat-bottom microtiter plates in RPMI 1640 medium, 10% FCS, 2 ng/ml IL-6 culture medium (control), with graded decitabine concentrations. Data are mean values plus or minus standard deviation (SD) of 5 experiments determined on sextuplet culture wells.
[0115] FIG. 4: DM Score predicts for decitabine sensitivity of primary myeloma cells of patients.
[0116] Mononuclear cells from tumor samples of 12 patients with MM were cultured for 4 days in the presence of IL-6 (2 ng/ml) with or without graded decitabine concentrations. At day 4 of culture, the cell count and the viability were determined and the percentage of CD138.sup.+ viable plasma cells was determined by flow cytometry. Black color represents patients with high DM Score (N=6) and white represents patients with low DM Score values (N=6).
[0117] FIG. 5: DM Score predicts for sensitivity of human myeloma cell lines to 5-azacitidine.
[0118] HMCLs with a high DM Score (n=6) exhibit significant higher 5-azacitidine sensitivity compared to HMCLs with a low DM Score (n=6). HMCLs were cultured for 4 days in 96-well flat-bottom microtiter plates in RPMI 1640 medium, 10% FCS, 2 ng/ml IL-6 culture medium (control), and graded 5-azacitidine concentrations. Data are mean values plus or minus standard deviation (SD) of 5 experiments determined on sextuplet culture wells.
[0119] FIG. 6: DM Score predicts for sensitivity of primary myeloma cells of patients to 5-azacitidine.
[0120] Mononuclear cells from tumor samples of 14 patients with MM were cultured for 4 days in the presence of IL-6 (2 ng/ml) with or without graded 5-azacitidine concentrations. At day 4 of culture, the count of viable CD138' MMCs was determined using flow cytometry. The black columns represent the mean±SD of primary myeloma cell counts (expressed as the percentage of the count without adding 5-azcytidine) of the 7 patients with a low DM Score and the white columns that of the 7 patients with a high DM Score.
EXAMPLE 1
Development of Gene Expression Based Score to Predict Sensitivity of Multiple Myeloma Cells to DNA Methylation Inhibitors
[0121] Material & Methods
[0122] Human Myeloma Cell Lines (HMCLs)
[0123] XG-1, XG-2, XG-3, XG-4, XG-5, XG-6, XG-7, XG-10, XG-11, XG-12, XG-13, XG-14, XG-16, XG-19, XG-20 and XG-21 human myeloma cell lines were obtained as previously described (22-26). JJN3 was kindly provided by Dr Van Riet (Bruxelles, Belgium), JIM3 by Dr MacLennan (Birmingham, UK) and MM1S by Dr S. Rosen (Chicago, USA). AMO-1, LP1, L363, U266, OPM2, and SKMM2 were from DSMZ (Germany) and RPMI8226 from ATTC (USA). All HMCLs derived in inventor's laboratory were cultured in the presence of recombinant IL-6. HMCLs microarray data have been deposited in the ArrayExpress public database under accession numbers E-TABM-937 and E-TABM-1088.
[0124] Primary Multiple Myeloma Cells
[0125] MMCs were purified from 206 patients with newly-diagnosed MM after written informed consent was given at the University hospitals of Heidelberg (Germany) or Montpellier (France) and agreement of the Center for Biological Resources of Montpellier University Hospital (N° DC-2008-417). The study was approved by the ethics boards of Heidelberg and Montpellier Universities. These 206 patients were treated with high dose Melphalan (HDM) and autologous stem cell transplantation (ASCT) (27) and were termed in the following Heidelberg-Montpellier (HM) series (Supplementary Table S1). The CEL files and MASS files have been deposited in the ArrayExpress public database (E-MTAB-372). The structural chromosomal aberrations including t(4;14)(p16.3;q32.3) and t(11;14)(q13;q32.3), as well as numerical aberrations including 17p13 and 1q21 gain, were assayed by fluorescence in situ hybridization (iFISH) (28). The inventors also used Affymetrix data of a cohort of 345 purified MMC from previously untreated patients from the University of Arkansas for Medical Sciences (UAMS, Little Rock, Ark.). The patients were treated with total therapy 2 including HDM and ASCT (29) and termed in the following UAMS-TT2 series. These data are publicly available via the online Gene Expression Omnibus (Gene Expression Profile of Multiple Myeloma, accession number GSE2658. http://www.ncbi.nlm nih.gov/geo/). As iFISH data were not available for UAMS-TT2 patients, t(4;14) translocation was evaluated using MMSET spike expression (30) and dell7p13 surrogated by TP53 probe set signal (31). After Ficoll-density gradient centrifugation, plasma cells were purified using anti-CD138 MACS microbeads (Miltenyi Biotech, Bergisch Gladbach, Germany).
[0126] Cell Culture and Treatment for Gene Expression Profiling
[0127] The human MM cell lines XG-5, XG-6, XG-7, XG-20 and LP1 were grown in RPMI 1640 supplemented with 10% fetal bovine serum and 2 ng/ml recombinant IL-6. Cells (2×10⁵/mL) were treated either with 0.5 μmol/L 5-Aza-2'-deoxycytidine (decitabine) (Sigma, St. Louis, Mo.) for 7 days. Control cells were cultured in the same conditions without adding drug.
[0128] Growth Assay for Myeloma Cells
[0129] HMCLs were cultured for 4 days in 96-well flat-bottom microtiter plates in RPMI 1640 medium, 10% FCS, 2 ng/ml IL-6 culture medium (control), with graded decitabine concentrations. Cell growth was evaluated by quantifying intracellular ATP amount with a Cell Titer Glo Luminescent Assay (Promega, Madison, Wis.) with a Centro LB 960 luminometer (Berthold Technologies, Bad Wildbad, Germany).
[0130] Mononuclear Cell Culture
[0131] Mononuclear cells from tumor samples of 12 patients with MM (agreement of the Center for Biological Resources of Montpellier University Hospital (N° DC-2008-417)) were cultured for 4 days at 2×10⁵ cells/ml in RPMI 1640 medium, 10% FCS, 2 ng/ml IL-6, with or without graded concentrations of decitabine. In each culture group, viability and cell counts were assayed and MMCs were stained with an anti-CD138-PE mAb (Immunotech, Marseille, France) as previously described (32).
[0132] Preparation of Complementary RNA (cRNA) and Microarray Hybridization
[0133] RNA was extracted using the RNeasy Kit (Qiagen, Hilden, Germany) as previously described (33,34). Biotinylated cRNA was amplified with a double in vitro transcription and hybridized to the human U133 2.0 plus GeneChips, according to the manufacturer's instructions (Affymetrix, Santa Clara, Calif.). Fluorescence intensities were quantified and analyzed using the GECOS software (Affymetrix).
[0134] Gene Expression Profiling and Statistical Analyses
[0135] Gene expression data were normalized with the MASS algorithm and analyzed with inventor's bioinformatics platforms--RAGE (http://rage.montp.inserm.fr/) (35) and Amazonia (http://amazonia.montp.inserm.fr/) (36)--or SAM (Significance Analysis of Microarrays) software (37). The statistical significance of differences in overall survival between groups of patients was calculated by the log-rank test. Multivariate analysis was performed using the Cox proportional hazards model. Survival curves were plotted using the Kaplan-Meier method. All these analyses have been done with R.2.10.1 (http://www.r-project.org/) and bioconductor version 2.5. Gene annotation and networks were generated through the use of Ingenuity Pathways Analysis (Ingenuity® Systems, Redwood City, Calif.) (38).
[0136] Results
[0137] Modulation of Gene Expression by Decitabine in HMCLs: Identification of Prognostic Genes
[0138] Five HMCLs were treated with 0.5 μM of decitabine for 7 days, a concentration which did not affect myeloma cell viability (Supplementary Table S2) (19). Using SAM supervised paired analysis, the expression of 48 genes was found to be significantly upregulated and that of 79 genes downregulated by decitabine treatment of 5 HMCLs (FDR <5%; Supplementary Table S3 and S4). Decitabine-regulated genes are significantly enriched in genes related to "Cancer" and "Cell death" pathways (FDR <5%; Ingenuity pathway analysis. Investigating the expression of these 127 decitabine-regulated genes in primary MMCs of a cohort of 206 newly-diagnosed patients (HM cohort), 22 genes had bad prognostic value and 25 a good one after Benjamini-Hochberg multiple testing correction (Supplementary Table S5). The prognostic information of decitabine regulated genes was gathered within an DNA methylation score (DM Score), which was the sum of the beta coefficients of the Cox model weighted by ±1 according to the patient MMC signal above or below the probe set maxstat value as previously described (38). The value of DM Score in normal, premalignant or malignant plasma cells is displayed in FIG. 1A. There is no significant difference of DM Score between cells from MGUS patients and normal BMPCs. MMCs of patients had a significantly higher DM Score than normal BMPCs or plasma cells from MGUS-patients (P<0.01), and HMCLs the highest score (P<0.001) (FIG. 1A). Investigating the DM Score in the 8 groups of the molecular classification of multiple myeloma (39), DM Score is significantly higher in the proliferation, t(4;14) and MAF subgroups (P<0.001) associated with a poor prognosis (39) and significantly lower in the low bone disease subgroup (P<0.001) (39) (FIG. 1B).
[0139] Prognostic value of DM score compared to usual prognostic factors
[0140] DM Score had prognostic value when used as a continuous variable (P≦10-4), or by splitting patients into two groups using Maxstat R function (38). A maximum difference in overall survival (OS) was obtained with DM Score=-15.3 splitting patients in a high-risk group of 34.5% patients (DM Score>-15.3) with a 42.1 months median OS and a low risk group of 65.5% patients (DM Score<-15.3) with not reached median survival (FIG. 2).
[0141] Using univariate Cox analysis, DM Score, UAMS-HRS, IFM-score and GPI had prognostic value as well as t(4;14), del17p, β2m, albumin and ISS using the HM patient cohort (Supplementary Table S6). When compared two by two, DM Score tested with ↑2m remained significant. When these parameters were tested together, DM Score, β2m and t(4;14) kept prognostic value. The DM Score is also prognostic in an independent cohort of 345 patients from UAMS treated with TT2 therapy (UAMS-TT2 cohort). For each patient of UAMS-TT2 cohort, DM Score was computed using parameters defined with HM patients' cohort. The median OS of patients within high score group (DM Score>-15.3) was 53.7 months and not reached for patients with low DM Score (P=0.0001) (FIG. 2). Using Cox univariate analysis, UAMS-HRS, IFM and GPI scores as well as t(4;14) and del17p had prognostic value. Comparing these prognostic factors two by two, DM Score remained significant compared to GPI, t(4;14), and dell7p in the UAMS-TT2 cohort (Supplementary Table S5). When these parameters were tested together, UAMS-HRS, t(4;14) and del17p kept prognostic value in UAMS-TT2 cohort.
[0142] DM Score is Predictive for Sensitivity of Human Myeloma Cell Lines or Patients' Primary MMCs to Decitabine In Vitro.
[0143] The inventors sought to determine whether DM Score could predict for the sensitivity of 10 HMCLs to DNMT inhibitor. Starting from a large cohort of 40 HMCLs (22), the 10 HMCLs with the highest or lowest DM Score were selected to assay decitabine sensitivity.
[0144] The 5 HMCLs with the highest DM Score exhibited a significant 11-fold higher decitabine sensitivity (median IC50=0.68 μM; range: 0.15 to 2.22 μM) than the 5 HMCLs with low DM Score (P=0.01; median IC50=7.94 μM; range: 2.92 to 60.81 μM) (FIG. 3). All HMCLs with the lowest DM Score and poorly sensitive to decitabine presented no ras mutations whereas 4 out of 5 HMCLs with the highest DM Score and higher decitabine sensitivity have ras mutations (Table 1).
[0145] Primary MMCs were cultured with their BM environment and recombinant IL-6 and graded concentrations of decitabine for 4 days. Primary MMCs of patients with a DM Score above median value (-19.7, FIG. 1) exhibited significant (P<0.01) 2.2-fold higher decitabine sensitivity than MMCs with DM Score below median (FIG. 4 and Table 2). The characteristics of patients with MM included in this study are described in Table 3.
[0146] Discussion
[0147] In this study, the inventors have identified a gene expression-based DNA methylation score (DM Score) which is predictive for patients' survival and for the in vitro sensitivity of human myeloma cell lines or patients' primary myeloma cells to a DNMT inhibitor, decitabine. Clinical trials in multiple myeloma combining these demethylating agents with chemotherapy or other agents are underway (8). The current identification of DM Score should be very useful to investigate whether the higher response to DNMTi is found in patients with highest DM Score and to speed up the investigation of the clinical efficacy of the novel agents.
[0148] Besides the potential utility of the current DM Score in selecting patients who could benefit from DNMTi therapies, the current study highlights pathways which could be involved in the emergence of multiple myeloma cells. Among the genes downregulated by decitabine treatment and associated with a poor prognosis, the inventors identified RECQ1 (ATP-dependent DNA helicase Q1) and KIF21B (kinesin family member 21B). RECQ helicase are a ubiquitous family of DNA unwinding enzymes involved in the maintenance of chromosome stability (40-42). Mutations in the genes of RECQ family members are linked with genetic disorders associated with genomic instability, cancer predisposition and features of premature ageing. Consistent with their ability to unwind DNA, several functions have been attributed to RECQ proteins, including roles in stabilization and repair of damaged DNA replication forks, telomere maintenance, homologous recombination, and DNA damage checkpoint signaling (40-42). Recent reports supported a cancer specific role for RECQ1 (43-45). RECQ1 silencing in cancer cells resulted in mitotic catastrophe and administration of siRNA targeting RECQ1 prevented tumor growth in murine models (43-45). More recently, it was demonstrated that RECQ1 is highly expressed in various types of solid tumors including colon carcinoma, thyroid cancer, lung cancer and brain glioblastoma tissues (46) In glioblastoma cell lines, depletion of RECQ1 by RNAi results in a significant reduction of cellular proliferation, perturbation of S-phase progression, spontaneous γ-H2AX foci formation and hypersensitivity to hydroxyurea and temozolomide treatments (46). KIF21B is a kinesin family member. Kinesins are a conserved class of microtubule-dependent molecular motor proteins that have adenosine triphosphatase activity and motion characteristics (47). Kinesins support several cellular functions, such as mitosis, meiosis and the transport of macromolecules. In mitosis of eukaryotic cells, kinesins participate in spindle formation, chromosome congression and alignment, and cytokinesis (48). Abnormal expression and function of kinesins are involved in the development or progression of several kinds of human cancers (49,50). Interestingly, KIF21B maps to chromosome 1q arm (1q32.1) whose amplification characterizes a significant fraction of high-risk MM tumors (51). More recently, KIF21B gene was found in a critical neighbor-gene model associated with a poor prognosis across independent data sets of respectively, 559, 247 and 264 myeloma patients (52). These data suggest that decitabine treatment could synergize with DNA-damaging agents, in MM, targeting genes involved in DNA-repair and maintenance of chromosome stability. These results demonstrated that the study of MMCs response to epigenetic-targeted treatments will extend our knowledge of MM development and progression and will lead to potential therapeutic advances. Epigenetic therapies could be combined with conventional therapies to develop personalized treatments in MM, render resistant tumors responsive to treatment.
TABLE-US-00002 TABLE 1 Characteristics of HMCLs5-aza sensitive and HMCLs5-aza resistant IL-6 Patient t(14q32 or HMCL HMCL Name dependence1 Origin2 Disease3 sample4 Gender Isotype 22q11) Target genes Ras TP53 CD45 classification 5-aza Resistant HMCLs XG6 ++ MN MM PB F Gl t(16; 22) c-Maf wt wt + CTA/MF XG20 ++ MN PCL PB M I t(4; 14) MMSET wt abn - MS XG13 ++ MN PCL PB M Gl t(14; 16) c-Maf wt abn + MF SKMM2 - CO PCL PB M Gk t(11; 14) CCND1 wt abn - CD-1 LP1 - CO MM PB F Gl t(4; 14) MMSET/FGFR3 wt abn - MS 5-aza Sensitive HMCLs XG12 ++ MN PCL PB F I t(14; 16) c-Maf mut wt + CTA/MF XG16 ++ MN PCL PB M k none none mut abn + CTA/FRZB XG19 ++ MN PCL PB F Al t(14; 16) c-Maf wt wt + CTA/MF JJN3 - CO MM PE F Ak t(14; 16) c-Maf mut abn +/- MF RPMI8226 - CO MM PB M Gl t(14; 16) c-Maf mut abn - MF 1++ if growth is strictly dependent on adding exogenous IL-6, + if dependent on adding exogenous IL-6, - if not; 2Origin of the HMCL, MN Montpellier or Nantes, CO collected; 3Disease at diagnosis: MM multiple myeloma, PCL plasma cell leukemia, PCT plasmacytoma; 4Origin of the sample: AF ascitic fluid, BM bone marrow, PE pleural effusion, PB peripheral blood.
TABLE-US-00003 TABLE 2 Mononuclear cells from tumor samples of 12 patients with MM were cultured for 4 days in the presence of IL-6 (2 ng/mL) with or without increased doses of decitabine. At day 4 of culture, the cell count and viability were determined and the percentage of CD138.sup.+ viable plasma cells was determined by flow cytometry. Myeloma cell number/culture well Patient 0.125 μM 0.5 μM 2 μM 8 μM no. Control decitabine decitabine decitabine decitabine Pa- 1 72168 43320 36738 20592 5800 tients 2 78182 49096 31086 22880 11600 with 3 60140 40432 28260 18304 10150 high 4 108252 63536 56520 29744 18850 DM 5 117273 69312 42390 32032 17400 Score 6 96224 60648 36738 20592 13050 Mean 88707 54391 38622 24024 12808 Pa- 1 24880 26100 27195 21028 18265 tients 2 57133 51984 45216 32032 21750 with 3 132308 77976 53694 22880 14500 low 4 53664 54336 51300 51230 53486 DM 5 1068 1066 870 1044 1039 Score 6 23716 51024 54726 55818 47440 Mean 48795 43748 38834 30672 26080
TABLE-US-00004 TABLE 3 Characteristics of patients with a DM Score above (N = 6) and under (N = 6) the median value. Durie and Multiple myeloma Monoclonal Salmon ISS Serum β2- molecular Age Sex protein stage stage microglobulin classification Patients with high DM Score Patient 1 59 F IgA Lambda IIIA III 6, 7 MF Patient 2 48 M Lambda NA NA NA CD1 Patient 3 63 M BJ Lambda NA NA NA PR Patient 4 69 M IgG Lambda IIIA III 10.4 PR Patient 5 70 F IgA Lambda IIIA II 5 CD2 Patient 6 63 F Asecret III III 13.5 CD1 Patients with low DM Score Patient 1 72 M IgG Lambda IIIA III 8.6 PR Patient 2 54 M IgA Lambda IIIA I 2.3 CD2 Patient 3 62 M IgA Kappa IIA I 2.6 HY Patient 4 55 M BJ Kappa IIIB III 10 HY Patient 5 69 F IgG Kappa IIIA I 2.8 CD2 Patient 6 61 M BJ Kappa IIIA II 4.6 HY
TABLE-US-00005 SUPPLEMENTARY TABLE S1 Clinical patient data for age, serum-β2-microglobulin, and plasma cell infiltration in the Heidelberg/Montpellier-group (HM) and the Arkansas cohort. Median value and range are given. HM cohort Arkansas cohort Characteristic (n = 206) (n = 345) Age 58.5 [27-73] 57 [25-77] Monoclonal protein IgG 120 193 IgA 46 93 Bence Jones 35 47 Asecretory 4 6 IgD 1 3 NA 0 3 Myeloma in Durie and Salmon stage I 22 NA II 31 NA III 153 NA Myeloma in ISS stage I 97 189 II 73 86 III 33 70 NA 3 0 Serum-β2-microglobulin 2.99 [1.3-53.6] 2.9 [1.0-38.7] Plasma cells in bone marrow 42 [1-100] 42 [4-98] NA, not available. ISS, International Staging System.
TABLE-US-00006 SUPPLEMENTARY TABLE S2 Cell viability of HMCLs treated with either 0.5 μM decitabine for 7 days. Date are the mean percentages ± SD of viable cells evaluated by trypan blue exclusion (3 experiments). Cell viability (%) Day 3 Day 7 HMCLS Day 0 Control 5-aza Control 5-aza XG-5 70 ± 2 70 ± 1 65 ± 5 83 ± 5 69 ± 6 XG-6 90 ± 2 90 ± 2 90 ± 1 93 ± 5 90 ± 1 XG-7 100 ± 0 90 ± 2 90 ± 2 93 ± 5 85 ± 5 XG-20 100 ± 0 91 ± 3 91 ± 3 95 ± 5 83 ± 5 LP1 100 ± 0 91 ± 2 91 ± 2 95 ± 5 86 ± 4
TABLE-US-00007 SUPPLEMENTARY TABLE S3 Genes overexpressed in decitabine treated HMCLs. Five HMCLs were cultured with or without 0.5 μM decitabine for 7 days and gene expression was profiled with Affymetrix U133 plus 2.0. Genes significantly differentially expressed between control and decitabine treated cells were identified using SAM supervised paired analysis with a 5% false discovery rate. When a gene was interrogated by several probe sets, we used the probe set yielding to a maximum variance across control and decitabine treated cells. Probeset Gene Ratio Banding Affymetrix description Intercellular communication and membrane proteins 209122_at ADFP 3.70 9p22.1 adipose differentiation-related protein 211990_at HLA-DPA1 1.70 6p21.3 major histocompatibility complex; class II; DP alpha 1 205718_at ITGB7 2.11 12q13.13 integrin; beta 7 1569003_at TMEM49 2.33 17q23.2 transmembrane protein 49 205483_s_at G1P2 2.77 1p36.33 interferon; alpha-inducible protein (clone IFI- 15K) 200696_s_at GSN 3.97 9q33 gelsolin (amyloidosis; Finnish type) Signal transduction 203964_at NMI 1.86 2p24.3-q21.3 N-myc (and STAT) interactor 205552_s_at OAS1 1.65 12q24.1 2prime;5prime-oligoadenylate synthetase 1; 40/46 kDa 209969_s_at STAT1 2.55 2q32.2 signal transducer and activator of transcription 1; 91 kDa 202693_s_at STK17A 2.52 7p12-p14 serine/threonine kinase 17a (apoptosis- inducing) Cytoskeleton 223129_x_at MYLIP 2.00 6p23-p22.3 myosin regulatory light chain interacting protein 209083_at CORO1A 2.38 16p11.2 coronin; actin binding protein; 1A 216323_x_at H2-ALPHA 2.56 2q21.1 alpha-tubulin isotype H2-alpha 210527_x_at TUBA2 2.50 13q11 tubulin; alpha 2 209118_s_at TUBA3 2.23 12q12-12q14.3 tubulin; alpha 3 204141_at TUBB2 5.07 6p25 tubulin; beta 2 Cancer testis antigens 235700_at CT45-2 30.39 Xq26.3 cancer/testis antigen CT45-2 210437_at MAGEA9 1.68 Xq28 melanoma antigen family A; 9 207847_s_at MUC1 2.92 1q21 mucin 1; transmembrane Protein binding 202411_at IFI27 2.84 14q32 interferon; alpha-inducible protein 27 224917_at MIRN21 1.99 -- microRNA 21 202814_s_at HEXIM1 2.18 17q21.31 hexamethylene bis-acetamide inducible 1 211071_s_at MLLT11 2.53 1q21 myeloid/lymphoid or mixed-lineage leukemia (trithorax homolog; Drosophila); translocated to 11 33322_i_at SFN 4.34 1p36.11 stratifin Metabolism 207761_s_at DKFZP586A0522 2.97 12q13.12 DKFZP586A0522 protein/METTL7A methyltransferase like 7A 201468_s_at NQO1 2.15 16q22.1 NAD(P)H dehydrogenase; quinone 1 218543_s_at PARP12 1.92 7q34 poly (ADP-ribose) polymerase family; member 12 214183_s_at TKTL1 85.24 Xq28 transketolase-like 1 204079_at TPST2 2.20 22q12.1 tyrosylprotein sulfotransferase 2 201243_s_at ATP1B1 3.43 1q24 ATPase; Na+/K+ transporting; beta 1 polypeptide 210580_x_at SULT1A3 2.52 16p11.2 sulfotransferase family; cytosolic; 1A; phenol- preferring; member 3 Nuclear proteins and transcription factors 238825_at ACRC 25.99 Xq13.1 acidic repeat containing 31845_at ELF4 1.75 Xq26 E74-like factor 4 (ets domain transcription factor) 208012_x_at SP110 2.11 2q37.1 SP110 nuclear body protein 210387_at HIST1H2BG 2.00 6p21.3 histone 1; H2bg 201565_s_at ID2 2.76 2p25 inhibitor of DNA binding 2; dominant negative helix-loop-helix protein 223484_at NMES1 23.96 15q21.1 normal mucosa of esophagus specific 1 Apoptosis 1552701_a_at COP1 2.34 -- caspase-1 dominant-negative inhibitor pseudo- ICE 209417_s_at IFI35 1.93 17q21 interferon-induced protein 35 202086_at MX1 1.73 21q22.3 myxovirus (influenza virus) resistance 1; interferon-inducible protein p78 (mouse) 219099_at C12orf5 2.16 12p13.3 chromosome 12 open reading frame 5 201631_s_at IER3 3.97 6p21.3 immediate early response 3 Others 227609_at EPSTI1 1.99 13q13.3 epithelial stromal interaction 1 (breast) 217755_at HN1 2.17 17q25.1 hematological and neurological expressed 1 215343_at KIAA1509 2.21 14q32.12 KIAA1509 228531_at SAMD9 2.06 7q21.2 sterile alpha motif domain containing 9 230000_at C17orf27 2.41 17q25.3 chromosome 17 open reading frame 27 235964_x_at C20orf118 2.12 20 Chromosome 20 open reading frame 118
TABLE-US-00008 SUPPLEMENTARY TABLE S4 Genes underexpressed in decitabine treated HMCLs. Five HMCLs were cultured with or without 0.5 μM decitabine for 7 days and gene expression was profiled with Affymetrix U133 plus 2.0. Genes significantly differentially expressed between control and decitabine treated cells were identified using SAM supervised paired analysis with a 5% false discovery rate. When a gene was interrogated by several probe sets, we used the probe set yielding to a maximum variance across control and decitabine treated cells. Probeset Gene Ratio Banding Affymetrix description Intercellular communication and membrane proteins 202304_at FNDC3A 0.40 13q14.2 fibronectin type III domain containing 3A 209541_at IGF1 0.43 12q22-q23 insulin-like growth factor 1 (somatomedin C) 221658_s_at IL21R 0.50 16p11 interleukin 21 receptor 210587_at INHBE 0.55 12q13.3 inhibin; beta E 219702_at PLAC1 0.42 Xq26 placenta-specific 1 209606_at PSCDBP 0.48 2q11.2 pleckstrin homology; Sec7 and coiled-coil domains; binding protein 202375_at SEC24D 0.31 4q26 SEC24 related gene family; member D (S. cerevisiae) 222838_at SLAMF7 0.51 1q23.1- SLAM family member 7 q24.1 222690_s_at TMEM39A 0.46 3q13.33 transmembrane protein 39A Signal transduction 224451_x_at ARHGAP9 0.38 12q14 Rho GTPase activating protein 9 /// Rho GTPase activating protein 9 212954_at DYRK4 0.42 12p13.32 dual-specificity tyrosine-(Y)- phosphorylation regulated kinase 4 228831_s_at GNG7 0.33 19p13.3 guanine nucleotide binding protein (G protein); gamma 7 209314_s_at HBS1L 0.53 6q23-q24 HBS1-like (S. cerevisiae) 219188_s_at LRP16 0.36 11q11 LRP16 protein 229549_at OPN1SW 0.40 7q31.3-q32 Opsin 1 (cone pigments); short-wave- sensitive (color blindness; tritan) Cytoskeleton 213500_at COPB2 0.58 3q23 Coatomer protein complex; subunit beta 2 (beta prime) 204411_at KIF21B 0.53 1pter-q31.3 kinesin family member 21B 226438_at SNTB1 0.36 8q23-q24 Syntrophin; beta 1 (dystrophin-associated protein A1; 59 kDa; basic component 1) 226181_at TUBE1 0.38 6q21 tubulin; epsilon 1 Cell cycle 214152_at CCPG1 0.44 15q21.1 cell cycle progression 1 223569_at PPAPDC1B 0.42 8p12 phosphatidic acid phosphatase type 2 domain containing 1B 223195_s_at SESN2 0.47 1p35.3 sestrin 2 Metabolism 231202_at ALDH1L2 0.45 12q23.3 aldehyde dehydrogenase 1 family; member L2 219572_at CADPS2 0.37 -- Ca2+-dependent activator protein for secretion 2 212816_s_at CBS 0.41 21q22.3 cystathionine-beta-synthase 218923_at CTBS 0.42 1p22 chitobiase; di-N-acetyl- 201791_s_at DHCR7 0.45 11q13.2- 7-dehydrocholesterol reductase q13.5 204646_at DPYD 0.48 1p22 dihydropyrimidine dehydrogenase 203397_s_at GALNT3 0.65 2q24-q31 UDP-N-acetyl-alpha-D- galactosamine: polypeptide N- acetylgalactosaminyltransferase 3 (GalNAc-T3) 203157_s_at GLS 0.42 2q32-q34 glutaminase 226183_at GSK3B 0.49 3q13.3 Glycogen synthase kinase 3 beta 1555037_a_at IDH1 0.53 2q33.3 isocitrate dehydrogenase 1 (NADP+); soluble 201625_s_at INSIG1 0.34 7q36 insulin induced gene 1 221760_at MAN1A1 0.43 6q22 Mannosidase; alpha; class 1A; member 1 222805_at MANEA 0.51 6q16.1 mannosidase; endo-alpha 232488_at MGC15875 0.55 5q35.3 hypothetical protein MGC15875 225520_at MTHFD1L 0.41 6q25.1 methylenetetrahydrofolate dehydrogenase (NADP+ dependent) 1-like 202847_at PCK2 0.47 14q11.2 phosphoenolpyruvate carboxykinase 2 (mitochondrial) 221788_at PGM3 0.49 6q14.1-q15 Phosphoglucomutase 3 201397_at PHGDH 0.36 1p12 phosphoglycerate dehydrogenase 205194_at PSPH 0.38 7p15.2- phosphoserine phosphatase p15.1 200831_s_at SCD 0.39 10q23-q24 stearoyl-CoA desaturase (delta-9- desaturase) 209610_s_at SLC1A4 0.54 2p15-p13 solute carrier family 1 (glutamate/neutral amino acid transporter); member 4 208916_at SLC1A5 0.40 19q13.3 solute carrier family 1 (neutral amino acid transporter); member 5 209921_at SLC7A11 0.41 4q28-q32 solute carrier family 7; (cationic amino acid transporter; y+ system) member 11 Protein binding 215930_s_at CTAGE5 0.30 14q13.3 CTAGE family; member 5 1554462_a_at DNAJB9 0.42 7q31|14q24.2- DnaJ (Hsp40) homolog; subfamily B; q24.3 member 9 222294_s_at EIF2C2 0.52 8q24 Eukaryotic translation initiation factor 2C; 2 235745_at ERN1 0.35 17q24.2 endoplasmic reticulum to nucleus signalling 1 219118_at FKBP11 0.38 12q13.12 FK506 binding protein 11; 19 kDa 218361_at GOLPH3L 0.45 1q21.2 golgi phosphoprotein 3-like 224763_at RPL37 0.35 5p13 ribosomal protein L37 201915_at SEC63 0.51 6q21 SEC63-like (S. cerevisiae) 202061_s_at SEL1L 0.56 14q24.3- sel-1 suppressor of lin-12-like (C. elegans) q31 217790_s_at SSR3 0.40 3q25.31 signal sequence receptor; gamma (translocon-associated protein gamma) 202558_s_at STCH 0.47 21q11.1|21q11 stress 70 protein chaperone; microsome- associated; 60 kDa 222116_s_at TBC1D16 0.70 17q25.3 TBC1 domain family; member 16 218145_at TRIB3 0.41 20p13- tribbles homolog 3 (Drosophila) p12.2 Nuclear proteins and transcription factors 227558_at CBX4 0.49 17q25.3 chromobox homolog 4 (Pc class homolog; Drosophila) 219551_at EAF2 0.46 3q13.33 ELL associated factor 2 226982_at ELL2 0.45 5q15 elongation factor; RNA polymerase II; 2 202146_at IFRD1 0.51 7q22-q31 interferon-related developmental regulator 1 214179_s_at NFE2L1 0.59 17q21.3 nuclear factor (erythroid-derived 2)-like 1 213878_at RECQL 0.44 12p12 RecQ protein-like (DNA helicase Q1-like) 208763_s_at TSC22D3 0.53 Xq22.3 TSC22 domain family; member 3 225382_at ZNF275 0.35 Xq28 zinc finger protein 275 227132_at ZNF706 0.49 8q22.3 zinc finger protein 706 Others 227755_at -- 0.53 -- CDNA FLJ42435 fis; clone BLADE2006849 208725_at EIF2S2 0.46 -- eukaryotic translation initiation factor 2, subunit 2 beta, Full-length cDNA clone CS0DD001YD20 of Neuroblastoma Cot 50-normalized of Homo sapiens (human) 244623_at -- 0.39 -- Transcribed locus 226719_at -- 0.53 -- CDNA FLJ34899 fis; clone NT2NE2018594 230570_at -- 0.37 -- Transcribed locus 229969_at -- 0.41 -- Transcribed locus; moderately similar to XP_508230.1 PREDICTED: zinc finger protein 195 [Pan troglodytes] 223136_at AIG1 0.41 6q24.2 androgen-induced 1 222545_s_at C10orf57 0.56 10q22.3 chromosome 10 open reading frame 57 220755_s_at C6orf48 0.49 6p21.3 chromosome 6 open reading frame 48 219802_at FLJ22028 0.44 12p12.1 hypothetical protein FLJ22028 212633_at KIAA0776 0.49 6q16.1 KIAA0776 229090_at LOC220930 0.45 10p11.23 hypothetical protein LOC220930
TABLE-US-00009 SUPPLEMENTARY TABLE S5 Prognostic value of decitabine deregulated genes in primary MMC of newly-diagnosed patients Ajusted Hazard Probeset NAME P value ratio Bad prognostic genes 209417_s_at IFI35 .03 1.84 221658_s_at IL21R .04 1.84 1552701_a_at COP1 .02 1.95 223129_x_at MYLIP .01 1.99 214179_s_at NFE2L1 .04 2.00 204079_at TPST2 .03 2.01 205483_s_at G1P2 .01 2.02 33322_i_at SFN .03 2.05 222690_s_at TMEM39A .02 2.20 209118_s_at TUBA3 .01 2.21 208012_x_at SP110 .01 2.22 213878_at RECQL .01 2.22 228531_at SAMD9 .005 2.25 203397_s_at GALNT3 .004 2.31 209969_s_at STAT1 .003 2.37 202411_at IFI27 .006 2.39 201625_s_at INSIG1 .02 2.50 205552_s_at OAS1 .01 2.50 204411_at KIF21B .0005 2.88 209083_at CORO1A .00008 3.05 218543_s_at PARP12 .00005 3.52 205718_at ITGB7 .00001 4.03 Good prognostic genes 221788_at PGM3 .0003 .29 229969_at SEC63 .0003 .29 224763_at RPL37 .0006 .32 232488_at MGC15875 .0007 .35 202558_s_at STCH .04 .39 219118_at FKBP11 .03 .41 223569_at PPAPDC1B .01 .42 220755_s_at C6orf48 .04 .43 202304_at FNDC3A .009 .44 1554462_a_at DNAJB9 .02 .45 227755_at EST, GenBank AA042983 .01 .45 226183_at GSK3B .02 .46 209122_at ADFP .01 .47 219551_at EAF2 .03 .47 224451_x_at ARHGAP9 .03 .48 210387_at HIST1H2BG .01 .49 211990_at HLA-DPA1 .01 .49 202061_s_at SEL1L .04 .50 214152_at CCPG1 .02 .50 226982_at ELL2 .03 .50 222294_s_at EIF2C2 .02 .52 228831_s_at GNG7 .04 .52 230570_at EST, GenBank AI702465 .04 .52 208725_at EIF2S2 .04 .54 222838_at SLAMF7 .04 .55
TABLE-US-00010 SUPPLEMENTARY TABLE S6 Cox univariate and multivariate analysis of OS in HM and TT2 patients' cohorts. HM Cohort TT2 Cohort OAS OAS Pronostic Proportional Proportional variable hazard ratio P-value hazard ratio P-value Univariate DM Score 7.12 <.0001 2.06 <.0001 COX β2m 1.1 <.0001 NA NA analysis - ISS 1.73 .001 NA NA Overall HRS 2.37 .01 4.67 <.0001 survival IFM score 3.09 .0001 1.78 .004 t(4; 14) 2.14 .001 2.21 .001 del17p 3.44 .02 2.46 <.0001 GPI 2.21 .0001 1.75 <.0001 Multivariate DM Score 5.91 <.0001 NA NA COX ISS 1.40 NS NA NA analysis - DM Score 6.31 <.0001 NA NA Overall β2m 1.1 .017 NA NA survival DM Score 6.68 <.0001 1.46 NS HRS 1.47 NS 4.02 <.0001 DM Score 6.80 <.0001 1.81 .006 IFM score 1.33 NS 1.37 NS DM Score 6.28 <.0001 1.94 .001 t(4; 14) 1.88 NS 2.01 .003 DM Score 6.34 <.0001 2.00 <.0001 del17p 1.60 NS 2.32 .001 DM Score 5.97 <.0001 2.00 <.0001 GPI 1.47 NS 1.68 <.0001 Multivariate DM Score 7.84 .005 1.40 NS COX β2m 1.1 NS NA NA analysis - ISS 1.37 NS NA NA Overall HRS 1.28 NS 3.66 <.0001 survival IFM score .62 NS .34 NS t(4; 14) 2.58 .02 2.36 <.0001 del17p 1.72 NS 2.21 .002 GPI 1.61 NS 1.11 NS
[0149] The prognostic factors were tested as single variable or multi variables using Cox-model. P-values and the hazard ratios (HR) are shown. NS, Not significant at a 5% threshold; GPI, gene expression based proliferation index; ISS, International Staging System; HRS, high-risk score; IFM, Intergroupe Francophone du Myelome; NA, Not available.
EXAMPLE 2
[0150] In order to identify the minimal number of genes among the 47 genes used to calculate the DM score, the inventors used PAM (Prediction Analysis of Microarray) statistical technique used for class prediction from gene expression data using nearest shrunken centroids. 25 genes were identified and are depicted in Table B.
TABLE-US-00011 TABLE B Probesets Name 202061_s_at SEL1L 202304_at FNDC3A 202558_s_at STCH 203397_s_at GALNT3 204079_at TPST2 205483_s_at G1P2 205552_s_at OAS1 205718_at ITGB7 208725_at EIF2S2 209083_at CORO1A 209118_s_at TUBA3 209122_at ADFP 209417_s_at IFI35 211990_at HLA-DPA1 214152_at CCPG1 214179_s_at NFE2L1 219118_at FKBP11 221658_s_at IL21R 222690_s_at TMEM39A 223129_x_at MYLIP 224451_x_at ARHGAP9 224763_at RPL37 227755_at -- 228831_s_at GNG7 232488_at MGC15875
EXAMPLE 3
DNA Methylation Score is Predictive of Myeloma Cell Sensitivity to 5-Azacitidine
[0151] Epigenetics is characterized by a wide range of changes that are reversible and orchestrate gene expression. Recent studies of the epigenome have shown that epigenetic modifications play a role in cancer physiopathology including hematologic malignancies (Issa 2007, Issa, et at 2004, Oki, et al 2008, Smith, et al 2009). In MM, DNA hypomethylation was reported as the predominant early change during myelomagenesis that is gradually transformed to DNA hypermethylation in relapsed cases and during the progression of the disease (Heuck, et al 2013, Walker, et al 2010). Hypermethylation of GPX3, RBP1, SPARC and TGFBI genes was demonstrated to be associated with significantly shorter overall survival, independent of age, ISS score and adverse cytogenetics (Kaiser, et at 2013). DNA methylation is regulated by DNA methyltransferases (DNMT) (Hollenbach, et at 2010). Decitabine (5-aza-2'-deoxycytidine) or 5-azacytidine are both FDA (U.S. Food and Drug Administration)-approved DNMT inhibitors for the treatment of myelodysplastic syndrome (MDS) (Rodriguez-Paredes and Esteller 2011). 5-azacytidine is a ribonucleoside and Decitabine is a deoxyribonucleoside. Decitabine is incorporated only in DNA whereas 5-azacytidine incorporates both in DNA and RNA including rRNAs, tRNAs, mRNAs and miRNAs (Hollenbach, et al 2010). Once incorporated into DNA, 5-azacytidine and Decitabine will lead to DNMTs depletion, DNA hypomethylation and DNA damage induction (Flotho, et al 2009, Ghoshal, et al 2005, Hollenbach, et al 2010, Kiziltepe, et al 2007, Palii, et al 2008, Stresemann, et at 2006). Via incorporation into newly synthetized RNA, 5-azacytidine will alterate the processing of RNAs inhibiting protein synthesis (Hollenbach, et al 2010). The inventors have recently reported the building of a DNA methylation score (DM Score) predicting for the efficacy of decitabine to kill MM cells (MMCs). Given that 5-azacitidine can incorporate in both DNA and RNA and block DNA methylation and RNA traduction. The inventors have currently investigated whether DM Score could also predict for MMCs sensitivity to 5-azacitidine.
[0152] Material & Methods
[0153] Human Myeloma Cell Lines (HMCLs) and Primary Multiple Myeloma Cells of Patients.
[0154] Human myeloma cell lines XG-1, XG-2, XG-5, XG-6, XG-12, XG-13, XG-16, XG-19, XG-20, RPMI8226, LP1 and SKMM2 (HMCLs, N=12) were obtained as previously described (Gu, et al 2000, Moreaux, et al 2011, Rebouissou, et al 1998, Tarte, et al 1999, Zhang, et al 1994) or purchased from DSMZ and American Type Culture Collection. These HMCLs were extensively phenotypically and molecularly characterized as described (Moreaux, et al 2011). Microarray data are deposited in the ArrayExpress public database (accession numbers E-TABM-937 and E-TABM-1088). Bone marrow of patients presenting with previously untreated multiple myeloma (n=14) at the university hospital of Montpellier were obtained after patients' written informed consent in accordance with the Declaration of Helsinki and agreement of the Montpellier University Hospital Center for Biological Resources. MMCs were purified as previously published (Mahtouk, et al 2004) and whole genome gene expression profiling assayed with Affymetrix U133 2.0 plus microarrays (Affymetrix, Santa Clara, Calif., USA) (De Vos, et al 2002). Gene expression data were analyzed using the inventor's bioinformatics platforms (http://rage.montp.inserm.fr/ and http.//amazonia.montp.inserm.fr/) (Reme, et al 2008, Tanguy Le Carrour 2010) and computations performed using R 2.15.1 (http://www.r-project.org/) and bioconductor 2.0 (http://www.bioconductor.org).
[0155] Sensitivity of Myeloma Cell Lines and Primary Myeloma Cells to 5-Azacitidine.
[0156] HMCLs were cultured with graded 5-azacitidine (Sigma, St. Louis, Mo.) concentrations. HMCLs cell growth was quantified with a Cell Titer Glo Luminescent Assay (Promega, Madison, Wis.) and half inhibitory concentration (IC50) was determined using GraphPad Prism (http://www.graphpad.com/scientific-software/prism/).
[0157] Primary myeloma cells of 14 patients were cultured with or without graded concentrations of 5-azacitidine and MMC cytotoxicity evaluated using anti-CD138-PE mAb (Immunotech, Marseille, France) as described (Jourdan, et al 1998; Mahtouk, et al 2004; Moreaux, et al 2012).
[0158] Gene Set Enrichment Analysis (GSEA)
[0159] The inventors compared the gene expression levels from high DM Score versus low DM Score patients and picked up the genes which had significant different expression for Gene set enrichment analysis (GSEA). Gene set enrichment analysis was carried out by computing overlaps with canonical pathways and gene ontology gene sets obtained from the Broad Institute.
[0160] Results and Discussion
[0161] The efficacy of DM Score to predict MMCs sensitivity to 5-azacitidine was investigated on 12 HMCLs with high or low DM Score. The 6 HMCLs with high DM Score exhibited a 3 fold higher 5-azacitidine sensitivity (P=0.01; median IC50=2.43 μM; range: 1.12 to 8.25 μM) compared to the 6 ones with a low DM Score (median IC50=7.45 μM; range: 5.73 to 27.9) (FIG. 5). DM score could also predict for the ability of 5-azacytidine to kill patients' primary MMCs cultured together with their BM environment. The MMCs of patients with a high DM Score (N=7) exhibited a significant 1.6 fold higher 5-azacytidine sensitivity compared to low DM Score patients (N=7) (P<0.05, FIG. 6).
[0162] Thus, the DM Score, which was built using 47 genes whose expression is deregulated by decitabine in HMCLs and which have prognostic value for patients overall survival, can predict for the sensitivity of MM cell lines and primary MMCs to the two-clinical grade inhibitors of DNMT. These 47 genes include 22 genes associated with a bad prognosis and 25 with good one. Using GSEA analysis, MMCs of patients with a high DM Score show a significant enrichment in genes associated with proliferation (gene sets: REACTOME CELL CYCLE, CELL CYCLE G2 M and PLASMA CELLS VS PLASMABLAST DN, P<0.001, and supplementary Tables S7, S8 and S9). On the other hand, MMCs of patients with a low DM Score show a significant enrichment in genes coding for solute carrier group of membrane transport proteins (gene sets: REACTOME TRANSPORT OF INORGANIC CATIONS ANIONS AND AMINO ACIDS OLIGOPEPTIDES, P<0.001, and supplementary Tables S10).
[0163] Thus, the higher sensitivity of MMCs of patients with a high DM Score to DNMT inhibitors could be explained by the fact that these inhibitors are mainly active in cell cycling cells since incorporation into DNA is restricted to the S-phase (Hollenbach, et al 2010), and also by a reduced drug export in MMCs of these patients, resulting in higher intracellular drug accumulation.
[0164] Clinical trials evaluate the safety of DNMTi as monotherapy or in combination with lenalidomide or dexamethasone in MM (Maes, et al 2013; Toor, et al 2012) and investigate the link between HM Score and response of patients to DNMTi could be promising.
[0165] In conclusion, the DM Score allows identification of MM patients who could benefit from treatment with two clinical grade DNMT inhibitors and the development of personalized treatment.
TABLE-US-00012 TABLE S7 Genes set enrichment analysis revealed a significant overrepresentation of the REACTOME CELL CYCLEset in high DM Score patients compared to low DM Score patients (P < .001). RANK RUNNING GENE METRIC Enrichment CORE PROBE SYMBOL GENE_TITLE SCORE Score ENRICHMENT MYBL2 MYBL2 v-myb myeloblastosis -0.167122021317482 -0.6420408 Yes viral oncogene homolog (avian)-like 2 CDKN2C CDKN2C cyclin-dependent kinase -0.16787339746952057 -0.626822 Yes inhibitor 2C (p18, inhibits CDK4) CDK6 CDK6 cyclin-dependent kinase 6 -0.19776728749275208 -0.6317126 Yes LMNA LMNA lamin A/C -0.20474471151828766 -0.61800563 Yes CDKN2B CDKN2B cyclin-dependent kinase -0.22542211413383484 -0.6069075 Yes inhibitor 2B (p15, inhibits CDK4) TYMS TYMS thymidylate synthetase -0.22692811489105225 -0.5853221 Yes MCM10 MCM10 MCM10 -0.23174770176410675 -0.56442255 Yes minichromosome maintenance deficient 10 (S. cerevisiae) BUB1B BUB1B BUB1 budding -0.2420835942029953 -0.54413825 Yes uninhibited by benzimidazoles 1 homolog beta (yeast) KIF23 KIF23 kinesin family member 23 -0.25110968947410583 -0.52252656 Yes CHEK1 CHEK1 CHK1 checkpoint -0.2538430988788605 -0.49904326 Yes homolog (S. pombe) HIST1H4H HIST1H4H histone cluster 1, H4h -0.27717286348342896 -0.47906303 Yes MCM2 MCM2 MCM2 minichromosome -0.29232123494148254 -0.45348957 Yes maintenance deficient 2, mitotin (S. cerevisiae) GINS1 GINS1 GINS complex subunit 1 -0.29381972551345825 -0.42524388 Yes (Psf1 homolog) KIF20A KIF20A kinesin family member -0.30122432112693787 -0.3985847 Yes 20A MCM4 MCM4 MCM4 minichromosome -0.3015007972717285 -0.36983046 Yes maintenance deficient 4 (S. cerevisiae) OIP5 OIP5 Opa interacting protein 5 -0.30586564540863037 -0.3406566 Yes CCND2 CCND2 cyclin D2 -0.31117963790893555 -0.31189123 Yes RRM2 RRM2 ribonucleotide reductase -0.3157253563404083 -0.28176954 Yes M2 polypeptide BIRC5 BIRC5 baculoviral IAP repeat- -0.3474469482898712 -0.2515862 Yes containing 5 (survivin) AURKA AURKA aurora kinase A -0.35163724422454834 -0.21778236 Yes CENPA CENPA centromere protein A -0.35916951298713684 -0.1837141 Yes CCNB2 CCNB2 cyclin B2 -0.36041226983070374 -0.1490667 Yes HIST1H4C HIST1H4C histone cluster 1, H4c -0.37045058608055115 -0.11368413 Yes CCNB1 CCNB1 cyclin B1 -0.38353657722473145 -0.077273406 Yes CDCA8 CDCA8 cell division cycle -0.39406412839889526 -0.039620794 Yes associated 8 NEK2 NEK2 NIMA (never in mitosis -0.4169292151927948 2.2989404E-4 Yes gene a)-related kinase 2
TABLE-US-00013 SUPPLEMENTARY TABLE S8 Genes set enrichment analysis revealed a significant overrepresentation of the CELL CYCLE G2/M set in high DM Score patients compared to low DM Score patients (P < .001). RANK RUNNING GENE METRIC Enrichment CORE PROBE SYMBOL GENE_TITLE SCORE Score ENRICHMENT CENPE CENPE centromere protein E, -0.15664561092853546 -0.6155994 Yes 312 kDa BMP2 BMP2 bone morphogenetic -0.16032224893569946 -0.6001657 Yes protein 2 TACC3 TACC3 transforming, acidic -0.18774476647377014 -0.6039366 Yes coiled-coil containing protein 3 PRR5 PRR5 proline rich 5 (renal) -0.18954475224018097 -0.582728 Yes CENPF CENPF centromere protein F, -0.19975358247756958 -0.5653478 Yes 350/400ka (mitosin) LMNA LMNA lamin A/C -0.20474471151828766 -0.5455384 Yes TPX2 TPX2 TPX2, microtubule- -0.22465506196022034 -0.52863073 Yes associated, homolog (Xenopus laevis) SHCBP1 SHCBP1 SHC SH2-domain -0.23987287282943726 -0.5050944 Yes binding protein 1 KIF14 KIF14 kinesin family member -0.2565326690673828 -0.48026097 Yes 14 DEPDC1B DEPDC1B DEP domain containing -0.2718331515789032 -0.4513114 Yes 1B HMMR HMMR hyaluronan-mediated -0.2835068106651306 -0.42005372 Yes motility receptor (RHAMM) DEPDC1 DEPDC1 DEP domain containing -0.28364425897598267 -0.3862573 Yes 1 ANLN ANLN anillin, actin binding -0.286072313785553 -0.35217157 Yes protein HMGB3 HMGB3 high-mobility group -0.28622567653656006 -0.31806755 Yes box 3 MCM4 MCM4 MCM4 -0.3015007972717285 -0.286271 Yes minichromosome maintenance deficient 4 (S. cerevisiae) FOXM1 FOXM1 forkhead box M1 -0.3144078850746155 -0.25064352 Yes CEP55 CEP55 centrosomal protein -0.3161003887653351 -0.21320921 Yes 55 kDa BIRC5 BIRC5 baculoviral IAP repeat- -0.3474469482898712 -0.17479162 Yes containing 5 (survivin) AURKA AURKA aurora kinase A -0.35163724422454834 -0.13289377 Yes CENPA CENPA centromere protein A -0.35916951298713684 -0.09055706 Yes CCNB2 CCNB2 cyclin B2 -0.36041226983070374 -0.047613665 Yes NEK2 NEK2 NIMA (never in mitosis -0.4169292151927948 2.2932523E-4 Yes gene a)-related kinase 2
TABLE-US-00014 SUPPLEMENTARY TABLE S9 Genes set enrichment analysis revealed a significant overrepresentation of the PLASMA CELLS VS PLASMABLAST set in high DM Score patients compared to low DM Score patients (P < .001). RANK RUNNING GENE METRIC Enrichment CORE PROBE SYMBOL GENE_TITLE SCORE Score ENRICHMENT CLEC2B CLEC2B C-type lectin domain family 2, -0.1298338621854782 -0.6410949 Yes member B PLK4 PLK4 polo-like kinase 4 (Drosophila) -0.13095927238464355 -0.62984425 Yes RNASE6 RNASE6 ribonuclease, RNase A family, -0.13925980031490326 -0.62673587 Yes k6 IFI30 IFI30 interferon, gamma-inducible -0.1412345916032791 -0.61493564 Yes protein 30 GLIPR1 GLIPR1 GLI pathogenesis-related 1 -0.141678586602211 -0.6014841 Yes (glioma) CENPE CENPE centromere protein E, 312 kDa -0.15664561092853546 -0.60218084 Yes CD52 CD52 CD52 molecule -0.15694235265254974 -0.58677125 Yes ITGB1 ITGB1 integrin, beta 1 (fibronectin -0.1667313575744629 -0.5811952 Yes receptor, beta polypeptide, antigen CD29 includes MDF2, MSK12) PAPOLA PAPOLA poly(A) polymerase alpha -0.19660720229148865 -0.5871552 Yes GALNT3 GALNT3 UDP-N-acetyl-alpha-D- -0.19789130985736847 -0.56841403 Yes galactosamine: polypeptide N- acetylgalactosaminyltransferase 3 (GalNAc-T3) CD58 CD58 CD58 molecule -0.21272079646587372 -0.5571741 Yes GLDC GLDC glycine dehydrogenase -0.22228969633579254 -0.5404011 Yes (decarboxylating) TYMS TYMS thymidylate synthetase -0.22692811489105225 -0.5197276 Yes GZMB GZMB granzyme B (granzyme 2, -0.2282218039035797 -0.49754903 Yes cytotoxic T-lymphocyte- associated serine esterase 1) ITGB7 ITGB7 integrin, beta 7 -0.24833402037620544 -0.47867823 Yes KIF23 KIF23 kinesin family member 23 -0.25110968947410583 -0.45517108 Yes KIF14 KIF14 kinesin family member 14 -0.2565326690673828 -0.43227983 Yes PFKP PFKP phosphofructokinase, platelet -0.2628379166126251 -0.40693212 Yes HMMR HMMR hyaluronan-mediated motility -0.2835068106651306 -0.38460782 Yes receptor (RHAMM) GINS1 GINS1 GINS complex subunit 1 (Psf1 -0.29381972551345825 -0.35759616 Yes homolog) SELL SELL selectin L (lymphocyte adhesion -0.2999555468559265 -0.32998204 Yes molecule 1) TOP2A TOP2A topoisomerase (DNA) II alpha -0.30873504281044006 -0.3015059 Yes 170 kDa CDKN3 CDKN3 cyclin-dependent kinase -0.30915674567222595 -0.27138063 Yes inhibitor 3 (CDK2-associated dual specificity phosphatase) CCND2 CCND2 cyclin D2 -0.31117963790893555 -0.24082708 Yes FOXM1 FOXM1 forkhead box M1 -0.3144078850746155 -0.20995656 Yes RRM2 RRM2 ribonucleotide reductase M2 -0.3157253563404083 -0.17895667 Yes polypeptide CASP6 CASP6 caspase 6, apoptosis-related -0.34289273619651794 -0.14781573 Yes cysteine peptidase CENPA CENPA centromere protein A -0.35916951298713684 -0.11392827 Yes S100A10 S100A10 S100 calcium binding protein -0.37857523560523987 -0.077676095 Yes A10 CCNB1 CCNB1 cyclin B1 -0.38353657722473145 -0.040018078 Yes NEK2 NEK2 NIMA (never in mitosis gene -0.4169292151927948 2.296113E-4 Yes a)-related kinase 2
TABLE-US-00015 SUPPLEMENTARY TABLE S10 Genes set enrichment analysis revealed a significant overrepresentation of the REACTOME TRANSPORT OF INORGANIC CATIONS ANIONS AND AMINO ACID OLIGOPEPTIDES set in low DM Score patients compared to high DM Score patients (P < .001). RANK RUNNING GENE METRIC Enrichment CORE PROBE SYMBOL GENE_TITLE SCORE Score ENRICHMENT SLC24A3 SLC24A3 solute carrier family 24 0.18617968261241913 0.03475809 Yes (sodium/potassium/calcium exchanger), member 3 SLC17A8 SLC17A8 solute carrier family 17 0.17720697820186615 0.09601015 Yes (sodium-dependent inorganic phosphate cotransporter), member 8 SLC7A8 SLC7A8 solute carrier family 7 (cationic 0.17013469338417053 0.15928961 Yes amino acid transporter, y+ system), member 8 SLC1A1 SLC1A1 solute carrier family 1 0.15042848885059357 0.19263873 Yes (neuronal/epithelial high affinity glutamate transporter, system Xag), member 1 SLC4A1 SLC4A1 solute carrier family 4, anion 0.134476438164711 0.21448465 Yes exchanger, member 1 (erythrocyte membrane protein band 3, Diego blood group) SLC12A5 SLC12A5 solute carrier family 12, 0.13315615057945251 0.26718774 Yes (potassium-chloride transporter) member 5 SLC9A3 SLC9A3 solute carrier family 9 0.1316232681274414 0.3169685 Yes (sodium/hydrogen exchanger), member 3 SLC15A2 SLC15A2 solute carrier family 15 0.11438794434070587 0.3207876 Yes (H+/peptide transporter), member 2 SLC4A4 SLC4A4 solute carrier family 4, sodium 0.10706888139247894 0.34565148 Yes bicarbonate cotransporter, member 4 SLC12A1 SLC12A1 solute carrier family 12 0.106844961643219 0.3904528 Yes (sodium/potassium/chloride transporters), member 1 SLC24A5 SLC24A5 solute carrier family 24, 0.09523425251245499 0.39576042 Yes member 5 SLC8A1 SLC8A1 solute carrier family 8 0.09496445208787918 0.43509954 Yes (sodium/calcium exchanger), member 1 SLC1A3 SLC1A3 solute carrier family 1 (glial 0.09355431795120239 0.47225094 Yes high affinity glutamate transporter), member 3 SLC8A3 SLC8A3 solute carrier family 8 (sodium- 0.08295272290706635 0.47784585 Yes calcium exchanger), member 3
REFERENCES
[0166] Throughout this application, various references describe the state of the art to which this invention pertains. The disclosures of these references are hereby incorporated by reference into the present disclosure.
[0167] 1. Hahn W C, Weinberg R A. Rules for making human tumor cells. N Engl J Med. 2002; 347(20):1593-1603.
[0168] 2. Vogelstein B, Kinzler K W. Cancer genes and the pathways they control. Nat Med. 2004; 10(8):789-799.
[0169] 3. Baylin S B. DNA methylation and gene silencing in cancer. Nat Clin Pract Oncol. 2005; 2 Suppl 1:S4-11.
[0170] 4. Kondo Y. Epigenetic cross-talk between DNA methylation and histone modifications in human cancers. Yonsei Med J. 2009; 50(4):455-463.
[0171] 5. Issa J P. DNA methylation as a therapeutic target in cancer. Clin Cancer Res. 2007; 13(6): 1634-1637.
[0172] 6. Issa J P, Garcia-Manero G, Giles F J, et al. Phase 1 study of low-dose prolonged exposure schedules of the hypomethylating agent 5-aza-2'-deoxycytidine (decitabine) in hematopoietic malignancies. Blood. 2004; 103(5):1635-1640.
[0173] 7. Oki Y, Jelinek J, Shen L, Kantarjian H M, Issa J P. Induction of hypomethylation and molecular response after decitabine therapy in patients with chronic myelomonocytic leukemia. Blood. 2008; 111(4):2382-2384.
[0174] 8. Smith E M, Boyd K, Davies F E. The potential role of epigenetic therapy in multiple myeloma. Br J Haematol. 2009.
[0175] 9. Bergsagel P L, Kuehl W M. Molecular pathogenesis and a consequent classification of multiple myeloma. J Clin Oncol. 2005; 23(26):6333-6338.
[0176] 10. Hideshima T, Bergsagel P L, Kuehl W M, Anderson K C. Advances in biology of multiple myeloma: clinical applications. Blood. 2004; 104(3):607-618.
[0177] 11. Chen G, Wang Y, Huang H, et al. Combination of DNA methylation inhibitor 5-azacytidine and arsenic trioxide has synergistic activity in myeloma. Eur J Haematol. 2009; 82(3): 176-183.
[0178] 12. de Carvalho F, Colleoni G W, Almeida M S, Carvalho A L, Vettore A L. TGFbetaR2 aberrant methylation is a potential prognostic marker and therapeutic target in multiple myeloma. Int J Cancer. 2009; 125(8):1985-1991.
[0179] 13. Galm O, Yoshikawa H, Esteller M, Osieka R, Herman J G. SOCS-1, a negative regulator of cytokine signaling, is frequently silenced by methylation in multiple myeloma. Blood. 2003; 101(7):2784-2788.
[0180] 14. Hatzimichael E, Dranitsaris G, Dasoula A, et al. Von Hippel-Lindau methylation status in patients with multiple myeloma: a potential predictive factor for the development of bone disease. Clin Lymphoma Myeloma. 2009; 9(3):239-242.
[0181] 15. Hodge D R, Peng B, Cherry J C, et al. Interleukin 6 supports the maintenance of p53 tumor suppressor gene promoter methylation. Cancer Res. 2005; 65(11):4673-4682.
[0182] 16. Ng M H, Chung Y F, Lo K W, Wickham N W, Lee J C, Huang D P. Frequent hypermethylation of p16 and p15 genes in multiple myeloma. Blood. 1997; 89(7):2500-2506.
[0183] 17. Seidl S, Ackermann J, Kaufmann H, et al. DNA-methylation analysis identifies the E-cadherin gene as a potential marker of disease progression in patients with monoclonal gammopathies. Cancer. 2004; 100(12):2598-2606.
[0184] 18. Tshuikina M, Jernberg-Wiklund H, Nilsson K, Oberg F. Epigenetic silencing of the interferon regulatory factor ICSBP/IRF8 in human multiple myeloma. Exp Hematol. 2008; 36(12):1673-1681.
[0185] 19. Heller G, Schmidt W M, Ziegler B, et al. Genome-wide transcriptional response to 5-aza-2'-deoxycytidine and trichostatin a in multiple myeloma cells. Cancer Res. 2008; 68(1):44-54.
[0186] 20. Wilop S, van Gemmeren T B, Lentjes M H, et al. Methylation-associated dysregulation of the suppressor of cytokine signaling-3 gene in multiple myeloma. Epigenetics. 2011; 6(8):1047-1052.
[0187] 21. Walker B A, Wardell C P, Chiecchio L, et al. Aberrant global methylation patterns affect the molecular pathogenesis and prognosis of multiple myeloma. Blood. 2010.
[0188] 22. Moreaux J, Klein B, Bataille R, et al. A high-risk signature for patients with multiple myeloma established from the molecular classification of human myeloma cell lines. Haematologica. 2011; 96(4):574-582.
[0189] 23. Zhang X G, Gaillard J P, Robillard N, et al. Reproducible obtaining of human myeloma cell lines as a model for tumor stem cell study in human multiple myeloma. Blood. 1994; 83(12):3654-3663.
[0190] 24. Rebouissou C, Wijdenes J, Autissier P, et al. A gp130 interleukin-6 transducer-dependent SCID model of human multiple myeloma. Blood. 1998;91(12):4727-4737.
[0191] 25. Tarte K, Zhang X G, Legouffe E, et al. Induced expression of B7-1 on myeloma cells following retroviral gene transfer results in tumor-specific recognition by cytotoxic T cells. J Immunol. 1999; 163(1):514-524.
[0192] 26. Gu Z J, Vos J D, Rebouissou C, et al. Agonist anti-gp130 transducer monoclonal antibodies are human myeloma cell survival and growth factors. Leukemia. 2000; 14(1):188-197.
[0193] 27. Goldschmidt H, Sonneveld P, Cremer F W, et al. Joint HOVON-50/GMMG-HD3 randomized trial on the effect of thalidomide as part of a high-dose therapy regimen and as maintenance treatment for newly diagnosed myeloma patients. Ann Hematol. 2003; 82(10):654-659.
[0194] 28. Cremer F W, Bila J, Buck I, et al. Delineation of distinct subgroups of multiple myeloma and a model for clonal evolution based on interphase cytogenetics. Genes Chromosomes Cancer. 2005; 44(2):194-203.
[0195] 29. Barlogie B, Tricot G, Rasmussen E, et al. Total therapy 2 without thalidomide in comparison with total therapy 1: role of intensified induction and posttransplantation consolidation therapies. Blood. 2006; 107(7):2633-2638.
[0196] 30. Sprynski A C, Hose D, Caillot L, et al. The role of IGF-1 as a major growth factor for myeloma cell lines and the prognostic relevance of the expression of its receptor. Blood. 2009; 113(19):4614-4626.
[0197] 31. Xiong W, Wu X, Starnes S, et al. An analysis of the clinical and biologic significance of TP53 loss and the identification of potential novel transcriptional targets of TP53 in multiple myeloma. Blood. 2008; 112(10):4235-4246.
[0198] 32. Moreaux J, Legouffe E, Jourdan E, et al. BAFF and APRIL protect myeloma cells from apoptosis induced by interleukin 6 deprivation and dexamethasone. Blood. 2004; 103(8):3148-3157.
[0199] 33. Hose D, Reme T, Meissner T, et al Inhibition of aurora kinases for tailored risk-adapted treatment of multiple myeloma. Blood. 2009; 113(18):4331-4340.
[0200] 34. Moreaux J, Cremer F W, Reme T, et al. The level of TACI gene expression in myeloma cells is associated with a signature of microenvironment dependence versus a plasmablastic signature. Blood. 2005; 106(3):1021-1030.
[0201] 35. Reme T, Hose D, De Vos J, et al. A new method for class prediction based on signed-rank algorithms applied to Affymetrix microarray experiments. BMC Bioinformatics. 2008; 9:16.
[0202] 36. Tanguy Le Carrour S A, Sylvie Tondeur, Ludovic Lhermitte, Ned Lamb, Thierry Reme, Veronique Pantesco, Samir Hamamah, Bernard Klein, John De Vos. Amazonia!: An Online Resource to Google and Visualize Public Human whole Genome Expression Data. The Open Bioinformatics Journal. 2010; 4:5-10.
[0203] 37. Cui X, Churchill G A. Statistical tests for differential expression in cDNA microarray experiments. Genome Biol. 2003; 4(4):210.
[0204] 38. Kassambara A, Hose D, Moreaux J, et al. Genes with a spike expression are clustered in chromosome (sub)bands and spike (sub)bands have a powerful prognostic value in patients with multiple myeloma. Haematologica. 2011.
[0205] 39. Zhan F, Huang Y, Colla S, et al. The molecular classification of multiple myeloma. Blood. 2006; 108(6):2020-2028.
[0206] 40. Chu W K, Hickson I D. RecQ helicases: multifunctional genome caretakers. Nat Rev Cancer. 2009; 9(9):644-654.
[0207] 41. Harrigan J A, Bohr V A. Human diseases deficient in RecQ helicases. Biochimie. 2003; 85(11): 1185-1193.
[0208] 42. Hickson I D. RecQ helicases: caretakers of the genome. Nat Rev Cancer. 2003; 3(3):169-178.
[0209] 43. Arai A, Chano T, Futami K, et al. RECQL1 and WRN proteins are potential therapeutic targets in head and neck squamous cell carcinoma. Cancer Res. 2011; 71(13):4598-4607.
[0210] 44. Futami K, Kumagai E, Makino H, et al. Induction of mitotic cell death in cancer cells by small interference RNA suppressing the expression of RecQL1 helicase. Cancer Sci. 2008; 99(1):71-80.
[0211] 45. Futami K, Kumagai E, Makino H, et al. Anticancer activity of RecQL1 helicase siRNA in mouse xenograft models. Cancer Sci. 2008; 99(6):1227-1236.
[0212] 46. Mendoza-Maldonado R, Faoro V, Bajpai S, et al. The human RECQ1 helicase is highly expressed in glioblastoma and plays an important role in tumor cell proliferation. Mol Cancer. 2011; 10:83.
[0213] 47. Miki H, Okada Y, Hirokawa N. Analysis of the kinesin superfamily: insights into structure and function. Trends Cell Biol. 2005; 15(9):467-476.
[0214] 48. Hirokawa N. Kinesin and dynein superfamily proteins and the mechanism of organelle transport. Science. 1998; 279(5350):519-526.
[0215] 49. Yu Y, Feng Y M. The role of kinesin family proteins in tumorigenesis and progression: potential biomarkers and molecular targets for cancer therapy. Cancer. 2010; 116(22):5150-5160.
[0216] 50. Zhu C, Zhao J, Bibikova M, et al. Functional analysis of human microtubule-based motor proteins, the kinesins and dyneins, in mitosis/cytokinesis using RNA interference. Mol Biol Cell. 2005; 16(7):3187-3199.
[0217] 51. Avet-Loiseau H, Li C, Magrangeas F, et al. Prognostic significance of copy-number alterations in multiple myeloma. J Clin Oncol. 2009; 27(27):4585-4590.
[0218] 52. Agnelli L, Forcato M, Ferrari F, et al. The reconstruction of transcriptional networks reveals critical genes with implications for clinical outcome of multiple myeloma. Clin Cancer Res. 2011; 17(23):7402-7412.
[0219] 53. De Vos, J., Thykjaer, T., Tarte, K., Ensslen, M., Raynaud, P., Requirand, G., Pellet, F., Pantesco, V., Reme, T., Jourdan, M., Rossi, J. F., Orntoft, T. & Klein, B. (2002) Comparison of gene expression profiling between malignant and normal plasma cells with oligonucleotide arrays. Oncogene, 21, 6848-6857.
[0220] 54. Flotho, C., Claus, R., Batz, C., Schneider, M., Sandrock, I., Ihde, S., Plass, C., Niemeyer, C. M. & Lubbert, M. (2009) The DNA methyltransferase inhibitors azacitidine, decitabine and zebularine exert differential effects on cancer gene expression in acute myeloid leukemia cells. Leukemia, 23, 1019-1028.
[0221] 55. Ghoshal, K., Datta, J., Majumder, S., Bai, S., Kutay, H., Motiwala, T. & Jacob, S. T. (2005) 5-Aza-deoxycytidine induces selective degradation of DNA methyltransferase 1 by a proteasomal pathway that requires the KEN box, bromo-adjacent homology domain, and nuclear localization signal. Mol Cell Biol, 25, 4727-4741.
[0222] 56. Heuck, C. J., Mehta, J., Bhagat, T., Gundabolu, K., Yu, Y., Khan, S., Chrysofakis, G., Schipke, C., Tariman, J., Vickrey, E., Pulliam, N., Nischal, S., Zhou, L., Bhattacharyya, S., Meagher, R., Hu, C., Maqbool, S., Suzuki, M., Parekh, S., Reu, F., Steidl, U., Greally, J., Verma, A. & Singhal, S. B. (2013) Myeloma is characterized by stage-specific alterations in DNA methylation that occur early during myelomagenesis. J Immunol, 190, 2966-2975.
[0223] 57. Hollenbach, P. W., Nguyen, A. N., Brady, H., Williams, M., Ning, Y., Richard, N., Krushel, L., Aukerman, S. L., Heise, C. & MacBeth, K. J. (2010) A comparison of azacitidine and decitabine activities in acute myeloid leukemia cell lines. PLoS One, 5, e9001.
[0224] 58. Jourdan, M., Ferlin, M., Legouffe, E., Horvathova, M., Liautard, J., Rossi, J. F., Wijdenes, J., Brochier, J. & Klein, B. (1998) The myeloma cell antigen syndecan-1 is lost by apoptotic myeloma cells. Br J Haematol, 100, 637-646.
[0225] 59. Kaiser, M. F., Johnson, D. C., Wu, P., Walker, B. A., Brioli, A., Mirabella, F., Wardell, C. P., Melchor, L., Davies, F. E. & Morgan, G. J. (2013) Global methylation analysis identifies prognostically important epigenetically inactivated tumour suppressor genes in multiple myeloma. Blood.
[0226] 60. Kiziltepe, T., Hideshima, T., Catley, L., Raje, N., Yasui, H., Shiraishi, N., Okawa, Y., Ikeda, H., Vallet, S., Pozzi, S., Ishitsuka, K., Ocio, E. M., Chauhan, D. & Anderson, K. C. (2007) 5-Azacytidine, a DNA methyltransferase inhibitor, induces ATR-mediated DNA double-strand break responses, apoptosis, and synergistic cytotoxicity with doxorubicin and bortezomib against multiple myeloma cells. Mol Cancer Ther, 6, 1718-1727.
[0227] 61. Maes, K., Menu, E., Van Valckenborgh, E., Van Riet, I., Vanderkerken, K. & De Bruyne, E. (2013) Epigenetic Modulating Agents as a New Therapeutic Approach in Multiple Myeloma. Cancers, 5, 430-461.
[0228] 62. Mahtouk, K., Jourdan, M., De Vos, J., Hertogh, C., Fiol, G., Jourdan, E., Rossi, J. F. & Klein, B. (2004) An inhibitor of the EGF receptor family blocks myeloma cell growth factor activity of HB-EGF and potentiates dexamethasone or anti-IL-6 antibody-induced apoptosis. Blood, 103, 1829-1837.
[0229] 63. Moreaux, J., Reme, T., Leonard, W., Veyrune, J. L., Requirand, G., Goldschmidt, H., Hose, D. & Klein, B. (2012) Development of gene expression-based score to predict sensitivity of multiple myeloma cells to DNA methylation inhibitors. Mol Cancer Ther, 11, 2685-2692.
[0230] 64. Palii, S. S., Van Emburgh, B. O., Sankpal, U. T., Brown, K. D. & Robertson, K. D. (2008) DNA methylation inhibitor 5-Aza-2'-deoxycytidine induces reversible genome-wide DNA damage that is distinctly influenced by DNA methyltransferases 1 and 3 B. Mol Cell Biol, 28, 752-771. 65. Rodriguez-Paredes, M. & Esteller, M. (2011) Cancer epigenetics reaches mainstream oncology. Nat Med, 17, 330-339.
[0231] 66. Stresemann, C., Brueckner, B., Musch, T., Stopper, H. & Lyko, F. (2006) Functional diversity of DNA methyltransferase inhibitors in human cancer cell lines. Cancer Res, 66, 2794-2800. 67. Tanguy Le Carrour, S. A., Sylvie Tondeur, Ludovic Lhermitte, Ned Lamb, Thierry Reme, Veronique Pantesco, Samir Hamamah, Bernard Klein, John De Vos (2010) Amazonia!: An Online Resource to Google and Visualize Public Human whole Genome Expression Data. The Open Bioinformatics Journal, 4, 5-10.
[0232] 68. Toor, A. A., Payne, K. K., Chung, H. M., Sabo, R. T., Hazlett, A. F., Kmieciak, M., Sanford, K., Williams, D. C., Clark, W. B., Roberts, C. H., McCarty, J. M. & Manjili, M. H. (2012) Epigenetic induction of adaptive immune response in multiple myeloma: sequential azacitidine and lenalidomide generate cancer testis antigen-specific cellular immunity. Br J Haematol, 158, 700-711.
[0233] 69. Walker, B. A., Wardell, C. P., Chiecchio, L., Smith, E. M., Boyd, K. D., Neri, A., Davies, F. E., Ross, F. M. & Morgan, G. J. (2010) Aberrant global methylation patterns affect the molecular pathogenesis and prognosis of multiple myeloma. Blood.
[0234] 70. Zhang, X. G., Gaillard, J. P., Robillard, N., Lu, Z. Y., Gu, Z. J., Jourdan, M., Boiron, J. M., Bataille, R. & Klein, B. (1994) Reproducible obtaining of human myeloma cell lines as a model for tumor stem cell study in human multiple myeloma. Blood, 83, 3654-3663.
User Contributions:
Comment about this patent or add new information about this topic:
Images included with this patent application:
 | 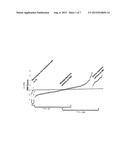 |
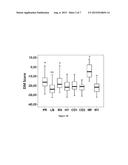 | 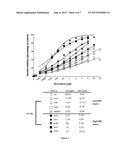 |
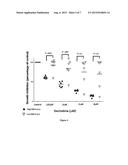 | 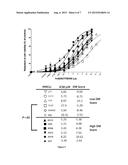 |
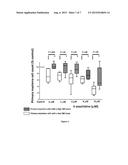 | 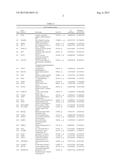 |
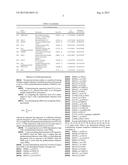 | 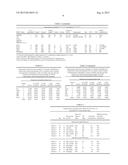 |
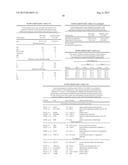 | 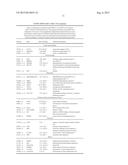 |
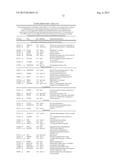 | 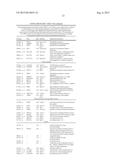 |
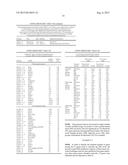 | 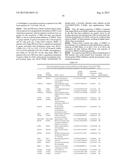 |
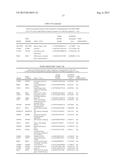 | 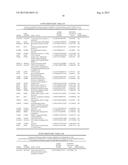 |
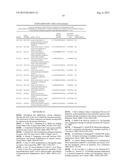 |
| New patent applications in this class: | |
| Date | Title |
|---|---|
| 2022-09-08 | Shrub rose plant named 'vlr003' |
| 2022-08-25 | Cherry tree named 'v84031' |
| 2022-08-25 | Miniature rose plant named 'poulty026' |
| 2022-08-25 | Information processing system and information processing method |
| 2022-08-25 | Data reassembly method and apparatus |
| New patent applications from these inventors: | |
| Date | Title |
|---|---|
| 2015-10-01 | Methods for predicting multiple myeloma treatment response |