Patent application title: SYSTEM, COMPUTER PROGRAM AND METHOD FOR DETERMINING BEHAVIOR OF THYROID TUMOR
Inventors:
Hiroyuki Shimizu (Kobe-Shi, JP)
Kazuki Nakabayashi (Kobe-Shi, JP)
Kazuki Nakabayashi (Kobe-Shi, JP)
Motonari Daito (Kobe-Shi, JP)
Assignees:
SYSMEX CORPORATION
IPC8 Class: AC12Q168FI
USPC Class:
506 9
Class name: Combinatorial chemistry technology: method, library, apparatus method of screening a library by measuring the ability to specifically bind a target molecule (e.g., antibody-antigen binding, receptor-ligand binding, etc.)
Publication date: 2014-06-12
Patent application number: 20140162895
Abstract:
The invention provides a system adapted to a method for determining
behavior of thyroid tumor. The system comprises a processor, and a
memory, under control of said processor, including software instructions
adapted to enable the system to perform operations.Claims:
1. A system adapted to a method for determining behavior of thyroid
tumor, comprising: a processor, and a memory, under control of said
processor, including software instructions adapted to enable the system
to perform operations comprising: determining whether a thyroid tumor in
a subject is benign or malignant based on the results of first, second,
and third measurements; wherein the expression levels of at least 6 genes
selected from the group consisting of AIF1L, CDH16, FAM162B, FGFR2, GJB6,
KCNJ13, KIAA1467, SLC25A15, TFCP2L1, TFF3, and TMEM171 in a sample
collected from the subject are measured in the first measurement, the
expression levels of at least 7 genes selected from the group consisting
of C4orf10, CCDC8, CD22, FAM125A, FAM174B, FBF1, GLB1L2, LOC644613,
MAP2K2, MTG1, PFKL, PTDSS2, SF3A2, SLC2A11, VILL, VSIG2, and WDR18 in the
sample are measured in the second measurement, and the expression levels
of at least 7 genes selected from the group consisting of ANXA1,
C13orf33, CYP1B1, FAP, FN1, IL17RD, PDLIM4, RUNX2, and TIMP1 in the
sample are measured in the third measurement.
2. The system according to claim 1, wherein in the operations, when the expression state of the genes measured in the first measurement is more than or equal to the expression state of the genes measured in the second measurement, and when the expression state of the genes measured in the first measurement is more than or equal to the expression state of the genes measured in the third measurements, the thyroid tumor of the subject is determined to be benign, and when the expression state of the genes measured in either the second or third measurement is more than the expression state of the genes measured in the first measurement, the thyroid tumor of the subject is determined to be malignant.
3. The system according to claim 1, wherein in the operations, when the expression state of the genes measured in the first measurement is more than or equal to the expression state of the genes measured in the second measurement, and when the expression state of the genes measured in the first measurement is more than or equal to the expression state of the genes measured in the third measurement, the thyroid tumor of the subject is determined to be benign, when the expression state of the genes measured in the second measurement is more than the genes measured in the first measurement, and when the expression state of the genes measured in the second measurement is more than or equal to the expression state of the genes measured in the third measurement, the thyroid tumor of the subject is determined to a first malignant tumor, and when the expression state of the genes measured in the third measurement is more than the expression states of the genes measured in the first and second measurements, the thyroid tumor of the subject is determined to a second malignant tumor.
4. The system according to claim 1, wherein the benign tumor is at least one of follicular adenoma, adenomatous nodules, and cysts.
5. The system according to claim 1, wherein the malignant tumor is at least one of follicular carcinoma, papillary carcinoma, poorly-differentiated carcinoma, and undifferentiated carcinoma.
6. The system according to claim 3, wherein the first malignant tumor is a malignant tumor with poor prognosis.
7. The system according to claim 3, wherein the second malignant tumor is a malignant tumor with good prognosis.
8. The system according to claim 3, wherein the first malignant tumor is at least one of undifferentiated carcinoma, poorly-differentiated carcinoma, and follicular carcinoma with widely invasive and/or vascular invasion.
9. The system according to claim 3, wherein the second malignant tumor is at least one of papillary carcinoma and follicular carcinoma without widely invasive and vascular invasion.
10. The system according to claim 1, wherein the expression levels of at least 6 genes: AIF1L, FAM162B, FGFR2, GJB6, KIAA1467, and TFF3 are measured in the first measurement.
11. The system according to claim 1, wherein the expression levels of at least 7 genes: FAM174B, MAP2K2, MTG1, PFKL, PTDSS2, SF3A2, and WDR18 are measured in the second measurement.
12. The system according to claim 1, wherein the expression levels of at least 7 genes: ANXA1, CYP1B1, FAP, IL17RD, PDLIM4, RUNX2, and TIMP1 are measured in the third measurement.
13. The system according to claim 1, wherein a microarray or a nucleic acid amplification method is used to measure the gene expression levels in the first, second, and third measurements.
14. The system according to claim 1, wherein the sample contains cells derived from the thyroid of the subject.
15. The system according to claim 1, further comprising a microarray and a microarray scanner to perform the first, second and third measurements, the microarray scanner being connected to the processor to transmit a signal detected from the microarray.
16. The system according to claim 2, wherein the expression state of the genes measured in the first measurement is a measure of central tendency of the expression levels of genes measured in the first measurement, the expression state of the genes measured in the second measurement is a measure of central tendency of the expression levels of genes measured in the second measurement, and the expression state of the genes measured in the third measurement is a measure of central tendency of the expression levels of genes measured in the third measurement.
17. A computer program product for enabling a computer to determine behavior of thyroid tumor, comprising: a computer readable medium, and software instructions, on the computer readable medium, for enabling the computer to perform predetermined operations comprising: determining whether a thyroid tumor in a subject is benign or malignant based on the results of first, second, and third measurements, wherein the expression levels of at least 6 genes selected from the group consisting of AIF1L, CDH16, FAM162B, FGFR2, GJB6, KCNJ13, KIAA1467, SLC25A15, TFCP2L1, TFF3, and TMEM171 in a sample collected from the subject are measured in the first measurement, the expression levels of at least 7 genes selected from the group consisting of C4orf10, CCDC8, CD22, FAM125A, FAM174B, FBF1, GLB1L2, LOC644613, MAP2K2, MTG1, PFKL, PTDSS2, SF3A2, SLC2A11, VILL, VSIG2, and WDR18 in the sample are measured in the second measurement, and the expression levels of at least 7 genes selected from the group consisting of ANXA1, C13orf33, CYP1B1, FAP, FN1, IL17RD, PDLIM4, RUNX2, and TIMP1 in the sample are measured in the third measurement.
18. The computer program product according to claim 17, wherein in the operations, when the expression state of the genes measured in the first measurement is more than or equal to the expression state of the genes measured in the second measurement, and when the expression state of the genes measured in the first measurement is more than or equal to the expression state of the genes measured in the third measurements, the thyroid tumor of the subject is determined to be benign, and when the expression state of the genes measured in either the second or third measurement is more than the expression state of the genes measured in the first measurement, the thyroid tumor of the subject is determined to be malignant.
19. The computer program product according to claim 17, wherein in the operations, when the expression state of the genes measured in the first measurement is more than or equal to the expression state of the genes measured in the second measurement, and when the expression state of the genes measured in the first measurement is more than or equal to the expression state of the genes measured in the third measurement, the thyroid tumor of the subject is determined to be benign, when the expression state of the genes measured in the second measurement is more than the genes measured in the first measurement, and when the expression state of the genes measured in the second measurement is more than or equal to the expression state of the genes measured in the third measurement, the thyroid tumor of the subject is determined to a first malignant tumor, and when the expression state of the genes measured in the third measurement is more than the expression states of the genes measured in the first and second measurements, the thyroid tumor of the subject is determined to a second malignant tumor.
20. A method for determining behavior of thyroid tumor, comprising: applying a sample collected from a subject with a thyroid tumor to a microarray capable of measuring the expression levels of the following genes (a) to (c): (a) at least 6 genes selected from the group consisting of AIF1L, CDH16, FAM162B, FGFR2, GJB6, KCNJ13, KIAA1467, SLC25A15, TFCP2L1, TFF3, and TMEM171; (b) at least 7 genes selected from the group consisting of C4orf10, CCDC8, CD22, FAM125A, FAM174B, FBF1, GLB1L2, LOC644613, MAP2K2, MTG1, PFKL, PTDSS2, SF3A2, SLC2A11, VILL, VSIG2, and WDR18; and (c) at least 7 genes selected from the group consisting of ANXA1, C13orf33, CYP1B1, FAP, FN1, IL17RD, PDLIM4, RUNX2, and TIMP1; detecting optical information about the expression levels of the genes (a) to (c) obtained from the microarray using a microarray scanner after the applying step; sending the optical information detected in the detecting step to a CPU of a computer connected to the microarray scanner; calculating the expression levels of the genes (a) to (c), based on the optical information by the CPU; and determining whether the thyroid tumor in the subject is benign or malignant using the values calculated by the CPU in the calculating step.
Description:
BACKGROUND OF THE INVENTION
[0001] 1. Field of the Invention
[0002] The present invention relates to a system, a computer program, and a method for determining behavior of thyroid tumor.
[0003] 2. Background
[0004] A disease in which nodules (tumors) are formed in the thyroid is generally referred to as "thyroid tumor". Thyroid tumors are benign in many cases. However, among the cases, there is a case of a malignant tumor called "thyroid carcinoma". In the diagnosis of thyroid tumors, the presence of thyroid tumors is confirmed by palpation, ultrasonography or the like. When the presence of thyroid tumors can be confirmed, in order to determine behavior (whether the tumors are benign or malignant), cells are collected from the tumors by fine-needle aspiration and cytological diagnosis is performed. However, the cytological diagnosis is performed based on the observation results of the cells and thus the determination results may vary depending on the experience and skill of a tester. Like the cases of follicular adenoma (benign tumor) and follicular carcinoma (malignant tumor), there are cases which have difficulty in being determined by even a skilled tester.
[0005] In the test for thyroid carcinoma, there is also a blood test for examining thyroid hormone or tumor markers in the blood. For example, it is known that when the thyroid carcinoma is medullary carcinoma, the value of calcitonin in thyroid hormone and the value of tumor marker CEA are increased. However, if the symptoms of thyroid carcinoma are shown, the value of the tumor marker is not always increased. Thus, thyroid carcinoma cannot be diagnosed only by the results of the blood test.
[0006] On the other hand, methods based on gene expression information have been recently studied and developed as new methods for determining behavior of thyroid tumor. For example, a microarray called Afirma (registered trademark) Thyroid FNA Analysis from Veracyte, Inc. is currently commercially available. Further, Alexander E K. et al. (Preoperative Diagnosis of Benign Thyroid Nodules with Indeterminate Cytology. NEng J Med, 2012; 367: 705-715)) discloses the results obtained by determining behavior of thyroid tumor using the Thyroid FNA Analysis. Specifically, as for specimens which are not determined to be either benign or malignant in cytodiagnosis (n=265), expression information of 142 genes is analyzed using Thyroid FNA Analysis to classify them into benignancy or suspicion of malignancy. Further, the classified results are compared with the results based on histopathological diagnosis. In the histopathological diagnosis, 85 specimens of 265 specimens are determined to be malignant. In the gene expression analysis, 78 specimens of the 85 specimens are determined to be suspicious of malignancy. That is, as the classification performance, the sensitivity is 92%, the specificity is 52%, the positive predictive value (PPV) is 47%, and the negative predictive value (NPV) is 93%. If performance when follicular neoplasms which are particularly difficult to determine (n=105) are classified into a follicular adenoma (benign) and follicular carcinoma (malignant) in the cytological diagnosis is calculated, the sensitivity is 95%, the specificity is 48%, the PPV is 30%, and the NPV is 98%.
[0007] Determining behavior of thyroid tumor based on the analysis results of the gene expression is an objective means and it is considered to be useful for the tumors which are difficult to determine. However, in the case of the determination using the currently commercially available Thyroid FNA Analysis, the specificity and PPV are very low as described above. On the other hand, the thyroid tumors are benign in many cases. Therefore, in the determination method in which the specificity and PPV are low, benign tumors in many subjects are mistakenly determined to be malignant in practice. As a result, there is a possibility of performing unnecessary medical treatment on the subjects with benign tumors.
SUMMARY OF THE INVENTION
[0008] The scope of the present invention is defined solely by the appended claims, and is not affected to any degree by the statements within this summary.
[0009] The present inventors have exhaustively analyzed the expression levels of genes in diseased tissues with follicular adenoma and diseased tissues with follicular carcinoma. As a result, the present inventors have identified a gene cluster in which the expression is increased in benign and malignant tumors as a novel marker set. The present inventors have found that it is possible to determine whether thyroid tumor is a benign or malignant tumor based on the measured expression level of the marker set and it is possible to determine whether the malignant tumor is a tumor with poor prognosis, and have completed the present invention.
[0010] That is, the present invention provides a system adapted to a method for determining behavior of thyroid tumor. The system comprises a processor, and a memory, under control of said processor, including software instructions adapted to enable the system to perform operations. The operations comprise:
[0011] determining whether a thyroid tumor in a subject is benign or malignant based on the results of first, second, and third measurements;
[0012] wherein the expression levels of at least 6 genes selected from the group consisting of AIF1L, CDH16, FAM162B, FGFR2, GJB6, KCNJ13, KIAA1467, SLC25A15, TFCP2L1, TFF3, and TMEM171 in a sample collected from the subject are measured in the first measurement,
[0013] the expression levels of at least 7 genes selected from the group consisting of C4orf10, CCDC8, CD22, FAM125A, FAM174B, FBF1, GLB1L2, LOC644613, MAP2K2, MTG1, PFKL, PTDSS2, SF3A2, SLC2A11, VILL, VSIG2, and WDR18 in the sample are measured in the second measurement, and
[0014] the expression levels of at least 7 genes selected from the group consisting of ANXA1, C13orf33, CYP1B1, FAP, FN1, IL17RD, PDLIM4, RUNX2, and TIMP1 in the sample are measured in the third measurement.
[0015] Further, the present invention provides a computer program product for enabling a computer to determine behavior of thyroid tumor. The product comprises a computer readable medium, and software instructions, on the computer readable medium, for enabling the computer to perform predetermined operations. The operations comprises:
[0016] determining whether a thyroid tumor in a subject is benign or malignant based on the results of first, second, and third measurements, wherein the expression levels of at least 6 genes selected from the group consisting of AIF1L, CDH16, FAM162B, FGFR2, GJB6, KCNJ13, KIAA1467, SLC25A15, TFCP2L1, TFF3, and TMEM171 in a sample collected from the subject are measured in the first measurement,
[0017] the expression levels of at least 7 genes selected from the group consisting of C4orf10, CCDC8, CD22, FAM125A, FAM174B, FBF1, GLB1L2, LOC644613, MAP2K2, MTG1, PFKL, PTDSS2, SF3A2, SLC2A11, VILL, VSIG2, and WDR18 in the sample are measured in the second measurement, and the expression levels of at least 7 genes selected from the group consisting of ANXA1, C13orf33, CYP1B1, FAP, FN1, IL17RD, PDLIM4, RUNX2, and TIMP1 in the sample are measured in the third measurement.
[0018] Further, the present invention provides a method for determining behavior of thyroid tumor. The method comprises:
[0019] applying a sample collected from a subject with a thyroid tumor to a microarray capable of measuring the expression levels of the following genes (a) to (c):
[0020] (a) at least 6 genes selected from the group consisting of AIF1L, CDH16, FAM162B, FGFR2, GJB6, KCNJ13, KIAA1467, SLC25A15, TFCP2L1, TFF3, and TMEM171;
[0021] (b) at least 7 genes selected from the group consisting of C4orf10, CCDC8, CD22, FAM125A, FAM174B, FBF1, GLB1L2, LOC644613, MAP2K2, MTG1, PFKL, PTDSS2, SF3A2, SLC2A11, VILL, VSIG2, and WDR18; and (c) at least 7 genes selected from the group consisting of ANXA1, C13orf33, CYP1B1, FAP, FN1, IL17RD, PDLIM4, RUNX2, and TIMP1;
[0022] detecting optical information about the expression levels of the genes (a) to (c) obtained from the microarray using a microarray scanner after the applying step;
[0023] sending the optical information detected in the detecting step to a CPU of a computer connected to the microarray scanner;
[0024] calculating the expression levels of the genes (a) to (c), based on the optical information by the CPU; and
[0025] determining whether the thyroid tumor in the subject is benign or malignant using the values calculated by the CPU in the calculating step.
BRIEF DESCRIPTION OF THE DRAWINGS
[0026] FIG. 1 shows the results of cluster analysis of the expression levels of 37 genes obtained by measuring specimens with follicular neoplasm (Learning set) with a microarray;
[0027] FIG. 2 shows the results of cluster analysis of the expression levels of 37 genes obtained by measuring specimens with follicular neoplasm (Validation set) with a microarray;
[0028] FIG. 3 shows the results of cluster analysis of the expression levels of 37 genes obtained by measuring specimens with thyroid tumors other than follicular neoplasm with a microarray;
[0029] FIG. 4 shows a determination system of this embodiment;
[0030] FIG. 5 is a block diagram showing a functional configuration of the determination system shown in FIG. 4;
[0031] FIG. 6 is a block diagram showing a hardware configuration of the determination system shown in FIG. 4; and
[0032] FIG. 7 is a flow chart of the determination using the determination system shown in FIG. 4.
[0033] FIG. 8 is a table showing the determination according to the present invention.
DETAILED DESCRIPTION OF THE PREFERRED EMBODIMENTS
[0034] The preferred embodiments of the present invention will be described hereinafter with reference to the drawings.
[0035] In the determination method of the present invention, as for biological samples collected from subjects with thyroid tumors, the expression levels of at least 6 genes selected from a first gene cluster, the expression levels of at least 7 genes selected from a second gene cluster, and the expression levels of at least 7 genes selected from a third gene cluster are measured.
[0036] The term "thyroid tumors" used herein means nodules (tumors) formed in the thyroid and intends to include both benign and malignant tumors. In the art, the thyroid tumors are also referred to as "thyroid nodules" or "adenomatous goiter".
[0037] The term "determining behavior of thyroid tumor" means determining whether the thyroid tumor is benign or malignant. When the thyroid tumor is malignant, it can include determining whether the tumor is a malignant tumor with poor prognosis or a malignant tumor with good prognosis.
[0038] Here, the term "malignant tumor with poor prognosis" means a malignant tumor which has a high degree of malignancy and a high possibility of recurrence and/or metastasis among the malignant thyroid tumors and thus has a high mortality rate in patients. Further, the term "malignant tumor with good prognosis" means a malignant tumor which has a low degree of malignancy and a low possibility of recurrence and/or metastasis among the malignant thyroid tumors and thus has a low mortality rate in patients. The malignant tumor with poor prognosis largely differs in therapeutic strategies from the malignant tumor with good prognosis. Consequently, distinction between the malignant tumor with poor prognosis and the malignant tumor with good prognosis becomes useful information in determination of therapeutic strategies.
[0039] The term "subjects with thyroid tumors" used herein means subjects who are confirmed to have thyroid tumors or strongly suspected to have thyroid tumors by palpation or ultrasonography.
[0040] In this embodiment, the biological sample is not particularly limited as long as it is a sample derived from a living body which contains cells derived from the thyroid of the subject. Particularly, a sample derived from a living body which contains cells derived from the lesion site in the thyroid is preferred. Examples of the sample derived from a living body include blood, serum, plasma, lymph, cells collected by fine-needle aspiration, and tissues collected by surgery. Further, cultures obtained by culturing the cells and tissues extracted from subjects may also be used as a biological sample.
[0041] The term "gene cluster" used herein means a group consisting of plural genes.
[0042] The term "gene expression level" used herein means an amount of RNA transcribed from each gene or an amount of material reflecting the amount. Therefore, in the embodiment of the present invention, a nucleic acid (particularly RNA) is extracted from a biological sample. The amount of RNA derived from each gene contained in the nucleic acid or the amount of cRNA obtained by IVT-amplification of cDNA or cDNA obtained by reverse transcription of the RNA is measured as the gene expression level. The amount of RNA transcribed from each gene is small in many cases. Accordingly, it is preferable to measure the amount of cDNA obtained from the RNA or the amount of cRNA.
[0043] A method for extracting a nucleic acid including RNA from a biological sample is known in the art. RNA can be extracted from a biological sample by, for example, a method comprising mixing the biological sample with a treatment solution containing a surfactant which solubilizes cells or tissues (sodium cholate, sodium dodecyl sulfate etc.), physically treating (agitation, homogenization, ultrasonication etc.) the resulting mixture to release RNA contained in the biological sample into the mixed solution. Preferably, the mixed solution containing the released RNA is centrifuged to recover a supernatant, and the supernatant is extracted with phenol/chloroform to purify the RNA. The extraction and purification of RNA from the biological sample can be performed using a commercially available kit.
[0044] In the art, the base sequences themselves of the respective genes are known. These base sequences can be obtained from, for example, a known database (http://www.ncbi.nlm.nih.gov/ (provided by National Center for Biotechnology Information (NCBI)). The NCBI Accession Nos and Probe IDs of the genes, and Seq ID Nos. of oligonucleotide probes included in each probe set are shown in Table 1. The IDs are up to date as of Nov. 16, 2012. Probe ID is a number for identifying probes on GeneChip (registered trademark) Human Genome U133 Plus 2.0 Array (Affymetrix, Inc.). The base sequences of probes can be obtained from, for example, the website of Affymetrix, Inc. (http://www.affymetrix.com/analysis/index.affx).
TABLE-US-00001 TABLE 1 Seq ID Symbol Gene IDs (NCBI) Probe Set ID NOs AIF1L NM_031426 223075_s_at 1-11 CDH16 NM_004062 206517_at 12-22 FAM162B NM_001085480 228875_at 23-33 FGFR2 NM_000141, 203638_s_at 34-44 NM_001144913, NM_001144914, NM_001144915, NM_001144916, NM_001144917, NM_001144918, NM_001144919, NM_022970 GJB6 NM_001110219, 231771_at 45-55 NM_001110220, NM_001110221, NM_006783 KCNJ13 NM_001172416, 210179_at 56-66 NM_001172417, NM_002242 KIAA1467 NM_020853 213234_at 67-77 SLC25A15 NM_014252 218653_at 78-88 TFCP2L1 NM_014553 227642_at 89-99 TFF3 NM_003226 204623_at 100-110 TMEM171 NM_001161342.1, 240770_at 111-121 NM_173490 C4orf10 NR_015453 214123_s_at 122-132 CCDC8 NM_032040 223495_at 133-143 CD22 NM_001771 38521_at 144-159 FAM125A NM_138401 227864_s_at 160-170 FAM174B NM_207446 51158_at 171-186 FBF1 NM_001080542 1555288_s_at 187-197 GLB1L2 NM_138342 213713_s_at 198-208 LOC644613 BC025792 1563426_a_at 209-219 MAP2K2 NM_030662 202424_at 220-230 MTG1 NM_138384 212767_at 231-241 PFKL NM_002626, NR_024108 211065_x_at 242-252 PTDSS2 NM_030783 221005_s_at 253-263 SF3A2 NM_007165 37462_i_at 264-276 SLC2A11 NM_001024938, 232167_at 277-287 NM_001024939, NM_030807 VILL NM_015873 209950_s_at 288-298 VSIG2 NM_014312 228232_s_at 299-309 WDR18 NM_024100 209461_x_at 310-320 ANXA1 NM_000700 201012_at 321-331 C13orf33 NM_032849 227058_at 332-342 CYP1B1 NM_000104 202437_s_at 343-353 FAP NM_004460 209955_s_at 354-364 FN1 NM_002026, NM_054034, 211719_x_at 365-375 NM_212474, NM_212475, NM_212476, NM_212478, NM_212482 IL17RD NM_017563 227997_at 376-386 PDLIM4 NM_001131027, NM_003687 214175_x_at 387-397 RUNX2 NM_001015051, 232231_at 398-408 NM_001024630, NM_004348 TIMP1 NM_003254 201666_at 409-419
[0045] The 37 genes are a cluster of genes in which the fact that the expression in cases with benign and malignant tumors is increased is found out by the present inventors. Specifically, the first gene cluster is a cluster of genes in which an increase in the expression of the cases with benign tumors is more than that of the cases with malignant tumors. In addition, the second and third gene clusters are a cluster of genes in which an increase in the expression of the cases with malignant tumors is more than that of the cases with benign tumors. Further, the present inventors have found that the expression of the second gene cluster is increased, particularly in the cases of malignant tumors with poor prognosis, and the expression of the third gene cluster is increased, particularly in the cases of malignant tumors with good prognosis.
[0046] In the embodiment of the present invention, there is no particular restriction to measure the expression level of any of the genes of the first, second, and third gene clusters, and it can be arbitrarily selected. As an example, a method for measuring the expression level of at least 6 genes: AIF1L, FAM162B, FGFR2, GJB6, KIAA1467, and TFF3 of the first gene cluster, the expression level of at least 7 genes: FAM174B, MAP2K2, MTG1, PFKL, PTDSS2, SF3A2, and WDR18 of the second gene cluster, and the expression level of at least 7 genes: ANXA1, CYP1B1, FAP, IL17RD, PDLIM4, RUNX2, and TIMP1 of the third gene cluster is listed. However, the determination method of the present invention is not limited to the example.
[0047] In the embodiment of the present invention, the method for measuring the gene expression level is not particularly limited and it can be selected from any known method in the art. A measurement method using a microarray or a nucleic acid amplification method is preferred.
[0048] The microarray used for the determination method of the present invention is not particularly limited as long as it is a chip in which a nucleic acid probe having about 20 to 25 nucleotides which can specifically hybridize to cDNA or cRNA derived from RNAs transcribed from the genes or the RNAs (hereinafter, also referred to as "target nucleic acid molecule") is immobilized on an appropriate substrate. The probe can be appropriately designed based on the base sequences of the genes. Further, the microarray can be produced by any known method in the art. In the embodiment of the present invention, a commercially available microarray may be used as long as the probe which can specifically hybridize to the target nucleic acid molecule is mounted. Examples of the microarray include GeneChip (registered trademark, manufactured by Affymetrix, Inc.).
[0049] As used herein, the term "can specifically hybridize" means that a probe can hybridize to a target nucleic acid molecule under a stringent condition. The term "stringent condition" means a condition under which the probe can hybridize to the target nucleic acid molecule with a detectably higher extent than it does to a nucleic acid molecule other than the target nucleic acid molecule (e.g. more than at least two times of the background). The stringent condition generally depends on the sequences and varies depending on various circumstances. Generally, the stringent condition is selected so that it is about 5° C. lower than a thermal melting point (Tm) of the specific sequence under a certain ionic strength and pH. This Tm is a temperature at which 50% of the complementary probe hybridizes to the base sequence of the target nucleic acid molecule in equilibrium (under a certain ionic strength, pH and nucleic acid composition). Such condition may be those which are used in hybridization techniques between polynucleotides known in the art. Specifically, it may be a condition of pH 7.0 to 9.0, a salt concentration of lower than about 1.5 M Na-ion, more specifically about 0.01 to 1.0 M Na-ion concentration (or other salt), and a temperature of at least about 30° C. For example, the stringent condition in a microarray technique includes the hybridization at 37° C. in 50% formamide, 1 M NaCl, and 1% SDS; and washing at 60 to 65° C. in 0.1×SSC.
[0050] When the microarray technique is used, the target nucleic acid molecule is preferably labeled with a labeling substance known in the art. Labeling of the target nucleic acid molecule facilitates measurement of a signal from a probe on a microarray. In the embodiment of the present invention, RNA extracted from a biological sample may be labeled. Preferably, cDNA or cRNA derived from the RNA is labeled. Examples of the labeling substance include fluorescent substances, haptens such as biotin, and radioactive substances. Examples of the fluorescent substances include Cy3, Cy5, FITC, Alexa Fluor (trademark). A method for labeling RNA, cDNA, and cRNA with these labeling substances is known in the art.
[0051] In the measurement using a microarray, the gene expression level is obtained as a signal from a probe, such as fluorescence intensity, luminescence intensity or amount of current. Each of the signals may be detected using a scanner installed in a general microarray analyzer. Examples of the scanner include GeneChip (registered trademark) Scanner 3000 7G (Affymetrix, Inc.) and Illumina (registered trademark) Bead Array Reader (Illumina).
[0052] Examples of the nucleic acid amplification method suitable for the determination method of the present invention include a polymerase-chain-reaction (PCR) assay, a strand displacement activity assay, a ligase-chain-reaction assay, and a transcriptional amplification method. These nucleic acid amplification methods themselves are known in the art. As the PCR assay, for example, a real-time RT-PCR assay is listed. As the strand displacement activity assay, for example, a real-time RT-LAMP assay (refer to, for example, U.S. Pat. No. 6,410,278) is listed. As the transcriptional amplification method, for example, a TAS assay is listed. Among these methods, the real-time RT-PCR assay and the real-time RT-LAMP assay are preferred.
[0053] The primer to be used for a nucleic acid amplification method is not particularly limited as long as it is a primer which can be amplified by specific hybridization to the target nucleic acid molecule. The stringent condition in the PCR assay may be a condition of pH 7.0 to 9.0, 0.01 to 0.1 M Tris HCl, 0.05 to 0.15 M K-ion concentration (or other salt), and a temperature of at least about 55° C. Such a primer can be appropriately designed based on the base sequences of the respective genes. Further, the primer is preferably designed according to the type of the nucleic acid amplification method. The length of the primer is usually from 5 to 50 nucleotides, preferably from 10 to 40 nucleotides. The primer can be produced by any nucleic acid synthesis method known in the art.
[0054] The primer may be labeled with any labeling substance known in the art. Labeling of the primer may be performed using radioactive elements or non-radioactive molecules. Examples of the radioactive isotope include 32P, 33P, 35S, 3H, and 125I. Examples of the non-radioactive substance include ligands such as biotin, avidin, streptoavidin, and digoxigenin; hapten, pigment, and luminescent reagents such as chemiluminescent, bioluminescent, fluorescent and phosphorescent reagents.
[0055] The reaction condition of the nucleic acid amplification method varies depending on the type of the nucleic acid amplification method and the base sequences of the primer, and it can be appropriately set with reference to, for example, a method described in Molecular Cloning: A Laboratory Manual (2nd ed.) (Sambrook, J. et al. Cold Spring Harbor Laboratory Press, New York (1989)).
[0056] The gene expression level is measured as described above, followed by determining whether the thyroid tumor in the subject with thyroid tumor is benign or malignant based on the measured expression levels of genes of the first, second, and third gene clusters in the determination method of the present invention. Here, the benign tumor is not particularly limited as long as it is a thyroid tumor known to be benign in the art, and it preferably means at least one of follicular adenoma, adenomatous nodules, and cysts. Further, the malignant tumor is not particularly limited as long as it is a thyroid tumor known to be malignant in the art, and it preferably means at least one of follicular carcinoma, papillary carcinoma, poorly-differentiated carcinoma, and undifferentiated carcinoma. The malignant tumor includes a malignant tumor with poor prognosis and a malignant tumor with good prognosis.
[0057] In the embodiment of the present invention, it is preferable that the expression states of the gene clusters are compared based on the measured expression levels of genes of the first, second, and third gene clusters and the determination is performed based on the results. That is, when the expression state of the genes measured in the first measurement is more than or equal to the expression state of the genes measured in the second measurement, and when the expression state of the genes measured in the first measurement is more than or equal to the expression state of the genes measured in the third measurements, the thyroid tumor of the subject is determined to be benign. On the contrary, when the expression state of the genes measured in either the second or third measurement is more than the expression state of the genes measured in the first measurement, the thyroid tumor of the subject is determined to be malignant.
[0058] In the present invention, the term "expression state of genes selected from the gene cluster" means an indicator of the level or tendency of the gene expression in a plurality of genes selected from predetermined gene clusters. As the expression state, for example, a measure of central tendency of the expression levels (measured value) in a plurality of selected genes is listed. The measure of central tendency is not particularly limited as long as it is a statistics value which summarizes the distribution of the gene expression in a plurality of genes selected from predetermined gene clusters. Examples of the measure of central tendency include an average, a median, a maximum, and a mode. Among them, the average is particularly preferred. The term "the expression state is increased" means a measure of central tendency of the expression levels in a plurality of genes selected from certain gene clusters is higher than that of the expression levels in a plurality of genes selected from the remaining gene clusters. Therefore, when an average of the expression levels is used as an expression state of genes selected from a gene cluster, comparison of the expression states is performed as follows. As for biological samples of subjects, the sum of the expression levels of at least 6 genes selected from the first gene cluster is calculated. The calculated value is divided by the number of the selected genes to obtain an average. The same calculation is performed on at least 7 genes selected from the second and third gene clusters. Then, the obtained three averages are compared. For example, when the average in the genes selected from the first gene cluster is the highest, the thyroid tumor of the subject is determined to be benign. On the contrary, when the average in the genes selected from the second or third gene cluster is the highest, the thyroid tumor of the subject is determined to be malignant.
[0059] In the embodiment of the present invention, the expression state of genes selected from each of the gene clusters in biological samples of subjects may be obtained by using the expression level data previously obtained as for the cases with benign and malignant tumors in which behavior is determined by pathological diagnosis (control samples). For example, the multivariate analysis is performed using the expression level data previously obtained as for the control samples so that a formula which reflects or predicts the expression states of genes selected from the gene clusters can be obtained. The information on the expression states of the gene clusters in the biological samples of the subjects is obtained by using the obtained formula. Based on the information, the samples can be determined. Preferable examples of the multivariate analysis include discriminant analysis. Examples of the discriminant analysis include Fischer's linear discriminant analysis, Mahalanobis distance-based discriminant analysis, Euclid distance-based discriminant analysis, Multi-group discriminant analysis, variable selection, and canonical discriminant analysis. Among them, particularly the Euclid distance-based discriminant analysis is preferred. The Euclid distance shows similarity in gene expression patterns among the control samples and the biological samples of the subjects. The Euclid distance can be obtained as follows. Based on the expression level data of the control samples which is previously obtained, the control samples are first classified into three groups by the cluster analysis known in the art. Conveniently the three groups are referred to as "Cluster 1" with predominant expression of genes selected from the first gene cluster, "Cluster 2" with predominant expression of genes selected from the second gene cluster, and "Cluster 3" with predominant expression of genes selected from the third gene cluster, respectively. Subsequently, the data of the expression levels of the groups is plotted to calculate an average of the groups. Then, as for the average of the groups and the expression level data obtained from the biological samples of the subjects, Euclid distances among the control samples and the biological samples of the subjects are calculated.
[0060] When the Euclid distance is used, the term "expression state is increased" means that a Euclid distance between data of a certain cluster and the data of the subject is closer than an Euclid distance between data of the remaining clusters and the data of the subject. Therefore, comparison of the expression states is performed as follows. Three Euclid distances calculated are compared. For example, when the distance from Cluster 1 is the closest, the thyroid tumor of the subject is determined to be benign. On the contrary, when the distance from Cluster 2 or Cluster 3 is the closest, the thyroid tumor of the subject is determined to be malignant.
[0061] In another embodiment of the present invention, the expression states of genes selected from the gene clusters are compared based on the measured expression levels of genes of the first, second, and third gene clusters. Based on the results, behavior of thyroid tumor in a subject can be determined as follows.
[0062] That is, when the expression state of the genes measured in the first measurement is more than or equal to the expression state of the genes measured in the second measurement, and when the expression state of the genes measured in the first measurement is more than or equal to the expression state of the genes measured in the third measurement, the thyroid tumor of the subject is determined to be benign.
[0063] When the expression state of the genes measured in the second measurement is more than the genes measured in the first measurement, and when the expression state of the genes measured in the second measurement is more than or equal to the expression state of the genes measured in the third measurement, the thyroid tumor of the subject is determined to a first malignant tumor.
[0064] When the expression state of the genes measured in the third measurement is more than the expression states of the genes measured in the first and second measurements, the thyroid tumor of the subject is determined to a second malignant tumor.
[0065] The term "first malignant tumor" used herein means a malignant tumor with poor prognosis and the term "second malignant tumor" means a malignant tumor with good prognosis. The malignant tumor with poor prognosis is not particularly limited as long as it is a malignant thyroid tumor which is known to be poor prognosis in the art. Preferable examples thereof include at least one of undifferentiated carcinoma, poorly-differentiated carcinoma, and follicular carcinoma with widely invasive and/or vascular invasion. The malignant tumor with poor prognosis is not particularly limited as long as it is a malignant thyroid tumor which is known to be poor prognosis in the art. Preferable examples thereof include at least one of papillary carcinoma and follicular carcinoma without widely invasive and vascular invasion.
[0066] A marker set for determining behavior of thyroid tumor (hereinafter also referred to as "marker set") is included in the scope of the present invention. The marker set of the present invention includes at least 6 genes selected from the first gene cluster, at least 7 genes selected from the second gene cluster, and at least 7 genes selected from the third gene cluster.
[0067] In the embodiment of the present invention, there is no particular restriction to use any of the genes of the first, second, and third gene clusters as a marker, and it can be arbitrarily selected. As an example, a marker set including at least 6 genes: AIF1L, FAM162B, FGFR2, GJB6, KIAA1467, and TFF3 of the first gene cluster, at least 7 genes: FAM174B, MAP2K2, MTG1, PFKL, PTDSS2, SF3A2, and WDR18 of the second gene cluster, and at least 7 genes: ANXA1, CYP1B1, FAP, IL17RD, PDLIM4, RUNX2, and TIMP1 of the third gene cluster is listed. However, the marker set of the present invention is not limited to the example.
[0068] In the embodiment of the present invention, the expression levels of genes in a sample containing RNAs prepared from the biological sample collected from the subject is analyzed and the behavior of thyroid tumor in the subject can be determined based on the obtained expression levels. The measurement and analysis of the expression levels of the markers are the same as described above.
[0069] A kit for determining behavior of thyroid tumor (hereinafter, also referred to as "kit of the present invention") is included in the scope of the present invention. That is, the present invention provides the kit for determining behavior of thyroid tumor including a probe set or primer set for measuring the expression levels of at least 6 genes selected from the first gene cluster composed of AIF1L, CDH16, FAM162B, FGFR2, GJB6, KCNJ13, KIAA1467, SLC25A15, TFCP2L1, TFF3, and TMEM171, the expression levels of at least 7 genes selected from the second gene cluster composed of C4orf10, CCDC8, CD22, FAM125A, FAM174B, FBF1, GLB1L2, LOC644613, MAP2K2, MTG1, PFKL, PTDSS2, SF3A2, SLC2A11, VILL, VSIG2, and WDR18, and the expression levels of at least 7 genes selected from the third gene cluster composed of ANXA1, C13orf33, CYP1B1, FAP, FN1, IL17RD, PDLIM4, RUNX2, and TIMP1.
[0070] The kit of the present invention can be suitably used for the determination method of the present invention. The probe and primer sets included in the kit of the present invention are the same described in the probe or primer which can specifically hybridize to the target nucleic acid molecule. The kit of the present invention may be in the form of microarray in which the probe is immobilized on an appropriate substrate.
[0071] In the embodiment of the present invention, there is no particular restriction to include any of the probes or primer for measuring the gene expression in the kit, and it can be arbitrarily selected. As an example, a kit including a probe set or primer set for measuring at least the expression levels of AIF1L, FAM162B, FGFR2, GJB6, KIAA1467, and TFF3 of the first gene cluster, at least the expression levels of FAM174B, MAP2K2, MTG1, PFKL, PTDSS2, SF3A2, and WDR18 of the second gene cluster, and at least the expression levels of ANXA1, CYP1B1, FAP, IL17RD, PDLIM4, RUNX2, and TIMP1 of the third gene cluster is listed. However, the kit of the present invention is not limited to the example.
[0072] The determination of behavior of thyroid tumor can be performed by, for example, the determination system 1 shown in FIG. 4. Hereinafter, the present invention will be more specifically described with reference to the attached drawings; however, the present invention is not limited to the embodiment.
[0073] FIG. 1 is an outline explanatory view of a system according to one embodiment of the present invention. The determination system 1 shown in FIG. 1 includes a measurement device 2 and a computer system 3 connected to the measurement device 2.
[0074] In this embodiment, the measurement device 2 is a microarray scanner that detects a signal based on the hybridization of the probe and the target nucleic acid molecule on a microarray. The measurement device 2 detects signals corresponding to expression levels of genes selected from a first gene cluster, a second gene cluster, and a third gene cluster. Specifically, in this embodiment, the signals represent optical information. As the optical information, for example, a fluorescent signal is listed; however, the present invention is not limited only thereto. In this case, when the microarray after contact with the target nucleic acid molecule is set in the measurement device 2, the measurement device 2 obtains optical information based on the target nucleic acid molecule bound to the probe on the microarray and sends the obtained optical information to the computer system 3.
[0075] Any microarray scanner may be used as long as it can detect a signal based on the target nucleic acid molecule. The signal varies depending on the labeling substance used for labeling cDNA or cRNA in the measurement sample. Thus, as the microarray scanner, one suitable for detecting the signal from the labeling substance can be appropriately selected according to the type of the labeling substance. For example, when the labeling substance is a radioactive substance, a microarray scanner which can detect radioactive rays from the radioactive substance can be used as the measurement device 2.
[0076] When the gene expression level is detected by the nucleic acid amplification method, the measurement device 2 may be a nucleic acid amplification detector. In this case, a reaction solution containing DNA from a biological sample, an enzyme for nucleic acid amplification, and a primer is set in the measurement device 2. The nucleic acid in the reaction solution is amplified by the nucleic acid amplification method. The measurement device 2 obtains optical information such as fluorescence generated from the reaction solution by the amplification reaction or turbidity of the reaction solution and sends the optical information to the computer system 3.
[0077] The computer system 3 includes a computer main body 3a, an input device 3b, and a display unit 3c that displays specimen information, determination results, and the like. The computer system 3 receives optical information from the measurement device 2. The processor of the computer system 3 executes a program that determines behavior of thyroid tumor based on the optical information.
[0078] FIG. 5 is a block diagram showing a functional configuration of the determination system shown in FIG. 4.
[0079] The computer system 3 comprises an acquisition unit 301, a memory unit 302, a calculation unit 303, a determination unit 304, and an output unit 305 as shown in FIG. 5. The acquisition unit 301 is communicably connected to the measurement device 2 via a network. The calculation unit 303 and the determination unit 304 form a control unit 306.
[0080] The acquisition unit 301 obtains information sent from the measurement device 2.
[0081] The memory unit 302 stores a program that distinguishes behavior of thyroid tumor.
[0082] The calculation unit 303 calculates fluorescence intensity etc. using information obtained by the acquisition unit 301 and analyzes the gene expression state. As described above, as the gene expression state, for example, a measure of central tendency of the expression levels (measured values) in a plurality of selected genes is listed.
[0083] The determination unit 304 determines behavior of thyroid tumor based on the gene expression state analyzed by the calculation unit 303 and determination criteria stored in the memory unit 302.
[0084] The output unit 305 outputs determination results by the determination unit 304.
[0085] FIG. 6 is a block diagram showing a hardware configuration of the determination system shown in FIG. 4.
[0086] As shown in FIG. 6, the computer main body 3a comprises a CPU (Central Processing Unit) 30, a ROM (Read Only Memory) 121, a ROM 32, a hard disk 33, an input/output interface 34, a read-out device 35, a communication interface 36, and an image output interface 37. The CPU 30, the ROM 31, the RAM (Random Access Memory) 32, the hard disk 33, the input/output interface 34, the read-out device 35, the communication interface 36, and the image output interface 37 are data-communicably connected by a bus 38.
[0087] The CPU 30 is capable of executing the computer programs stored in the ROM 31 and the computer programs loaded in the ROM 32. The CPU 30 executes an application program to realize the blocking of the functions. Thus, the computer system functions as a terminal of a system for determining behavior of thyroid tumor.
[0088] The ROM 31 is configured by mask ROM, PROM, EPROM, EEPROM, and the like. Computer programs to be executed by the CPU 30 and data used for the same are recorded in the ROM 31.
[0089] The ROM 32 is configured by SRAM, DRAM, and the like. The ROM 32 is used to read out the computer programs recorded on the ROM 31 and the hard disc 33. In executing the computer program, the ROM 32 is used as a work region of the CPU 30.
[0090] The hard disk 33 is installed with an operating system to be executed by the CPU 30, a computer program such as an application program (computer program for determining the presence or absence of sensitivity to preoperative chemotherapy on breast cancer), and data used to execute the computer program.
[0091] The read-out device 35 is configured by a flexible disk drive, a CD-ROM drive, a DVD-ROM drive, and the like. The read-out device 35 is able to read out computer programs or data recorded on a portable recording medium 40.
[0092] The input/output interface 34 includes a serial interface such as USB, IEEE1394, and RS-232C; a parallel interface such as SCSI, IDE, and IEEE1284; and an analog interface such as D/A converter and A/D converter. The input/output interface 34 is connected to the input device 3b such as a keyboard and a mouse. Operators can use the input device 3b to input data into the computer main body 3a.
[0093] The communication interface 36 is, for example, an Ethernet (registered trademark) interface. The computer system 3 can receive optical information from the measurement device 2 through the communication interface 36 and send print data to a printer.
[0094] The image output interface 37 is connected to the display unit 3c configured by LCD, CRT, or the like. Thus, the display unit 3c can output an image signal corresponding to the image data provided from the CPU 30. The display unit 3c displays an image (screen) according to the input image signal.
[0095] Subsequently, the determination procedure by the determination system 1 will be described. FIG. 7 is a flow chart of the determination using the determination system shown in FIG. 4. Here, the present invention will be described using fluorescence information based on a nucleic acid being measured which is bound to a probe on a microarray and taking an example of the case where averages as "the expression states of genes selected from the gene clusters" are used to perform determination. However, the present invention is not limited only to the embodiment.
[0096] In step S1-1, the acquisition unit 301 of the determination system 1 first obtains fluorescence information from the measurement device 2. In step S1-2, the calculation unit 303 calculates fluorescence intensity from the fluorescence information obtained by the acquisition unit 301 and sends it to the memory unit 302.
[0097] Subsequently, in step S1-3, the calculation unit 303 calculates an average of the expression levels of a plurality of selected genes based on the fluorescence intensity stored in the memory unit 302.
[0098] Thereafter, in step S1-4, the determination unit 304 determines behavior of thyroid tumor using an average calculated by the calculation unit 303 and determination criteria stored in the memory unit 302. The determination results are sent to the output unit 305.
[0099] Thereafter, in step S1-5, the output unit 305 outputs the determination results, allows the display unit 3c to display them, and allows the printer to print them.
[0100] FIG. 8 is a view showing the method for determining behavior of thyroid tumor according to the determination of the present invention. When the conditions shown in the left column of FIG. 8 are satisfied, determination results shown in the right column of FIG. 8 are obtained. In this regard, an inequality sign ">" in FIG. 8 means that the expression state shown on the left side is accelerated more than the expression state shown on the right side is. The inequality sign with an equal sign "≧" shows that the expression state shown on the left side is accelerated more than or equal to the expression state shown on the right side.
[0101] Hereinafter, the present invention is more specifically described with reference to Examples; however, the present invention is not limited thereto.
EXAMPLES
Preparation of Biological Samples
[0102] In the following examples, the biological samples obtained as follows were used. First, pathological diagnosis of thyroid lesion tissues extracted from patients with thyroid tumors by surgery was performed. These tissues were classified into one of the cases of adenomatous goiter, follicular adenoma, follicular carcinoma (including poorly-differentiated carcinoma), and papillary carcinoma. These tissues were used as biological samples and cryopreserved at -80° C.
Example 1
1. Measurement of Gene Expression Level with Microarray
[0103] As the Learning set, tissue specimens of 25 cases which was pathologically classified into follicular neoplasm (11 cases with follicular adenoma and 14 cases with follicular carcinoma) were used. RNAs (100 to 200 ng) extracted from the specimens were amplified with GeneChip (registered trademark) 3' IVT Express Kit (Affymetrix Inc.). The amplified RNAs were added to GeneChip (registered trademark) Human Genome U133 Plus 2.0 Array (Affymetrix Inc.) to react them at 65° C. for 16 hours. The RNAs were hybridized to probes on the array. Thereafter, the hybridized probes were stained using GeneChip (registered trademark) Hybridization, Wash, and Stain Kit (Affymetrix Inc.). Subsequently, the luminescence signals were detected using Genechip (registered trademark) Scanner 3000 (Affymetrix Inc.).
2. Marker Selection
[0104] The signal value data (CELL file) obtained by a microarray was normalized by MASS using Expression Console (Affymetrix Inc.). Thereafter, the probe whose function was not clear and which had no name was removed. As for probes having overlapping genes, probes other than the probe having the highest signal were removed. As for the signal values of the remaining probes, log-conversion in the base of 2 was performed to calculate CV values of the probes. The top 5000 genes with significant change among the 25 cases (11 cases with follicular adenoma and 14 cases with follicular carcinoma) were extracted. The 5000 genes were Z-scored. On the basis of the results, unsupervised cluster analysis was performed using cluster 3.0 (open source, obtained from the following web site; http://bonsai.hgc.jp/-mdehoonisoftware/cluster/). Specifically, the analysis procedure is as follows. The Cluster ring tab in the hierarchy of Cluster 3.0 was opened. The box of [Cluster] of [Genes] and the box of [Cluster] of [Arrays] were checked. As for Similarity Metric, the box of [Correlation(Centered)] in [Genes] and [Arrays] was selected. As for Clustering Method, the box of [Centroid linkage] was selected. Thus, the cluster analysis was conducted. The results of the cluster analysis were analyzed using Java Treeview (open source, obtained from the following web site; http://sourceforge.net/projects/jtreeview/). As a result of the cluster analysis using the 5000 genes, it is found that the 25 cases are classified into three groups (Clusters 1, 2, and 3).
[0105] Subsequently, in order to narrow down the genes, 37 genes were extracted as genes in which the expression of the genes is increased according to the tree diagram of the gene side. Then, the unsupervised cluster analysis was performed using only the 37 genes thus extracted, and the 25 cases could be classified into three groups. The results are shown in FIG. 1. As shown in the region surrounded by a square in FIG. 1, in Cluster 1 the expressions of 11 genes: AIF1L, CDH16, FAM162B, FGFR2, GJB6, KCNJ13, KIAA1467, SLC25A15, TFCP2L1, TFF3, and TMEM171 are increased, in Cluster 2 the expressions of 17 genes: C4orf10, CCDC8, CD22, FAM125A, FAM174B, FBF1, GLB1L2, LOC644613, MAP2K2, MTG1, PFKL, PTDSS2, SF3A2, SLC2A11, VILL, VSIG2, and WDR18 are increased, and in Cluster 3 the expression of 9 genes: ANXA1, C13orf33, CYP1B1, FAP, FN1, IL17RD, PDLIM4, RUNX2, and TIMP1 are increased. Hereinafter, the gene clusters in which the expression is increased in Clusters 1, 2, and 3 are referred to as "first gene cluster", "second gene cluster", and "third gene cluster", respectively. Probe IDs of the genes are as shown in Table 1.
[0106] Among the 25 cases, 9 cases were classified into Cluster 1, 7 cases were classified into Cluster 2, and 9 cases were classified into Cluster 3. The gene expression-based classification was correlated with the pathology classification. As a result, it was found that follicular adenomas, i.e., benign tumors were concentrated in Cluster 1 (8 cases of 9 cases), and follicular carcinomas, i.e., malignant tumors were concentrated in Clusters 2 and 3 (Cluster 2: 6 cases of 7 cases, Cluster 3: 7 cases of 9 cases). The results are shown in Table 2 (conveniently, the tumor of the case classified into Cluster 2 is referred to as "first malignant tumor", and the tumor of the case classified into Cluster 3 is referred to as "second malignant tumor").
TABLE-US-00002 TABLE 2 37 genes Cluster 1 Cluster 2 Cluster 3 Benign First malignant Second malignant Cluster analysis tumor tumor tumor Pathological Follicular 8 1 2 classification adenoma Follicular 1 6 7 carcinoma
[0107] Accordingly, a total of 37 genes obtained by combining genes in which the expression was increased in Clusters 1, 2 and 3 were used and follicular neoplasms were classified into three groups. The cases classified into Cluster 1 were determined as follicular adenoma, and the cases classified into Cluster 2 or 3 were determined as follicular carcinoma.
Example 2
[0108] Twenty genes below were extracted from the 37 genes and the cluster analysis was performed in the same manner as in Example 1. As a result, 25 cases were classified into three groups in the same manner as in Example 1. In Cluster 1 the expressions of 6 genes: AIF1L, FAM162B, FGFR2, GJB6, KCNJ13, and TFF3 are increased, in Cluster 2 the expressions of 7 genes: FAM125A, MAP2K2, MTG1, PFKL, PTDSS2, SF3A2, and WDR18 are increased, and in Cluster 3 the expressions of 7 genes: ANXA1, CYP1B1, FAP, IL17RD, PDLIM4, RUNX2, and TIMP1 are increased. Among the 25 cases, 11 cases were classified into Cluster 1, 6 cases were classified into Cluster 2, and 8 cases were classified into Cluster 3. The results obtained by correlating the gene expression-based classification with the pathological classification are shown in Table 3.
TABLE-US-00003 TABLE 3 20 genes Cluster 1 Cluster 2 Cluster 3 Benign First malignant Second malignant Cluster analysis tumor tumor tumor Pathological Follicular 8 1 2 classification adenoma Follicular 3 5 6 carcinoma
[0109] As shown in Table 3, it was found that follicular adenomas were concentrated in Cluster 1 (8 cases of 11 cases) and follicular carcinomas were concentrated in Clusters 2 and 3 (Cluster 2: 5 cases of 6 cases, Cluster 3: 6 cases of 8 cases). Accordingly, a total of 20 genes obtained by combining genes in which the expression was increased in Clusters 1, 2 and 3 were used and follicular neoplasms were classified into three groups. The cases classified into Cluster 1 were determined as follicular adenoma, and the cases classified into Cluster 2 or 3 were determined as follicular carcinoma.
Example 3
[0110] It was examined whether the cluster was reproduced even when a specimen different from the tissue specimen used in Example 1 was used. As the Validation set, tissue specimens in 71 cases different from the Learning set (33 cases with follicular adenoma, 38 cases with follicular carcinoma) were used. RNAs were extracted from the specimens and the expression levels of the 37 genes were measured using the microarray in the same manner as described in Example 1. The signal value data (CELL file) obtained by a microarray was normalized by MASS using Expression Console (Affymetrix Inc.). The signal values of the 37 genes selected in Example 1 were extracted. The resulting values were subjected to log-conversion in the base of 2 and further the log-converted values were Z-scored. On the basis of the results, unsupervised cluster analysis was performed using cluster 3.0. The procedure of cluster analysis is the same as in Example 1. As a result, the 71 cases could be classified into three groups (refer to FIG. 2). Among the 71 cases, 27 cases were classified into Cluster 1, 24 cases were classified into Cluster 2, and 20 cases were classified into Cluster 3. The results obtained by correlating the gene expression-based classification with the pathological classification are shown in Table 4.
TABLE-US-00004 TABLE 4 37 genes Cluster 1 Cluster 2 Cluster 3 Benign First malignant Second malignant Cluster analysis tumor tumor tumor Pathological Follicular 21 6 6 classification adenoma Follicular 6 18 14 carcinoma
[0111] As shown in Table 4, it was found that follicular adenomas were concentrated in Cluster 1 (21 cases of 27 cases) and follicular carcinomas were concentrated in Clusters 2 and 3 (Cluster 2: 18 cases of 24 cases, Cluster 3: 14 cases of 20 cases). Thus, as for the determination of behavior of thyroid tumor based on the analysis of the expression levels of the 37 genes, good reproducibility was obtained. Even when the 20 genes were used, the same tendency was observed.
Example 4
[0112] It was examined whether the cluster was reproduced even when adenomatous goiter and papillary carcinoma as specimens were added to follicular adenoma and follicular carcinoma. As for 14 cases with benign tumor (8 cases with adenomatous goiter and 6 cases with follicular adenoma) and 10 cases with malignant tumors (4 cases with papillary carcinoma and 6 cases with follicular carcinoma), RNAs were extracted from the tissue specimens and the expression levels of the 37 genes were measured using the microarray in the same manner as described in Example 1. The procedure of cluster analysis is the same as in Example 1. As a result, the 24 cases could be classified into three groups (refer to FIG. 3). Among the 24 cases, 13 cases were classified into Cluster 1, 4 cases were classified into Cluster 2, and 7 cases were classified into Cluster 3. The results obtained by correlating the gene expression-based classification with the pathological classification are shown in Table 5.
TABLE-US-00005 TABLE 5 37 genes Cluster 1 Cluster 2 Cluster 3 Benign First malignant Second malignant Cluster analysis tumor tumor tumor Pathological Benign 13 0 1 classification tumor Malignant 0 4 6 tumor
[0113] As shown in Table 5, it was found that benign tumors were concentrated in Cluster 1 (13 cases of 13 cases) and malignant tumors were concentrated in Clusters 2 and 3 (Cluster 2: 4 cases of 4 cases, Cluster 3: 6 cases of 7 cases). Thus, even if tumor tissues of different types from those of the tumor tissues used when extracting the 37 genes were used as specimens, good reproducibility was obtained in the determination of behavior of thyroid tumor. Accordingly, the 37 genes were used and thyroid tumors were classified into three groups. It was found that the cases classified into Cluster 1 were determined as benign tumor, and the cases classified into Cluster 2 or 3 were determined as malignant tumor.
Example 5
[0114] In this example, in order to perform cluster classification of each case (determination of behavior of tumor) more accurately, it is intended to construct a determination formula for the expression levels of the 37 genes. As biological samples, tissue specimens in 45 cases with benign tumor (adenomatous goiter and follicular adenoma) and 42 cases with malignant tumors (papillary carcinoma and follicular carcinoma) were used. RNAs were extracted from the specimens and the expression levels of the 37 genes (signal values from probes) were measured using the microarray in the same manner as described in Example 1. The signal values were subjected to log-conversion in the base of 2. In this example, averages of the log-converted signal values as for the first, second, and third gene clusters were compared, and the determination formula for classifying each case into each Cluster was tried (hereinafter, also referred to as "determination formula (I)").
[0115] Here, the procedure of determination by the determination formula (I) will be described. First, an average of the signal values in each cluster of the first, second, and third gene clusters was calculated. Then, the resulting averages of the first, second, and third gene clusters were compared in the respective cases. The respective cases were classified into the cluster to which the gene cluster having the highest average (that is, the gene cluster in which the expression level is the most increased) belongs.
[0116] The determination formula (I) was applied to all the 87 cases and the cluster classification was performed. As a result, among the 87 cases, 38 cases were classified into Cluster 1, 23 cases were classified into Cluster 2, and 26 cases were classified into Cluster 3. The results obtained by correlating the determination formula-based classification with the pathological classification are shown in Table 6.
TABLE-US-00006 TABLE 6 37 genes Cluster 1 Cluster 2 Cluster 3 Determination formula Benign First malignant Second malignant (I) tumor tumor tumor Pathological Benign 32 6 7 classification tumor Malignant 6 17 19 tumor
[0117] As shown in Table 6, it was found that benign tumors were concentrated in Cluster 1 (32 cases of 38 cases) and malignant tumors were concentrated in Clusters 2 and 3 (Cluster 2: 17 cases of 23 cases, Cluster 3: 19 cases of 26 cases). As the performance of determination by the determination formula (I), a good performance such that the sensitivity was 86%, the specificity was 71%, the concordance rate was 78%, the PPV was 73%, and the NPV was 84% was obtained. The determination method using the 37 genes showed excellent specificity and PPV as compared with the determination method by the Afirma Thyroid FNA Analysis (a product commercially available from Veracyte, Inc.).
Example 6
[0118] The 20 genes used in Example 2 were used and classifications of 45 cases with benign tumors (adenomatous goiter and follicular adenoma) and 42 cases with malignant tumors (papillary carcinoma and follicular carcinoma) were performed by the determination formula (I) in the same manner as described in Example 5. As a result, among the 87 cases, 43 cases were classified into Cluster 1, 25 cases were classified into Cluster 2, and 19 cases were classified into Cluster 3. The results obtained by correlating the determination formula-based classification with the pathological classification are shown in Table 7.
TABLE-US-00007 TABLE 7 20 genes Cluster 1 Cluster 2 Cluster 3 Determination formula Benign First malignant Second malignant (I) tumor tumor tumor Pathological Benign 34 7 4 classification tumor Malignant 9 18 15 tumor
[0119] As shown in Table 7, it was found that benign tumors were concentrated in Cluster 1 (34 cases of 43 cases) and malignant tumors were concentrated in Clusters 2 and 3 (Cluster 2: 18 cases of 25 cases, Cluster 3: 15 cases of 19 cases). As the performance of determination by the determination formula (I), a good performance such that the sensitivity was 79%, the specificity was 76%, the concordance rate was 77%, the PPV was 75%, and the NPV was 79% was obtained. The determination method using the 20 genes showed excellent specificity and PPV as compared with the determination method by the Afirma Thyroid FNA Analysis (a product commercially available from Veracyte, Inc.).
Example 7
[0120] In this example, it is intended to construct a determination formula different from that of Example 5. As biological samples, tissue specimens in 45 cases with benign tumor (adenomatous goiter and follicular adenoma) and 42 cases with malignant tumors (papillary carcinoma and follicular carcinoma) were used. RNAs were extracted from the specimens and the expression levels of the 37 genes (signal values from probes) were measured using the microarray in the same manner as described in Example 1. In this example, the determination formula to classify the genes based on the gene expression patterns of the cases calculated by the primary linear equation and distances from the three clusters classified in Example 1 was tried (hereinafter, the formula is referred to as "determination formula (II)").
[0121] Here, the procedure of determination by the determination formula (II) will be described. In the determination formula (II), the signal values of the 37 genes as for the Learning set used in Example 1 were plotted. Differences among the expression levels for the respective clusters were used to classify the genes into three clusters. The three clusters are the same as Clusters 1, 2, and 3 in Example 1. Then, an average of signal values of the clusters was calculated. A Euclid distance between the average of the clusters and data of signal values of the 87 cases was calculated by the primary linear equation. The distances from the clusters in the respective cases were compared. The respective cases were classified into the cluster with the closest distance. As a result, among the 87 cases, 33 cases were classified into Cluster 1, 35 cases were classified into Cluster 2, and 19 cases were classified into Cluster 3. The results obtained by correlating the determination formula-based classification with the pathological classification are shown in Table 8.
TABLE-US-00008 TABLE 8 37 genes Cluster 1 Cluster 2 Cluster 3 Determination formula Benign First malignant Second malignant (II) tumor tumor tumor Pathological Benign 29 10 6 classification tumor Malignant 4 25 13 tumor
[0122] As shown in Table 8, it was found that benign tumors were concentrated in Cluster 1 (29 cases of 33 cases) and malignant tumors were concentrated in Clusters 2 and 3 (Cluster 2: 25 cases of 35 cases, Cluster 3: 13 cases of 19 cases). As the performance of determination by the determination formula (II), a good performance such that the sensitivity was 90%, the specificity was 64%, the concordance rate was 77%, the PPV was 70%, and the NPV was 88% was obtained. The determination method using the 37 genes showed excellent specificity and PPV as compared with the determination method by the Afirma Thyroid FNA Analysis (a product commercially available from Veracyte, Inc.).
Example 8
[0123] The 20 genes used in Example 2 were used and classifications of 45 cases with benign tumors (adenomatous goiter and follicular adenoma) and 42 cases with malignant tumors (papillary carcinoma and follicular carcinoma) were performed by the determination formula (II) in the same manner as described in Example 7. As a result, among the 87 cases, 33 cases were classified into Cluster 1, 29 cases were classified into Cluster 2, and 25 cases were classified into Cluster 3. The results obtained by correlating the determination formula-based classification with the pathological classification are shown in Table 9.
TABLE-US-00009 TABLE 9 20 genes Cluster 1 Cluster 2 Cluster 3 Determination formula Benign First malignant Second malignant (II) tumor tumor tumor Pathological Benign 27 11 7 classification tumor Malignant 6 18 18 tumor
[0124] As shown in Table 9, it was found that benign tumors were concentrated in Cluster 1 (27 cases of 33 cases) and malignant tumors were concentrated in Clusters 2 and 3 (Cluster 2: 18 cases of 29 cases, Cluster 3: 18 cases of 25 cases). As the performance of determination by the determination formula (II), a good performance such that the sensitivity was 86%, the specificity was 60%, the concordance rate was 72%, the PPV was 67%, and the NPV was 82% was obtained. The determination method using the 20 genes showed excellent specificity and PPV as compared with the determination method by the Afirma Thyroid FNA Analysis (a product commercially available from Veracyte, Inc.).
Example 9
[0125] In this example, a difference between Cluster 2 and Cluster 3 was examined from the viewpoint of the prognosis in malignant tumor. Among follicular carcinoma, poorly-differentiated carcinoma, widely invasive-type follicular carcinoma, and follicular carcinoma with vascular invasion are generally known as poor-prognostic malignant tumors. Here, the cases used in Example 7 include 15 cases which are malignant tumors with poor prognosis of the cases. Then, it was examined into which Cluster these cases were classified in Example 7. The results are shown in Table 10.
TABLE-US-00010 TABLE 10 37 genes Cluster 1 Cluster 2 Cluster 3 Determination formula Benign First malignant Second malignant (II) tumor tumor tumor Pathological Benign 0 0 0 classification tumor Malignant 0 11 4 tumor
[0126] As shown in Table 10, the number of cases classified into Cluster 1 was 0, the number of cases classified into Cluster 2 was 11, and the number of cases classified into Cluster 3 was 4. Thus, a greater number of cases with poor prognosis were concentrated in Cluster 2. This suggested that the case classified into Cluster 2 (the first malignant tumor) had a higher possibility of being a malignant tumor with poor prognosis as compared with the case classified into Cluster 3 (the second malignant tumor).
Sequence CWU
1
1
419125DNAHomo sapiens 1gactacccat catattcagt gtccc
25225DNAHomo sapiens 2gtccctgttc ctcactcaga gagga
25325DNAHomo sapiens 3gtcccttcat
ttcttgagac tcaac 25425DNAHomo
sapiens 4ggtctcaaga gttgtccctg gaagg
25525DNAHomo sapiens 5gggcagtctg catctatttc aggtt
25625DNAHomo sapiens 6tatttcaggt tgtggctctt ggttc
25725DNAHomo sapiens 7ctcttggttc
taggactctt acttc 25825DNAHomo
sapiens 8tctggctaag ggctcagctt cttgg
25925DNAHomo sapiens 9agcttcttgg gacttcaacc atctt
251025DNAHomo sapiens 10agtatggctt tgtccctatg
actca 251125DNAHomo sapiens
11ctgggatatc atctctacag cctgc
251225DNAHomo sapiens 12gaacacataa tccccgtggt ggtca
251325DNAHomo sapiens 13cagctcctgg ttcgagtgat cgtgt
251425DNAHomo sapiens
14tgatcgtgtg tcgctgcaac gtgga
251525DNAHomo sapiens 15gcagtgcatg cgcaaggtgg gccgc
251625DNAHomo sapiens 16catgcccacg aagctgtcgg cagtg
251725DNAHomo sapiens
17ttttcaccca ctggaccatg tcaag
251825DNAHomo sapiens 18gaagaaggac ccggatcaac cagca
251925DNAHomo sapiens 19gaaggcgact gtctgaatgg cccag
252025DNAHomo sapiens
20ggcccaggca gctctagctg ggagc
252125DNAHomo sapiens 21ctccatctga gtcccctggg agaga
252225DNAHomo sapiens 22ggacaccaac tttatggact gccca
252325DNAHomo sapiens
23gattggactc acaattatcg cctgc
252425DNAHomo sapiens 24ttatcgcctg ctttgctgtg atagt
252525DNAHomo sapiens 25agtggcgtga agaagctgca ttggc
252625DNAHomo sapiens
26gaagctgcat tggctgcaca ggcta
252725DNAHomo sapiens 27ctgaatacca tccctgtcat cagca
252825DNAHomo sapiens 28taccaaaata tctgccatgg tttta
252925DNAHomo sapiens
29tttatgtcgt gaacacctgt gtaac
253025DNAHomo sapiens 30ccattacctc ccaaacatag cagtt
253125DNAHomo sapiens 31gcagtttttc tgagtttcat cacct
253225DNAHomo sapiens
32gagtttcatc acctttgatt cattt
253325DNAHomo sapiens 33tttgattcat tttgcctgtt tttga
253425DNAHomo sapiens 34caacgtctaa ctggacttcc caaga
253525DNAHomo sapiens
35gataaatggt accagcgtcc tctta
253625DNAHomo sapiens 36aagatgcctt aatccattcc ttgag
253725DNAHomo sapiens 37ccttctgctt ctgagttgca catta
253825DNAHomo sapiens
38gcttccagac tctttgcgtt ggaga
253925DNAHomo sapiens 39gttaggatct tcaagtccca tcata
254025DNAHomo sapiens 40gggattgctt tcatctaatt ctggc
254125DNAHomo sapiens
41aggacctcac caaaagatcc agcct
254225DNAHomo sapiens 42agcctcatac ctacatcaga caaaa
254325DNAHomo sapiens 43caaaatatcg ccgttgttcc ttctg
254425DNAHomo sapiens
44tttgctttgg aaacacccac tcact
254525DNAHomo sapiens 45gatacttgct ccattcatac acaac
254625DNAHomo sapiens 46gcagtcactt tgacaggttc ctttt
254725DNAHomo sapiens
47ggttcctttt aagtggactc tctga
254825DNAHomo sapiens 48ggcttggatg tttttagttc tgact
254925DNAHomo sapiens 49ataatgactg gtcttcctta cctgg
255025DNAHomo sapiens
50gttagtttta gaattacacc acaag
255125DNAHomo sapiens 51atattgtttt gcattgtctg ttggc
255225DNAHomo sapiens 52gtgaactgtc atgatacgct taagg
255325DNAHomo sapiens
53atatattttt actgctttct gaatg
255425DNAHomo sapiens 54gcttttttaa ctcatccgtt tgcca
255525DNAHomo sapiens 55actcatccgt ttgccaatca ttgca
255625DNAHomo sapiens
56atctatgcta aaatgagccc tttcc
255725DNAHomo sapiens 57aagtcaccct atcaggtttc aaaca
255825DNAHomo sapiens 58gaaatttccc ttattcaggt ttctg
255925DNAHomo sapiens
59aatgaaagat taaccttccc cactg
256025DNAHomo sapiens 60actggtgatg acctaggcag gaatc
256125DNAHomo sapiens 61ggcaagcagg tgtgaagagc agggc
256225DNAHomo sapiens
62agcagggctc agcagcaagt cacat
256325DNAHomo sapiens 63catttttcta ctatttgacc aaaag
256425DNAHomo sapiens 64agaactctgg agtggtctaa gactg
256525DNAHomo sapiens
65atcagaccaa cagattttcc caacc
256625DNAHomo sapiens 66gattttccca acccaagact attgt
256725DNAHomo sapiens 67ggaagcttca tctgaccaat gtggg
256825DNAHomo sapiens
68cttgtgaaat gtgtccctaa gcctc
256925DNAHomo sapiens 69ccacccaccc aggtgtctaa gatag
257025DNAHomo sapiens 70agataggaca tgctcctttc tttct
257125DNAHomo sapiens
71tctctaatcc catcctgagg ttgcc
257225DNAHomo sapiens 72gcaaagccaa tatgaccact actga
257325DNAHomo sapiens 73aaatgcaagg gtcttaccct cctct
257425DNAHomo sapiens
74ttgccatccc ccaaatgtgt ggtat
257525DNAHomo sapiens 75tggtatggtg aaactaatcc cctga
257625DNAHomo sapiens 76atcccctgaa tgtgaattgc tatcc
257725DNAHomo sapiens
77ttgctatcct tattgcccta ttaaa
257825DNAHomo sapiens 78aagctttttg ctgtccatga atcct
257925DNAHomo sapiens 79catgaatcct ctgtggcaac tgtaa
258025DNAHomo sapiens
80gtcatgtctc ttgtgccatg gagct
258125DNAHomo sapiens 81gctactgagt ggtgctttat ctgaa
258225DNAHomo sapiens 82atgggactgg ctttccacag gaagt
258325DNAHomo sapiens
83gtaaactgct tcagagccca cagtc
258425DNAHomo sapiens 84ccctgctcag tgtccggaaa gaagt
258525DNAHomo sapiens 85ggaaagaagt cagtcatccc tgttg
258625DNAHomo sapiens
86ccctgttggc agtaaatctt cccac
258725DNAHomo sapiens 87tcccacaggc cgtccattag agatt
258825DNAHomo sapiens 88gtgctatttc atatctgtac tccag
258925DNAHomo sapiens
89agcagatctc atgctctcag atagg
259025DNAHomo sapiens 90gttcttttgt cacagtgctg gctct
259125DNAHomo sapiens 91cggggcttgc ttggttaacc acaga
259225DNAHomo sapiens
92ggaagcacgg ttactgtgtt ctcta
259325DNAHomo sapiens 93taaagatgta acctccacac ctttc
259425DNAHomo sapiens 94tccacacctt tctccagatt gggtg
259525DNAHomo sapiens
95aaggtggtgg gagtatctgt cgggg
259625DNAHomo sapiens 96ggcccttgga tgggtcaggt gggtg
259725DNAHomo sapiens 97tgagctcaaa gttgtcctac tgcca
259825DNAHomo sapiens
98tattttgcac ttgttactgt accat
259925DNAHomo sapiens 99tctgtatgtg ggatctgtgc ttggg
2510025DNAHomo sapiens 100tgctgaggag tacgtgggcc tgtct
2510125DNAHomo sapiens
101caaggacagg gtggactgcg gctac
2510225DNAHomo sapiens 102cccaaggagt gcaacaaccg gggct
2510325DNAHomo sapiens 103tccaggatcc ctggagtgcc
ttggt 2510425DNAHomo sapiens
104tggagtgcct tggtgtttca agccc
2510525DNAHomo sapiens 105gtttcaagcc cctgactagg aagac
2510625DNAHomo sapiens 106cagaatgcac cttctgaggc
acctc 2510725DNAHomo sapiens
107ctgtgattgc tgccaggcac tgttc
2510825DNAHomo sapiens 108attgctgcca ggcactgttc atctc
2510925DNAHomo sapiens 109tcccggcaag ctttctgctg
aaagt 2511025DNAHomo sapiens
110aagttcatat ctggagcctg atgtc
2511125DNAHomo sapiens 111gagaaattac tcctcagatt cttgc
2511225DNAHomo sapiens 112aatactctta agtgcatgta
atcaa 2511325DNAHomo sapiens
113aggggtgtca ctgttttcat cccct
2511425DNAHomo sapiens 114ggaccccaac ttcagagggt gcagc
2511525DNAHomo sapiens 115gggtgcagcc tctgaaagag
actgt 2511625DNAHomo sapiens
116gagactgtga atctatatat accat
2511725DNAHomo sapiens 117ttctgggacg aattcatctt ctgag
2511825DNAHomo sapiens 118ttccatctga attgcctcct
agata 2511925DNAHomo sapiens
119aaatgctgca gctacattct tgcct
2512025DNAHomo sapiens 120ggactctagt tcagttttat atgca
2512125DNAHomo sapiens 121atatgcaatg gatcactatt
ttatt 2512225DNAHomo sapiens
122ccatgaggct tgtccagacg cagtg
2512325DNAHomo sapiens 123aggcttgtcc agacgcagtg aacca
2512425DNAHomo sapiens 124gtccagacgc agtgaaccag
tcgca 2512525DNAHomo sapiens
125acgcagtgaa ccagtcgcag ctgat
2512625DNAHomo sapiens 126gaaccagtcg cagctgataa cacac
2512725DNAHomo sapiens 127gtcgcagctg ataacacaca
gacca 2512825DNAHomo sapiens
128ctgataacac acagaccatt cccga
2512925DNAHomo sapiens 129tcccgatccc agaggtgcat ttcag
2513025DNAHomo sapiens 130atcccagagg tgcatttcag
gattc 2513125DNAHomo sapiens
131ttctatttca tcagagacgg ggtct
2513225DNAHomo sapiens 132ggcctcccag agggttggaa ttgca
2513325DNAHomo sapiens 133gaattcgaca caatggggtt
gcgtc 2513425DNAHomo sapiens
134ggggttgcgt cacctatagt tttca
2513525DNAHomo sapiens 135gcaactcaag gtgctcagct tgata
2513625DNAHomo sapiens 136ggcaggggag aaactgactc
ctttt 2513725DNAHomo sapiens
137tctctttttt gcctgcacac ttaat
2513825DNAHomo sapiens 138cacacttaat gtggactgcc tcctt
2513925DNAHomo sapiens 139tggactgcct ccttggactt
aaaaa 2514025DNAHomo sapiens
140atttcttagc tttggacttg acaac
2514125DNAHomo sapiens 141gacaactgac gaatgctctg ggggt
2514225DNAHomo sapiens 142gtgtttatgt tgtcacttcg
cttgc 2514325DNAHomo sapiens
143cacctcaccc gatcttggtt ataag
2514425DNAHomo sapiens 144ggatctgctc gtcatcattt ttcct
2514525DNAHomo sapiens 145tcacgaatat tatgcccagt
ttctg 2514625DNAHomo sapiens
146atattatgcc cagtttctgc ctctg
2514725DNAHomo sapiens 147attatgccca gtttctgcct ctgag
2514825DNAHomo sapiens 148ttatgcccag tttctgcctc
tgagg 2514925DNAHomo sapiens
149tttctgcctc tgagggaaag cccag
2515025DNAHomo sapiens 150cctctgaggg aaagcccaga aaagg
2515125DNAHomo sapiens 151aggggcccag tcctggcctg
gcttc 2515225DNAHomo sapiens
152tggcctggct tctcctttgg aagtg
2515325DNAHomo sapiens 153tggcttctcc tttggaagtg aggca
2515425DNAHomo sapiens 154tcctttggaa gtgaggcatt
gcacg 2515525DNAHomo sapiens
155cctttggaag tgaggcattg cacgg
2515625DNAHomo sapiens 156cattgcacgg ggagacgtac gtatc
2515725DNAHomo sapiens 157ttgcacgggg agacgtacgt
atcag 2515825DNAHomo sapiens
158gacgtacgta tcagcggccc cttga
2515925DNAHomo sapiens 159atcagcggcc ccttgactct gggga
2516025DNAHomo sapiens 160ggcatccact ctgcggagga
atgac 2516125DNAHomo sapiens
161gaggaatgac tccatctacg aggcc
2516225DNAHomo sapiens 162gaggagtata actacggctt cgtgg
2516325DNAHomo sapiens 163gtataactac ggcttcgtgg
tggag 2516425DNAHomo sapiens
164aactacggct tcgtggtgga gaaga
2516525DNAHomo sapiens 165cttcgccctg caaggcgttt gctat
2516625DNAHomo sapiens 166cgccctgcaa ggcgtttgct
atctt 2516725DNAHomo sapiens
167gcaaggcgtt tgctatcttc agcca
2516825DNAHomo sapiens 168ggagctggac agaagccagt gcctt
2516925DNAHomo sapiens 169tggacagaag ccagtgcctt
taagt 2517025DNAHomo sapiens
170ctcctggcaa taaacactac ccggt
2517125DNAHomo sapiens 171cggttcttca gttttctgag aagag
2517225DNAHomo sapiens 172tcgcctctgc aggaaagagc
agagc 2517325DNAHomo sapiens
173cctctgcagg aaagagcaga gcccg
2517425DNAHomo sapiens 174gcccagcacg catggtattg ccagc
2517525DNAHomo sapiens 175tgtagtctct gctccctgca
tttca 2517625DNAHomo sapiens
176gactggcaac agaacagccg tggct
2517725DNAHomo sapiens 177aacagccgtg gctgctttat ctctc
2517825DNAHomo sapiens 178gggagcctgg ccacctcgca
gctgt 2517925DNAHomo sapiens
179ggagcctggc cacctcgcag ctgtt
2518025DNAHomo sapiens 180ccctcaacct ttgaactgga actgc
2518125DNAHomo sapiens 181aacctttgaa ctggaactgc
tggct 2518225DNAHomo sapiens
182agggttttcg acaactgcag ctgaa
2518325DNAHomo sapiens 183ttttcgacaa ctgcagctga atctc
2518425DNAHomo sapiens 184gacaactgca gctgaatctc
atgga 2518525DNAHomo sapiens
185tgaatctcat ggaaaagctg gattc
2518625DNAHomo sapiens 186ggaaaagctg gattcctctg cctta
2518725DNAHomo sapiens 187aggagggaag cctctgtgct
gctca 2518825DNAHomo sapiens
188gggaagcctc tgtgctgctc acctg
2518925DNAHomo sapiens 189aaagcccagc tcagcgggta cgcag
2519025DNAHomo sapiens 190cgcagtggag gcgacaagga
accaa 2519125DNAHomo sapiens
191ggaggcgaca aggaaccaat cacaa
2519225DNAHomo sapiens 192gacaaggaac caatcacaac tacag
2519325DNAHomo sapiens 193caatcacaac tacagaggtt
tctct 2519425DNAHomo sapiens
194tacagaggtt tctctgatcc tcctc
2519525DNAHomo sapiens 195gaggtttctc tgatcctcct ccact
2519625DNAHomo sapiens 196actcccgctg cttcaacttg
actaa 2519725DNAHomo sapiens
197gctgcttcaa cttgactaag cttaa
2519825DNAHomo sapiens 198tgcgtcttcc caagttagca ggtgt
2519925DNAHomo sapiens 199tcctggcaga agccatggcc
catgt 2520025DNAHomo sapiens
200agaaggccca gctcacatgt gagtc
2520125DNAHomo sapiens 201aggcccagct cacatgtgag tcctg
2520225DNAHomo sapiens 202cagaagccat ggcccatgtc
tgcac 2520325DNAHomo sapiens
203aaggcccagc tcacatgtga gtcct
2520425DNAHomo sapiens 204gcagaagcca tggcccatgt ctgca
2520525DNAHomo sapiens 205cccacgcccg aacagcaggg
gcaga 2520625DNAHomo sapiens
206tccttcgaag tgtgtccaag tccgc
2520725DNAHomo sapiens 207tgtccaagtc cgcatttgag ccttg
2520825DNAHomo sapiens 208ggctcactgt cctgagttgc
agtaa 2520925DNAHomo sapiens
209aggcccagcc ggaacgagat ttacg
2521025DNAHomo sapiens 210agtgcgcatg cgtagatgga gcaaa
2521125DNAHomo sapiens 211tagatggagc aaaaccgcct
ctcca 2521225DNAHomo sapiens
212atcgaccctt gggtccagca aggaa
2521325DNAHomo sapiens 213cttgggtcca gcaaggaagc cctaa
2521425DNAHomo sapiens 214ggaagcccta agtgacgtca
acctt 2521525DNAHomo sapiens
215gacgtcaacc tttgttccca tggta
2521625DNAHomo sapiens 216ttcccatggt aacgcagaac cttgg
2521725DNAHomo sapiens 217cggaaaaccg gctcagttga
cgctg 2521825DNAHomo sapiens
218cggctcagtt gacgctgcag gtaaa
2521925DNAHomo sapiens 219gttgacgctg caggtaaaaa gactt
2522025DNAHomo sapiens 220gtcacgggat ggatagccgg
cctgc 2522125DNAHomo sapiens
221atattgtgaa cgagccacct cctaa
2522225DNAHomo sapiens 222catcaagaac ccagcggagc gggcg
2522325DNAHomo sapiens 223gacctgaaga tgctcacaaa
ccaca 2522425DNAHomo sapiens
224acaaaccaca ccttcatcaa gcggt
2522525DNAHomo sapiens 225ccttcatcaa gcggtccgag gtgga
2522625DNAHomo sapiens 226gaagtggatt ttgccggctg
gttgt 2522725DNAHomo sapiens
227tgtgtaaaac cctgcggctg aacca
2522825DNAHomo sapiens 228acagcgcatg caggaacggg ggtct
2522925DNAHomo sapiens 229tgctgtgtgt ggtctcagag
gctct 2523025DNAHomo sapiens
230ctctgcttcc ttaggttaca aaaca
2523125DNAHomo sapiens 231gtgacaacgt agagcgcgtg ctgaa
2523225DNAHomo sapiens 232tgaaggtgct cacgggcacg
ggtaa 2523325DNAHomo sapiens
233tattcagcct aactatcctg cggca
2523425DNAHomo sapiens 234ctttgccctg aacttgtccg ggtag
2523525DNAHomo sapiens 235ggagggccgg aggcatgtgg
cctcc 2523625DNAHomo sapiens
236gacctcctga cctgggtggt tgagg
2523725DNAHomo sapiens 237ggttgaggct caagacagct caccc
2523825DNAHomo sapiens 238ggtccagaag ctccatgctg
gtcac 2523925DNAHomo sapiens
239atgctggtca ctagggtgct gtgct
2524025DNAHomo sapiens 240ggcccaagca ggtgggagtg gacac
2524125DNAHomo sapiens 241cctgctcagg cctcttgaga
aatgg 2524225DNAHomo sapiens
242gccgcaccct gagcatggac aaggg
2524325DNAHomo sapiens 243ggacaagggc ttctgaggcc agcca
2524425DNAHomo sapiens 244gcgccagggc tcagatgggg
cctgg 2524525DNAHomo sapiens
245tgggctgttg tgtctggagc ctgca
2524625DNAHomo sapiens 246gagcctgcag gcaggtgggg gctgc
2524725DNAHomo sapiens 247cctccggctg gtgtcttgag
accag 2524825DNAHomo sapiens
248ggacagagtg ccctggggca tccac
2524925DNAHomo sapiens 249gctgggctca ctacatgggc cagcc
2525025DNAHomo sapiens 250tgctggcgcc taggttgtgt
tgaga 2525125DNAHomo sapiens
251cacctgtcac cttttctaga aataa
2525225DNAHomo sapiens 252accctgactg tggggtgcat cggtc
2525325DNAHomo sapiens 253gaggcttctc cagagctggg
agctg 2525425DNAHomo sapiens
254tgtcacccag ccatggtgtg gtcca
2525525DNAHomo sapiens 255tccaggcagg gacatctcgg taccc
2525625DNAHomo sapiens 256tcgtccacaa acactccgtg
gctga 2525725DNAHomo sapiens
257ggctgagagg cagcggatcc aggca
2525825DNAHomo sapiens 258atccaggcag cgatgctgag ccacc
2525925DNAHomo sapiens 259accaccccgg aggacacgtg
gatga 2526025DNAHomo sapiens
260tgatggggtc agagatcact gagct
2526125DNAHomo sapiens 261gcctccgtgg ctccaaggtg agggt
2526225DNAHomo sapiens 262ggtgagggtc atcttcacga
gcaaa 2526325DNAHomo sapiens
263agtgacaacg aacgtctgag gcttc
2526425DNAHomo sapiens 264ctccgaaggc ccagggaaca tacct
2526525DNAHomo sapiens 265ccagcgccag gtgctcttgc
ctttt 2526625DNAHomo sapiens
266agcgccaggt gctcttgcct tttcc
2526725DNAHomo sapiens 267gctcttgcct tttcccactg agaga
2526825DNAHomo sapiens 268gccttttccc actgagagaa
ggctg 2526925DNAHomo sapiens
269ttcccactga gagaaggctg ctctt
2527025DNAHomo sapiens 270tcccactgag agaaggctgc tcttt
2527125DNAHomo sapiens 271ctgagagaag gctgctcttt
tgtac 2527225DNAHomo sapiens
272tgagagaagg ctgctctttt gtact
2527325DNAHomo sapiens 273gagagaaggc tgctcttttg tactg
2527425DNAHomo sapiens 274agagaaggct gctcttttgt
actgc 2527525DNAHomo sapiens
275gagaaggctg ctcttttgta ctgcc
2527625DNAHomo sapiens 276agaaggctgc tcttttgtac tgccc
2527725DNAHomo sapiens 277aggggtggcc agagccaaag
ccagc 2527825DNAHomo sapiens
278tggccagagc caaagccagc tactg
2527925DNAHomo sapiens 279ccctcctgca ttcctcattt aagga
2528025DNAHomo sapiens 280tattgagcac cctttgtgtg
cagac 2528125DNAHomo sapiens
281accctttgtg tgcagacatg gctcc
2528225DNAHomo sapiens 282gacatggctc caggtgctta gcaat
2528325DNAHomo sapiens 283gcttagcaat caatggtgag
cgtgg 2528425DNAHomo sapiens
284gtgagcgtgg tattccaggc taaag
2528525DNAHomo sapiens 285attacaggct ggttgtggca gctca
2528625DNAHomo sapiens 286tggttgtggc agctcatgac
tgtaa 2528725DNAHomo sapiens
287gtgctaacag ctctagctac tcagg
2528825DNAHomo sapiens 288gcagcatcaa ccatctctga gataa
2528925DNAHomo sapiens 289aacaacttgc ggctatccag
atggc 2529025DNAHomo sapiens
290atggccgggc aatggcaggg caggt
2529125DNAHomo sapiens 291gcagggcagg tgccgtggcc ctgca
2529225DNAHomo sapiens 292gagaatgatc tggtgcgaag
cccca 2529325DNAHomo sapiens
293tgcaccaggc tgttgaggac ctgcc
2529425DNAHomo sapiens 294tgaggacctg ccagagggcg tggac
2529525DNAHomo sapiens 295ccgcagggag ttctatctct
cagac 2529625DNAHomo sapiens
296cagactctga cttccaagat atctt
2529725DNAHomo sapiens 297tctacagcat ggccacgtgg aggca
2529825DNAHomo sapiens 298ggtcatcctc tgcgtgtcag
taaaa 2529925DNAHomo sapiens
299cagtcagagt ggacaaacct ctgtg
2530025DNAHomo sapiens 300gacaaacctc tgtgggaggc tctac
2530125DNAHomo sapiens 301tctgtgggag gctctactgc
actga 2530225DNAHomo sapiens
302ggaggctcta ctgcactgag atgca
2530325DNAHomo sapiens 303tgcactgaga tgcagctctt ccgag
2530425DNAHomo sapiens 304ggggctccta agccagtgta
caact 2530525DNAHomo sapiens
305agtgtacaac tgggtgcgtc ttgga
2530625DNAHomo sapiens 306gtacaactgg gtgcgtcttg gaact
2530725DNAHomo sapiens 307caactgggtg cgtcttggaa
ctttt 2530825DNAHomo sapiens
308gccaccaacc agatgggcag tgcat
2530925DNAHomo sapiens 309aaccagatgg gcagtgcatc ctgtg
2531025DNAHomo sapiens 310catgctgagc tcagacttca
ggccc 2531125DNAHomo sapiens
311ccacttcaac aagcacctgc tgggc
2531225DNAHomo sapiens 312cagcagggct cggagcccag ctacc
2531325DNAHomo sapiens 313ccgtcctgtg cagcaccatg
gagaa 2531425DNAHomo sapiens
314atggagaaga gcgtgctcgg cggcc
2531525DNAHomo sapiens 315tgcgcgtccg tgtgacggag ctgga
2531625DNAHomo sapiens 316gaggacgagg tgcgcaacct
gcgca 2531725DNAHomo sapiens
317acctgcgcaa gatcaatcgg gacct
2531825DNAHomo sapiens 318atcaatcggg acctgttcga cttct
2531925DNAHomo sapiens 319ggcacgcgtc acagtggtgc
tagtc 2532025DNAHomo sapiens
320agtggtgcta gtctgttttt aacaa
2532125DNAHomo sapiens 321agaaatgcct cacagctatc gtgaa
2532225DNAHomo sapiens 322gctatcgtga agtgcgccac
aagca 2532325DNAHomo sapiens
323gcgccacaag caaaccagct ttctt
2532425DNAHomo sapiens 324aaaccagctt tctttgcaga gaagc
2532525DNAHomo sapiens 325gcagagaagc ttcatcaagc
catga 2532625DNAHomo sapiens
326ggtgttggaa ctcgccataa ggcat
2532725DNAHomo sapiens 327tatggtttcc cgttctgaaa ttgac
2532825DNAHomo sapiens 328agaagatgta tggtatctcc
ctttg 2532925DNAHomo sapiens
329cctttgccaa gccatcctgg atgaa
2533025DNAHomo sapiens 330gaaactaaac attcccttga tggtc
2533125DNAHomo sapiens 331gatggtctca agctatgatc
agaag 2533225DNAHomo sapiens
332ctgtgccatc tttcactggg aggca
2533325DNAHomo sapiens 333gtttttcatc ctgccatatg acacc
2533425DNAHomo sapiens 334cacagtgagg agtagccagg
ttgct 2533525DNAHomo sapiens
335gttgctagga cagtaaccct gccac
2533625DNAHomo sapiens 336tgccacacac tgcctgaaat cggaa
2533725DNAHomo sapiens 337gcctgaaatc ggaactccct
tggcc 2533825DNAHomo sapiens
338cctccctctt aactaagtga cccat
2533925DNAHomo sapiens 339gggaagggta ttggacacgg cagcg
2534025DNAHomo sapiens 340gcagcgtcct ccttattgaa
aacac 2534125DNAHomo sapiens
341atacattttt catctcatgg ctaca
2534225DNAHomo sapiens 342tactgatgat ccttccactt atatt
2534325DNAHomo sapiens 343gaatgtattt gctgacaacc
attaa 2534425DNAHomo sapiens
344gaagttttac tccaggttat tgcaa
2534525DNAHomo sapiens 345tcatgtccca gaacttagcc tttac
2534625DNAHomo sapiens 346ttagccttta cctgtgaagt
gttac 2534725DNAHomo sapiens
347gaagtgttac tacagcctta atatt
2534825DNAHomo sapiens 348tacagcctta atattttcct agtag
2534925DNAHomo sapiens 349gtgtttttag ctgtgacaca
actgt 2535025DNAHomo sapiens
350taactcaagg ataccttctt attta
2535125DNAHomo sapiens 351aacatttata tgtagccttt actgt
2535225DNAHomo sapiens 352tagcctttac tgtttgatat
accaa 2535325DNAHomo sapiens
353ctcattactt atactgggac accat
2535425DNAHomo sapiens 354acagctttcc aaggtgacaa actcc
2535525DNAHomo sapiens 355aaactcctct atgcagtgta
tcgaa 2535625DNAHomo sapiens
356atagccatat ggggctggtc ctatg
2535725DNAHomo sapiens 357tggaggatac gtttcatcac tggcc
2535825DNAHomo sapiens 358ccttgcatct ggaactggtc
ttttc 2535925DNAHomo sapiens
359tggtatagca gtggctccag tctcc
2536025DNAHomo sapiens 360gaatattacg cgtctgtcta cacag
2536125DNAHomo sapiens 361gagagattca tgggtctccc
aacaa 2536225DNAHomo sapiens
362aatgtagact atcttctcat ccacg
2536325DNAHomo sapiens 363tgaccagaac cacggcttat ccggc
2536425DNAHomo sapiens 364acatgaccca cttcctaaag
cagtg 2536525DNAHomo sapiens
365gggagtttcc tgagggtttt ctcat
2536625DNAHomo sapiens 366aaatgagggc tgcacattgc ctgtt
2536725DNAHomo sapiens 367attgcctgtt ctgcttcgaa
gtatt 2536825DNAHomo sapiens
368gaaagcatat gcagccaacc aagat
2536925DNAHomo sapiens 369aaagtcaccc aaacacttct gcttt
2537025DNAHomo sapiens 370tgctttcact taagtgtctg
gcccg 2537125DNAHomo sapiens
371gtctggcccg caatactgta ggaac
2537225DNAHomo sapiens 372aatatccaca gtactcactt tttcc
2537325DNAHomo sapiens 373gtactcactt tttccaaatg
atcct 2537425DNAHomo sapiens
374gaaatatctt tctcttacct gttat
2537525DNAHomo sapiens 375tatgtgccaa agctttacta ctgtg
2537625DNAHomo sapiens 376aagtttggta tgtttctctc
aagaa 2537725DNAHomo sapiens
377aaagcatggt gagtccagac agcag
2537825DNAHomo sapiens 378tggaaactcc ctgttagtac gtcct
2537925DNAHomo sapiens 379ggtggttatt gatggcgttg
ccttt 2538025DNAHomo sapiens
380gttgcctttg tttcatcttt gagtt
2538125DNAHomo sapiens 381tcatctttga gtttgccctt tgtgg
2538225DNAHomo sapiens 382gtttgccctt tgtgggatct
agtgg 2538325DNAHomo sapiens
383gagcactgac agaactctta acagc
2538425DNAHomo sapiens 384aacagcgtgc tgtatttttg acatt
2538525DNAHomo sapiens 385tgacttgatt tgtacataac
tctgt 2538625DNAHomo sapiens
386gtttttgtac cttagaattt ctgca
2538725DNAHomo sapiens 387ctactactat acggctgcga gaaga
2538825DNAHomo sapiens 388atacggctgc gagaagacga
cagaa 2538925DNAHomo sapiens
389gacgacagaa gggctacgac gtggt
2539025DNAHomo sapiens 390agaagggcta cgacgtggtg gcggt
2539125DNAHomo sapiens 391ggtgtacccc aatgccaagg
tggaa 2539225DNAHomo sapiens
392gtaccccaat gccaaggtgg aactc
2539325DNAHomo sapiens 393atgccaaggt ggaactcgtc tgagc
2539425DNAHomo sapiens 394aggtggaact cgtctgagct
gggac 2539525DNAHomo sapiens
395ccctgctcgg ccggtgtaaa tatgt
2539625DNAHomo sapiens 396tgctcggccg gtgtaaatat gtttc
2539725DNAHomo sapiens 397gtgtaaatat gtttcaccct
gtccc 2539825DNAHomo sapiens
398aagacacttc ttccaaacct tgaat
2539925DNAHomo sapiens 399gatgtgtgtt tacttcatgt ttaca
2540025DNAHomo sapiens 400atcagccaaa accataactt
acaat 2540125DNAHomo sapiens
401ttggatatgc tttaccattc ttagg
2540225DNAHomo sapiens 402accattctta ggtttctgtg gaaca
2540325DNAHomo sapiens 403tttttccaat tgctattgcc
caaga 2540425DNAHomo sapiens
404gctattgccc aagaattgct ttcca
2540525DNAHomo sapiens 405gaattgcttt ccatgcacat attgt
2540625DNAHomo sapiens 406ttgtaaaaat tccgctttgt
gccac 2540725DNAHomo sapiens
407gctttgtgcc acaggtcatg attgt
2540825DNAHomo sapiens 408agggactatt tgtattgtat gttgc
2540925DNAHomo sapiens 409tcagggccaa gttcgtgggg
acacc 2541025DNAHomo sapiens
410gaccacctta taccagcgtt atgag
2541125DNAHomo sapiens 411ggttccaagc cttaggggat gccgc
2541225DNAHomo sapiens 412ggagagtgtc tgcggatact
tccac 2541325DNAHomo sapiens
413gtcccacaac cgcagcgagg agttt
2541425DNAHomo sapiens 414aggatggact cttgcacatc actac
2541525DNAHomo sapiens 415acatcactac ctgcagtttc
gtggc 2541625DNAHomo sapiens
416ccctggaaca gcctgagctt agctc
2541725DNAHomo sapiens 417tgcacagtgt ttccctgttt atcca
2541825DNAHomo sapiens 418tatccatccc ctgcaaactg
cagag 2541925DNAHomo sapiens
419ggcactcatt gcttgtggac ggacc
25
User Contributions:
Comment about this patent or add new information about this topic:
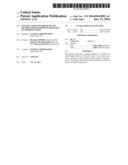 | 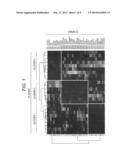 |
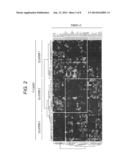 |  |
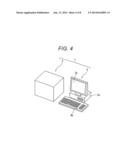 | 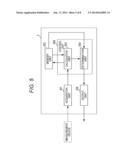 |
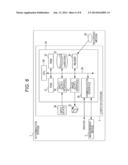 | 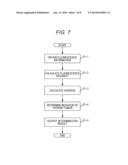 |
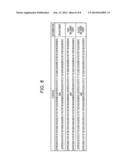 |  |
 |  |
 |  |
 |  |
 |  |
 |  |
 |  |
 |  |
 |  |
 |  |
 |  |
 |  |
 |  |
 |  |
 |  |
 |  |
 |  |
 |  |
 |  |
 |  |
 |  |
 |  |
 |  |
 |  |
 |  |
 |  |
 |  |
 |  |
 |
| New patent applications in this class: | |
| Date | Title |
|---|---|
| 2022-05-05 | Microfluidic system for amplifying and detecting polynucleotides in parallel |
| 2019-05-16 | Reagents and methods for detecting protein lysine 2-hydroxyisobutyrylation |
| 2019-05-16 | Lateral flow analyte detection |
| 2019-05-16 | Mutations in the bcr-abl tyrosine kinase associated with resistance to sti-571 |
| 2019-05-16 | Enhanced methods of ribonucleic acid hybridization |
| Top Inventors for class "Combinatorial chemistry technology: method, library, apparatus" | |
| Rank | Inventor's name |
|---|---|
| 1 | Mehdi Azimi |
| 2 | Kia Silverbrook |
| 3 | Geoffrey Richard Facer |
| 4 | Alireza Moini |
| 5 | William Marshall |