Patent application title: Materials and Methods for Determining Diagnosis and Prognosis of Prostate Cancer
Inventors:
The Regents Of The University Of California
Michael Mcclelland (Carlsbad, CA, US)
Yipeng Wang (San Diego, CA, US)
Daniel Mercola (Rancho Santa Fe, CA, US)
Xin Chen (Riverside, CA, US)
Zhenyu Jia (Irvine, CA, US)
Assignees:
THE REGENTS OF THE UNIVERSITY OF CALIFORNIA
IPC8 Class: AC12Q168FI
USPC Class:
514 44 A
Class name: Nitrogen containing hetero ring polynucleotide (e.g., rna, dna, etc.) antisense or rna interference
Publication date: 2014-01-09
Patent application number: 20140011861
Abstract:
Materials and methods related to diagnosing and/or determining prognosis
of prostate cancer.Claims:
1-12. (canceled)
13. A method for identifying a human subject as having or not having prostate cancer, comprising: (a) providing a prostate tissue sample from said subject, wherein said sample comprises prostate stromal cells; (b) performing a quantitative assay to measure expression levels for one or more genes in said stromal cells, wherein said one or more genes are prostate cancer signature genes; (c) comparing said measured expression levels to reference expression levels for said one or more genes, wherein said reference expression levels are determined in stromal cells from non-cancerous prostate tissue; and (d) determining that said measured expression levels are significantly greater or less than said reference expression levels, identifying said subject as having prostate cancer, and treating said subject for said prostate cancer.
14. The method of claim 13, wherein said prostate tissue sample does not include tumor cells.
15. The method of claim 13, wherein said prostate tissue sample includes tumor cells and stromal cells.
16. The method of claim 13, wherein said prostate cancer signature genes are selected from the genes listed in Table 3 or Table 4 herein.
17-29. (canceled)
Description:
CROSS-REFERENCE TO RELATED APPLICATIONS
[0001] This application claims benefit of priority from U.S. Provisional Application Ser. No. 61/119,996, filed on Dec. 4, 2008.
TECHNICAL FIELD
[0003] This document relates to materials and methods for determining gene expression in cells, and for diagnosing prostate cancer and assessing prognosis of prostate cancer patients.
BACKGROUND
[0004] Prostate cancer is the most common malignancy in men and is the cause of considerable morbidity and mortality (Howe et al. (2001) J. Natl. Cancer Inst. 93:824-842). It may be useful to identify genes that could be reliable early diagnostic and prognostic markers and therapeutic targets for prostate cancer, as well as other diseases and disorders.
SUMMARY
[0005] This document is based in part on the discovery that RNA expression changes can be identified that can distinguish normal prostate stroma from tumor-adjacent stroma in the absence of tumor cells, and that such expression changes can be used to signal the "presence of tumor." A linear regression method for the identification of cell-type specific expression of RNA from array data of prostate tumor-enriched samples was previously developed and validated (see, U.S. Publication No. 20060292572 and Stuart et al. (2004) Proc. Natl. Acad. Sci. USA 101:615-620, both incorporated herein by reference in their entirety). As described herein, the approach was extended to evaluate differential expression data obtained from normal volunteer prostate biopsy samples with tumor-adjacent stroma. Over a thousand gene expression changes were observed. A subset of stroma-specific genes were used to derive a classifier of 131 probe sets that accurately identified tumor or nontumor status of a large number of independent test cases. These observations indicate that tumor-adjacent stroma exhibits a larger number of gene expression changes and that subset may be selected to reliably identify tumor in the absence of tumor cells. The classifier may be useful in the diagnosis of stroma-rich biopsies of clinical cases with equivocal pathology readings.
[0006] The present disclosure includes, inter alia, the following: (1) extensive cross-validation of RNA biomarkers for prostate cancer relapse, across multiple datasets; (2) a "bi-modal" method for generating classifiers and testing them on samples that have mixed tissue; and (3) two methods for identifying genes in "reactive-stroma" that can be used as markers for the presence of cancer even when the sample does not include tumor but instead has regions of reactive stroma, near tumor.
[0007] In one aspect, this document features an in vitro method for identifying a subject as having or not having prostate cancer, comprising: (a) providing a prostate tissue sample from the subject; (b) measuring the level of expression for prostate cancer signature genes in the sample; (c) comparing the measured expression levels to reference expression levels for the prostate cancer signature genes; and (d) if the measured expression levels are significantly greater or less than the reference expression levels, identifying the subject as having prostate cancer, and if the measured expression levels are not significantly greater or less than the reference expression levels, identifying the subject as not having prostate cancer. The prostate tissue sample may not include tumor cells, or the prostate tissue sample may include tumor cells and stromal cells. The prostate cancer signature genes can be selected from the genes listed in Table 3 or Table 4 herein. The method can include determining whether measured expression levels for ten or more prostate cancer signature genes are significantly greater or less than reference expression levels for the ten or more prostate cancer signature genes, and classifying the subject as having prostate cancer that is likely to relapse if the measured expression levels are significantly greater or less than the reference expression levels, or classifying the subject as having prostate cancer not likely to relapse if the measured expression levels are not significantly greater or less than the reference expression levels. The ten or more prostate cancer signature genes can be selected from the genes listed in Table 3 or Table 4 herein. The method can include determining whether measured expression levels for twenty or more prostate cancer signature genes are significantly greater or less than reference expression levels for the twenty or more prostate cancer signature genes, and classifying the subject as having prostate cancer that is likely to relapse if the measured expression levels are significantly greater or less than the reference expression levels, or classifying the subject as having prostate cancer not likely to relapse if the measured expression levels are not significantly greater or less than the reference expression levels. The twenty or more prostate cancer signature genes can be selected from the genes listed in Table 3 or Table 4 herein.
[0008] In another aspect, this document features a method for determining the prognosis of a subject diagnosed as having prostate cancer, comprising: (a) providing a prostate tissue sample from the subject; (b) measuring the level of expression for prostate cancer signature genes in the sample; (c) comparing the measured expression levels to reference expression levels for the prostate cancer signature genes; and (d) if the measured expression levels are not significantly greater or less than the reference expression levels, identifying the subject as having a relatively better prognosis than if the measured expression levels are significantly greater or less than the reference expression levels, or if the measured expression levels are significantly greater or less than the reference expression levels, identifying the subject as having a relatively worse prognosis than if the measured expression levels are not significantly greater or less than the reference expression levels. The prostate tissue sample may not include tumor cells, or the prostate tissue sample may include tumor cells and stromal cells. The prostate cancer signature genes can be selected from the genes listed in Table 8A or 8B herein.
[0009] In another aspect, this document features a method for identifying a subject as having or not having prostate cancer, comprising: (a) providing a prostate tissue sample from the subject, wherein the sample comprises prostate stromal cells; (b) measuring expression levels for one or more genes in the stromal cells, wherein the one or more genes are prostate cancer signature genes; (c) comparing the measured expression levels to reference expression levels for the one or more genes, wherein the reference expression levels are determined in stromal cells from non-cancerous prostate tissue; and (d) if the measured expression levels are significantly greater or less than the reference expression levels, identifying the subject as having prostate cancer, and if the measured expression levels are not significantly greater or less than the reference expression levels, identifying the subject as not having prostate cancer. The prostate tissue sample may not include tumor cells, or the prostate tissue sample may include tumor cells and stromal cells. The prostate cancer signature genes can be selected from the genes listed in Table 3 or Table 4 herein.
[0010] In another aspect, this document features a method for determining a prognosis for a subject diagnosed as having prostate cancer, comprising: (a) providing a prostate tissue sample from the subject, wherein the sample comprises prostate stromal cells; (b) measuring expression levels for one or more genes in the stromal cells, wherein the one or more genes are prostate cancer signature genes; (c) comparing the measured expression levels to reference expression levels for the one or more genes, wherein the reference expression levels are determined in stromal cells from non-cancerous prostate tissue; and (d) if the measured expression levels are not significantly greater or less than the reference expression levels, identifying the subject as having a relatively better prognosis than if the measured expression levels are significantly greater or less than the reference expression levels, or if the measured expression levels are significantly greater or less than the reference expression levels, identifying the subject as having a relatively worse prognosis than if the measured expression levels are not significantly greater or less than the reference expression levels. The prostate tissue sample may not include tumor cells, or the prostate tissue sample may include tumor cells and stromal cells. The prostate cancer signature genes can be selected from the genes listed in Table 3 or Table 4 herein.
[0011] In still another aspect, this document features a method for identifying a subject as having or not having prostate cancer, comprising: (a) providing a prostate tissue sample from the subject; (b) measuring expression levels for one or more prostate cell-type predictor genes in the sample; (c) determining the percentages of tissue types in the sample based on the measured expression levels; (d) measuring expression levels for one more prostate cancer signature genes in the sample; (e) determining a classifier based on the percentages of tissue types and the measured expression levels; and (f) if the classifier falls into a predetermined range of prostate cancer classifiers, identifying the subject as having prostate cancer, or if the classifier does not fall into the predetermined range, identifying the subject as not having prostate cancer. Steps (b) and (d) can be carried out simultaneously.
[0012] This document also features a method for determining a prognosis for a subject diagnosed with and treated for prostate cancer, comprising: (a) providing a prostate tissue sample from the subject; (b) measuring expression levels for one or more prostate tissue predictor genes in the sample; (c) determining the percentages of tissue types in the sample based on the measured expression levels; (d) measuring expression levels for one more prostate cancer signature genes in the sample; (e) determining a classifier based on the percentages of tissue types and the measured expression levels; and (f) if the classifier falls into a predetermined range of prostate cancer relapse classifiers, identifying the subject as being likely to relapse, or if the classifier does not fall into the predetermined range, identifying the subject as not being likely to relapse. Steps (b) and (d) are carried out simultaneously.
[0013] In yet another aspect, this document features a method for identifying the proportion of two or more tissue types in a tissue sample, comprising: (a) using a set of other samples of known tissue proportions from a similar anatomical location as the tissue sample in an animal or plant, wherein at least two of the other samples do not contain the same relative content of each of the two or more cell types; (b) measuring overall levels of one or more gene expression or protein analytes in each of the other samples; (c) determining the regression relationship between the relative proportion of each tissue type and the measured overall levels of each gene expression or protein analyte in the other samples; (d) selecting one or more analytes that correlate with tissue proportions in the other samples; (e) measuring overall levels of one or more of the analytes in step (d) in the tissue sample; (f) matching the level of each analyte in the tissue sample with the level of the analyte in step (d) to determine the predicted proportion of each tissue type in the tissue sample; and (g) selecting among predicted tissue proportions for the tissue sample obtained in step (f) using either the median or average proportions of all the estimates. The tissue sample can contain cancer cells (e.g., prostate cancer cells).
[0014] In another aspect, this document features a method for comparing the levels of two or more analytes predicted by one or more methods to be associated with a change in a biological phenomenon in two sets of data each containing more than one measured sample, comprising: (a) selecting only analytes that are assayed in both sets of data; (b) ranking the analytes in each set of data using a comparative method such as the highest probability or lowest false discovery rate associated with the change in the biological phenomenon; (c) comparing a set of analytes in each ranked list in step (b) with each other, selecting those that occur in both lists, and determining the number of analytes that occur in both lists and show a change in level associated with the biological phenomenon that is in the same direction; and (d) calculating a concordance score based on the probability that the number of comparisons would show the observed number of change in the same direction, at random. In step (a), the length of each list can be varied to determine the maximum concordance score for the two ranked lists.
[0015] Unless otherwise defined, all technical and scientific terms used herein have the same meaning as commonly understood by one of ordinary skill in the art to which this invention pertains. Although methods and materials similar or equivalent to those described herein can be used to practice the invention, suitable methods and materials are described below. All publications, patent applications, patents, and other references mentioned herein are incorporated by reference in their entirety. In case of conflict, the present specification, including definitions, will control. In addition, the materials, methods, and examples are illustrative only and not intended to be limiting.
[0016] The details of one or more embodiments of the invention are set forth in the accompanying drawings and the description below. Other features, objects, and advantages of the invention will be apparent from the description and drawings, and from the claims.
BRIEF DESCRIPTION OF THE DRAWINGS
[0017] FIG. 1A a graph plotting the incidence numbers of 339 probe sets obtained by 105-fold permutation procedure for gene selection, as described in Example 1 herein. The dashed horizontal line marks the incidence number=50. All probe sets with an incidence of >50 were selected for training using PAM using all 15 normal biopsy and the 13 original minimum tumor-bearing stroma cases. FIGS. 1B-1E are a series of histograms plotting tumor percentage for Datasets 1-4, respectively. The tumor percentage data of FIGS. 1B and 1C were provided by SPECS pathologists, while the tumor percentage data of FIGS. 1D and 1E were estimated using CellPred. Asterisks in FIG. 1B indicate misclassified tumor-bearing cases in Dataset 1.
[0018] FIG. 2A is a Venn diagram of genes identified by differential expression analysis. "b," "t" and "a" in the plot represent normal biopsies, tumor-adjacent stroma, and rapid autopsies, respectively. FIG. 2B is a scatter plot showing differential expression of 160 probe sets in stroma cells and tumor cells. FIG. 2c is a PCA plot for a training set based on 131 selected diagnostic probe sets.
[0019] FIGS. 3A-3D are a series of scatter plots of predicted tissue percentages and pathologist estimated tissue percentages as described in Example 2 herein. X-axes: predicted tissue percentages; y-axes: pathologist estimated tissue percentages. FIG. 3A--Prediction of dataset 2 tumor percentages using models developed from dataset 1. FIG. 3B--Prediction of dataset 2 stroma percentages using models developed from dataset 1. FIG. 3C--Prediction of dataset 1 tumor percentages using models developed from dataset 2. FIG. 3D--Prediction of dataset 1 stroma percentages using models developed from dataset 2.
[0020] FIG. 4 is a series of graphs plotting predicted tissue percentages for dataset 3, as described in Example 2 herein. FIGS. 4A and 4B are histograms of predicted tumor percentages, and FIG. 4C is a plot of percentages of tumor+stroma for each individual sample.
[0021] FIG. 5 is a series of scatter plots of the differential intensity of specific genes identified as being differentially expressed between relapse and non-relapse cases found among datasets 1, 2, and 3, as described in Example 2 herein. X-axes: relapse vs. non-relapse intensity changes in dataset 1. Y-axes: relapse vs. non-relapse changes in dataset 3 (FIGS. 5A and 5B) or dataset 2 (FIG. 5c). FIG. 5A-Tumor specific genes correlating with relapse common to datasets 1 and 3. FIG. 5B-Stroma specific genes correlating with relapse common to datasets 1 and 3. FIG. 5C-Tumor specific genes correlating with relapse common to datasets 1 and 2.
[0022] FIG. 6 is a pair of graphs plotting average prediction error rates for in silico tissue component prediction discrepancies compared to pathologists' estimates using 10-fold cross validation. Solid circles: dataset 1; empty circles: dataset 2; empty squares: dataset 3; empty diamonds: dataset 4. X-axes: number of genes used in the prediction model. Y-axes: average prediction error rates (%). FIG. 6A shows prediction error rates for tumor components, and FIG. 6B shows prediction error rates for stroma components.
[0023] FIG. 7 is a pair of graphs showing tissue component predictions on publicly available datasets. FIG. 7A is a histogram plot of the in silico predicted tumor components (%) of 219 arrays that were generated from samples prepared as tumor-enriched prostate cancer samples. X-axis: in silico predicted tumor cell percentages (%). Y-axis: frequency of samples. FIG. 7B is a box-plot showing the differences of tumor tissue components in non-recurrence and recurrence groups of prostate cancer samples for dataset 5. X-axis: sample groups, NR: non-recurrence group; REC: recurrence group. Y-axis: tumor cell percentages (%).
[0024] FIG. 8 is a series of scatter plots showing predicted tissue percentages and pathologist estimated tissue percentages. X-axis: predicted tissue percentages; y-axis: pathologist estimated tissue percentages. FIG. 8A-Prediction of dataset 2 tumor percentages using models developed from dataset 1. The Pearson correlation coefficient is 0.74. FIG. 8B--Prediction of dataset 2 stroma percentages using models developed from dataset 1. The Pearson correlation coefficient is 0.70. FIG. 8C--Prediction of dataset 2 BPH percentages using models developed from dataset 1. The Pearson correlation coefficient is 0.45. FIG. 8D--Prediction of dataset 1 tumor percentages using models developed from dataset 2. The Pearson Correlation Coefficient is 0.87. FIG. 8E--Prediction of dataset 1 stroma percentages using models developed from dataset 2. The Pearson Correlation Coefficient is 0.78. FIG. 8F--Prediction of dataset 1 BPH percentages using models developed from dataset 2. The Pearson Correlation Coefficient is 0.57.
[0025] FIG. 9 is a pair of graphs plotting correlation of the amount of differential gene expression, termed gamma, between disease recurrence and disease free cases for a 91 patient case set measured on U133A GeneChips compared to an independent 86 patient case set measured on the U133A plus2 platform. Genes are identified as specific to differential expression by tumor epithelial cells, "gamma T," left panel, or stroma cells, "gamma S," right panel.
[0026] FIG. 10 is a graph plotting correlation between the quantification of stain concentration between a trained human expert and the proposed unsupervised method. Circles represent individual scores for a given tissue sample (a total of 97 samples). The line is result of unsupervised spectral unmixing for concentration estimation. The unsupervised approach is within 3% of the linear regression of the manually labeled data.
[0027] FIG. 11 is a flow diagram of the automated acquisition and visualization demonstrated on a colon cancer tissue microarray. The only inputs required are the scan area (x, y, dx, dy) and the number of cores. After these steps are completed, the images are ready for diagnosis/scoring. The image in "b" is a single field of view from a 20× objective and "c" is a montage of images acquired at 20×.
[0028] FIG. 12 is a graph plotting genes identified when different sample sizes were used (circles). The squares represent the overlap between the longest gene list (666 genes at sample size=120) and other gene lists. The other points (s and t) illustrate the overlap between each gene lists and the tumor/stroma genes identified with MLR.
[0029] FIGS. 13A and 13B are graphs representing relapse associated genes identified for tumor cells, while FIGS. 13C-13F show relapse associated genes identified for stroma cells. The circles indicate the numbers of genes identified when different sample sizes were used. The squares represent the overlap between the reference gene list and other gene lists. The other points illustrate the overlap between each gene lists and the tumor/stroma genes identified with MLR.
[0030] FIG. 14 is a graph plotting results by averaging 100 randomly selected samples when different sample sizes were used for differential expression analysis. The squares, circles, and diamonds represent specificity, sensitivity and false discovery rate, respectively.
DETAILED DESCRIPTION
[0031] Unless defined otherwise, all technical and scientific terms used herein have the same meaning as is commonly understood by one of skill in the art to which the invention(s) belong. All patents, patent applications, published applications and publications, GENBANK® sequences, websites and other published materials referred to throughout the entire disclosure herein, unless noted otherwise, are incorporated by reference in their entirety. In the event that there is a plurality of definitions for terms herein, those in this section prevail. Where reference is made to a URL or other such identifier or address, it understood that such identifiers particular information on the internet can change, equivalent information can be found by searching the internet. Reference thereto evidences the availability and public dissemination of such information.
[0032] Differential expression includes to both quantitative as well as qualitative differences in the extend of the genes' expression depending on differential development and/or tumor growth. Differentially expressed genes can represent marker genes, and/or target genes. The expression pattern of a differentially expressed gene disclosed herein can be utilized as part of a prognostic or diagnostic evaluation of a subject. The expression pattern of a differentially expressed gene can be used to identify the presence of a particular cell type in a sample. A differentially expressed gene disclosed herein can be used in methods for identifying reagents and compounds and uses of these reagents and compounds for the treatment of a subject as well as methods of treatment. The terms "biological activity," "bioactivity," "activity," and "biological function" can be used interchangeably, and can refer to an effector or antigenic function that is directly or indirectly performed by a polypeptide (whether in its native or denatured conformation), or by any fragment thereof in vivo or in vitro. Biological activities include, without limitation, binding to polypeptides, binding to other proteins or molecules, enzymatic activity, signal transduction, activity as a DNA binding protein, as a transcription regulator, and ability to bind damaged DNA. A bioactivity can be modulated by directly affecting the subject polypeptide. Alternatively, a bioactivity can be altered by modulating the level of the polypeptide, such as by modulating expression of the corresponding gene.
[0033] The term "gene expression analyte" refers to a biological molecule whose presence or concentration can be detected and correlated with gene expression. For example, a gene expression analyte can be a mRNA of a particular gene, or a fragment thereof (including, e.g., by-products of mRNA splicing and nucleolytic cleavage fragments), a protein of a particular gene or a fragment thereof (including, e.g., post-translationally modified proteins or by-products therefrom, and proteolytic fragments), and other biological molecules such as a carbohydrate, lipid or small molecule, whose presence or absence corresponds to the expression of a particular gene.
[0034] A gene expression level is to the amount of biological macromolecule produced from a gene. For example, expression levels of a particular gene can refer to the amount of protein produced from that particular gene, or can refer to the amount of mRNA produced from that particular gene. Gene expression levels can refer to an absolute (e.g., molar or gram-quantity) levels or relative (e.g., the amount relative to a standard, reference, calibration, or to another gene expression level). Typically, gene expression levels used herein are relative expression levels. As used herein in regard to determining the relationship between cell content and expression levels, gene expression levels can be considered in terms of any manner of describing gene expression known in the art. For example, regression methods that consider gene expression levels can consider the measurement of the level of a gene expression analyte, or the level calculated or estimated according to the measurement of the level of a gene expression analyte.
[0035] A marker gene is a differentially expressed gene which expression pattern can serve as part of a phenotype-indicating method, such as a predictive method, prognostic or diagnostic method, or other cell-type distinguishing evaluation, or which, alternatively, can be used in methods for identifying compounds useful for the treatment or prevention of diseases or disorders, or for identifying compounds that modulate the activity of one or more gene products.
[0036] A phenotype indicated by methods provided herein can be a diagnostic indication, a prognostic indication, or an indication of the presence of a particular cell type in a subject. Diagnostic indications include indication of a disease or a disorder in the subject, such as presence of tumor or neoplastic disease, inflammatory disease, autoimmune disease, and any other diseases known in the art that can be identified according to the presence or absence of particular cells or by the gene expression of cells. In another embodiment, prognostic indications refers to the likely or expected outcome of a disease or disorder, including, but not limited to, the likelihood of survival of the subject, likelihood of relapse, aggressiveness of the disease or disorder, indolence of the disease or disorder, and likelihood of success of a particular treatment regimen.
[0037] The phrase "gene expression levels that correspond to levels of gene expression analytes" refers to the relationship between an analyte that indicates the expression of a gene, and the actual level of expression of the gene. Typically the level of a gene expression analyte is measured in experimental methods used to determine gene expression levels. As understood by one skilled in the art, the measured gene expression levels can represent gene expression at a variety of levels of detail (e.g., the absolute amount of a gene expressed, the relative amount of gene expressed, or an indication of increased or decreased levels of expression). The level of detail at which the levels of gene expression analytes can indicate levels of gene expression can be based on a variety of factors that include the number of controls used, the number of calibration experiments or reference levels determined, and other factors known in the art. In some methods provided herein, increase in the levels of a gene expression analyte can indicate increase in the levels of the gene expressed, and a decrease in the levels of a gene expression analyte can indicate decrease in the levels of the gene expressed.
[0038] A regression relationship between relative content of a cell type and measured overall levels of a gene expression analyte is a quantitative relationship between cell type and level of gene expression analyte that is determined according to the methods provided herein based on the amount of cell type present in two or more samples and experimentally measured levels of gene expression analyte. In one embodiment, the regression relationship is determined by determining the regression of overall levels of each gene expression analyte on determined cell proportions. In one embodiment, the regression relationship is determined by linear regression, where the overall expression level or the expression analyte levle is treated as directly proportional to (e.g., linear in) cell percent either for each cell type in turn or all at once and the slopes of these linear relationships can be expressed as beta values.
[0039] As used herein, a heterogeneous sample is to a sample that contains more than one cell type. For example, a heterogeneous sample can contain stromal cells and tumor cells. Typically, as used herein, the different cell types present in a sample are present in greater than about 0.1%, 0.2%, 0.3%, 0.5%, 0.7%, 1%, 2%, 3%, 4% or 5% or greater than 0.1%, 0.2%, 0.3%, 0.5%, 0.7%, 1%, 2%, 3%, 4% or 5%. As is understood in the art, cell samples, such as tissue samples from a subject, can contain minute amounts of a variety of cell types (e.g., nerve, blood, vascular cells). However, cell types that are not present in the sample in amounts greater than about 0.1%, 0.2%, 0.3%, 0.5%, 0.7%, 1%, 2%, 3%, 4% or 5% or greater than 0.1%, 0.2%, 0.3%, 0.5%, 0.7%, 1%, 2%, 3%, 4% or 5%, are not typically considered components of the heterogeneous cell sample, as used herein.
[0040] Related cell samples can be samples that contain one or more cell types in common. Related cell samples can be samples from the same tissue type or from the same organ. Related cell samples can be from the same or different sources (e.g., same or different individuals or cell cultures, or a combination thereof). As provided herein, in the case of three or more different cell samples, it is not required that all samples contain a common cell type, but if a first sample does not contain any cell types that are present in the other samples, the first sample is not related to the other samples.
[0041] Tumor cells are cells with cytological and adherence properties consisting of nuclear and cyoplasmic features and patterns of cell-to-cell association that are known to pathologists skilled in the art as sufficient for the diagnosis as cancers of various types. In some embodiments, tumor cells have abnormal growth properties, such as neoplastic growth properties.
[0042] The "cells associated with tumor" refers to cells that, while not necessarily malignant, are present in tumorous tissues or organs or particular locations of tissues or organs, and are not present, or are present at insignificant levels, in normal tissues or organs, or in particular locations of tissues or organs.
[0043] Benign prostatic hyperplastic (BPH) cells are cells of the epithelial lining of hyperplastic prostate glands. Dilated cystic glands cells are cells of the epithelial lining of dilated (atrophic) cystic prostate glands.
[0044] Stromal cells include connective tissue cells and smooth muscle cells forming the stroma of an organ. Exemplary stromal cells are cells of the stroma of the prostate gland.
[0045] A reference refers to a value or set of related values for one or more variables. In one example, a reference gene expression level refers to a gene expression level in a particular cell type. Reference expression levels can be determined according to the methods provided herein, or by determining gene expression levels of a cell type in a homogenous sample. Reference levels can be in absolute or relative amounts, as is known in the art. In certain embodiments, a reference expression level can be indicative of the presence of a particular cell type. For example, in certain embodiments, only one particular cell type may have high levels of expression of a particular gene, and, thus, observation of a cell type with high measured expression levels can match expression levels of that particular cell type, and thereby indicate the presence of that particular cell type in the sample. In another embodiment, a reference expression level can be indicative of the absence of a particular cell type. As provided herein, two or more references can be considered in determining whether or not a particular cell type is present in a sample, and also can be considered in determining the relative amount of a particular cell type that is present in the sample.
[0046] A modified t statistic is a numerical representation of the ability of a particular gene product or indicator thereof to indicate the presence or absence of a particular cell type in a sample. A modified t statistic incorporating goodness of fit and effect size can be formulated according to known methods (see, e.g., Tusher (2001) Proc. Natl. Acad. Sci. USA 98:5116-5121), where σ.sub.β is the standard error of the coefficient, and k is a small constant, as follows:
t=β/(k+σ.sub.β)
[0047] The relative content of a cell type or cell proportion is the amount of a cell mixture that is populated by a particular cell type. Typically, heterogeneous cell mixtures contain two or more cell types, and, therefore, no single cell type makes up 100% of the mixture. Relative content can be expressed in any of a variety of forms known in the art; For example, relative content can be expressed as a percentage of the total amount of cells in a mixture, or can be expressed relative to the amount of a particular cell type. As used herein, percent cell or percent cell composition is the percent of all cells that a particular cell type accounts for in a heterologous cell mixture, such as a microscopic section sampling a tissue.
[0048] An array or matrix is an arrangement of addressable locations or addresses on a device. The locations can be arranged in two dimensional arrays, three dimensional arrays, or other matrix formats. The number of locations can range from several to at least hundreds of thousands. Most importantly, each location represents a totally independent reaction site. Arrays include but are not limited to nucleic acid arrays, protein arrays and antibody arrays. A nucleic acid array refers to an array containing nucleic acid probes, such as oligonucleotides, polynucleotides or larger portions of genes. The nucleic acid on the array can be single stranded. Arrays wherein the probes are oligonucleotides are referred to as oligonucleotide arrays or oligonucleotide chips. A microarray, herein also refers to a biochip or biological chip, an array of regions having a density of discrete regions of at least about 100/cm2, and can be at least about 1000/cm2. The regions in a microarray have typical dimensions, e.g., diameters, in the range of between about 10-250 μm, and are separated from other regions in the array by about the same distance. A protein array refers to an array containing polypeptide probes or protein probes which can be in native form or denatured. An antibody array refers to an array containing antibodies which include but are not limited to monoclonal antibodies (e.g., from a mouse), chimeric antibodies, humanized antibodies or phage antibodies and single chain antibodies as well as fragments from antibodies.
[0049] An agonist is an agent that mimics or upregulates (e.g., potentiates or supplements) the bioactivity of a protein. An agonist can be a wild-type protein or derivative thereof having at least one bioactivity of the wild-type protein. An agonist can also be a compound that upregulates expression of a gene or which increases at least one bioactivity of a protein. An agonist can also be a compound which increases the interaction of a polypeptide with another molecule, e.g., a target peptide or nucleic acid.
[0050] The terms "polynucleotide" and "nucleic acid molecule" refer to nucleotides of any length, either ribonucleotides or deoxyribonucleotides. This term refers only to the primary structure of the molecule. Thus, this term includes double- and single-stranded DNA and RNA. It also includes known types of modifications, for example, labels which are known in the art, methylation, caps, substitution of one or more of the naturally occurring nucleotides with an analog, internucleotide modifications such as, for example, those with uncharged linkages (e.g., phosphorothioates and phosphorodithioates), those containing pendant moieties, such as, for example, proteins (including, e.g., nucleases, toxins, antibodies, signal peptides, and poly-L-lysine), those with intercalators (e.g., acridine and psoralen), those containing chelators (e.g., metals and radioactive metals), those containing alkylators, those with modified linkages (e.g., alpha anomeric nucleic acids), and those containing nucleotide analogs (e.g., peptide nucleic acids), as well as unmodified forms of the polynucleotide.
[0051] A polynucleotide derived from a designated sequence typically is a polynucleotide sequence which is comprised of a sequence of approximately at least about 6 nucleotides, at least about 8 nucleotides, at least about 10-12 nucleotides, or at least about 15-20 nucleotides corresponding to a region of the designated nucleotide sequence. Corresponding polynucleotides are homologous to or complementary to a designated sequence. Typically, the sequence of the region from which the polynucleotide is derived is homologous to or complementary to a sequence that is unique to a gene provided herein.
[0052] Recombinant polypeptides are polypeptides made using recombinant techniques, i.e., through the expression of a recombinant nucleic acid. A recombinant polypeptide can be distinguished from naturally occurring polypeptide by at least one or more characteristics. For example, the polypeptide may be isolated or purified away from some or all of the proteins and compounds with which it is normally associated in its wild type host, and thus may be substantially pure. For example, an isolated polypeptide is unaccompanied by at least some of the material with which it is normally associated in its natural state, constituting at least about 0.5%, or at least about 5% by weight of the total protein in a given sample. A substantially pure polypeptide comprises at least about 50-75% by weight of the total protein, at least about 80%, or at least about 90%. The definition includes the production of a polypeptide from one organism in a different organism or host cell. Alternatively, the polypeptide may be made at a significantly higher concentration than is normally seen, through the use of an inducible promoter or high expression promoter, such that the protein is made at increased concentration levels. Alternatively, the polypeptide may be in a form not normally found in nature, as in the addition of an epitope tag or amino acid substitutions, insertions and deletions, as discussed below.
[0053] The terms "disease" and "disorder" refer to a pathological condition in an organism resulting from, e.g., infection or genetic defect, and characterized by identifiable symptoms.
[0054] The "percent sequence identity" between a particular nucleic acid or amino acid sequence and a sequence referenced by a particular sequence identification number is determined as follows. First, a nucleic acid or amino acid sequence is compared to the sequence set forth in a particular sequence identification number using the BLAST 2 Sequences (Bl2seq) program from the stand-alone version of BLASTZ containing BLASTN version 2.0.14 and BLASTP version 2.0.14. This stand-alone version of BLASTZ can be obtained from Fish & Richardson's web site (world wide web at fr.com/blast) or the United States government's National Center for Biotechnology Information web site (world wide web at ncbi.nlm.nih.gov). Instructions explaining how to use the Bl2seq program can be found in the readme file accompanying BLASTZ. Bl2seq performs a comparison between two sequences using either the BLASTN or BLASTP algorithm BLASTN is used to compare nucleic acid sequences, while BLASTP is used to compare amino acid sequences. To compare two nucleic acid sequences, the options are set as follows: -i is set to a file containing the first nucleic acid sequence to be compared (e.g., C:\seq1.txt); -j is set to a file containing the second nucleic acid sequence to be compared (e.g., C:\seq2.txt); -p is set to blastn; -o is set to any desired file name (e.g., C:\output.txt); -q is set to -1; -r is set to 2; and all other options are left at their default setting. For example, the following command can be used to generate an output file containing a comparison between two sequences: CABl2seq c:\seq1.txt -j:\seq2.txt-p blastn-o c:\output.txt -q -1-r 2. To compare two amino acid sequences, the options of Bl2seq are set as follows: -i is set to a file containing the first amino acid sequence to be compared (e.g., C:\seq1.txt); -j is set to a file containing the second amino acid sequence to be compared (e.g., C:\seq2.txt); -p is set to blastp; -o is set to any desired file name (e.g., C:\output.txt); and all other options are left at their default setting. For example, the following command can be used to generate an output file containing a comparison between two amino acid sequences: C:\Bl2seq -i c:\seq1.txt -j c:\seq2.txt -p blastp -o c:\output.txt. If the two compared sequences share homology, then the designated output file will present those regions of homology as aligned sequences. If the two compared sequences do not share homology, then the designated output file will not present aligned sequences.
[0055] Once aligned, the number of matches is determined by counting the number of positions where an identical nucleotide or amino acid residue is presented in both sequences. The percent sequence identity is determined by dividing the number of matches either by the length of the sequence set forth in the identified sequence, or by an articulated length (e.g., 100 consecutive nucleotides or amino acid residues from a sequence set forth in an identified sequence), followed by multiplying the resulting value by 100. For example, a nucleic acid sequence that has 1166 matches when aligned with a 1200 bp sequence is 97.1 percent identical to the 1200 bp sequence (i.e., 1166/1200*100=97.1). It is noted that the percent sequence identity value is rounded to the nearest tenth. For example, 75.11, 75.12, 75.13, and 75.14 is rounded down to 75.1, while 75.15, 75.16, 75.17, 75.18, and 75.19 is rounded up to 75.2. It is also noted that the length value will always be an integer. In another example, a target sequence containing a 20-nucleotide region that aligns with 20 consecutive nucleotides from an identified sequence as follows contains a region that shares 75 percent sequence identity to that identified sequence (i.e., 15/20*100=75).
[0056] Polypeptides that at least 90% identical have percent identities from 90 to 100 relative to the reference polypeptides. Identity at a level of 90% or more can be indicative of the fact that, for a polynucleotide length of 100 amino acids no more than 10% (i.e., 10 out of 100) amino acids in the test polypeptide differ from those of the reference polypeptides. Similar comparisons can be made between test and reference polynucleotides. Such differences can be represented as point mutations randomly distributed over the entire length of an amino acid sequence or they can be clustered in one or more locations of varying length up to the maximum allowable, e.g., 10/100 amino acid difference (approximately 90% identity). Differences are defined as nucleic acid or amino acid substitutions, or deletions. At the level of homologies or identities above about 85-90%, the result should be independent of the program and gap parameters set; such high levels of identity can be assessed readily, often without relying on software.
[0057] A primer refers to an oligonucleotide containing two or more deoxyribonucleotides or ribonucleotides, typically more than three, from which synthesis of a primer extension product can be initiated. Experimental conditions conducive to synthesis include the presence of nucleoside triphosphates and an agent for polymerization and extension, such as DNA polymerase, and a suitable buffer, temperature and pH.
[0058] Animals can include any animal, such as, but are not limited to, goats, cows, deer, sheep, rodents, pigs and humans. Non-human animals, exclude humans as the contemplated animal. The SPs provided herein are from any source, animal, plant, prokaryotic and fungal.
[0059] Genetic therapy can involve the transfer of heterologous nucleic acid, such as DNA, into certain cells, target cells, of a mammal, particularly a human, with a disorder or conditions for which such therapy is sought. The nucleic acid, such as DNA, is introduced into the selected target cells in a manner such that the heterologous nucleic acid, such as DNA, is expressed and a therapeutic product encoded thereby is produced. Alternatively, the heterologous nucleic acid, such as DNA, can in some manner mediate expression of DNA that encodes the therapeutic product, or it can encode a product, such as a peptide or RNA that in some manner mediates, directly or indirectly, expression of a therapeutic product. Genetic therapy can also be used to deliver nucleic acid encoding a gene product that replaces a defective gene or supplements a gene product produced by the mammal or the cell in which it is introduced. The introduced nucleic acid can encode a therapeutic compound, such as a growth factor inhibitor thereof, or a tumor necrosis factor or inhibitor thereof, such as a receptor therefor, that is not normally produced in the mammalian host or that is not produced in therapeutically effective amounts or at a therapeutically useful time. The heterologous nucleic acid, such as DNA, encoding the therapeutic product can be modified prior to introduction into the cells of the afflicted host in order to enhance or otherwise alter the product or expression thereof. Genetic therapy can also involve delivery of an inhibitor or repressor or other modulator of gene expression.
[0060] A heterologous nucleic acid is nucleic acid that encodes RNA or RNA and proteins that are not normally produced in vivo by the cell in which it is expressed or that mediates or encodes mediators that alter expression of endogenous nucleic acid, such as DNA, by affecting transcription, translation, or other regulatable biochemical processes. Heterologous nucleic acid, such as DNA, can also be referred to as foreign nucleic acid, such as DNA. Any nucleic acid, such as DNA, that one of skill in the art would recognize or consider as heterologous or foreign to the cell in which is expressed is herein encompassed by heterologous nucleic acid; heterologous nucleic acid includes exogenously added nucleic acid that is also expressed endogenously. Examples of heterologous nucleic acid include, but are not limited to, nucleic acid that encodes traceable marker proteins, such as a protein that confers drug resistance, nucleic acid that encodes therapeutically effective substances, such as anti-cancer agents, enzymes and hormones, and nucleic acid, such as DNA, that encodes other types of proteins, such as antibodies. Antibodies that are encoded by heterologous nucleic acid can be secreted or expressed on the surface of the cell in which the heterologous nucleic acid has been introduced. Heterologous nucleic acid is generally not endogenous to the cell into which it is introduced, but has been obtained from another cell or prepared synthetically. Generally, although not necessarily, such nucleic acid encodes RNA and proteins that are not normally produced by the cell in which it is now expressed.
[0061] A therapeutically effective product for gene therapy can be a product encoded by heterologous nucleic acid, typically DNA, that, upon introduction of the nucleic acid into a host, a product is expressed that ameliorates or eliminates the symptoms, manifestations of an inherited or acquired disease or that cures the disease. Also included are biologically active nucleic acid molecules, such as RNAi and antisense.
[0062] Disease or disorder treatment or compound can include any therapeutic regimen and/or agent that, when used alone or in combination with other treatments or compounds, can alleviate, reduce, ameliorate, prevent, or place or maintain in a state of remission of clinical symptoms or diagnostic markers associated with the disease or disorder.
[0063] Nucleic acids include DNA, RNA and analogs thereof, including peptide nucleic acids (PNA) and mixtures thereof. Nucleic acids can be single or double-stranded. When referring to probes or primers, optionally labeled, with a detectable label, such as a fluorescent or radiolabel, single-stranded molecules are contemplated. Such molecules are typically of a length such that their target is statistically unique or of low copy number (typically less than 5, generally less than 3) for probing or priming a library. Generally a probe or primer contains at least 14, 16 or 30 contiguous of sequence complementary to or identical a gene of interest. Probes and primers can be 10, 20, 30, 50, 100 or more nucleic acids long.
[0064] Operative linkage of heterologous nucleic acids to regulatory and effector sequences of nucleotides, such as promoters, enhancers, transcriptional and translational stop sites, and other signal sequences refers to the relationship between such nucleic acid, such as DNA, and such sequences of nucleotides. Thus, operatively linked or operationally associated refers to the functional relationship of nucleic acid, such as DNA, with regulatory and effector sequences of nucleotides, such as promoters, enhancers, transcriptional and translational stop sites, and other signal sequences. For example, operative linkage of DNA to a promoter refers to the physical and functional relationship between the DNA and the promoter such that the transcription of such DNA is initiated from the promoter by an RNA polymerase that specifically recognizes, binds to and transcribes the DNA. In order to optimize expression and/or in vitro transcription, it can be necessary to remove, add or alter 5' untranslated portions of the clones to eliminate extra, potential inappropriate alternative translation initiation (i.e., start) codons or other sequences that can interfere with or reduce expression, either at the level of transcription or translation. Alternatively, consensus ribosome binding sites (see, e.g., Kozak (1991) J. Biol. Chem. 266:19867-19870) can be inserted immediately 5' of the start codon and can enhance expression. The desirability of (or need for) such modification can be empirically determined.
[0065] A sequence complementary to at least a portion of an RNA, with reference to antisense oligonucleotides, means a sequence having sufficient complementarity to be able to hybridize with the RNA, generally under moderate or high stringency conditions, forming a stable duplex; in the case of double-stranded antisense nucleic acids, a single strand of the duplex DNA (or dsRNA) can thus be tested, or triplex formation can be assayed. The ability to hybridize depends on the degree of complementarily and the length of the antisense nucleic acid. Generally, the longer the hybridizing nucleic acid, the more base mismatches with a gene encoding RNA it can contain and still form a stable duplex (or triplex, as the case can be). One skilled in the art can ascertain a tolerable degree of mismatch by use of standard procedures to determine the melting point of the hybridized complex.
[0066] Antisense polynucleotides are synthetic sequences of nucleotide bases complementary to mRNA or the sense strand of double-stranded DNA. Admixture of sense and antisense polynucleotides under appropriate conditions leads to the binding of the two molecules, or hybridization. When these polynucleotides bind to (hybridize with) mRNA, inhibition of protein synthesis (translation) occurs. When these polynucleotides bind to double-stranded DNA, inhibition of RNA synthesis (transcription) occurs. The resulting inhibition of translation and/or transcription leads to an inhibition of the synthesis of the protein encoded by the sense strand. Antisense nucleic acid molecules typically contain a sufficient number of nucleotides to specifically bind to a target nucleic acid, generally at least 5 contiguous nucleotides, often at least 14 or 16 or 30 contiguous nucleotides or modified nucleotides complementary to the coding portion of a nucleic acid molecule that encodes a gene of interest.
[0067] An antibody is an immunoglobulin, whether natural or partially or wholly synthetically produced, including any derivative thereof that retains the specific binding ability the antibody. Hence antibody includes any protein having a binding domain that is homologous or substantially homologous to an immunoglobulin binding domain. Antibodies include members of any immunoglobulin groups, including, but not limited to, IgG, IgM, IgA, IgD, IgY and IgE.
[0068] An antibody fragment is any derivative of an antibody that is less than full-length, retaining at least a portion of the full-length antibody's specific binding ability. Examples of antibody fragments include, but are not limited to, Fab, Fab', F(ab)2, single-chain Fvs (scFV), FV, dsFV diabody and Fd fragments. The fragment can include multiple chains linked together, such as by disulfide bridges. An antibody fragment generally contains at least about 50 amino acids and typically at least 200 amino acids.
[0069] An Fv antibody fragment is composed of one variable heavy domain (VH) and one variable light domain linked by noncovalent interactions. A dsFV is an Fv with an engineered intermolecular disulfide bond, which stabilizes the VH-VL pair. An F(ab)2 fragment is an antibody fragment that results from digestion of an immunoglobulin with pepsin at pH 4.0-4.5; it can be recombinantly expressed to produce the equivalent fragment.
[0070] Fab fragments are antibody fragments that result from digestion of an immunoglobulin with papain; they can be recombinantly expressed to produce the equivalent fragment.
[0071] scFVs refer to antibody fragments that contain a variable light chain (VL) and variable heavy chain (VH) covalently connected by a polypeptide linker in any order. The linker is of a length such that the two variable domains are bridged without substantial interference. Included linkers are (Gly-Ser)n residues with some Glu or Lys residues dispersed throughout to increase solubility.
[0072] Humanized antibodies are antibodies that are modified to include human sequences of amino acids so that administration to a human does not provoke an immune response. Methods for preparation of such antibodies are known. For example, to produce such antibodies, the encoding nucleic acid in the hybridoma or other prokaryotic or eukaryotic cell, such as an E. coli or a CHO cell, that expresses the monoclonal antibody is altered by recombinant nucleic acid techniques to express an antibody in which the amino acid composition of the non-variable region is based on human antibodies. Computer programs have been designed to identify such non-variable regions.
[0073] Diabodies are dimeric scFV; diabodies typically have shorter peptide linkers than scFvs, and they generally dimerize.
[0074] The phrase "production by recombinant means by using recombinant DNA methods" refers to the use of the well known methods of molecular biology for expressing proteins encoded by cloned DNA.
[0075] An "effective amount" of a compound for treating a particular disease is an amount that is sufficient to ameliorate, or in some manner reduce the symptoms associated with the disease. Such amount can be administered as a single dosage or can be administered according to a regimen, whereby it is effective. The amount can cure the disease but, typically, is administered in order to ameliorate the symptoms of the disease. Repeated administration can be required to achieve the desired amelioration of symptoms.
[0076] A compound that modulates the activity of a gene product either decreases or increases or otherwise alters the activity of the protein or, in some manner up- or down-regulates or otherwise alters expression of the nucleic acid in a cell.
[0077] Pharmaceutically acceptable salts, esters or other derivatives of the conjugates include any salts, esters or derivatives that can be readily prepared by those of skill in this art using known methods for such derivatization and that produce compounds that can be administered to animals or humans without substantial toxic effects and that either are pharmaceutically active or are prodrugs.
[0078] A drug or compound identified by the screening methods provided herein refers to any compound that is a candidate for use as a therapeutic or as a lead compound for the design of a therapeutic. Such compounds can be small molecules, including small organic molecules, peptides, peptide mimetics, antisense molecules or dsRNA, such as RNAi, antibodies, fragments of antibodies, recombinant antibodies and other such compounds that can serve as drug candidates or lead compounds.
[0079] A non-malignant cell adjacent to a malignant cell in a subject is a cell that has a normal morphology (e.g., is not classified as neoplastic or malignant by a pathologist, cell sorter, or other cell classification method), but, while the cell was present intact in the subject, the cell was adjacent to a malignant cell or malignant cells. As provided herein, cells of a particular type (e.g., stroma) adjacent to a malignant cell or malignant cells can display an expression pattern that differs from cells of the same type that are not adjacent to a malignant cell or malignant cells. In accordance with the methods provided herein, cells that are adjacent to malignant cells can be distinguished from cells of the same type that are adjacent to non-malignant cells, according to their differential gene expression. As used herein regarding the location of cells, adjacent refers to a first cell and a second cell being sufficiently proximal such that the first cell influences the gene expression of the second cell. For example, adjacent cells can include cells that are in direct contact with each other, adjacent cell can include cells within 500 microns, 300 microns, 200 microns 100 microns or 50 microns, of each other.
[0080] A tumor is a collection of malignant cells. Malignant as applied to a cell refers to a cell that grows in an uncontrolled fashion. In some embodiments, a malignant cell can be anaplastic. In some embodiments, a malignant cell can be capable of metastasizing.
[0081] Hybridization stringency for, which can be used to determine percentage mismatch is as follows:
[0082] 1) high stringency: 0.1×SSPE, 0.1% SDS, 65° C.
[0083] 2) medium stringency: 0.2×SSPE, 0.1% SDS, 50° C.
[0084] 3) low stringency: 1.0×SSPE, 0.1% SDS, 50° C.
[0085] A vector (or plasmid) refers to discrete elements that can be used to introduce heterologous nucleic acid into cells for either expression or replication thereof. Vectors typically remain episomal, but can be designed to effect integration of a gene or portion thereof into a chromosome of the genome. Also contemplated are vectors that are artificial chromosomes, such as yeast artificial chromosomes and mammalian artificial chromosomes. Selection and use of such vehicles are well known to those of skill in the art. An expression vector includes vectors capable of expressing DNA that is operatively linked with regulatory sequences, such as promoter regions, that are capable of effecting expression of such DNA fragments. Thus, an expression vector refers to a recombinant DNA or RNA construct, such as a plasmid, a phage, recombinant virus or other vector that, upon introduction into an appropriate host cell, results in expression of the cloned DNA. Appropriate expression vectors are well known to those of skill in the art and include those that are replicable in eukaryotic cells and/or prokaryotic cells and those that remain episomal or those that integrate into the host cell genome.
[0086] Disease prognosis refers to a forecast of the probable outcome of a disease or of a probable outcome resultant from a disease. Non-limiting examples of disease prognoses include likely relapse of disease, likely aggressiveness of disease, likely indolence of disease, likelihood of survival of the subject, likelihood of success in treating a disease, condition in which a particular treatment regimen is likely to be more effective than another treatment regimen, and combinations thereof.
[0087] Aggressiveness of a tumor or malignant cell is the capacity of one or more cells to attain a position in the body away from the tissue or organ of origin, attach to another portion of the body, and multiply. Experimentally, aggressiveness can be described in one or more manners, including, but not limited to, post-diagnosis survival of subject, relapse of tumor, and metastasis of tumor. Thus, in the disclosures provided herein, data indicative of time length of survival, relapse, non-relapse, time length for metastasis, or non-metastasis, are indicative of the aggressiveness of a tumor or a malignant cell. When survival is considered, one skilled in the art will recognize that aggressiveness is inversely related to the length of time of survival of the subject. When time length for metastasis is considered, one skilled in the art will recognize that aggressiveness is directly related to the length of time of survival of a subject. As used herein, indolence refers to non-aggressiveness of a tumor or malignant cell; thus, the more aggressive a tumor or cell, the less indolent, and vice versa. As an example of a cell attaining a position in the body away from the tissue or organ of origin, a malignant prostate cell can attain an extra-prostatic position, and thus have one characteristic of an aggressive malignant cell. Attachment of cells can be, for example, on the lymph node or bone marrow of a subject, or other sites known in the art.
[0088] A composition refers to any mixture. It can be a solution, a suspension, liquid, powder, a paste, aqueous, non-aqueous or any combination thereof.
[0089] A fluid is composition that can flow. Fluids thus encompass compositions that are in the form of semi-solids, pastes, solutions, aqueous mixtures, gels, lotions, creams and other such compositions.
Cell-Type-Associated Patterns of Gene Expression
[0090] Primary tissues are composed of many (e.g., two or more) types of cells. Identification of genes expressed in a specific cell type present within a tissue in other methods can require physical separation of that cell type and the cell type's subsequent assay. Although it is possible to physically separate cells according to type, by methods such as laser capture microdissection, centrifugation, FACS, and the like, this is time consuming and costly and in certain embodiments impractical to perform. Known expression profiling assays (either RNA or protein) of primary tissues or other specimens containing multiple cell types either (1) do not take into account that multiple cell types are present or (2) physically separate the component cell types before performing the assay. Other analyses have been performed without regard to the presence of multiple cell types, thereby identifying markers indicative of a shift in the relative proportion of various cell types present in a sample, but not representative of a specific cell type. Previous analytic approaches cannot discern interactions between different types of cells.
[0091] Provided herein are methods, compositions and kits based on the development of a model, where the level of each gene product assayed can be correlated to a specific cell type. This approach for determination of cell-type-specific gene expression obviates the need for physical separation of cells from tissues or other specimens with heterogeneous cell content. Furthermore, this method permits determination of the interaction between the different types of cells contained in such heterogeneous mixtures, which would otherwise have been difficult or impossible had the cells been first physically separated and then assayed. Using the approaches provided herein, a number of biomarkers can be identified related to various diseases and disorders. Exemplified herein is the identification of biomarkers for prostate cancer and benign prostatic hypertophy. Such biomarkers can be used in diagnosis and prognosis and treatment decisions.
[0092] The methods, compositions, combinations and kits provided herein employ a regression-based approach for identification of cell-type-specific patterns of gene expression in samples containing more than one type of cell. In one example, the methods, compositions, combinations and kits provided herein employ a regression-based approach for identification of cell-type-specific patterns of gene expression in cancer. These methods, compositions, combinations and kits provided herein can be used in the identification of genes that are differentially expressed in malignant versus non-malignant cells and further identify tumor-dependent changes in gene expression of non-malignant cells associated with malignant cells relative to non-malignant cells not associated with malignant cells. The methods, compositions, combinations and kits provided herein also can be used in correlating a phenotype with gene expression in one or more cell types. For example such a method can include determining the relative content of each cell type in two or more related heterogeneous cell samples, wherein at least two of the samples do not contain the same relative content of each cell type, measuring overall levels of one or more gene expression analytes in each sample, determining the regression relationship between the relative content of each cell type and the measured overall levels, and calculating the level of each of the one or more analytes in each cell type according to the regression relationship, where gene expression levels correspond to the calculated levels of analytes. In another example such a method can include determining the relative content of each cell type in two or more related heterogeneous cell samples, wherein at least two of the samples do not contain the same relative content of each cell type, measuring overall levels of two or more gene expression analytes in each sample, determining the regression relationship between the relative content of each cell type and the measured overall levels, and calculating the level of each of the two or more analytes in each cell type according to the regression relationship, where gene expression levels correspond to the calculated levels of analytes. Such methods can further include identifying genes differentially expressed in at least one cell type relative to at least one other cell type. In such methods, the analyte can be a nucleic acid molecule and a protein.
[0093] The methods provided herein can be used for determining cell-type-specific gene expression in any heterogeneous cell population. The methods provided herein can find application in samples known to contain a variety of cell types, such as brain tissue samples and muscle tissue samples. The methods provided herein also can find application in samples in which separation of cell type can represent a tedious or time consuming operation, which is no longer required under the methods provided herein. Samples used in the present methods can be any of a variety of samples, including, but not limited to, blood, cells from blood (including, but not limited to, non-blood cells such as epithelial cells in blood), plasma, serum, spinal fluid, lymph fluid, skin, sputum, alimentary and genitourinary samples (including, but not limited to, urine, semen, seminal fluid, prostate aspirate, prostatic fluid, and fluid from the seminal vesicles), saliva, milk, tissue specimens (including, but not limited to, prostate tissue specimens), tumors, organs, and also samples of in vitro cell culture constituents.
[0094] In certain embodiments, the methods provided herein can be used to differentiate true markers of tumor cells, hyperplastic cells, and stromal cells of cancer. As exemplified herein, least squares regression using individual cell-type proportions can be used to produce clear predictions of cell-specific expression for a large number of genes. In an example provided herein applied to prostate cancer, many of these predictions are accepted on the basis of prior knowledge of prostate gene expression and biology, which provide confidence in the method. These are illustrated by numerous genes predicted to be preferentially expressed by stromal cells that are characteristic of connective tissue and only poorly expressed or absent in epithelial cells.
[0095] In some embodiments, the methods provided herein allow segregation of molecular tumor and nontumor markers into more discrete and informative groups. Thus, genes identified as tumor-associated can be further categorized into tumor versus stroma (epithelial versus mesenchymal) and tumor versus hyperplastic (perhaps reflecting true differences between the malignant cell and its hyperplastic counterpart). The methods provided herein can be used to distinguish tumor and non-tumor markers in a variety of cancers, including, without limitation, cancers classified by site such as cancer of the oral cavity and pharynx (lip, tongue, salivary gland, floor of mouth, gum and other mouth, nasopharynx, tonsil, oropharynx, hypopharynx, other oral/pharynx); cancers of the digestive system (esophagus; stomach; small intestine; colon and rectum; anus, anal canal, and anorectum; liver; intrahepatic bile duct; gallbladder; other biliary; pancreas; retroperitoneum; peritoneum, omentum, and mesentery; other digestive); cancers of the respiratory system (nasal cavity, middle ear, and sinuses; larynx; lung and bronchus; pleura; trachea, mediastinum, and other respiratory); cancers of the mesothelioma; bones and joints; and soft tissue, including heart; skin cancers, including melanomas and other non-epithelial skin cancers; Kaposi's sarcoma and breast cancer; cancer of the female genital system (cervix uteri; corpus uteri; uterus, nos; ovary; vagina; vulva; and other female genital); cancers of the male genital system (prostate gland; testis; penis; and other male genital); cancers of the urinary system (urinary bladder; kidney and renal pelvis; ureter; and other urinary); cancers of the eye and orbit; cancers of the brain and nervous system (brain; and other nervous system); cancers of the endocrine system (thyroid gland and other endocrine, including thymus); lymphomas (Hodgkin's disease and non-Hodgkin's lymphoma), multiple myeloma, and leukemias (lymphocytic leukemia; myeloid leukemia; monocytic leukemia; and other leukemias); and cancers classified by histological type, such as Neoplasm, malignant; carcinoma, NOS; carcinoma, undifferentiated, NOS; giant and spindle cell carcinoma; small cell carcinoma, NOS; papillary carcinoma, NOS; squamous cell carcinoma, NOS; lymphoepithelial carcinoma; basal cell carcinoma, NOS; pilomatrix carcinoma; transitional cell carcinoma, NOS; papillary transitional cell carcinoma; adenocarcinoma, NOS; gastrinoma, malignant; cholangiocarcinoma; hepatocellular carcinoma, NOS; combined hepatocellular carcinoma and cholangiocarcinoma; trabecular adenocarcinoma; adenoid cystic carcinoma; adenocarcinoma in adenomatous polyp; adenocarcinoma, familial polyposis coli; solid carcinoma, NOS; carcinoid tumor, malignant; bronchiolo-alveolar adenocarcinoma; papillary adenocarcinoma, NOS; ccarcinoma; acidophil carcinoma; oxyphilic adenocarcinoma; basophil carcinoma; clear cell adenocarcinoma, NOS; granular cell carcinoma; follicular adenocarcinoma, NOS; papillary and follicular adenocarcinoma; nonencapsulating sclerosing carcinoma; adrenal cortical carcinoma; endometroid carcinoma; skin appendage carcinoma; apocrine adenocarcinoma; sebaceous adenocarcinoma; ceruminous adenocarcinoma; mucoepidermoid carcinoma; cystadenocarcinoma, NOS; papillary cystadenocarcinoma, NOS; papillary serous cystadenocarcinoma; mucinous cystadenocarcinoma, NOS; mucinous adenocarcinoma; signet ring cell carcinoma; infiltrating duct carcinoma; medullary carcinoma, NOS; lobular carcinoma; inflammatory carcinoma; Paget's disease, mammary; acinar cell carcinoma; adenosquamous carcinoma; adenocarcinoma with squamous metaplasia; thymoma, malignant; ovarian stromal tumor, malignant; thecoma, malignant; granulosa cell tumor, malignant; androblastoma, malignant; Sertoli cell carcinoma; Leydig cell tumor, malignant; lipid cell tumor, malignant; paraganglioma, malignant; extra-mammary paraganglioma, malignant; pheochromocytoma; glomangiosarcoma; malignant melanoma, NOS; amelanotic melanoma; superficial spreading melanoma; malignant melanoma in giant pigmented nevus; epithelioid cell melanoma; blue nevus, malignant; sarcoma, NOS; fibrosarcoma, NOS; fibrous histiocytoma, malignant; myxosarcoma; liposarcoma, NOS; leiomyosarcoma, NOS; rhabdomyosarcoma, NOS; embryonal rhabdomyosarcoma; alveolar rhabdomyosarcoma; stromal sarcoma, NOS; mixed tumor, malignant, NOS; Mullerian mixed tumor; nephroblastoma; hepatoblastoma; carcinosarcoma, NOS; mesenchymoma, malignant; Brenner tumor, malignant; phyllodes tumor, malignant; synovial sarcoma, NOS; mesothelioma, malignant; dysgerminoma; embryonal carcinoma, NOS; teratoma, malignant, NOS; struma ovarii, malignant; choriocarcinoma; mesonephroma, malignant; hemangiosarcoma; hemangioendothelioma, malignant; Kaposi's sarcoma; hemangiopericytoma, malignant; lymphangiosarcoma; osteosarcoma, NOS; juxtacortical osteosarcoma; chondrosarcoma, NOS; chondroblastoma, malignant; mesenchymal chondrosarcoma; giant cell tumor of bone; Ewing's sarcoma; odontogenic tumor, malignant; ameloblastic odontosarcoma; ameloblastoma, malignant; ameloblastic fibrosarcoma; pinealoma, malignant; chordoma; glioma, malignant; ependymoma, NOS; astrocytoma, NOS; protoplasmic astrocytoma; fibrillary astrocytoma; astroblastoma; glioblastoma, NOS; oligodendroglioma, NOS; oligodendroblastoma; primitive neuroectodermal; cerebellar sarcoma, NOS; ganglioneuroblastoma; neuroblastoma, NOS; retinoblastoma, NOS; olfactory neurogenic tumor; meningioma, malignant; neurofibrosarcoma; neurilemmoma, malignant; granular cell tumor, malignant; malignant lymphoma, NOS; Hodgkin's disease, NOS; Hodgkin's; paragranuloma, NOS; malignant lymphoma, small lymphocytic; malignant lymphoma, large cell, diffuse; malignant lymphoma, follicular, NOS; mycosis fungoides; other specified non-Hodgkin's lymphomas; malignant histiocytosis; multiple myeloma; mast cell sarcoma; immunoproliferative small intestinal disease; leukemia, NOS; lymphoid leukemia, NOS; plasma cell leukemia; erythroleukemia; lymphosarcoma cell leukemia; myeloid leukemia, NOS; basophilic leukemia; eosinophilic leukemia; monocytic leukemia, NOS; mast cell leukemia; megakaryoblastic leukemia; myeloid sarcoma; and hairy cell leukemia.
[0096] In an example comparing the results of a prostate tissue analysis using the methods provided herein to the results of previous methods, the vast majority of markers associated with normal prostate tissues in previous microarray-based studies relate to cells of the stroma. This result is not surprising given that normal samples can be composed of a relatively greater proportion of stromal cells.
[0097] In the example of prostate analysis, the strongest single discriminator between benign prostate hyperplasia (BPH) cells and tumor cells was CK15, a result confirmed by immunohistochemistry. CK15 has previously received little attention in this context, but BPH markers play an important role in the diagnosis of ambiguous clinical cases.
[0098] Transcripts whose expression levels have high covariance with cross-products of tissue proportions suggest that expression in one cell type depends on the proportion of another tissue, as would be expected in a paracrine mechanism. The stroma transcript with the highest dependence on tumor percentage was TGF-β2. Another such stroma cell gene for which immunohistochemistry was practical was desmin, which showed altered staining in the tumor-associated stroma. In fact, a large number of typical stroma cell genes displayed dependence on the proportion of tumor, adding evidence to the speculation that tumor-associated stroma differs from non-associated stroma. Tumor-stroma paracrine signaling can be reflected in peritumor halos of altered gene expression that can present a much bigger target for detection than the tumor cells alone.
[0099] The methods provided herein provide a straightforward approach using simple and multiple linear regression to identify genes whose expression in tissue is specifically correlated with a specific cell type (e.g., in prostate tissue with either tumor cells, BPH epithelial cells or stromal cells). Context-dependent expression that is not readily attributable to single cell types is also recognized. The investigative approach described here is also applicable to a wide variety of tumor marker discovery investigations in a variety of tissues and organs. The exemplary prostate analysis results presented herein demonstrate the ability to identify a large number of gene candidates as specific products of various cells involved in prostate cancer pathogenesis.
[0100] A model for cell-specific gene expression is established by both (1) determination of the proportion of each constituent cell type (e.g., epithelium, stroma, tumor, or other discriminating entity) within a given type of tissue or specimen (e.g., prostate, breast, colon, marrow, and the like) and (2) assay of the expression profile (e.g., RNA or protein) of that same tissue or specimen. In some embodiments, cell type specific expression of a gene can be determined by fitting this model to data from a collection of tissue samples.
[0101] The methods provided herein can include a step of determining the relative content of each cell type in a heterogeneous sample. Identification of a cell type in a sample can include identifying cell types that are present in a sample in amounts greater than about 1%, 2%, 3%, 4% or 5% or greater than 1%, 2%, 3%, 4% or 5%. Any of a variety of known methods for cell type identification can be used herein.
[0102] For example, cell type can be determined by an individual skilled in the ability to identify cell types, such as a pathologist or a histologist. In another example, cell types can be determined by cell sorting and/or flow cytometry methods known in the art.
[0103] The methods provided herein can be used to determine that the nucleotide or proteins are differentially expressed in at least one cell type relative to at least one other cell type. Such genes include those that are up-regulated (i.e., expressed at a higher level), as well as those that are down-regulated (i.e., expressed at a lower level). Such genes also include sequences that have been altered (i.e., truncated sequences or sequences with substitutions, deletions or insertions, including point mutations) and show either the same expression profile or an altered profile. In certain embodiments, the genes can be from humans; however, as will be appreciated by those in the art, genes from other organisms can be useful in animal models of disease and drug evaluation; thus, other genes are provided, from vertebrates, including mammals, including rodents (e.g., rats, mice, hamsters, and guinea pigs), primates, and farm animals (e.g., sheep, goats, pigs, cows, and horses). In some cases, prokaryotic genes can be useful. Gene expression in any of a variety of organisms can be determined by methods provided herein or otherwise known in the art.
[0104] Gene products measured according to the methods provided herein can be nucleic acid molecules, including, but not limited to mRNA or an amplicate or complement thereof, polypeptides, or fragments thereof. Methods and compositions for the detection of nucleic acid molecules and proteins are known in the art. For example, oligonucleotide probes and primers can be used in the detection of nucleic acid molecules, and antibodies can be used in the detection of polypeptides.
[0105] In the methods provided herein, one or more gene products can be detected. In some embodiments, two or more gene products are detected. In other embodiments, 3 or more, 4 or more, 5 or more, 7 or more, 10 or more 15 or more, 20 or more 25, or more, 35 or more, 50 or more, 75 or more, or 100 or more gene products can be detected in the methods provided herein.
[0106] The expression levels of the marker genes in a sample can be determined by any method or composition known in the art. The expression level can be determined by isolating and determining the level (i.e., amount) of nucleic acid transcribed from each marker gene. Alternatively, or additionally, the level of specific proteins translated from mRNA transcribed from a marker gene can be determined.
[0107] Determining the level of expression of specific marker genes can be accomplished by determining the amount of mRNA, or polynucleotides derived therefrom, or protein present in a sample. Any method for determining protein or RNA levels can be used. For example, protein or RNA is isolated from a sample and separated by gel electrophoresis. The separated protein or RNA is then transferred to a solid support, such as a filter. Nucleic acid or protein (e.g., antibody) probes representing one or more markers are then hybridized to the filter by hybridization, and the amount of marker-derived protein or RNA is determined. Such determination can be visual, or machine-aided, for example, by use of a densitometer. Another method of determining protein or RNA levels is by use of a dot-blot or a slot-blot. In this method, protein, RNA, or nucleic acid derived therefrom, from a sample is labeled. The protein, RNA or nucleic acid derived therefrom is then hybridized to a filter containing oligonucleotides or antibodies derived from one or more marker genes, wherein the oligonucleotides or antibodies are placed upon the filter at discrete, easily-identifiable locations. Binding, or lack thereof, of the labeled protein or RNA to the filter is determined visually or by densitometer. Proteins or polynucleotides can be labeled using a radiolabel or a fluorescent (i.e., visible) label.
[0108] Methods provided herein can be used to detect mRNA or amplicates thereof, and any fragment thereof. In one example, introns of mRNA or amplicate or fragment thereof can be detected. Processing of mRNA can include splicing, in which introns are removed from the transcript. Detection of introns can be used to detect the presence of the entire mRNA, and also can be used to detect processing of the mRNA, for example, when the intron region alone (e.g., intron not attached to any exons) is detected.
[0109] In another embodiment, methods provided herein can be used to detect polypeptides and modifications thereof, where a modification of a polypeptide can be a post-translation modification such as lipidylation, glycosylation, activating proteolysis, and others known in the art, or can include degradational modification such as proteolytic fragments and ubiquitinated polypeptides.
[0110] These examples are not intended to be limiting; other methods of determining protein or RNA abundance are known in the art.
[0111] Alternatively, proteins can be separated by two-dimensional gel electrophoresis systems. Two-dimensional gel electrophoresis is well-known in the art and can involve isoelectric focusing along a first dimension followed by SDS-PAGE electrophoresis along a second dimension. See, e.g., Hames et al. (1990) Gel Electrophoresis of Proteins: A Practical Approach, IRL Press, New York; Shevchenko et al. (1996) Proc. Natl. Acad. Sci. USA 93:1440-1445; Sagliocco et al. (1996) Yeast 12:1519-1533; and Lander (1996) Science 274:536-539. The resulting electropherograms can be analyzed by numerous techniques, including mass spectrometric techniques, western blotting and immunoblot analysis using polyclonal and monoclonal antibodies.
[0112] Alternatively, marker-derived protein levels can be determined by constructing an antibody microarray in which binding sites comprise immobilized antibodies, such as monoclonal antibodies, specific to a plurality of protein species encoded by the cell genome. Antibodies can be present for a substantial fraction of the marker-derived proteins of interest. Methods for making monoclonal antibodies are well known (see, e.g., Harlow and Lane (1988) Antibodies: A Laboratory Manual, Cold Spring Harbor, N.Y., which is incorporated in its entirety for all purposes). In one embodiment, monoclonal antibodies are raised against synthetic peptide fragments designed based on genomic sequence of the cell. With such an antibody array, proteins from the cell are contacted to the array, and their binding is assayed with assays known in the art. The expression, and the level of expression, of proteins of diagnostic or prognostic interest can be detected through immunohistochemical staining of tissue slices or sections.
[0113] In another embodiment, expression of marker genes in a number of tissue specimens can be characterized using a tissue array (Kononen et al. (1998) Nat. Med. 4:844-847). In a tissue array, multiple tissue samples are assessed on the same microarray. The arrays allow in situ detection of RNA and protein levels; consecutive sections allow the analysis of multiple samples simultaneously.
[0114] In some embodiments, polynucleotide microarrays are used to measure expression so that the expression status of each of the markers above is assessed simultaneously. In one embodiment, the microarrays provided herein are oligonucleotide or cDNA arrays comprising probes hybridizable to the genes corresponding to the marker genes described herein. A microarray as provided herein can comprise probes hybridizable to the genes corresponding to markers able to distinguish cells, identify phenotypes, identify a disease or disorder, or provide a prognosis of a disease or disorder (e.g., a classifier as described herein). For example, provided herein are polynucleotide arrays comprising probes to a subset or subsets of at least 2, 5, 10, 15, 20, 30, 40, 50, 75, 100, or more than 100 genetic markers, up to the full set of markers present in a classifier as described in the Examples below. Also provided herein are probes to markers with a modified t statistic greater than or equal to 2.5, 3, 3.5, 4, 4.5 or 5. Also provided herein are probes to markers with a modified t statistic less than or equal to -2.5, -3, -3.5, -4, -4.5 or -5. In specific embodiments, the invention provides combinations such as arrays in which the markers described herein comprise at least 50%, 60%, 70%, 80%, 85%, 90%, 95% or 98% of the probes on the combination or array.
[0115] General methods pertaining to the construction of microarrays comprising the marker sets and/or subsets above are known in the art as described herein.
[0116] Microarrays can be prepared by selecting probes that comprise a polypeptide or polynucleotide sequence, and then immobilizing such probes to a solid support or surface. For example, the probes can comprise DNA sequences, RNA sequences, or antibodies. The probes can also comprise amino acid, DNA and/or RNA analogues, or combinations thereof. The probes can be prepared by any method known in the art.
[0117] The probe or probes used in the methods of the invention can be immobilized to a solid support which can be either porous or non-porous. For example, the probes of the can be attached to a nitrocellulose or nylon membrane or filter. Alternatively, the solid support or surface can be a glass or plastic surface. In another embodiment, hybridization levels are measured to microarrays of probes consisting of a solid phase on the surface of which are immobilized a population of probes. The solid phase can be a nonporous or, optionally, a porous material such as a gel.
[0118] In another embodiment, the microarrays are addressable arrays, such as positionally addressable arrays. More specifically, each probe of the array can be located at a known, predetermined position on the solid support such that the identity (i.e., the sequence) of each probe can be determined from its position in the array (i.e., on the support or surface).
[0119] A skilled artisan will appreciate that positive control probes, e.g., probes known to be complementary and hybridizable to sequences in target polynucleotide molecules, and negative control probes, e.g., probes known to not be complementary and hybridizable to sequences in target polynucleotide molecules, can be included on the array. In one embodiment, positive controls can be synthesized along the perimeter of the array. In another embodiment, positive controls can be synthesized in diagonal stripes across the array. Other variations are known in the art. Probes can be immobilized on the to solid surface by any of a variety of methods known in the art.
[0120] In certain embodiments, this model can be further extended to include sample characteristics, such as cell or organism phenotypes, allowing cell type specific expression to be linked to observable indicia such as clinical indicators and prognosis (e.g., clinical disease progression, response to therapy, and the like). In one embodiment, a model for prostate tissue is provided, resulting in identification of cell-type-specific markers of cancer, epithelial hypertrophy, and disease progression. In another embodiment, a method for studying differential gene expression between subjects with cancers that relapse and those with cancers that do not relapse, is disclosed. Also provided is the framework for studying mixed cell type samples and more flexible models allowing for cross-talk among genes in a sample. Also provided are extensions to defining differences in expression between samples with different characteristics, such as samples from subjects who subsequently relapse versus those who do not.
Statistical Treatment
[0121] The methods provided herein include determining the regression relationship between relative cell content and measured expression levels. For example, the regression relationship can be determined by determining the regression of measured expression levels on cell proportions. Statistical methods for determining regression relationships between variables are known in the art. Such general statistical methods can be used in accordance with the teachings provided herein regarding regression of measured expression levels on cell proportions.
[0122] The methods provided herein also include calculating the level of analytes in each cell type based on the regression relationship between relative cell content and expression levels. The regression relationship can be determined according to methods provided herein, and, based on the regression relationship, the level of a particular analyte can be calculated for a particular cell type. The methods provided herein can permit the calculation of any of a variety of analyte for particular cell types. For example, the methods provided herein can permit calculation of a single analyte for a single cell type, or can permit calculation of a plurality of analytes for a single cell type, or can permit calculation of a single analyte for a plurality of cell types, or can permit calculation of a plurality of analytes for a plurality of cell types. Thus, the number of analytes whose level can be calculated for a particular cell type can range from a single analyte to the total number of analytes measured (e.g., the total number of analytes measured using a microarray). In another embodiment, the total number of cell types for which analyte levels can be calculated can range from a single cell type, to all cell types present in a sample at sufficient levels. The levels of analyte for a particular cell type can be used to estimate expression levels of the corresponding gene, as provided elsewhere herein.
[0123] The methods provided herein also can include identifying genes differentially expressed in a first cell type relative to a second cell type. Expression levels of one or more genes in a particular cell type can be compared to one or more additional cell types. Differences in expression levels can be represented in any of a variety of manners known in the art, including mathematical or statistical representations, as provided herein. For example, differences in expression level can be represented as a modified t statistic, as described elsewhere herein.
[0124] The methods provided herein also can serve as the basis for methods of indicating the presence of a particular cell type in a subject. The methods provided herein can be used for identifying the expression levels in particular cell types. Using any of a variety of classifier methods known in the art, such as a naive Bayes classifier, gene expression levels in cells of a sample from a subject can be compared to reference expression levels to determine the presence of absence, and, optionally, the relative amount, of a particular cell type in the sample. For example, the markers provided herein as associated with prostate tumor, stroma or BPH can be selected in a prostate tumor classifier in accordance with the modified t statistic associated with each marker provided in the Tables herein. Methods for using a modified t statistic in classifier methods are provided herein and also are known in the art. In another embodiment, the methods provided herein can be used in phenotype-indicating methods such as diagnostic or prognostic methods, in which the gene expression levels in a sample from a subject can be compared to references indicative of one or more particular phenotypes.
[0125] For purposes of exemplification, and not for purposes of limitation, an exemplary method of determining gene expression levels in one or more cell types in a heterogeneous cell sample is provided as follows. Suppose that there are four cell types: BPH, Tumor, Stroma, fij(y), iε{BPH, Tumor, Stroma, Cystic Atrophy} and Cystic Atrophy. Supposing that each cell type has a (possibly) different distribution for y, the expression level for a gene j, denoted by:
and that sample k has proportions
Xk=(xk,BPH,xk,Tumor,xk,stroma,xk,Cystic Atrophy)
of each cell type is studied. The distribution of the expression level for gene j is then
g j ( y X k ) = i x ki f ij ( y ) ##EQU00001##
if the expression levels are additive in the cell proportions as they would be if each cell's expression level depends only on the type of cell (and not, say, on what other types of cells can be present in the sample). In a later section this formulation is extended to cases in which the expression of a given cell type depends on what other types of cells are present.
[0126] The average expression level in a sample is then the weighted average of the expectations with weights corresponding to the cell proportions:
E gj ( y X k ) = i x ki E fij ( y ) ##EQU00002## or ##EQU00002.2## y jk = i x ki β ij + ε jk ##EQU00002.3## where ##EQU00002.4## E fij ( y ) = β ij and ε jk = y jk - E gj ( y X k ) ##EQU00002.5##
[0127] This is the known form for a multiple linear regression equation (without specifying an intercept), and when multiple samples are available one can estimate the βij. Once these estimates are in hand, estimates for the differences in gene expression of two cell types are of the form:
{circumflex over (β)}i1j-{circumflex over (β)}i2j
and standard methods for testing linear hypotheses about the coefficients βij can be applied to test whether the average expression levels of cell types i1 and i2 are different. The term `expression levels` as used in this exemplification of the method is used in a generic sense: `expression levels` could be readings of mRNA levels, cRNA levels, protein levels, fluorescent intensity from a feature on an array, the logarithm of that reading, some highly post-processed reading, and the like. Thus, differences in the coefficients can correspond to differences, log ratios, or some other functions of the underlying transcript abundance.
[0128] For computational convenience, one may in certain embodiments use Z=XT and γ=T-1β setting up T so that one column of T has all zeroes but for a one in position i1 and a minus one in position i2 such as
T = ( 1 1 - 1 0 1 1 1 0 1 0 0 1 1 0 0 0 ) ##EQU00003##
[0129] The columns of Z that result are the unit vector (all ones), χk,BPH+χk,Tumor, χk,BPH-χk,Tumor, and χk,Stroma. With this setup, twice the coefficient of χk,BPH-χk,Tumor estimates the average difference in expression level of a tumor cell versus a BPH cell. With this parameterization, standard software can be used to provide an estimate and a tesmodified t statistic for the average difference of tumor and BPH cells. Further, this can simplify the specification of restricted models in which two or more of the tissue components have the same average expression level.
[0130] The data for a study can contain a large number of samples from a smaller number of different men. It is plausible that the samples from one man may tend to share a common level of expression for a given gene, differences among his cells according to their type notwithstanding. This will tend to lead to positive covariance among the measurements of expression level within men. Ordinary least squares (OLS) estimates are less than fully efficient in such circumstances. One alternative to OLS is to use a weighted least squares approach that treats a collection of samples from a single subject as having a common (non-negative) covariance and identical variances.
[0131] The estimating equation for this setup can be solved via iterative methods using software such as the gee library from R (Ihaka and Gentleman (1996) J. Comp. Graph. Stat. 5:299-314). When the estimated covariance is negative--as sometimes happens when there is an extreme outlier in the dataset--it can be fixed at zero. Also the sandwich estimate (Liang and Zeger (1986) Biometrika 73:13-22) of the covariance structure can be used.
[0132] The estimating equation approach will provide a tesmodified t statistic for a single transcript. Assessment of differential expression among a group of 12625 transcripts is handled by permutation methods that honor a suitable null model. That null model is obtained by regressing the expression level on all design terms except for the `BPH--tumor` term using the exchangeable, non-negative correlation structure just mentioned. For performing permutation tests, the correlation structure in the residuals can be accounted for. Let κ1 be the set of n1 indexes of samples for subject 1. First, we find yjk-yjk=ejk, kεκ1, as the residuals from that fitted null model for subject 1. The inverse square root of the correlation matrix of these residuals is used to transform them, i.e., {tilde over (e)}j=φ-1/2ej., where φ is the (block diagonal) correlation matrix obtained by substituting the estimate of r from gee as the off-diagonal elements of blocks corresponding to measurements for each subject and ej. and {tilde over (e)}j. are the vector of residuals and transformed residuals for all subjects for gene j. Asymptotically, the {tilde over (e)}jk have means and covariances equal to zero. Random permutations of these, {tilde over (e)}j.sup.(i), i=1, . . . , M, are obtained and used to form pseudo-observations:
{tilde over (y)}j..sup.(i)=yj.+φ1/2{tilde over (e)}j..sup.(i)
[0133] This permutation scheme preserves the null model and enforces its correlation structure asymptotically.
[0134] In certain embodiments, the contribution of each type of cell does not depend on what other cell types are present in the sample. However, there can be instances in which contribution of each type of cell does depend on other cell types present in the sample. It may happen that putatively `normal` cells exhibit genomic features that influence both their expression profiles and their potential to become malignant. Such cells would exhibit the same expression pattern when located in normal tissue, but are more likely to be found in samples that also have tumor cells in them. Another possible effect is that signals generated by tumor cells trigger expression changes in nearby cells that would not be seen if those same cells were located in wholly normal tissue. In either case, the contribution of a cell may be more or less than in another tissue environment leading to a setup in which the contributions of individual cell types to the overall profile depend on the proportions of all types present, viz.
g j ( y | X k ) = i x ki f ij ( y | X k ) ##EQU00004##
[0135] as do the expected proportions
E g j ( y | X k ) = i x ki E f ij ( y | X k ) ##EQU00005## or ##EQU00005.2## y jk = i x ki β ij ( X k ) + ε jk ##EQU00005.3##
[0136] The methods used herein above can still be applied in the context provided some calculable form is given for βij(Xk). One choice is given by
βij(Xk)=(φjR(Xk))i
[0137] where Φj is a 4×m matrix of unknown coefficients and R(Xk) is a column vector of m elements. This reduces to the case in which each cell's expression level depends only on the type of cell when Φj is 4×1 matrix and R(Xk) is just `1`.
[0138] Consider the case:
φ j ( X k ) R ( X k ) = ( v Bj v Bj v Bj v Bj v Tj v Tj v Tj v Tj v Sj v Sj + δ j v Sj v Sj v Cj v Cj v Cj v Cj ) ( x k , B x k , T x k , S x k , C ) = ( v Bj v Tj v Sj + δ j x k , T v Cj ) ##EQU00006## φ j ( X k ) R ( X k ) = ( v Bj v Bj v Bj v Bj v Tj v Tj v Tj v Tj v Sj v Sj + δ j v Sj v Sj v Cj v Cj v Cj v Cj ) ( x k , B x k , T x k , S x k , C ) = ( v Bj v Tj v Sj + δ j x k , T v Cj ) ##EQU00006.2##
[0139] (and recall that ΣjXk,j=1.) Here the subscript for Tumor has been abbreviated T etc., for brevity. This setup provides that BPH (B), tumor, and cystic atrophy (C) cells have expression profiles that do not depend on the other cell types in the sample. However, the expression levels of stromal cells (S) depend on the proportion of tumor cells as reflected by the coefficient δj. Notice that
[0140] is linear in Xk,B, Xk,T, Xk,S, Xk,C, and Xk,SXk,T with the unknown coefficients being
XkφjR(Xk)=xk,BvBj+xk,TvTj+xk- ,SvSj+xk,Sxk,xδj+xk,CvCj
multipliers of those terms. So, the unknowns in this case are linear functions of the gene expression levels and can be determined using standard linear models as was done earlier. The only change here is the addition of the product of Xk,S and Xk,T. Such a product, when significant, is termed an "interaction" and refers to the product archiving a significance level owing to a correlation of Xk,S with Xk,T. Thus, it is possible to accommodate variations in gene expression that occur when the level of a transcript in one cell type is influenced by the amount of another cell type in the sample. In one aspect, a setup involving a dependency of tumor on the amount of stroma
φ j ( X k ) R ( X k ) = ( v Bj v Bj v Bj v Bj v Tj v Tj v Tj + δ j v Tj v Sj v Sj v Sj v Sj v Cj v Cj v Cj v Cj ) ( x k , B x k , T x k , S x k , C ) = ( v Bj v Tj + δ j x k , T v Sj v Cj ) ##EQU00007##
[0141] the expression for XkΦjR(Xk) is precisely as it was just above.
[0142] Accordingly, one can screen for dependencies by including as regressors products of the proportions of cell types. In certain embodiments, it may not be possible to detect interactions if two different cell types experience equal and opposite changes--one type expressing more with increases in the other and the other expressing less with increases in the first. In one embodiment, dependence of gene expression refers to the dependence of gene expression in one cell type on the level of gene expression in another cell type. In another embodiment, dependence of gene expression refers to the dependence of gene expression in one cell type on the amount of another cell type.
[0143] The contribution of each type of cell can depend on what other cell types are present in the sample, but also can depend on other characteristics of the sample, such as clinical characteristics of the subject who contributed it. For example, clinical characteristics such as disease symptoms, disease prognosis such as relapse and/or aggressiveness of disease, likelihood of success in treating a disease, likelihood of survival, condition in which a particular treatment regimen is likely to be more effective than another treatment regimen, can be correlated with cell expression. For example, cell type specific gene expression can differ between a subject with a cancer that does not relapse after treatment and a subject with a cancer that does relapse after treatment. In this case, the contribution of a cell type may be more or less than in another subject leading to an instance in which the contributions of individual cell types to the overall profile depend on the characteristics of the subject or sample. Here, the model used earlier is extended to allow for dependence on a vector of sample specific covariates, Zk:
g j ( y | X k , Z k ) = i x ki f ij ( y | X k , Z k ) ##EQU00008##
[0144] as do the expected proportions:
E gj ( y | X k , Z k ) = i x ki E f ij ( y | X k , Z k ) ##EQU00009## or ##EQU00009.2## y jk = i x ki β ij ( X k , Z k ) + ε jk ##EQU00009.3## where E f ij ( y | X k , Z k ) = β ij ( X k , Z k ) and ##EQU00009.4## ε jk = y jk - E gj ( y | X k , Z k ) . ##EQU00009.5##
[0145] The methods used herein above can still be applied in this context provided some reasonable form is given for βij(Xk,Zk). One useful choice is given by:
βij(Xk,Zk)=(φjR(Zk))i
[0146] Where Φj is a 4×m matrix of unknown coefficients and R(Zk) is a column vector of m elements.
[0147] Consider how this would be used to study differences in gene expression among subjects who relapse and those who do not. In this case, Zk is an indicator variable taking the value zero for samples of subjects who do not relapse and one for those who do. Then
R ( Z k ) = ( 1 Z k ) ##EQU00010##
[0148] and Φ is a four by two matrix of coefficients:
φ j = ( v Bj δ Bj v Tj δ Tj v Sj δ Sj v Cj δ Cj ) ##EQU00011##
[0149] Notice that this leads to
XkφjR(Zk)=xk,BvBj+xk,TvTj+xk- ,SvSj+xk,CvCj+xk,BZkδBj+xk,TZ.sub- .kδTj+xk,SZkδSj+xk,CZkδ.su- b.Cj
[0150] The v coefficients give the average expression of the different cell types in subjects who do not relapse, while the δ coefficients give the difference between the average expression of the different cell types in subjects who do relapse and those who do not. Thus, a non-zero value of δT would indicate that in tumor cells, the average expression level differs for subjects who relapse and those who do not. The above equation is linear in its coefficients, so standard statistical methods can be applied to estimation and inference on the coefficients. Extensions that allow β to depend on both cell proportions and on sample covariates can be determined according to the teachings provided herein or other methods known in the art.
Nucleic Acids
[0151] Provided herein are tables and exhibits listing probe sets and genes associated with the probe set, including, for some tables, GENBANK accession number, and/or locus ID. The tables may include modified t statistics for an Affymetrix microarrays, including associated t statistics for BPH, tumor, stroma and cystic atrophy, for example. Probe IDs for the microarray that map to Probe IDs for a different microarray, and the mapping itself, also may be provided, where the mapping can represent Probe IDs of microarrays that can hybridize to the same gene. By virtue of such mapping, Probe IDs can be associated with nucleotide sequences. Tables also may list the top genes identified as up- and down-regulated in prostate tumor cells of relapse patients, calculated by linear regression including all samples with prostate cancer. Genes that have greater than, for example, a 1.5 fold ratio of predicted expression between relapse and non-relapse tissue can be identified, as can an absolute difference in expression that exceeds the expression level reported for most genes queried by the array.
[0152] The tables provided herein also may list the top genes identified as up- and down-regulated in tumors and/or prostate stroma of relapse patients, calculated by linear regression including all samples with prostate cancer. Exemplary genes whose expression can be examined in methods for identifying or characterizing a sample may be provided, as well as Probe IDs that can be used for such gene expression identification.
[0153] Splice variants of genes also may be useful for determining diagnosis and prognosis of prostate cancer. As will be understood in the art, multiple splicing combinations are provided for some genes. Reference herein to one or more genes (including reference to products of genes) also contemplates reference to spliced gene sequences. Similarly, reference herein to one or more protein gene products also contemplates proteins translated from splice variants.
[0154] Exemplary, non-limiting examples of genes whose products can be detected in the methods provided herein include IGF-1, microsimino protein, and MTA-1. In one embodiment detection of the expression of one or more of these genes can be performed in combination with detection of expression of one or more additional genes as listed in the tables herein.
[0155] Uses of probes and detection of genes identified in the tables may be described and exemplified herein. It is contemplated herein that uses and methods similar to those exemplified can be applied to the probe and gene nucleotide sequences in accordance with the teachings provided herein.
[0156] The isolated nucleic acids can contain least 10 nucleotides, 25 nucleotides, 50 nucleotides, 100 nucleotides, 150 nucleotides, or 200 nucleotides or more, contiguous nucleotides of a gene listed herein. In another embodiment, the nucleic acids are smaller than 35, 200 or 500 nucleotides in length.
[0157] Also provided are fragments of the above nucleic acids that can be used as probes or primers and that contain at least about 10 nucleotides, at least about 14 nucleotides, at least about 16 nucleotides, or at least about 30 nucleotides. The length of the probe or primer is a function of the size of the genome probed; the larger the genome, the longer the probe or primer required for specific hybridization to a single site. Those of skill in the art can select appropriately sized probes and primers. Probes and primers as described can be single-stranded. Double stranded probes and primers also can be used, if they are denatured when used. Probes and primers derived from the nucleic acid molecules are provided. Such probes and primers contain at least 8, 14, 16, 30, 100 or more contiguous nucleotides. The probes and primers are optionally labeled with a detectable label, such as a radiolabel or a fluorescent tag, or can be mass differentiated for detection by mass spectrometry or other means. Also provided is an isolated nucleic acid molecule that includes the sequence of molecules that is complementary to a nucleotide. Double-stranded RNA (dsRNA), such as RNAi is also provided.
[0158] Plasmids and vectors containing the nucleic acid molecules are also provided. Cells containing the vectors, including cells that express the encoded proteins are provided. The cell can be a bacterial cell, a yeast cell, a fungal cell, a plant cell, an insect cell or an animal cell.
[0159] For recombinant expression of one or more genes, the nucleic acid containing all or a portion of the nucleotide sequence encoding the genes can be inserted into an appropriate expression vector, i.e., a vector that contains the elements for the transcription and translation of the inserted protein coding sequence. Transcriptional and translational signals also can be supplied by the native promoter for the genes, and/or their flanking regions.
[0160] Also provided are vectors that contain nucleic acid encoding a gene listed herein. Cells containing the vectors are also provided. The cells include eukaryotic and prokaryotic cells, and the vectors are any suitable for use therein.
[0161] Prokaryotic and eukaryotic cells containing the vectors are provided. Such cells include bacterial cells, yeast cells, fungal cells, plant cells, insect cells and animal cells. The cells can be used to produce an oligonucleotide or polypeptide gene products by (a) growing the above-described cells under conditions whereby the encoded gene is expressed by the cell, and then (b) recovering the expressed compound.
[0162] A variety of host-vector systems can be used to express the protein coding sequence. These include, but are not limited to, mammalian cell systems infected with virus (e.g., vaccinia virus and adenovirus); insect cell systems infected with virus (e.g., baculovirus); microorganisms such as yeast containing yeast vectors; or bacteria transformed with bacteriophage, DNA, plasmid DNA, or cosmid DNA. The expression elements of vectors vary in their strengths and specificities. Depending on the host-vector system used, any one of a number of suitable transcription and translation elements can be used.
[0163] Any methods known to those of skill in the art for the insertion of nucleic acid fragments into a vector can be used to construct expression vectors containing a chimeric gene containing appropriate transcriptional/translational control signals and protein coding sequences. These methods can include in vitro recombinant DNA and synthetic techniques and in vivo recombinants (genetic recombination). Expression of nucleic acid sequences encoding polypeptide can be regulated by a second nucleic acid sequence so that the genes or fragments thereof are expressed in a host transformed with the recombinant DNA molecule(s). For example, expression of the proteins can be controlled by any promoter/enhancer known in the art.
Proteins
[0164] Protein products of the genes listed herein, derivatives, and analogs can be produced by various methods known in the art. For example, once a recombinant cell expressing such a polypeptide, or a domain, fragment or derivative thereof, is identified, the individual gene product can be isolated and analyzed. This is achieved by assays based on the physical and/or functional properties of the protein, including, but not limited to, radioactive labeling of the product followed by analysis by gel electrophoresis, immunoassay, cross-linking to marker-labeled product, and assays of protein activity or antibody binding.
[0165] Polypeptides can be isolated and purified by standard methods known in the art (either from natural sources or recombinant host cells expressing the complexes or proteins), including but not restricted to column chromatography (e.g., ion exchange, affinity, gel exclusion, reversed-phase high pressure and fast protein liquid), differential centrifugation, differential solubility, or by any other standard technique used for the purification of proteins. Functional properties can be evaluated using any suitable assay known in the art.
[0166] Manipulations of polypeptide sequences can be made at the protein level. Also contemplated herein are polypeptide proteins, domains thereof, derivatives or analogs or fragments thereof, which are differentially modified during or after translation, e.g., by glycosylation, acetylation, phosphorylation, amidation, derivatization by known protecting/blocking groups, proteolytic cleavage, linkage to an antibody molecule or other cellular ligand. Any of numerous chemical modifications can be carried out by known techniques, including but not limited to specific chemical cleavage by cyanogen bromide, trypsin, chymotrypsin, papain, V8 protease, NaBH4, acetylation, formulation, oxidation, reduction, metabolic synthesis in the presence of tunicamycin and other such agents.
[0167] In addition, domains, analogs and derivatives of a polypeptide provided herein can be chemically synthesized. For example, a peptide corresponding to a portion of a polypeptide provided herein, which includes the desired domain or which mediates the desired activity in vitro can be synthesized by use of a peptide synthesizer. Furthermore, if desired, nonclassical amino acids or chemical amino acid analogs can be introduced as a substitution or addition into the polypeptide sequence. Non-classical amino acids include but are not limited to the D-isomers of the common amino acids, a-amino isobutyric acid, 4-aminobutyric acid, Abu, 2-aminobutyric acid, ε-Abu, e-Ahx, 6-amino hexanoic acid, Aib, 2-amino isobutyric acid, 3-amino propionoic acid, ornithine, norleucine, norvaline, hydroxyproline, sarcosine, citrulline, cysteic acid, t-butylglycine, t-butylalanine, phenylglycine, cyclohexylalanine, β-alanine, fluoro-amino acids, designer amino acids such as β-methyl amino acids, Ca-methyl amino acids, Na-methyl amino acids, and amino acid analogs in general. Furthermore, the amino acid can be D (dextrorotary) or L (levorotary).
Screening Methods
[0168] Oligonucleotide or polypeptide gene products can be used in a variety of methods to identify compounds that modulate the activity thereof. Nucleotide sequences and genes can be identified in different cell types and in the same cell type in which subject have different phenotypes. Methods are provided herein for screening compounds can include contacting cells with a compound and measuring gene expression levels, wherein a change in expression levels relative to a reference identifies the compound as a compound that modulates a gene expression.
[0169] Also provided herein are methods for identification and isolation of agents, such as compounds that bind to products of the genes listed herein. The assays are designed to identify agents that bind to the RNA or polypeptide gene product. The identified compounds are candidates or leads for identification of compounds for treatments of tumors and other disorders and diseases.
[0170] A variety of methods can be used, as known in the art. These methods can be performed in solution or in solid phase reactions.
[0171] Methods for identifying an agent, such as a compound, that specifically binds to an oligonucleotide or polypeptide encoded by a gene as listed herein also are provided. The method can be practiced by (a) contacting the gene product with one or a plurality of test agents under conditions conducive to binding between the gene product and an agent; and (b) identifying one or more agents within the one or plurality that specifically binds to the gene product. Compounds or agents to be identified can originate from biological samples or from libraries, including, but are not limited to, combinatorial libraries. Exemplary libraries can be fusion-protein-displayed peptide libraries in which random peptides or proteins are presented on the surface of phage particles or proteins expressed from plasmids; support-bound synthetic chemical libraries in which individual compounds or mixtures of compounds are presented on insoluble matrices, such as resin beads, or other libraries known in the art.
Modulators of the Activity of Gene products
[0172] Provided herein are compounds that modulate the activity of a gene product. These compounds can act by directly interacting with the polypeptide or by altering transcription or translation thereof. Such molecules include, but are not limited to, antibodies that specifically bind the polypeptide, antisense nucleic acids or double-stranded RNA (dsRNA) such as RNAi, that alter expression of the polypeptide, antibodies, peptide mimetics and other such compounds.
[0173] Antibodies are provided, including polyclonal and monoclonal antibodies that specifically bind to a polypeptide gene product provided herein. An antibody can be a monoclonal antibody, and the antibody can specifically bind to the polypeptide. The polypeptide and domains, fragments, homologs and derivatives thereof can be used as immunogens to generate antibodies that specifically bind such immunogens. Such antibodies include but are not limited to polyclonal, monoclonal, chimeric, single chain, Fab fragments, and an Fab expression library. In a specific embodiment, antibodies to human polypeptides are produced. Methods for monoclonal and polyclonal antibody production are known in the art. Antibody fragments that specifically bind to the polypeptide or epitopes thereof can be generated by techniques known in the art. For example, such fragments include but are not limited to: the F(ab')2 fragment, which can be produced by pepsin digestion of the antibody molecule; the Fab' fragments that can be generated by reducing the disulfide bridges of the F(ab')2 fragment, the Fab fragments that can be generated by treating the antibody molecular with papain and a reducing agent, and Fv fragments.
[0174] Peptide analogs are commonly used in the pharmaceutical industry as non-peptide drugs with properties analogous to those of the template peptide. These types of non-peptide compounds are termed peptide mimetics or peptidomimetics (Luthman et al., A Textbook of Drug Design and Development, 14:386-406, 2nd Ed., Harwood Academic Publishers (1996); Joachim Grante (1994) Angew. Chem. Int. Ed. Engl., 33:1699-1720; Fauchere (1986) J. Adv. Drug Res., 15:29; Veber and Freidinger (1985) TINS, p. 392; and Evans et al. (1987) J. Med. Chem. 30:1229). Peptide mimetics that are structurally similar to therapeutically useful peptides can be used to produce an equivalent or enhanced therapeutic or prophylactic effect. Preparation of peptidomimetics and structures thereof are known to those of skill in this art.
Prognosis and Diagnosis
[0175] Polypeptide products of the coding sequences (e.g., genes) listed herein can be detected in diagnostic methods, such as diagnosis of tumors and other diseases or disorders. Such methods can be used to detect, prognose, diagnose, or monitor various conditions, diseases, and disorders. Exemplary compounds that can be used in such detection methods include polypeptides such as antibodies or fragments thereof that specifically bind to the polypeptides listed herein, and oligonucleotides such as DNA probes or primers that specifically bind oligonucleotides such as RNA encoded by the nucleic acids provided herein.
[0176] A set of one or more, or two or more compounds for detection of markers containing a particular nucleotide sequence, complements thereof, fragments thereof, or polypeptides encoded thereby, can be selected for any of a variety of assay methods provided herein. For example, one or more, or two or more such compounds can be selected as diagnostic or prognostic indicators. Methods for selecting such compounds and using such compounds in assay methods such as diagnostic and prognostic indicator applications are known in the art. For example, the Tables provided herein list a modified t statistic associated with each marker, where the modified t statistic indicate the ability of the associated marker to indicate (by presence or absence of the marker, according to the modified t statistic) the presence or absence of a particular cell type in a prostate sample.
[0177] In another embodiment, marker selection can be performed by considering both modified t statistics and expected intensity of the signal for a particular marker. For example, markers can be selected that have a strong signal in a cell type whose presence or absence is to be determined, and also have a sufficiently large modified t statistic for gene expression in that cell type. Also, markers can be selected that have little or no signal in a cell type whose presence or absence is to be determined, and also have a sufficiently large negative modified t statistic for gene expression in that cell type.
[0178] Exemplary assays include immunoassays such as competitive and non-competitive assay systems using techniques such as western blots, radioimmunoassays, ELISA (enzyme linked immunosorbent assay), sandwich immunoassays, immunoprecipitation assays, precipitin reactions, gel diffusion precipitin reactions, immunodiffusion assays, agglutination assays, complement-fixation assays, immunoradiometric assays, fluorescent immunoassays and protein A immunoassays. Other exemplary assays include hybridization assays which can be carried out by a method by contacting a sample containing nucleic acid with a nucleic acid probe, under conditions such that specific hybridization can occur, and detecting or measuring any resulting hybridization.
[0179] Kits for diagnostic use are also provided, that contain in one or more containers an anti-polypeptide antibody, and, optionally, a labeled binding partner to the antibody. A kit is also provided that includes in one or more containers a nucleic acid probe capable of hybridizing to the gene-encoding nucleic acid. In a specific embodiment, a kit can include in one or more containers a pair of primers (e.g., each in the size range of 6-30 nucleotides) that are capable of priming amplification. A kit can optionally further include in a container a predetermined amount of a purified control polypeptide or nucleic acid.
[0180] The kits can contain packaging material that is one or more physical structures used to house the contents of the kit, such as invention nucleic acid probes or primers, and the like. The packaging material is constructed by well known methods, and can provide a sterile, contaminant-free environment. The packaging material has a label which indicates that the compounds can be used for detecting a particular oligonucleotide or polypeptide. The packaging materials employed herein in relation to diagnostic systems are those customarily utilized in nucleic acid or protein-based diagnostic systems. A package is to a solid matrix or material such as glass, plastic, paper, foil, and the like, capable of holding within fixed limits an isolated nucleic acid, oligonucleotide, or primer of the present invention. Thus, for example, a package can be a glass vial used to contain milligram quantities of a contemplated nucleic acid, oligonucleotide or primer, or it can be a microtiter plate well to which microgram quantities of a contemplated nucleic acid probe have been operatively affixed. The kits also can include instructions for use, which can include a tangible expression describing the reagent concentration or at least one assay method parameter, such as the relative amounts of reagent and sample to be admixed, maintenance time periods for reagent/sample admixtures, temperature, buffer conditions, and the like.
Pharmaceutical Compositions and Modes of Administration
[0181] Pharmaceutical compositions containing the identified compounds that modulate expression of a gene or bind to a gene product are provided herein. Also provided are combinations of such a compound and another treatment or compound for treatment of a disease or disorder, such as a chemotherapeutic compound.
[0182] Expression modulator or binding compound and other compounds can be packaged as separate compositions for administration together or sequentially or intermittently. Alternatively, they can be provided as a single composition for administration or as two compositions for administration as a single composition. The combinations can be packaged as kits.
[0183] Compounds and compositions provided herein can be formulated as pharmaceutical compositions, for example, for single dosage administration. The concentrations of the compounds in the formulations are effective for delivery of an amount, upon administration, that is effective for the intended treatment. In certain embodiments, the compositions are formulated for single dosage administration. To formulate a composition, the weight fraction of a compound or mixture thereof is dissolved, suspended, dispersed or otherwise mixed in a selected vehicle at an effective concentration such that the treated condition is relieved or ameliorated. Pharmaceutical carriers or vehicles suitable for administration of the compounds provided herein include any such carriers known to those skilled in the art to be suitable for the particular mode of administration.
[0184] In addition, the compounds can be formulated as the sole pharmaceutically active ingredient in the composition or can be combined with other active ingredients. The active compound is included in the pharmaceutically acceptable carrier in an amount sufficient to exert a therapeutically useful effect in the absence of undesirable side effects on the subject treated. The therapeutically effective concentration can be determined empirically by testing the compounds in known in vitro and in vivo systems. The concentration of active compound in the drug composition depends on absorption, inactivation and excretion rates of the active compound, the physicochemical characteristics of the compound, the dosage schedule, and amount administered as well as other factors known to those of skill in the art. Pharmaceutically acceptable derivatives include acids, salts, esters, hydrates, solvates and prodrug forms. The derivative can be selected such that its pharmacokinetic properties are superior to the corresponding neutral compound. Compounds are included in an amount effective for ameliorating or treating the disorder for which treatment is contemplated.
[0185] Formulations suitable for a variety of administrations such as perenteral, intramuscular, subcutaneous, alimentary, transdermal, inhaling and other known methods of administration, are known in the art. The pharmaceutical compositions can also be administered by controlled release means and/or delivery devices as known in the art. Kits containing the compositions and/or the combinations with instructions for administration thereof are provided. The kit can further include a needle or syringe, which can be packaged in sterile form, for injecting the complex, and/or a packaged alcohol pad. Instructions are optionally included for administration of the active agent by a clinician or by the patient.
[0186] The compounds can be packaged as articles of manufacture containing packaging material, a compound or suitable derivative thereof provided herein, which is effective for treatment of a diseases or disorders contemplated herein, within the packaging material, and a label that indicates that the compound or a suitable derivative thereof is for treating the diseases or disorders contemplated herein. The label can optionally include the disorders for which the therapy is warranted.
Methods of Treatment
[0187] The compounds provided herein can be used for treating or preventing diseases or disorders in an animal, such as a mammal, including a human. In one embodiment, the method includes administering to a mammal an effective amount of a compound that modulates the expression of a particular gene (e.g., a gene listed herein) or a compound that binds to a product of a gene, whereby the disease or disorder is treated or prevented. Exemplary inhibitors provided herein are those identified by the screening assays. In addition, antibodies and antisense nucleic acids or double-stranded RNA (dsRNA), such as RNAi, are contemplated.
[0188] In a specific embodiment, as described hereinabove, gene expression can be inhibited by antisense nucleic acids. The therapeutic or prophylactic use of nucleic acids of at least six nucleotides, up to about 150 nucleotides, that are antisense to a gene or cDNA is provided. The antisense molecule can be complementary to all or a portion of the gene. For example, the oligonucleotide is at least 10 nucleotides, at least 15 nucleotides, at least 100 nucleotides, or at least 125 nucleotides. The oligonucleotides can be DNA or RNA or chimeric mixtures or derivatives or modified versions thereof, single-stranded or double-stranded. The oligonucleotide can be modified at the base moiety, sugar moiety, or phosphate backbone. The oligonucleotide can include other appending groups such as peptides, or agents facilitating transport across the cell membrane, hybridization-triggered cleavage agents or intercalating agents.
[0189] RNA interference (RNAi) (see, e.g., Chuang et al. (2000) Proc. Natl. Acad. Sci. U.S.A. 97:4985) can be employed to inhibit the expression of a nucleic acid. Interfering RNA (RNAi) fragments, such as double-stranded (ds) RNAi, can be used to generate loss-of-gene function. Methods relating to the use of RNAi to silence genes in organisms including, mammals, C. elegans, Drosophila and plants, and humans are known. Double-stranded RNA (dsRNA)-expressing constructs are introduced into a host, such as an animal or plant using, a replicable vector that remains episomal or integrates into the genome. By selecting appropriate sequences, expression of dsRNA can interfere with accumulation of endogenous mRNA. RNAi also can be used to inhibit expression in vitro. Regions include at least about 21 (or 21) nucleotides that are selective (i.e., unique) for the selected gene are used to prepare the RNAi. Smaller fragments of about 21 nucleotides can be transformed directly (i.e., in vitro or in vivo) into cells; larger RNAi dsRNA molecules can be introduced using vectors that encode them. dsRNA molecules are at least about 21 bp long or longer, such as 50, 100, 150, 200 and longer. Methods, reagents and protocols for introducing nucleic acid molecules in to cells in vitro and in vivo are known to those of skill in the art.
[0190] In an exemplary embodiment, nucleic acids that include a sequence of nucleotides encoding a polypeptide of a gene as listed herein can be administered to promote polypeptide function, by way of gene therapy. Gene therapy refers to therapy performed by administration of a nucleic acid to a subject. In this embodiment, the nucleic acid produces its encoded protein that mediates a therapeutic effect by promoting polypeptide function. Any of the methods for gene therapy available in the art can be used (see, Goldspiel et al., Clinical Pharmacy 12:488-505 (1993); Wu and Wu, Biotherapy 3:87-95 (1991); Tolstoshev, An. Rev. Pharmacol. Toxicol. 32:573-596 (1993); Mulligan, Science 260:926-932 (1993); and Morgan and Anderson, An. Rev. Biochem. 62:191-217 (1993); TIBTECH 11 (5):155-215 (1993).
[0191] In some embodiments, vaccines based on the genes and polypeptides provided herein can be developed. For example genes can be administered as DNA vaccines, either single genes or combinations of genes. Naked DNA vaccines are generally known in the art. Methods for the use of genes as DNA vaccines are well known to one of ordinary skill in the art, and include placing a gene or portion of a gene under the control of a promoter for expression in a patient with cancer. The gene used for DNA vaccines can encode full-length proteins, but can encode portions of the proteins including peptides derived from the protein. For example, a patient can be immunized with a DNA vaccine comprising a plurality of nucleotide sequences derived from a particular gene. In another embodiment, it is possible to immunize a patient with a plurality of genes or portions thereof. Without being bound by theory, expression of the polypeptide encoded by the DNA vaccine, cytotoxic T-cells, helper T-cells and antibodies are induced that recognize and destroy or eliminate cells expressing the proteins provided herein.
[0192] DNA vaccines can include a gene encoding an adjuvant molecule with the DNA vaccine. Such adjuvant molecules include cytokines that increase the immunogenic response to the polypeptide encoded by the DNA vaccine. Additional or alternative adjuvants are known to those of ordinary skill in the art and find use in the invention.
Animal Models and Transgenics
[0193] Also provided herein, the nucleotide the genes, nucleotide molecules and polypeptides disclosed herein find use in generating animal models of cancers, such as lymphomas and carcinomas. As is appreciated by one of ordinary skill in the art, when one of the genes provided herein is repressed or diminished, gene therapy technology wherein antisense RNA directed to the gene will also diminish or repress expression of the gene. An animal generated as such serves as an animal model that finds use in screening bioactive drug candidates. In another embodiment, gene knockout technology, for example as a result of homologous recombination with an appropriate gene targeting vector, will result in the absence of the protein. When desired, tissue-specific expression or knockout of the protein can be accomplished using known methods.
[0194] It is also possible that a protein is overexpressed in cancer. As such, transgenic animals can be generated that overexpress the protein. Depending on the desired expression level, promoters of various strengths can be employed to express the transgene. Also, the number of copies of the integrated transgene can be determined and compared for a determination of the expression level of the transgene. Animals generated by such methods find use as animal models and are additionally useful in screening for bioactive molecules to treat cancer.
Computer Programs and Methods
[0195] The various techniques, methods, and aspects of the methods provided herein can be implemented in part or in whole using computer-based systems and methods. In another embodiment, computer-based systems and methods can be used to augment or enhance the functionality described above, increase the speed at which the functions can be performed, and provide additional features and aspects as a part of or in addition to those of the invention described elsewhere in this document. Various computer-based systems, methods and implementations in accordance with the above-described technology are presented below.
[0196] A processor-based system can include a main memory, such as random access memory (RAM), and can also include a secondary memory. The secondary memory can include, for example, a hard disk drive and/or a removable storage drive, representing a floppy disk drive, a magnetic tape drive, or an optical disk drive. The removable storage drive reads from and/or writes to a removable storage medium. Removable storage medium refers to a floppy disk, magnetic tape, optical disk, and the like, which is read by and written to by a removable storage drive. As will be appreciated, the removable storage medium can comprise computer software and/or data.
[0197] In alternative embodiments, the secondary memory may include other similar means for allowing computer programs or other instructions to be loaded into a computer system. Such means can include, for example, a removable storage unit and an interface. Examples of such can include a program cartridge and cartridge interface (such as the found in video game devices), a movable memory chip (such as an EPROM or PROM) and associated socket, and other removable storage units and interfaces, which allow software and data to be transferred from the removable storage unit to the computer system.
[0198] The computer system can also include a communications interface. Communications interfaces allow software and data to be transferred between computer system and external devices. Examples of communications interfaces can include a modem, a network interface (such as, for example, an Ethernet card), a communications port, a PCMCIA slot and card, and the like. Software and data transferred via a communications interface are in the form of signals, which can be electronic, electromagnetic, optical or other signals capable of being received by a communications interface. These signals are provided to communications interface via a channel capable of carrying signals and can be implemented using a wireless medium, wire or cable, fiber optics or other communications medium. Some examples of a channel can include a phone line, a cellular phone link, an RF link, a network interface, and other communications channels.
[0199] In this document, the terms computer program medium and computer usable medium are used to refer generally to media such as a removable storage device, a disk capable of installation in a disk drive, and signals on a channel. These computer program products are means for providing software or program instructions to a computer system.
[0200] Computer programs (also called computer control logic) are stored in main memory and/or secondary memory. Computer programs can also be received via a communications interface. Such computer programs, when executed, permit the computer system to perform the features of the invention as discussed herein. In particular, the computer programs, when executed, permit the processor to perform the features of the invention. Accordingly, such computer programs represent controllers of the computer system.
[0201] In an embodiment where the elements are implemented using software, the software may be stored in, or transmitted via, a computer program product and loaded into a computer system using a removable storage drive, hard drive or communications interface. The control logic (software), when executed by the processor, causes the processor to perform the functions of the invention as described herein.
[0202] In another embodiment, the elements are implemented in hardware using, for example, hardware components such as PALs, application specific integrated circuits (ASICs) or other hardware components Implementation of a hardware state machine so as to perform the functions described herein will be apparent to person skilled in the relevant art(s). In yet another embodiment, elements are implanted using a combination of both hardware and software.
[0203] In another embodiment, the computer-based methods can be accessed or implemented over the World Wide Web by providing access via a Web Page to the methods of the invention. Accordingly, the Web Page is identified by a Universal Resource Locator (URL). The URL denotes both the server machine and the particular file or page on that machine. In this embodiment, it is envisioned that a consumer or client computer system interacts with a browser to select a particular URL, which in turn causes the browser to send a request for that URL or page to the server identified in the URL. The server can respond to the request by retrieving the requested page and transmitting the data for that page back to the requesting client computer system (the client/server interaction can be performed in accordance with the hypertext transport protocol (HTTP)). The selected page is then displayed to the user on the client's display screen. The client may then cause the server containing a computer program of the invention to launch an application to, for example, perform an analysis according to the methods provided herein.
Prostate-Associated Genes
[0204] Provided herein are probe and gene sequences that can be indicative of the presence and/or absence of prostate cancer in a subject. Also provided herein are probe and gene sequences that can be indicative of presence and/or absence of benign prostatic hyperplasia (BPH) in a subject. Also provided herein are probe and gene sequences that can be indicative of a prognosis of prostate cancer, where such a prognosis can include likely relapse of prostate cancer, likely aggressiveness of prostate cancer, likely indolence of prostate cancer, likelihood of survival of the subject, likelihood of success in treating prostate cancer, condition in which a particular treatment regimen is likely to be more effective than another treatment regimen, and combinations thereof. In one embodiment, the probe and gene sequences can be indicative of the likely aggressiveness or indolence of prostate cancer.
[0205] As provided in the methods and Tables herein, probes have been identified that hybridize to one or more nucleic acids of a prostate sample at different levels according to the presence or absence of prostate tumor, BPH and stroma in the sample. The probes provided herein are listed in conjunction with modified t statistics that represent the ability of that particular probe to indicate the presence or absence of a particular cell type in a prostate sample. Use of modified t statistics for such a determination is described elsewhere herein, and general use of modified t statistics is known in the art. Accordingly, provided herein are nucleotide sequences of probes that can be indicative of the presence or absence of prostate tumor and/or BPH cells, and also can be indicative of the likelihood of prostate tumor relapse in a subject.
[0206] Also provided in the methods and Tables herein are nucleotide and predicted amino acid sequences of genes and gene products associated with the probes provided herein. Accordingly, as provided herein, detection of gene products (e.g., mRNA or protein) or other indicators of gene expression, can be indicative of the presence or absence of prostate tumor and/or BPH cells, and also can be indicative of the likelihood of prostate tumor relapse in a subject. As with the probe sequences, the nucleotide and amino acid sequences of these gene products are listed in conjunction with modified t statistics that represent the ability of that particular gene product or indicator thereof to indicate the presence or absence of a particular cell type in a prostate sample.
[0207] Methods for determining the presence of prostate tumor and/or BPH cells, the likelihood of prostate tumor relapse in a subject, the likelihood of survival of prostate cancer, the aggressiveness of prostate tumor, the indolence of prostate tumor, survival, and other prognoses of prostate tumor, can be performed in accordance with the teachings and examples provided herein. Also provided herein, a set of probes or gene products can be selected according to their modified t statistic for use in combination (e.g., for use in a microarray) in methods of determining the presence of prostate tumor and/or BPH cells, and/or the likelihood of prostate tumor relapse in a subject.
[0208] Also provided herein, the gene products identified as present at increased levels in prostate cancer or in subjects with likely relapse of cancer, can serve as targets for therapeutic compounds and methods. For example an antibody or siRNA targeted to a gene product present at increased levels in prostate cancer can be administered to a subject to decrease the levels of that gene product and to thereby decrease the malignancy of tumor cells, the aggressiveness of a tumor, indolence of a tumor, survival, or the likelihood of tumor relapse. Methods for providing molecules such as antibodies or siRNA to a subject to decrease the level of gene product in a subject are provided herein or are otherwise known in the art.
[0209] In some embodiments, gene products identified as present at decreased levels in prostate cancer or in subjects with likely relapse of cancer, can serve as subjects for therapeutic compounds and methods. For example a nucleic acid molecule, such as a gene expression vector encoding a particular gene, can be administered to a individual with decreased levels of the particular gene product to increase the levels of that gene product and to thereby decrease the malignancy of tumor cells, the aggressiveness of a tumor, indolence of a tumor, likelihood of survival, or the likelihood of tumor relapse. Methods for providing gene expression vectors to a subject to increase the level of gene product in a subject are provided herein or are otherwise known in the art.
[0210] As used herein, the term "prostate cancer signature" refers to genes that exhibit altered expression (e.g., increased or decreased expression) with prostate cancer as compared to control levels of expression (e.g., in normal prostate tissue). Genes included in a prostate cancer signature can include any of those listed in the tables presented herein (e.g., Tables 3 and 4). For example, one or more (e.g., two, three, four, five, six, seven, eight nine, ten, 15, 20, 25, 30, 35, 40, 45, 50, 55, 60, 65, or more) of the genes listed in Table 3 can be are present in a prostate tissue sample (e.g., a prostate tissue sample containing normal stroma, prostate cancer cells, or both) at a level greater than or less than the level observed in normal, non-cancerous prostate tissue. In some cases, a prostate cancer signature can be a gene expression profile in which at least 10, 20, 30, 40, 50, 60, 70, 80, 90, or 100 percent of the genes listed in a table herein (e.g., Table 3 or Table 4) are expressed at a level greater than or less than their corresponding control levels in non-cancerous tissue.
[0211] As used herein, the terms "prostate cell-type predictor" genes and "prostate tissue predictor" genes refer to genes that can, based on their expression levels, serve as indicators as to whether a particular sample of prostate tissue contains particular cell types (e.g., prostate cancer cells, normal stromal cells, epithelial cells of benign prostate hyperplasia, or epithelial cells of dilated cystic glands). Such genes also can indicate the relative amounts of such cell types within the prostate tissue sample.
[0212] In some embodiments, this document features methods for identifying a subject as having or not having prostate cancer, comprising: (a) providing a prostate tissue sample from the subject; (b) measuring the level of expression for prostate cancer signature genes in the sample; (c) comparing the measured expression levels to reference expression levels for the prostate cancer signature genes; and (d) if the measured expression levels are significantly greater or less than the reference expression levels, identifying the subject as having prostate cancer, and if the measured expression levels are not significantly greater or less than the reference expression levels, identifying the subject as not having prostate cancer. The prostate tissue sample may not include tumor cells, or the prostate tissue sample may include tumor cells and stromal cells. The prostate cancer signature genes can be selected from the genes listed in the Tables herein (e.g., in Table 3 or Table 4). The method can include determining whether measured expression levels for ten or more prostate cancer signature genes are significantly greater or less than reference expression levels for the ten or more prostate cancer signature genes, and classifying the subject as having prostate cancer that is likely to relapse if the measured expression levels are significantly greater or less than the reference expression levels, or classifying the subject as having prostate cancer not likely to relapse if the measured expression levels are not significantly greater or less than the reference expression levels. The ten or more prostate cancer signature genes can be selected from the genes listed in Table 3 or Table 4 herein, for example. The method can include determining whether measured expression levels for twenty or more prostate cancer signature genes are significantly greater or less than reference expression levels for the twenty or more prostate cancer signature genes, and classifying the subject as having prostate cancer that is likely to relapse if the measured expression levels are significantly greater or less than the reference expression levels, or classifying the subject as having prostate cancer not likely to relapse if the measured expression levels are not significantly greater or less than the reference expression levels. The twenty or more prostate cancer signature genes can be selected from the genes listed in Table 3 or Table 4 herein, for example.
[0213] This document also features methods for determining the prognosis of a subject diagnosed as having prostate cancer, comprising: (a) providing a prostate tissue sample from the subject; (b) measuring the level of expression for prostate cancer signature genes in the sample; (c) comparing the measured expression levels to reference expression levels for the prostate cancer signature genes; and (d) if the measured expression levels are not significantly greater or less than the reference expression levels, identifying the subject as having a relatively better prognosis than if the measured expression levels are significantly greater or less than the reference expression levels, or if the measured expression levels are significantly greater or less than the reference expression levels, identifying the subject as having a relatively worse prognosis than if the measured expression levels are not significantly greater or less than the reference expression levels. The prostate tissue sample may not include tumor cells, or the prostate tissue sample may include tumor cells and stromal cells. The prostate cancer signature genes can be selected from the genes listed in the Tables herein (e.g., Table 8A or 8B).
[0214] In addition, this document provides methods for identifying a subject as having or not having prostate cancer, comprising: (a) providing a prostate tissue sample from the subject, wherein the sample comprises prostate stromal cells; (b) measuring expression levels for one or more genes in the stromal cells, wherein the one or more genes are prostate cancer signature genes; (c) comparing the measured expression levels to reference expression levels for the one or more genes, wherein the reference expression levels are determined in stromal cells from non-cancerous prostate tissue; and (d) if the measured expression levels are significantly greater or less than the reference expression levels, identifying the subject as having prostate cancer, and if the measured expression levels are not significantly greater or less than the reference expression levels, identifying the subject as not having prostate cancer. The prostate tissue sample may not include tumor cells, or the prostate tissue sample may include tumor cells and stromal cells. The prostate cancer signature genes can be selected from the genes listed in Table 3 or Table 4 herein, for example.
[0215] This document also provides methods for determining a prognosis for a subject diagnosed as having prostate cancer, comprising: (a) providing a prostate tissue sample from the subject, wherein the sample comprises prostate stromal cells; (b) measuring expression levels for one or more genes in the stromal cells, wherein the one or more genes are prostate cancer signature genes; (c) comparing the measured expression levels to reference expression levels for the one or more genes, wherein the reference expression levels are determined in stromal cells from non-cancerous prostate tissue; and (d) if the measured expression levels are not significantly greater or less than the reference expression levels, identifying the subject as having a relatively better prognosis than if the measured expression levels are significantly greater or less than the reference expression levels, or if the measured expression levels are significantly greater or less than the reference expression levels, identifying the subject as having a relatively worse prognosis than if the measured expression levels are not significantly greater or less than the reference expression levels. The prostate tissue sample may not include tumor cells, or the prostate tissue sample may include tumor cells and stromal cells. The prostate cancer signature genes can be selected from the genes listed in the tables herein (e.g., Table 3 or Table 4).
[0216] Further, this document features a method for identifying a subject as having or not having prostate cancer, comprising: (a) providing a prostate tissue sample from the subject; (b) measuring expression levels for one or more prostate cell-type predictor genes in the sample; (c) determining the percentages of tissue types in the sample based on the measured expression levels; (d) measuring expression levels for one more prostate cancer signature genes in the sample; (e) determining a classifier based on the percentages of tissue types and the measured expression levels; and (f) if the classifier falls into a predetermined range of prostate cancer classifiers, identifying the subject as having prostate cancer, or if the classifier does not fall into the predetermined range, identifying the subject as not having prostate cancer. Steps (b) and (d) can be carried out simultaneously.
[0217] This document also features a method for determining a prognosis for a subject diagnosed with and treated for prostate cancer, comprising: (a) providing a prostate tissue sample from the subject; (b) measuring expression levels for one or more prostate tissue predictor genes in the sample; (c) determining the percentages of tissue types in the sample based on the measured expression levels; (d) measuring expression levels for one more prostate cancer signature genes in the sample; (e) determining a classifier based on the percentages of tissue types and the measured expression levels; and (f) if the classifier falls into a predetermined range of prostate cancer relapse classifiers, identifying the subject as being likely to relapse, or if the classifier does not fall into the predetermined range, identifying the subject as not being likely to relapse. Steps (b) and (d) are carried out simultaneously.
[0218] In some embodiments, methods as described herein can be used for identifying the proportion of two or more tissue types in a tissue sample. Such methods can include, for example: (a) using a set of other samples of known tissue proportions from a similar anatomical location as the tissue sample in an animal or plant, wherein at least two of the other samples do not contain the same relative content of each of the two or more cell types; (b) measuring overall levels of one or more gene expression or protein analytes in each of the other samples; (c) determining the regression relationship between the relative proportion of each tissue type and the measured overall levels of each gene expression or protein analyte in the other samples; (d) selecting one or more analytes that correlate with tissue proportions in the other samples; (e) measuring overall levels of one or more of the analytes in step (d) in the tissue sample; (f) matching the level of each analyte in the tissue sample with the level of the analyte in step (d) to determine the predicted proportion of each tissue type in the tissue sample; and (g) selecting among predicted tissue proportions for the tissue sample obtained in step (f) using either the median or average proportions of all the estimates. The tissue sample can contain cancer cells (e.g., prostate cancer cells).
[0219] Methods described herein can be used for comparing the levels of two or more analytes predicted by one or more methods to be associated with a change in a biological phenomenon in two sets of data each containing more than one measured sample. Such methods can comprise: (a) selecting only analytes that are assayed in both sets of data; (b) ranking the analytes in each set of data using a comparative method such as the highest probability or lowest false discovery rate associated with the change in the biological phenomenon; (c) comparing a set of analytes in each ranked list in step (b) with each other, selecting those that occur in both lists, and determining the number of analytes that occur in both lists and show a change in level associated with the biological phenomenon that is in the same direction; and (d) calculating a concordance score based on the probability that the number of comparisons would show the observed number of change in the same direction, at random. In step (a), the length of each list can be varied to determine the maximum concordance score for the two ranked lists.
[0220] The invention will be further described in the following examples, which do not limit the scope of the invention described in the claims.
EXAMPLES
Example 1
Diagnosis of Prostate Cancer without Tumor Cells Using Differentially Expressed Genes in Stroma Adjacent to Tumors
[0221] Over one million prostate biopsies are performed in the U.S. every year. Pathology examination is not definitive in a significant percentage of cases, however, due to the presence of equivocal structures or continuing clinical suspicion. To investigate gene expression changes in the tumor microenvironment vs. normal stroma, gene expression profiles from 15 volunteer biopsy specimens were compared to profiles from 13 specimens containing largely tumor-adjacent stroma. As described below, more than a thousand significant expression changes were identified and filtered to eliminate possible age-related genes, as well as genes that also are expressed at detectable levels in tumor cells. A stroma-specific classifier was constructed based on the 114 remaining unique candidate genes (131 Affymetrix probe sets). The classifier was tested on 380 independent cases, including 255 tumor-bearing cases and 125 non-tumor cases (normal biopsies, normal autopsies, remote stroma as well as pure tumor adjacent stroma). The classifier predicted the tumor status of patients with an average accuracy of 97.4% (sensitivity=98.0% and specificity=89.7%), whereas a randomly generated and trained classifier had no diagnostic value. These results indicate that the prostate cancer microenvironment exhibits reproducible changes useful for categorizing stroma as "presence of tumor" and "non-presence of tumor."
[0222] Prostate Cancer Patients Samples and Expression Analysis:
[0223] Datasets 1 and 2 (Table 1) were obtained using post-prostatectomy frozen tissue samples. All tissues, except where noted, were collected at surgery and escorted to pathology for expedited review, dissection, and snap freezing in liquid nitrogen. RNA for expression analysis was prepared directly from frozen tissue following dissection of OCT (optimum cutting temperature compound) blocks with the aid of a cryostat. For expression analysis, 50 micrograms (10 micrograms for biopsy tissue) of total RNA samples were processed for hybridization to Affymetrix GeneChips.
[0224] Dataset 1 consists of 109 post-prostatectomy frozen tissue samples from 87 patients. Twenty-two cases were analyzed twice using one sample from a tumor-enriched specimen and one sample from a non-tumor specimen (more than 1.5 cm away from the tumor), usually the contralateral lobe. In addition, Dataset 1 contains 27 prostate biopsy specimens obtained as fresh snap frozen biopsy cores from 18 normal participants in a clinical trial to evaluate the role of Difluoromethylornithine (DFMO) to decrease the prostate size of normal men (Simoneau et al. (2008) Cancer Epidemiol. Biomarkers Prev. 17:292-299). Finally, Dataset 1 contains 13 cases of normal prostates obtained from the rapid autopsy program of the Sun Health Research Institute, from subjects with an average age of 82 years.
[0225] Dataset 2 contains 136 samples from 82 patients, where 54 cases were analyzed as pairs of tumor-enriched samples and, for most cases, non-tumor tissue obtained from the same OCT block as tumor-adjacent tissue. This series includes specimens for which expression coefficients were validated (Stuart et al. (2004) Proc. Natl. Acad. Sci. U.S.A. 101:615-620).
[0226] Expression analysis for Datasets 1 and 2 was carried out using Affymetrix U133Plus2 and U133A GeneChips, respectively; the expression data are publicly available at GEO database on the World Wide Web at ncbi.nlm.nih.gov/geo, with accession numbers GSE17951 (Dataset 1) and GSE8218 (Dataset 2). For both datasets, cell type distributions for the four principal cell types (tumor epithelial cells, stroma cells, epithelial cells of BPH, and epithelial cells of dilated cystic glands) were determined from frozen sections prepared immediately before and after the sections pooled for RNA preparation by three (Dataset 1) or four (Dataset 2) pathologists whose estimates were averaged as described (Stuart et al., supra). The distributions of tumor percentage for Dataset 1 and 2 are shown in FIGS. 1B and 1C.
[0227] Dataset 3 consists of a published series (Stephenson et al. (2005) Cancer 104:290-298) of 79 cases for which expression data were measured with Affymetrix U133A chips. The cell composition was not documented at the time of data collection. Cell composition was estimated using multigene signatures that are invariant with tumor surgical pathology parameters of Gleason and stage by the CellPred program (World Wide Web at webarraydb.org), which confirmed that all 79 samples included tumor cells, with tumor content ranging from 24% to 87% (FIG. 1D).
[0228] Dataset 4 includes 57 samples from 44 patients, including 13 tumor-adjacent stroma samples and 44 tumor-bearing samples. Gene expression in these 57 samples was measured with Affymetrix U133A GeneChips. Tumor percentage (ranging from 0% to 80%, FIG. 1E) was approximated using the CellPred program.
[0229] Dataset 5 consists of 4 pooled normal stromal samples and 12 tumor samples gleaned by Laser Capture Micro dissection (LCM) using frozen tissue samples. Each pooled normal stroma sample was pooled from two LCM captured stroma samples from specimens from which no tumor was recovered in the surgical samples available for the research protocol described herein, whereas tumor samples were LCM-captured prostate cancer cells. Gene expression in these 16 samples (using 10 micrograms of total RNA) was measured using Affymetrix U133Plus2 chips.
[0230] Compared to U133A (with ˜22,000 probe sets) used for Datasets 2, 3 and 4, the U133Plus2 platform used for Datasets 1 and 5 had about 30,000 more probe sets. To attain an analysis across multiple datasets, only the probes common to these two platforms were used, i.e., only about 22,000 common probe sets in each Dataset were considered. First, Dataset 1 was quantile-normalized using function `normalizeQuantiles( )` of LIMMA routine (Dalgaard (2002) Statistics and Computing: Introductory Statistics with R, p. 260, Springer-Verlag Inc., New York. Datasets 2-5 were then quantile-normalized by referencing normalized Dataset 1 with a modified function `REFnormalizeQuantiles( ),` which is available from ZJ.
TABLE-US-00001 TABLE 1 Datasets used in the study1 Subj. Array Array: Data Platform Num. Num. Tumor/Nontumor/Normal Ref. 1 U133Plus2 P = 87 109 69/40/0 GSE17951 Training + B = 18 27 0/0/27 Test A = 13 13 0/0/13 2 U133A P = 82 136 65/71/0 GSE08218 Test 3 U133A P = 79 79 79/0/0 Stephenson et al., supra Test 4 U133A P = 44 57 44/13/0 http://www.ebi.ac.uk/microarray- Test as/ae/browse.html?keywords=E-TABM-26 5 U133P2 L = 20 16 12/0/4 GSE17951 Test 1P, B, A, and L represent patient, normal biopsy, normal rapid autopsy, and LCM, respectively. Datasets 1 and 2 were collected from five participating institutions in San Diego County, CA. Demographic, Pathology, and clinical values are individually recorded (Shadow charts) and maintained in the UCI SPECS consortium database including tracking sheets of elapsed times following surgery during sample handling.
[0231] Statistical Tools Implemented in R.:
[0232] The Linear Models for Microarray Data (LIMMA package from Bioconductor, on the World Wide Web at bioconductor.org) was used to detect differentially expressed genes. Prediction Analysis of Microarray (PAM, implemented by the PAMR package from Bioconductor) was used to develop an expression-based classifier from training set and then applied to the test sets without any change (Guo et al. (2007) Biostatistics 8:86-100). Fisher's Exact Test was used to demonstrate the efficiency of the classifier when it was tested on remote stroma versus tumor adjacent stroma. Fisher's test was used instead of chi-square because chi-square test is not suitable when the expected values in any of the cells of the table are below 10. All statistical analysis was done using R language (World Wide Web at r-project.org).
[0233] Multiple Linear Regression Model:
[0234] A multiple linear regression (MLR) model was used to describe the observed Affymetrix intensity of a gene as the summation of the contributions from different types of cells given the pathological cell constitution data:
G = β 0 + j = 1 C β j p j + e , ( 1 ) ##EQU00012##
where g is the expression value for a gene, p is the percentage data determined by the pathologists, and β's are the expression coefficients associated with different cell types. In model (1), C is the number of tissue types under consideration. In the present case, three major tissue types were included, i.e., tumor, stroma, and BPH. βj is the estimate of the relative expression level in cell type j (i.e., the expression coefficient) compared to the overall mean expression level β0. The regression model was applied to the patient cases in Dataset 1 to obtain the model parameters (β's) and their corresponding p-values, which were used to aid subsequent gene screening. The application to prostate cancer expression data and validation by immunohistochemistry and by correlation of derived βj values with LCM-derived samples assayed by qPCR has been described (Stuart et al., supra).
[0235] Identification of Stroma-Derived Genes and Development of the Diagnostic Classifier:
[0236] It was hypothesized that stroma within and directly adjacent to prostate cancer epithelial cell formations of infiltrating tumors exhibit significant RNA expression changes compared to normal prostate stroma. To obtain an initial comparison of tumor-adjacent stroma to normal stroma, normal fresh frozen biopsy tissue was used as a source of normal stroma. Out of 27 normal biopsy samples, 15 were selected from 15 different participants. The remaining 12 biopsy samples were reserved for testing. Gene expression microarray data were obtained and compared to 13 tumor-bearing patient cases from Dataset 1 selected to tumor (T) greater than 0% but less than 10% tumor cell content (the average stroma content is ˜80%). These criteria ensured that the majority of stroma tissues included were close to tumor, while T<10% ensures that the impact from tumor cells was minimal since the aim was to capture altered expression signals from stroma cells rather than from tumor cells.
[0237] As the number of biopsies available was limited, a permutation strategy was adopted to maximize their use. First 13 of the 15 normal biopsy samples were selected and their gene expression was compared to the 13 tumor-adjacent stroma samples using the moderated t-test implemented in the LIMMA package of R (Dalgaard, supra). This comparison yielded 3888 expression changes between these two groups with a p value <0.05.
[0238] A substantial difference in age existed between the normal stroma group (average age=51.9 years) and the tumor-adjacent stroma group (average age=60.6 years). The overall gene expression of the 13 normal stroma samples used for training was compared to that of 13 normal prostate specimens obtained from the rapid autopsy program (see above), with an average age of 82 years. The comparison revealed 8898 significant expression changes (p<0.05), of which 2210 also were detected in the comparison of normal stroma samples between tumor-adjacent stroma (FIG. 2A). To eliminate potential impact from aging related genes, only 3888-2210=1678 genes were used for further inquiry.
[0239] A potential issue related to using patient cases with 10%>T>0% was that the detected expression changes may have included expression changes specific to tumor cells or epithelium cells rather than only to stroma cells. To reduce the possibility that epithelial-cell derived expression changes dominated, a secondary gene screening via MLR analysis was used. MLR was used to determine cell-specific gene expression based on "knowledge" of the percent cell composition of the samples of Dataset 1 as determined by a panel of four pathologists (Stuart et al., supra; the distribution is shown in FIG. 1B for 109 samples from 87 patients of Dataset 1). Thus, the expression data of 109 patient samples was fit with an MLR model by which the comparative signal from individual cell types (i.e., expression coefficients, β's) and corresponding p-values were calculated as described by Stuart et al. (supra). Model diagnostics showed that the fitted model for significant genes (with any significant β's) accounted for >70% of the total variation (or the variation of e in Equation 1 was <30% of the total variation), indicating a plausible modeling scheme. Cell-type specific expression coefficients were then used to identify genes that are largely expressed in stroma by eliminating genes expressed in epithelial cells at greater than 10% of the expression in stroma cells, i.e.,
β T < 1 10 β S . ##EQU00013##
Thus from the 1678 genes of the initial analysis, 160 candidate probe sets with three criteria were selected: (1) βs<0, (2) βs<10×βTβS>10×βT, and (3) p (βs)<0.1. When the values of the βs's were compared to the Ns, it became apparent that the expression levels of these 160 probe sets in stroma cells were substantially higher than in tumor cells (FIG. 2B). Moreover, the average βs of these 160 probe sets was 0.011, which was more than two-fold increased compared to the average of any βs>0. Thus, the 160 selected probe sets were among the highest expressed stroma genes observed.
[0240] The second step for the permutation analysis was then carried out. The above procedure was repeated using a different selections of 13 biopsy samples of the 15 until all 105 possible combinations of 13 normal biopsy samples drawn from 15 (C1513=105, where Cnm is the number of combinations of m elements chosen from a total of n elements) was complete. A total of 339 probe sets (Table 3) were generated by the 105-fold gene selection procedure with a frequency of selection as summarized in FIG. 1A. Permutation increased the basis set by 339/160, or a 2-fold amplification.
[0241] Probe sets with at least 50 occurrences (about 50%) of the 105-fold permutation were selected for classifier construction. Prediction Analysis for Microarrays (PAM; Tibshirani et al. (2002) Proc. Natl. Acad. Sci. U.S.A. 99:6567-6572) was used to build a diagnostic classifier. The training set (Table 2, line 1) included all 15 normal biopsies and the 13 tumor-adjacent stroma samples that were used for the derivation of significant differences. Of the 146 PAM-input probe sets, 131 were retained following the 10-fold cross validation procedure of PAM, leading to a prediction accuracy of 96.4%. The separation of normal and tumor-adjacent stroma cases of the training set by the Classifier is illustrated into two distinct populations is shown in FIG. 2c. The complete list of 146 probe-sets, including 131 probe-sets selected by PAM, is given in Table 4. Many of these genes are known by their function and expression in mesenchymal derivatives such as muscle, nerve, and connective tissue.
TABLE-US-00002 TABLE 2 Operating characteristics (OC) for training analysis and tests. Accuracy Sensitivity Specificity Dataset Case Num. % % % 1 Training set 1 28 (15 + 13) 96.4 92.3 100 Test set Tumor 2 Tumor-bearing 1 55 (68 - 13) 96.4 96.4 NA 3 Tumor-bearing 2 65 100 100 NA 4 Tumor-bearing 3 79 100 100 NA 5 Tumor-bearing 4 44 100 100 NA Normals 6 Biopsies (1) 1 7 100 NA 100 7 Biopsies (2) 1 5 60 NA 60 8 Rapid autopsies 1 13 92.3 NA 92.3 Manual Microdissected/ LCM 9 Tumor-adjacent Stroma 2 71 97.1 97.1 NA 10 Tumor-adjacent Stroma 4 13 100 100 NA 11 Tumor-adjacent Stroma 1 12 75 75 NA 12 Tumor-bearing LCM 5 12 100 100 NA 13 Normal Stroma LCM 5 4 100 NA 100
[0242] Testing with Independent Datasets:
[0243] The 131-element classifier was then tested on numerous prostate samples not used for training, including 55 tumor-bearing cases from Dataset 1 and 65 tumor-bearing cases from Dataset 2. Also included were two additional datasets of 79 tumor-bearing cases (Dataset 3) and 44 tumor-bearing cases (Dataset 4), where both the samples and expression analyses were from separate institutes (Table 1). These four test sets were composed entirely of tumor bearing samples (Table 2, lines 2 to 5). In all four tests, almost all samples (n=243) were recognized as "tumor" with high average accuracy ˜99%. FIG. 1B gives the distribution of tumor percentages for the 109 patient cases of Dataset 1. Two misclassified test samples occurred at T=20% and 25% (marked with "*" in FIG. 1B) and therefore are not restricted to the presence of high tumor content. The classification method utilizing PAM did not involve any "knowledge" of cell type content and therefore is successful on samples with a broad range of tumor epithelial cells, including samples with just a low percentage of epithelial cells. Such samples consist of over 90% stroma cells. For the test cases of Dataset 2, tumor cell composition ranges from 2% to 80% (FIG. 1C). For Datasets 3 and 4, the tumor epithelium component was not assessed but was estimated using the CellPred program. This yielded estimates of 24% to over 80% stroma cell content for Dataset 3, and as little as 0% to over 80% stroma cell content for Dataset 4 (FIGS. 1D and 1E). These observations suggested that the classifier is accurate in the classification of independent tumor-bearing samples as "presence of tumor" and does not depend upon "recognition" of gene expression if the tumor epithelial component.
[0244] The classifier also was tested using specimens composed mainly of normal prostate stroma and epithelium. First, the classifier was tested on the 12 remaining biopsies from the DMFO study which were separated into two groups. Group 1 (Table 2, line 6) included second biopsies of the same participants whose first biopsy samples were included in the training set, and therefore are not completely independent cases. Group 2 (Table 2, line 7) included the five biopsy samples of cases not used for training. These samples were devoid of tumor but contained normal epithelial components, typically ranging from ˜35% to ˜45%. Microarray data were obtained for these 12 cases and used for testing. The biopsy samples in group 1 were accurately (100%) identified as non-tumor. For group 2, two out of five biopsy samples were categorized as "presence of tumor." When the histories for these cases were consulted, however, it was found that both had consistently exhibited elevated PSA levels of 6.1, 9.6, and 8 ng/ml (normal values <3 ng/ml), respectively, although no tumor was observed in either of two sets of sextant biopsies obtained from these cases. All other donors of normal biopsies exhibited normal PSA values. The classifier was then tested on 13 specimens obtained by rapid autopsy of individuals dying of unrelated causes (Table 2, line 8). Twelve out of these 13 cases (i.e., 92.3%), were classified as nontumor. Histological examination of all embedded tissue of the two "misclassified" cases revealed multiple foci of small "latent" tumors. The 25 samples which were drawn from normal tissues were correctly classified as having no tumor present, or were classified in accordance with abnormal features that were subsequently uncovered. These results provide further support for the ability of the classifier to discriminate between normal and abnormal prostate tissues in the absence of histologically recognizable tumor cells in the samples studied.
[0245] Validation by Manual Microdissection and LCM of Tumor-Adjacent and Remote Stroma:
[0246] Based on the strong performance with mixed tissue test samples, experiments were conducted to validate the classifier by developing histologically confirmed pure tumor-adjacent stroma samples. Tumor-bearing tissue mounted in OCT blocks in a cryostat were examined by frozen section to visualize the location of the tumor. The OCT-embedded block was etched with a single straight cut with a scalpel to divide the embedded tissue into a tumor zone and tumor-adjacent stroma. Subsequent cryosections were separated into two halves and used for H and E staining to confirm their composition. For sections of tumor-adjacent stroma with a large area (i.e., ˜10 mm2), multiple frozen sections were pooled and used for RNA preparation and microarray hybridization. A final frozen section was stained and examined to confirm that it was free of tumor cells. For smaller areas of the tumor-adjacent zone, the adjacent tissue was removed as a piece, remounted in reverse orientation and a final frozen section was made to confirm that the piece was free of tumor cells. This tissue was then used for RNA preparation and expression analysis.
[0247] Seventy-one tumor-adjacent stroma samples were obtained from the samples of Dataset 2, 13 from the samples of Dataset 4, and 12 from the samples of Dataset 1, using the manual microdissection method. These tumor-adjacent stroma samples were then used for expression analysis. The expression values for the 131 classifier probe sets were tested using the PAM procedure. Accuracies of 97.1%, 100%, and 75% were observed for the classification as "presence of tumor" (Table 2, lines 9-11). These results indicate an overall accuracy of 94.7% for the 96 independent samples.
[0248] Finally, examined laser capture microdissected samples were prepared from the samples of Dataset 5. Twelve tumor cell samples were prepared as 100% prostate cancer cells, while four pooled stroma control samples were prepared from cases where no tumor had been recovered in the surgical samples available for the research protocol. These samples were categorized by the classifier as 100% "presence of tumor" and 100% "no presence of tumor," respectively.
[0249] Since several cases (especially from Dataset 1) appeared "misclassified," it was of interest to know how far from a known tumor site the expression changes characteristic of tumor stroma may extend. There was insufficient tissue for a systematic analysis of samples at various known distances, but 28 cases from Dataset 1 were available that were greater than 1.5 cm from the tumor sites of the same gland and generally were from the contralateral lobe of the donor gland. Array data was collected from all pieces and categorized by the classifier. Only ten of the 28 samples (35.7%) were categorized as tumor-associated stroma. This distribution of classifications was compared to the distribution for the original 12 tumor-adjacent stroma samples manually prepared from samples of Dataset 1 (Table 2, line 11) using the Fisher Exact Test. The distribution for the 28 "remote" samples was significantly different than the category distribution for the 12 authentic tumor-adjacent stroma samples of the same cases as judged by a Fischer Exact test, p=0.038. This result strongly suggests that the expression changes of tumor-adjacent stroma are not inevitable in stroma taken from arbitrary sites of the same tumor-bearing glands, and likely reflect that proximity to tumor affects the expression changes of the genes of the classifier developed here.
[0250] Comparison with Random-Gene Classifiers:
[0251] To further validate the 131-element diagnostic classifier, 100 randomized experiments were carried out. In each experiment, 1,700 probe sets were randomly selected from the 12,901 probe set basis, which was obtained by subtracting 9376 aging related probe sets from the entire 22277 probe sets, where 9376 aging related expression changes were defined exactly as before. Finally, the sampled probe sets were screened with the same MLR criteria used for development of the 131-element classifier, i.e., (1) βs>0, (2) βs>10×βT, and (3) p (βs<0.1). In each random experiment, the genes that survived the MLR filter were used to develop a classifier with PAM exactly as for the 131-probe set classifier. PAM selected an average of 6.2 probe sets (<<131), and the average performance of these random-gene classifiers based on the tests of other datasets are summarized in Table 5. These random-gene classifiers failed to detect the presence of tumor in most of the test sets. The random classifier was particularly poor, however, in defining a normal distribution for Dataset 1, leading an 8.7% (Table 5, line 2) sensitivity suggesting a bias toward "no presence of tumor." This correlated with the second lack of normal distribution due to a similar bias toward "no presence of tumor," but this time affecting the normal tissues and thereby giving rise to the appearance of accuracy with an average of 82.3% (Table 5, average lines 6-9 and 13). In general, however, the random model tended to be a normal distribution with poor accuracies in the range of 12.9% to 19.2%, indicating that the results obtained with the developed 131-probe set classifier cannot be attributed to chance.
TABLE-US-00003 TABLE 3 Basis set of genes, derived as described herein. Gene Adj. Probe Set ID Gene Title Symbol logFC t P P B 200067_x_at sorting nexin 3 SNX3 -0.13 -1.85 0.07 0.34 -4.82 200685_at splicing factor, SFRS11 -0.16 -2.19 0.04 0.24 -4.20 arginine/serine-rich 11 200788_s_at phosphoprotein enriched in PEA15 -0.22 -2.34 0.03 0.20 -3.91 astrocytes 15 201022_s_at destrin (actin depolymerizing DSTN -0.14 -2.07 0.05 0.27 -4.43 factor) 201312_s_at SH3 domain binding glutamic SH3BGRL -0.19 -1.84 0.08 0.34 -4.82 acid-rich protein like 201313_at enolase 2 (gamma, neuronal) ENO2 -0.36 -2.15 0.04 0.25 -4.29 201344_at ubiquitin-conjugating enzyme UBE2D2 -0.38 -2.96 0.01 0.09 -2.59 E2D 2 (UBC4/5 homolog, yeast) 201380_at cartilage associated protein CRTAP -0.22 -2.00 0.05 0.29 -4.56 201389_at integrin, alpha 5 (fibronectin ITGA5 -0.50 -2.46 0.02 0.17 -3.67 receptor, alpha polypeptide) 201430_s_at dihydropyrimidinase-like 3 DPYSL3 -0.35 -1.85 0.08 0.34 -4.82 201431_s_at dihydropyrimidinase-like 3 DPYSL3 -0.40 -2.78 0.01 0.12 -3.00 201540_at four and a half LIM domains 1 FHL1 -0.23 -1.94 0.06 0.31 -4.66 201560_at chloride intracellular channel 4 CLIC4 -0.15 -1.73 0.09 0.37 -5.01 201566_x_at inhibitor of DNA binding 2, ID2 0.40 2.73 0.01 0.13 -3.11 dominant negative helix-loop- helix protein 201655_s_at heparan sulfate proteoglycan 2 HSPG2 -0.18 -1.19 0.25 0.57 -5.75 201667_at gap junction protein, alpha 1, GJA1 -0.17 -1.75 0.09 0.36 -4.97 43 kDa 201841_s_at heat shock 27 kDa protein 1 HSPB1 -0.44 -3.97 0.00 0.02 -0.12 201843_s_at EGF-containing fibulin-like EFEMP1 -0.32 -2.21 0.04 0.23 -4.17 extracellular matrix protein 1 201980_s_at Ras suppressor protein 1 RSU1 -0.17 -1.79 0.08 0.35 -4.91 201981_at pregnancy-associated plasma PAPPA -0.24 -1.51 0.14 0.45 -5.34 protein A, pappalysin 1 202073_at optineurin OPTN -0.29 -1.93 0.06 0.31 -4.68 202192_s_at growth arrest-specific 7 GAS7 -0.43 -1.96 0.06 0.30 -4.62 202196_s_at dickkopf homolog 3 (Xenopus DKK3 -0.15 -1.29 0.21 0.53 -5.63 laevis) 202202_s_at laminin, alpha 4 LAMA4 -0.35 -1.83 0.08 0.34 -4.85 202362_at RAP1A, member of RAS RAP1A -0.32 -1.94 0.06 0.31 -4.65 oncogene family 202422_s_at acyl-CoA synthetase long- ACSL4 -0.16 -1.08 0.29 0.62 -5.87 chain family member 4 202432_at protein phosphatase 3 PPP3CB -0.17 -1.81 0.08 0.35 -4.89 (formerly 2B), catalytic subunit, beta isoform 202440_s_at suppression of tumorigenicity ST5 -0.17 -1.26 0.22 0.54 -5.66 5 202522_at phosphatidylinositol transfer PITPNB -0.16 -2.85 0.01 0.11 -2.85 protein, beta 202565_s_at supervillin SVIL -0.36 -2.45 0.02 0.18 -3.69 202588_at adenylate kinase 1 AK1 -0.18 -1.96 0.06 0.30 -4.63 202613_at CTP synthase CTPS -0.21 -1.71 0.10 0.38 -5.03 202620_s_at procollagen-lysine, 2- PLOD2 -0.13 -1.34 0.19 0.51 -5.57 oxoglutarate 5-dioxygenase 2 202685_s_at AXL receptor tyrosine kinase AXL -0.30 -1.79 0.08 0.35 -4.92 202796_at synaptopodin SYNPO -0.22 -1.29 0.21 0.53 -5.63 202806_at drebrin 1 DBN1 -0.43 -4.08 0.00 0.02 0.17 202931_x_at bridging integrator 1 BIN1 -0.27 -2.39 0.02 0.19 -3.82 203151_at microtubule-associated protein MAP1A -0.69 -4.02 0.00 0.02 0.03 1A 203178_at glycine amidinotransferase (L- GATM -0.24 -1.39 0.18 0.49 -5.51 arginine: glycine amidinotransferase) 203299_s_at adaptor-related protein AP1S2 -0.41 -2.77 0.01 0.12 -3.01 complex 1, sigma 2 subunit 203389_at kinesin family member 3C KIF3C -0.26 -2.39 0.02 0.19 -3.82 203436_at ribonuclease P/MRP 30 kDa RPP30 -0.14 -1.61 0.12 0.41 -5.19 subunit 203438_at stanniocalcin 2 STC2 -0.37 -1.80 0.08 0.35 -4.90 203456_at PRA1 domain family, member PRAF2 -0.28 -2.07 0.05 0.27 -4.44 2 203501_at plasma glutamate PGCP -0.30 -2.27 0.03 0.22 -4.05 carboxypeptidase 203597_s_at WW domain binding protein 4 WBP4 -0.34 -3.56 0.00 0.04 -1.17 (formin binding protein 21) 203705_s_at frizzled homolog 7 FZD7 0.25 1.46 0.15 0.47 -5.41 (Drosophila) 203729_at epithelial membrane protein 3 EMP3 -0.31 -1.45 0.16 0.47 -5.43 203766_s_at leiomodin 1 (smooth muscle) LMOD1 -0.36 -2.04 0.05 0.28 -4.49 203939_at 5'-nucleotidase, ecto (CD73) NT5E -0.49 -3.80 0.00 0.03 -0.54 204030_s_at schwannomin interacting SCHIP1 -0.32 -1.91 0.07 0.32 -4.71 protein 1 204036_at lysophosphatidic acid receptor LPAR1 -0.31 -1.85 0.07 0.33 -4.81 1 204058_at malic enzyme 1, NADP(+)- ME1 -0.34 -2.21 0.03 0.23 -4.17 dependent, cytosolic 204059_s_at malic enzyme 1, NADP(+)- ME1 -0.35 -1.96 0.06 0.30 -4.63 dependent, cytosolic 204115_at guanine nucleotide binding GNG11 -0.22 -1.34 0.19 0.51 -5.57 protein (G protein), gamma 11 204134_at phosphodiesterase 2A, cGMP- PDE2A -0.16 -1.41 0.17 0.49 -5.48 stimulated 204159_at cyclin-dependent kinase CDKN2C -0.46 -3.42 0.00 0.05 -1.49 inhibitor 2C (p18, inhibits CDK4) 204302_s_at KIAA0427 KIAA0427 -0.10 -1.10 0.28 0.61 -5.85 204303_s_at KIAA0427 KIAA0427 -0.35 -2.17 0.04 0.24 -4.25 204304_s_at prominin 1 PROM1 0.59 1.26 0.22 0.55 -5.67 204365_s_at receptor accessory protein 1 REEP1 -0.29 -2.18 0.04 0.24 -4.23 204396_s_at G protein-coupled receptor GRK5 -0.46 -2.09 0.05 0.27 -4.40 kinase 5 204410_at eukaryotic translation EIF1AY -0.21 -1.56 0.13 0.43 -5.27 initiation factor 1A, Y-linked 204517_at peptidylprolyl isomerase C PPIC -0.17 -1.98 0.06 0.30 -4.60 (cyclophilin C) 204557_s_at DAZ interacting protein 1 DZIP1 -0.21 -1.57 0.13 0.43 -5.25 204570_at cytochrome c oxidase subunit COX7A1 -0.37 -1.56 0.13 0.43 -5.27 VIIa polypeptide 1 (muscle) 204584_at L1 cell adhesion molecule L1CAM -1.20 -3.10 0.00 0.08 -2.26 204627_s_at integrin, beta 3 (platelet ITGB3 -0.82 -3.51 0.00 0.04 -1.28 glycoprotein IIIa, antigen CD61) 204628_s_at integrin, beta 3 (platelet ITGB3 -0.31 -2.42 0.02 0.18 -3.75 glycoprotein IIIa, antigen CD61) 204639_at adenosine deaminase ADA -0.38 -1.27 0.21 0.54 -5.66 204736_s_at chondroitin sulfate CSPG4 -0.55 -3.29 0.00 0.06 -1.81 proteoglycan 4 204777_s_at mal, T-cell differentiation MAL -0.99 -3.32 0.00 0.06 -1.74 protein 204939_s_at phospholamban PLN -0.45 -2.53 0.02 0.16 -3.53 204940_at phospholamban PLN -0.49 -2.45 0.02 0.18 -3.70 204963_at sarcospan (Kras oncogene- SSPN -0.26 -1.97 0.06 0.30 -4.61 associated gene) 205076_s_at myotubularin related protein MTMR11 -0.57 -2.92 0.01 0.10 -2.69 11 205111_s_at phospholipase C, epsilon 1 PLCE1 -0.35 -1.53 0.14 0.44 -5.30 205132_at actin, alpha, cardiac muscle 1 ACTC1 -0.99 -3.28 0.00 0.06 -1.83 205231_s_at epilepsy, progressive EPM2A -0.42 -2.97 0.01 0.09 -2.56 myoclonus type 2A, Lafora disease (laforin) 205257_s_at amphiphysin AMPH -0.22 -1.75 0.09 0.37 -4.98 205265_s_at SPEG complex locus SPEG -0.31 -1.68 0.10 0.39 -5.09 205303_at potassium inwardly-rectifying KCNJ8 -0.42 -2.88 0.01 0.10 -2.77 channel, subfamily J, member 8 205304_s_at potassium inwardly-rectifying KCNJ8 -0.24 -1.83 0.08 0.34 -4.84 channel, subfamily J, member 8 205325_at phytanoyl-CoA 2-hydroxylase PHYHIP -0.42 -1.49 0.15 0.46 -5.37 interacting protein 205368_at family with sequence FAM131B -0.27 -2.31 0.03 0.21 -3.98 similarity 131, member B 205384_at FXYD domain containing ion FXYD1 -0.52 -1.81 0.08 0.34 -4.87 transport regulator 1 (phospholemman) 205398_s_at SMAD family member 3 SMAD3 -0.22 -1.52 0.14 0.45 -5.33 205433_at butyrylcholinesterase BCHE -0.93 -2.52 0.02 0.16 -3.55 205475_at scrapie responsive protein 1 SCRG1 -0.45 -1.87 0.07 0.33 -4.78 205478_at protein phosphatase 1, PPP1R1A -0.36 -1.58 0.12 0.43 -5.24 regulatory (inhibitor) subunit 1A 205554_s_at deoxyribonuclease I-like 3 DNASE1 0.35 1.57 0.13 0.43 -5.25 L3 205561_at potassium channel KCTD17 -0.32 -2.77 0.01 0.12 -3.02 tetramerisation domain containing 17 205611_at tumor necrosis factor (ligand) TNFSF12 -0.29 -2.18 0.04 0.24 -4.22 superfamily, member 12 205618_at proline rich Gla (G- PRRG1 -0.16 -1.26 0.22 0.54 -5.66 carboxyglutamic acid) 1 205632_s_at phosphatidylinositol-4- PIP5K1B -0.43 -1.96 0.06 0.30 -4.63 phosphate 5-kinase, type I, beta 205674_x_at FXYD domain containing ion FXYD2 -0.14 -1.10 0.28 0.61 -5.85 transport regulator 2 205792_at WNT1 inducible signaling WISP2 -0.66 -1.89 0.07 0.32 -4.74 pathway protein 2 205954_at retinoid X receptor, gamma RXRG -0.53 -3.47 0.00 0.04 -1.38 205973_at fasciculation and elongation FEZ1 -0.35 -2.38 0.02 0.19 -3.83 protein zeta 1 (zygin I) 206024_at 4-hydroxyphenylpyruvate HPD -0.57 -2.79 0.01 0.12 -2.98 dioxygenase 206132_at mutated in colorectal cancers MCC 0.48 2.01 0.05 0.29 -4.53 206201_s_at mesenchyme homeobox 2 MEOX2 -0.53 -1.65 0.11 0.40 -5.13 206283_s_at T-cell acute lymphocytic TAL1 -0.26 -1.93 0.06 0.31 -4.68 leukemia 1 206289_at homeobox A4 HOXA4 -0.29 -2.36 0.03 0.20 -3.88 206306_at ryanodine receptor 3 RYR3 -0.46 -1.85 0.07 0.33 -4.81 206331_at calcitonin receptor-like CΛLCRL -0.27 -1.80 0.08 0.35 -4.90 206382_s_at brain-derived neurotrophic BDNF -0.62 -2.89 0.01 0.10 -2.74 factor 206423_at angiopoietin-like 7 ANGPTL -0.47 -1.94 0.06 0.31 -4.66 7 206425_s_at transient receptor potential TRPC3 -0.57 -3.31 0.00 0.06 -1.77 cation channel, subfamily C, member 3 206510_at SIX homeobox 2 SIX2 -0.60 -1.61 0.12 0.42 -5.19 206525_at gamma-aminobutyric acid GABRR1 0.15 1.07 0.29 0.62 -5.88 (GABA) receptor, rho 1 206560_s_at melanoma inhibitory activity MIA -0.19 -1.72 0.10 0.38 -5.03 206580_s_at EGF-containing fibulin-like EFEMP2 -0.21 -1.29 0.21 0.53 -5.63 extracellular matrix protein 2 206874_s_at -- -- -0.44 -4.27 0.00 0.01 0.66 206898_at cadherin 19, type 2 CDH19 -0.48 -2.00 0.05 0.29 -4.56 207071_s_at aconitase 1, soluble ACO1 -0.27 -2.90 0.01 0.10 -2.72 207303_at phosphodiesterase 1C, PDE1C -0.24 -1.74 0.09 0.37 -5.00 calmodulin-dependent 70 kDa 207332_s_at transferrin receptor (p90, TFRC 0.18 1.32 0.20 0.52 -5.59 CD71) 207437_at neuro-oncological ventral NOVA1 -0.43 -1.58 0.13 0.43 -5.24 antigen 1 207554_x_at thromboxane A2 receptor TBXA2R -0.44 -2.86 0.01 0.11 -2.82 207834_at fibulin 1 FBLN1 -0.35 -1.98 0.06 0.30 -4.59 207876_s_at filamin C, gamma (actin FLNC -0.45 -2.98 0.01 0.09 -2.55 binding protein 280) 208131_s_at prostaglandin I2 (prostacyclin) PTGIS -0.28 -2.02 0.05 0.28 -4.51 synthase 208760_at Ubiquitin-conjugating enzyme UBE2I -0.24 -1.84 0.08 0.34 -4.83 E2I (UBC9 homolog, yeast) 208789_at polymerase I and transcript PTRF -0.42 -2.27 0.03 0.22 -4.06 release factor 208792_s_at clusterin CLU -0.15 -1.03 0.31 0.64 -5.92 208869_s_at GABA(A) receptor-associated GABARA -0.19 -2.73 0.01 0.13 -3.11 protein like 1 PL1 209015_s_at DnaJ (Hsp40) homolog, DNAJB6 -0.29 -2.61 0.01 0.15 -3.36 subfamily B, member 6 209086_x_at melanoma cell adhesion MCAM -0.61 -4.06 0.00 0.02 0.12 molecule 209087_x_at melanoma cell adhesion MCAM -0.40 -2.32 0.03 0.21 -3.96 molecule 209167_at glycoprotein M6B GPM6B -0.22 -2.14 0.04 0.25 -4.30 209168_at glycoprotein M6B GPM6B -0.18 -1.59 0.12 0.42 -5.22 209169_at glycoprotein M6B GPM6B -0.34 -3.16 0.00 0.07 -2.13
209170_s_at glycoprotein M6B GPM6B -0.23 -1.61 0.12 0.41 -5.19 209191_at tubulin, beta 6 TUBB6 -0.51 -2.92 0.01 0.10 -2.67 209242_at paternally expressed 3 PEG3 -0.25 -1.64 0.11 0.41 -5.15 209263_x_at tetraspanin 4 TSPAN4 -0.17 -1.42 0.17 0.48 -5.46 209288_s_at CDC42 effector protein (Rho CDC42EP -0.21 -1.86 0.07 0.33 -4.79 GTPase binding) 3 3 209293_x_at inhibitor of DNA binding 4, ID4 0.18 1.60 0.12 0.42 -5.21 dominant negative helix-loop- helix protein 209298_s_at intersectin 1 (SH3 domain ITSN1 -0.21 -1.66 0.11 0.40 -5.12 protein) 209356_x_at EGF-containing fibulin-like EFEMP2 -0.23 -1.49 0.15 0.46 -5.36 extracellular matrix protein 2 209362_at mediator complex subunit 21 MED21 -0.26 -2.58 0.02 0.15 -3.43 209454_s_at TEA domain family member 3 TEAD3 -0.23 -1.71 0.10 0.38 -5.04 209488_s_at RNA binding protein with RBPMS -0.33 -1.83 0.08 0.34 -4.84 multiple splicing 209524_at hepatoma-derived growth HDGFRP -0.14 -2.18 0.04 0.24 -4.22 factor, related protein 3 3 209543_s_at CD34 molecule CD34 -0.15 -1.58 0.12 0.42 -5.23 209612_s_at alcohol dehydrogenase 1B ADH1B -0.41 -1.20 0.24 0.57 -5.74 (class I), beta polypeptide 209613_s_at alcohol dehydrogenase 1B ADH1B -0.63 -1.96 0.06 0.30 -4.63 (class I), beta polypeptide 209614_at alcohol dehydrogenase 1B ADH1B -0.24 -1.89 0.07 0.32 -4.75 (class I), beta polypeptide 209651_at transforming growth factor TGFB1I1 -0.42 -2.62 0.01 0.14 -3.35 beta 1 induced transcript 1 209685_s_at protein kinase C, beta 1 PRKCB1 -0.26 -1.29 0.21 0.53 -5.63 209686_at S100 calcium binding protein S100B -0.94 -3.82 0.00 0.03 -0.50 B 209758_s_at microfibrillar associated MFAP5 -1.48 -7.89 0.00 0.00 10.08 protein 5 209764_at mannosyl (beta-1,4 MGAT3 -0.17 -1.65 0.11 0.40 -5.14 glycoprotein beta-1,4-N- acetylglucosaminyltransferase 209765_at ADAM metallopeptidase ADAM19 -0.36 -1.78 0.09 0.36 -4.93 domain 19 (meltrin beta) 209843_s_at SRY (sex determining region SOX10 -0.61 -5.58 0.00 0.00 4.16 Y)-box 10 209859_at tripartite motif-containing 9 TRIM9 -0.19 -1.09 0.28 0.61 -5.85 209915_s_at neurexin 1 NRXN1 -0.80 -4.05 0.00 0.02 0.08 209981_at cold shock domain containing CSDC2 -0.56 -2.43 0.02 0.18 -3.73 C2, RNA binding 210198_s_at proteolipid protein 1 PLP1 -1.18 -4.91 0.00 0.00 2.36 (Pelizaeus-Merzbacher disease, spastic paraplegia 2, uncomplicated) 210201_x_at bridging integrator 1 BIN1 -0.29 -2.54 0.02 0.16 -3.52 210270_at regulator of G-protein RGS6 -0.17 -1.55 0.13 0.43 -5.28 signaling 6 210277_at adaptor-related protein AP4S1 -0.22 -1.34 0.19 0.51 -5.57 complex 4, sigma 1 subunit 210280_at myelin protein zero (Charcot- MPZ -1.20 -5.02 0.00 0.00 2.64 Marie-Tooth neuropathy 1B) 210319_x_at msh homeobox 2 MSX2 0.45 2.31 0.03 0.21 -3.98 210432_s_at sodium channel, voltage-gated, SCN3A -0.46 -1.94 0.06 0.31 -4.66 type III, alpha subunit 210632_s_at sarcoglycan, alpha (50 kDa SGCA -0.58 -2.55 0.02 0.16 -3.49 dystrophin-associated glycoprotein) 210736_x_at dystrobrevin, alpha DTNA -0.22 -1.59 0.12 0.42 -5.23 210814_at transient receptor potential TRPC3 -0.75 -3.30 0.00 0.06 -1.80 cation channel, subfamily C, member 3 210852_s_at aminoadipate-semialdehyde AASS 0.24 2.06 0.05 0.27 -4.46 synthase 210869_s_at melanoma cell adhesion MCAM -0.71 -3.93 0.00 0.02 -0.21 molecule 210872_x_at growth arrest-specific 7 GAS7 -0.17 -1.32 0.20 0.52 -5.59 210941_at protocadherin 7 PCDH7 0.31 2.05 0.05 0.28 -4.46 211006_s_at potassium voltage-gated KCNB1 -0.31 -1.89 0.07 0.32 -4.75 channel, Shab-related subfamily, member 1 211275_s_at glycogenin 1 GYG1 -0.20 -1.66 0.11 0.40 -5.12 211276_at transcription elongation factor TCEAL2 -0.52 -2.89 0.01 0.10 -2.75 A (SII)-like 2 211340_s_at melanoma cell adhesion MCAM -0.46 -3.05 0.00 0.08 -2.38 molecule 211347_at CDC14 cell division cycle 14 CDC14B -0.21 -2.21 0.03 0.23 -4.16 homolog B (S. cerevisiae) 211348_s_at CDC14 cell division cycle 14 CDC14B -0.17 -1.72 0.10 0.38 -5.02 homolog B (S. cerevisiae) 211491_at adrenergic, alpha-1A-, ADRA1A -0.28 -1.80 0.08 0.35 -4.90 receptor 211562_s_at leiomodin 1 (smooth muscle) LMOD1 -0.39 -1.67 0.11 0.39 -5.10 211564_s_at PDZ and LIM domain 4 PDLIM4 -0.16 -1.05 0.30 0.63 -5.90 211673_s_at molybdenum cofactor MOCS1 -0.19 -1.23 0.23 0.55 -5.70 synthesis 1 211677_x_at cell adhesion molecule 3 CADM3 -0.21 -2.08 0.05 0.27 -4.41 211717_at ankyrin repeat domain 40 ANKRD40 -0.28 -2.76 0.01 0.12 -3.03 211954_s_at importin 5 IPO5 -0.15 -2.05 0.05 0.28 -4.46 211964_at collagen, type IV, alpha 2 COL4A2 -0.39 -2.27 0.03 0.22 -4.06 212086_x_at lamin A/C LMNA 0.25 1.74 0.09 0.37 -5.00 212097_at caveolin 1, caveolae protein, CAV1 -0.38 -4.57 0.00 0.01 1.46 22 kDa 212119_at ras homolog gene family, RHOQ -0.18 -2.08 0.05 0.27 -4.42 member Q 212120_at ras homolog gene family, RHOQ -0.31 -2.60 0.01 0.15 -3.39 member Q 212274_at lipin 1 LPIN1 -0.48 -3.92 0.00 0.02 -0.25 212358_at CAP-GLY domain containing CLIP3 -0.47 -2.34 0.03 0.20 -3.92 linker protein 3 212385_at transcription factor 4 TCF4 0.30 2.07 0.05 0.27 -4.43 212457_at transcription factor binding to TFE3 -0.25 -2.38 0.02 0.19 -3.84 IGHM enhancer 3 212509_s_at matrix-remodelling associated MXRA7 -0.27 -2.66 0.01 0.14 -3.26 7 212526_at spastic paraplegia 20 (Troyer SPG20 -0.17 -1.91 0.07 0.32 -4.71 syndrome) 212565_at serine/threonine kinase 38 like STK38L -0.58 -3.83 0.00 0.03 -0.47 212589_at related RAS viral (r-ras) RRAS2 -0.29 -2.84 0.01 0.11 -2.86 oncogene homolog 2 212610_at protein tyrosine phosphatase, PTPN11 -0.23 -2.24 0.03 0.22 -4.12 non-receptor type 11 (Noonan syndrome 1) 212647_at related RAS viral (r-ras) RRAS -0.39 -1.71 0.10 0.38 -5.05 oncogene homolog 212707_s_at RAS p21 protein activator 4 /// FLJ21767 -0.20 -1.40 0.17 0.49 -5.49 hypothetical protein FLJ21767 /// /// similar to HSPC047 protein LOC1001 /// similar to RAS p21 protein 32214 /// activator 4 LOC1001 33005 /// RASA4 212747_at ankyrin repeat and sterile ANKS1A -0.17 -1.41 0.17 0.49 -5.48 alpha motif domain containing 1A 212764_at zinc finger E-box binding ZEB1 -0.24 -1.79 0.08 0.35 -4.92 homeobox 1 212793_at dishevelled associated DAAM2 -0.56 -3.95 0.00 0.02 -0.17 activator of morphogenesis 2 212848_s_at chromosome 9 open reading C9orf3 -0.27 -2.22 0.03 0.23 -4.16 frame 3 212886_at coiled-coil domain containing CCDC69 -0.59 -3.96 0.00 0.02 -0.13 69 212887_at Sec23 homolog A (S. SEC23A -0.20 -1.86 0.07 0.33 -4.79 cerevisiae) 212992_at AHNAK nucleoprotein 2 AHNAK2 -0.60 -2.71 0.01 0.13 -3.14 213010_at protein kinase C, delta binding PRKCDB -0.47 -1.99 0.06 0.29 -4.57 protein P 213107_at TRAF2 and NCK interacting TNIK 0.40 2.03 0.05 0.28 -4.49 kinase 213181_s_at molybdenum cofactor MOCS1 -0.21 -1.57 0.13 0.43 -5.25 synthesis 1 213203_at small nuclear RNA activating SNAPC5 -0.15 -1.56 0.13 0.43 -5.27 complex, polypeptide 5, 19 kDa 213231_at dystrophia myotonica, WD DMWD -0.30 -2.40 0.02 0.19 -3.79 repeat containing 213274_s_at cathepsin B CTSB -0.30 -1.53 0.14 0.44 -5.32 213428_s_at collagen, type VI, alpha 1 COL6A1 -0.21 -1.37 0.18 0.50 -5.52 213480_at vesicle-associated membrane VAMP4 -0.24 -2.61 0.01 0.15 -3.36 protein 4 213545_x_at sorting nexin 3 SNX3 -0.11 -1.41 0.17 0.49 -5.48 213547_at cullin-associated and CAND2 -0.31 -2.41 0.02 0.18 -3.77 neddylation-dissociated 2 (putative) 213630_at NΛC alpha domain containing NΛCΛD -0.18 -1.42 0.16 0.48 -5.46 213675_at CDNA FLJ25106 fis, clone -- -0.44 -3.25 0.00 0.06 -1.92 CBR01467 213764_s_at microfibrillar associated MFAP5 -1.73 -7.18 0.00 0.00 8.33 protein 5 213765_at microfibrillar associated MFAP5 -1.36 -6.40 0.00 0.00 6.31 protein 5 213808_at Clone 23688 mRNA sequence -- -0.43 -2.16 0.04 0.25 -4.26 213847_at peripherin PRPH -0.93 -4.12 0.00 0.02 0.27 213924_at Metallophosphoesterase 1 MPPE1 -0.26 -1.72 0.10 0.38 -5.02 214023_x_at tubulin, beta 2B TUBB2B -0.75 -4.21 0.00 0.01 0.51 214027_x_at desmin /// family with DES /// -0.42 -1.97 0.06 0.30 -4.61 sequence similarity 48, FAM48A member A 214039_s_at lysosomal associated protein LAPTM4 -0.17 -1.20 0.24 0.57 -5.73 transmembrane 4 beta B 214078_at Primary neuroblastoma cDNA, -- -0.35 -1.44 0.16 0.47 -5.43 clone: Nbla04246, full insert sequence 214121_x_at PDZ and LIM domain 7 PDLIM7 -0.32 -1.68 0.10 0.39 -5.08 (enigma) 214122_at PDZ and LIM domain 7 PDLIM7 -0.30 -2.74 0.01 0.13 -3.09 (enigma) 214159_at Phospholipase C, epsilon 1 PLCE1 -0.27 -1.79 0.08 0.35 -4.91 214174_s_at PDZ and LIM domain 4 PDLIM4 -0.23 -1.43 0.16 0.48 -5.45 214175_x_at PDZ and LIM domain 4 PDLIM4 -0.27 -1.54 0.14 0.44 -5.30 214212_x_at fermitin family homolog 2 FERMT2 -0.42 -3.00 0.01 0.09 -2.50 (Drosophila) 214247_s_at dickkopf homolog 3 (Xenopus DKK3 -0.17 -1.51 0.14 0.45 -5.34 laevis) 214297_at chondroitin sulfate CSPG4 -0.45 -1.78 0.09 0.36 -4.94 proteoglycan 4 214306_at optic atrophy 1 (autosomal OPA1 -0.27 -2.67 0.01 0.14 -3.23 dominant) 214368_at RAS guanyl releasing protein RASGRP -0.23 -2.08 0.05 0.27 -4.40 2 (calcium and DAG- 2 regulated) 214434_at heat shock 70 kDa protein 12A HSPA12A -0.57 -3.40 0.00 0.05 -1.54 214439_x_at bridging integrator 1 BIN1 -0.29 -2.56 0.02 0.16 -3.47 214449_s_at ras homolog gene family, RHOQ -0.18 -1.81 0.08 0.34 -4.88 member Q 214600_at TEA domain family member 1 TEAD1 -0.28 -1.61 0.12 0.42 -5.19 (SV40 transcriptional enhancer factor) 214606_at tetraspanin 2 TSPAN2 -0.54 -4.01 0.00 0.02 -0.02 214643_x_at bridging integrator 1 BIN1 -0.23 -2.16 0.04 0.25 -4.27 214696_at chromosome 17 open reading C17orf91 0.50 1.92 0.07 0.31 -4.70 frame 91 214767_s_at heat shock protein, alpha- HSPB6 -0.88 -4.27 0.00 0.01 0.66 crystallin-related, B6 214954_at sushi domain containing 5 SUSD5 -0.98 -3.42 0.00 0.05 -1.51 214987_at CDNΛ clone -- -0.29 -1.94 0.06 0.31 -4.66 IMAGE:4801326 215000_s_at fasciculation and elongation FEZ2 -0.14 -1.99 0.06 0.29 -4.57 protein zeta 2 (zygin II) 215104_at nuclear receptor interacting NRIP2 -0.94 -4.62 0.00 0.01 1.59 protein 2 215306_at MRNA; cDNA -- -0.48 -2.66 0.01 0.14 -3.26 DKFZp586N2020 (from clone DKFZp586N2020) 215534_at MRNA; cDNA -- -0.46 -2.46 0.02 0.17 -3.68 DKFZp586C1923 (from clone DKFZp586C1923) 216096_s_at neurexin 1 NRXN1 -0.37 -1.68 0.10 0.39 -5.08 216500_at HL14 gene encoding beta- -- -0.29 -2.31 0.03 0.21 -3.98 galactoside-binding lectin, 3' end, clone 2 216894_x_at cyclin-dependent kinase CDKN1C -0.27 -2.45 0.02 0.18 -3.69 inhibitor 1C (p57, Kip2) 217066_s_at dystrophia myotonica-protein DMPK -0.29 -2.11 0.04 0.26 -4.37 kinase 217589_at RAB40A, member RAS RAB40A 0.37 1.49 0.15 0.46 -5.36 oncogene family 217764_s_at RAB31, member RAS RAB31 -0.21 -1.38 0.18 0.50 -5.51 oncogene family 217820_s_at enabled homolog (Drosophila) ENAH -0.19 -2.12 0.04 0.26 -4.33 217880_at cell division cycle 27 homolog CDC27 -0.16 -1.54 0.13 0.44 -5.30
(S. cerevisiae) 218087_s_at sorbin and SH3 domain SORBS1 -0.18 -2.00 0.05 0.29 -4.56 containing 1 218094_s_at dysbindin (dystrobrevin DBNDD2 -0.41 -3.66 0.00 0.03 -0.90 binding protein 1) domain /// SYS1- containing 2 /// SYS1- DBNDD2 DBNDD2 218183_at chromosome 16 open reading C16orf5 -0.16 -1.63 0.11 0.41 -5.16 frame 5 218204_s_at FYVE and coiled-coil domain FYCO1 -0.16 -1.57 0.13 0.43 -5.25 containing 1 218208_at PQ loop repeat containing 1 /// LOC1001 -0.23 -1.79 0.08 0.35 -4.91 hypothetical protein 31178 /// LOC100131178 PQLC1 218266_s_at frequenin homolog FREQ -0.46 -2.32 0.03 0.21 -3.95 (Drosophila) 218345_at transmembrane protein 176A TMEM17 -0.27 -1.05 0.30 0.63 -5.90 6A 218435_at DnaJ (Hsp40) homolog, DNAJC15 -0.49 -2.55 0.02 0.16 -3.48 subfamily C, member 15 218545_at coiled-coil domain containing CCDC91 -0.31 -2.97 0.01 0.09 -2.57 91 218597_s_at CDGSH iron sulfur domain 1 CISD1 -0.18 -2.24 0.03 0.22 -4.12 218648_at CREB regulated transcription CRTC3 -0.33 -3.39 0.00 0.05 -1.58 coactivator 3 218651_s_at La ribonucleoprotein domain LΛRP6 -0.34 -4.00 0.00 0.02 -0.03 family, member 6 218660_at dysferlin, limb girdle muscular DYSF -0.55 -3.49 0.00 0.04 -1.33 dystrophy 2B (autosomal recessive) 218668_s_at RAP2C, member of RAS RAP2C -0.22 -1.51 0.14 0.45 -5.34 oncogene family 218683_at polypyrimidine tract binding PTBP2 -0.18 -1.63 0.11 0.41 -5.17 protein 2 218691_s_at PDZ and LIM domain 4 PDLIM4 -0.42 -2.50 0.02 0.16 -3.58 218711_s_at serum deprivation response SDPR 0.41 2.63 0.01 0.14 -3.32 (phosphatidylserine binding protein) 218818_at four and a half LIM domains 3 FHL3 -0.36 -2.29 0.03 0.21 -4.02 218864_at tensin 1 TNS1 -0.30 -1.72 0.10 0.38 -5.03 218877_s_at tRNA methyltransferase 11 TRMT11 0.44 2.93 0.01 0.10 -2.66 homolog (S. cerevisiae) 218975_at collagen, type V, alpha 3 COL5A3 -0.32 -1.79 0.08 0.35 -4.91 219058_x_at tubulointerstitial nephritis TINAGL1 -0.14 -1.50 0.14 0.45 -5.35 antigen-like 1 219073_s_at oxysterol binding protein-like OSBPL10 -0.37 -2.24 0.03 0.22 -4.11 10 219091_s_at multimerin 2 MMRN2 -0.44 -3.79 0.00 0.03 -0.57 219102_at reticulocalbin 3, EF-hand RCN3 -0.14 -1.57 0.13 0.43 -5.25 calcium binding domain 219314_s_at zinc finger protein 219 ZNF219 -0.51 -4.66 0.00 0.01 1.70 219336_s_at activating signal cointegrator 1 ASCC1 -0.16 -1.59 0.12 0.42 -5.23 complex subunit 1 219416_at scavenger receptor class A, SCARA3 -0.57 -2.45 0.02 0.18 -3.71 member 3 219451_at methionine sulfoxide reductase MSRB2 -0.42 -2.07 0.05 0.27 -4.43 B2 219488_at alpha 1,4-galactosyltransferase A4GALT -0.14 -1.56 0.13 0.43 -5.26 (globotriaosylceramide synthase) 219534_x_at cyclin-dependent kinase CDKN1C -0.23 -1.86 0.07 0.33 -4.80 inhibitor 1C (p57, Kip2) 219563_at chromosome 14 open reading C14orf139 -0.38 -2.33 0.03 0.20 -3.95 frame 139 219656_at protocadherin 12 PCDH12 -0.26 -1.82 0.08 0.34 -4.86 219689_at sema domain, immunoglobulin SEMA3G -0.22 -1.23 0.23 0.56 -5.71 domain (Ig), short basic domain, secreted, (semaphorin) 3G 219746_at D4, zinc and double PHD DPF3 -0.18 -1.66 0.11 0.40 -5.12 fingers, family 3 219902_at betaine-homocysteine BHMT2 -0.33 -2.26 0.03 0.22 -4.07 methyltransferase 2 219909_at matrix metallopeptidase 28 MMP28 -0.54 -3.44 0.00 0.05 -1.45 220050_at chromosome 9 open reading C9orf9 -0.32 -2.10 0.04 0.26 -4.37 frame 9 220091_at solute carrier family 2 SLC2Λ6 -0.18 -1.37 0.18 0.50 -5.53 (facilitated glucose transporter), member 6 220103_s_at mitochondrial ribosomal MRPS18C 0.21 1.82 0.08 0.34 -4.87 protein S18C 220148_at aldehyde dehydrogenase 8 ALDH8A -0.45 -1.58 0.12 0.43 -5.23 family, member A1 1 220244_at loss of heterozygosity, 3, LOH3CR 0.47 1.93 0.06 0.31 -4.67 chromosomal region 2, gene A 2A 220276_at RERG/RAS-like RERGL -0.54 -1.75 0.09 0.37 -4.98 220722_s_at solute carrier family 5 (choline SLC5A7 -0.41 -2.27 0.03 0.22 -4.05 transporter), member 7 220765_s_at LIM and senescent cell LIMS2 -0.41 -2.81 0.01 0.11 -2.93 antigen-like domains 2 220879_at -- -- 0.20 2.17 0.04 0.24 -4.25 220975_s_at C1q and tumor necrosis factor C1QTNF1 -0.25 -1.89 0.07 0.32 -4.75 related protein 1 221014_s_at RAB33B, member RAS RAB33B -0.38 -2.47 0.02 0.17 -3.66 oncogene family 221030_s_at Rho GTPase activating protein ARHGAP -0.27 -1.66 0.11 0.40 -5.11 24 24 221127_s_at regulated in glioma RIG -0.19 -1.74 0.09 0.37 -4.99 221193_s_at zinc finger, CCHC domain ZCCHC10 -0.20 -1.43 0.16 0.48 -5.45 containing 10 221204_s_at cartilage acidic protein 1 CRTAC1 -0.56 -4.18 0.00 0.01 0.44 221246_x_at tensin 1 TNS1 -0.27 -3.41 0.00 0.05 -1.53 221276_s_at syncoilin, intermediate SYNC1 -0.29 -1.63 0.11 0.41 -5.17 filament 1 221447_s_at glycosyltransferase 8 domain GLT8D2 0.57 2.29 0.03 0.21 -4.02 containing 2 221480_at heterogeneous nuclear HNRNPD -0.36 -2.27 0.03 0.22 -4.06 ribonucleoprotein D (AU-rich element RNA binding protein 1, 37 kDa) 221502_at karyopherin alpha 3 (importin KPNA3 -0.20 -2.16 0.04 0.24 -4.26 alpha 4) 221527_s_at par-3 partitioning defective 3 PARD3 -0.16 -1.59 0.12 0.42 -5.23 homolog (C. elegans) 221634_at ribosomal protein L23a RPL23AP -0.21 -2.04 0.05 0.28 -4.48 pseudogene 7 7 221667_s_at heat shock 22 kDa protein 8 HSPB8 -0.40 -2.29 0.03 0.21 -4.02 221748_s_at tensin 1 TNS1 -0.14 -1.62 0.12 0.41 -5.18 221886_at DENN/MADD domain DENND2 -0.33 -1.83 0.08 0.34 -4.84 containing 2A A 222066_at Erythrocyte membrane protein EPB41L1 -0.20 -1.76 0.09 0.36 -4.97 band 4.1-like 1 222101_s_at dachsous 1 (Drosophila) DCHS1 -0.26 -1.56 0.13 0.43 -5.27 222221_x_at EH-domain containing 1 EHD1 -0.20 -2.43 0.02 0.18 -3.74 222257_s_at angiotensin I converting ACE2 -0.38 -1.96 0.06 0.30 -4.62 enzyme (peptidyl-dipeptidase A) 2 32094_at carbohydrate (chondroitin 6) CHST3 -0.19 -1.09 0.29 0.62 -5.86 sulfotransferase 3 32625_at natriuretic peptide receptor NPR1 -0.22 -2.46 0.02 0.17 -3.68 A/guanylate cyclase A (atrionatriuretic peptide receptor A) 336_at thromboxane A2 receptor TBXA2R -0.65 -3.37 0.00 0.05 -1.62 33760_at peroxisomal biogenesis factor PEX14 -0.24 -1.74 0.09 0.37 -5.00 14 35776_at intersectin 1 (SH3 domain ITSN1 -0.20 -1.62 0.12 0.41 -5.18 protein) 35846_at thyroid hormone receptor, THRA -0.46 -3.87 0.00 0.02 -0.38 alpha (erythroblastic leukemia viral (v-erb-a) oncogene homolog, avian) 37996_s_at dystrophia myotonica-protein DMPK -0.39 -1.83 0.08 0.34 -4.84 kinase 38290_at regulator of G-protein RGS14 -0.17 -1.18 0.25 0.57 -5.76 signaling 14 44702_at synapse defective 1, Rho SYDE1 -0.38 -2.45 0.02 0.18 -3.69 GTPase, homolog 1 (C. elegans) 45714_at host cell factor C1 regulator 1 HCFC1R1 -0.24 -1.29 0.21 0.53 -5.63 (XPO1 dependent) 52255_s_at collagen, type V, alpha 3 COL5A3 -0.42 -2.05 0.05 0.28 -4.47
TABLE-US-00004 TABLE 4 146 diagnostic probe sets with incidence number greater than 50 for 105- fold gene selection procedure. The 15 shaded probe sets at the bottom are deselected by PAM when the 146 probe sets were used as input for training. ##STR00001## ##STR00002## ##STR00003## ##STR00004## ##STR00005## ##STR00006## ##STR00007## ##STR00008## ##STR00009## ##STR00010## ##STR00011## ##STR00012## ##STR00013## 1logFC is the logarithm Fold Change as tumorous stroma being compared to normal stroma. +/- represents up-/down- regulated expression level in tumorous stroma.
TABLE-US-00005 TABLE 5 Comparison of 131-element classifier to classifiers generated from `random` genes. `i` and `ii` denote the 131-probeset classifier and random-gene classifiers, respectively. Accuracy Sensitivity Specificity % % % Dataset Case Num. i ii i ii i ii 1 Training set 1 26 96.4 67.1 92.3 32.5 100 97.1 (13 + 13) Test set Tumor 2 Tumor-bearing 1 55 96.4 8.7 96.4 8.7 NA NA (68 - 13) 3 Tumor-bearing 2 65 100 12.9 100 12.9 NA NA 4 Tumor-bearing 3 79 100 13.4 100 13.4 NA NA 5 Tumor-bearing 4 44 100 15.9 100 15.9 NA NA Normal 6 Biopsies (1) 1 7 100 98.8 NA NA 100 98.8 7 Biopsies (2) 1 5 60.0 100 NA NA 60.0 100 8 Rapid autopsies 1 13 92.3 67.5 NA NA 92.3 67.5 Manuel Midrodissected/LCM 9 Tumor-adjacent 2 71 97.1 13.6 97.1 13.6 NA NA Stroma 10 Tumor adjacent 4 13 100 15.9 100 15.9 NA NA Stroma 11 Tumor-adjacent 1 12 75.0 5.8 75.0 5.8 NA NA Stroma 12 Tumor-bearing 5 12 100 19.2 100 19.2 NA NA 13 Pooled normal 5 4 100 79.4 NA NA 100 79.4 stroma
Example 2
Development of Predictive Biomarkers of Prostate Cancer
[0252] Three methods utilized in the development of predictive gene signature of prostate cancer are described in this example. First, an analytical method based on a linear combination model for the determination of the percent cell composition of the tumor epithelial cells and the stoma cells from array data of mixed cell type prostate tissue is described. The method utilizes fixed expression coefficients of a small (<100) genes that with expression characteristics that are distinct for tumor epithelial and stroma cells.
[0253] Second, a new method for the determination of tumor cell specific biomarkers for the prediction of relapse of prostate cancer using an extended linear combination model is described and validated. A gene profile based on the expression of RNA of prostate cancer epithelial cells that predicts the differential gene expression of relapse (aggressive) vs. non relapse (indolent) prostate cancer is derived. These genes are validated by their identification in independent sets of prostate cancer patients (technical retrospective validation) is described. This method may be used to identify aggressive prostate cancer from data obtained at the time of diagnosis. The method and profiles are novel.
[0254] Third, an analogous new method for the determination of stroma cell specific biomarkers for the prediction of relapse of prostate cancer is described. Thus the predictions are based on non tumor cell types. A gene profile based on the expression of RNA of stroma cells of tumor-bearing prostate tissue that predicts the differential gene expression of relapse (aggressive) vs. non relapse (indolent) prostate cancer that is validated by prediction of differences of an independent set of prostate cancer patients (technical retrospective validation) is described. These methods and profiles may be used to identify aggressive prostate cancer from data obtained at the time of diagnosis. The results further indicate that the microenvironment of tumor foci of prostate cancer exhibit altered gene expression at the time of diagnosis which is distinct in non relapse and relapsed prostate cancer.
[0255] Datasets:
[0256] The goals of this study were to continue development of predicative biomarkers of prostate cancer. In particular the goal of this study is to use independent datasets to validate genes deduced as predictive based on studies of dataset 1 (infra vide). Here "dataset" refers to the array-based RNA expression data of all cases of a given set together with the clinical data defining whether a given case relapsed (recurred cancer) or remained disease free, a censored quantity. Only the categorical value, relapsed or non relapsed, is used in the analyses described here.
[0257] The three datasets used for this study included 1) 148 Affymetrix U133A array data acquired from 91 patients (publicly available in the GEO database as accession no. GSE8218) which is the principal dataset utilized in previous studies; 2) Illumina (of Illumina Inc., San Diego) beads arrays data from 103 patients as analyzed on 115 arrays, a published dataset (Bibilova et al. (2007) Genomics 89:666-672); and 3) Affymetrix U133A array data from 79 patients, also a published dataset (Stephenson et al., supra). These are referred to in this example as datasets 1, 2, and 3 respectively.
[0258] For the purposes herein, relapsed prostate cancer is taken as a surrogate of aggressive disease, while non-relapse is taken as indolent disease with a variable degree of indolence that is directly proportional to the disease-free survival time. Dataset 1 contains 40 non-relapse patients and 47 relapse patients; dataset 2 contains 75 non-relapse patients and 22 relapse patients, and dataset 3 contains 42 non-relapse patients and 37 relapse patients. The first two datasets samples have various amount of different tissue and cell types, including tumor cells, stroma cells (a collective term for fibroblasts, myofibroblasts, smooth muscle, and small amounts of nerve and vascular elements), BPH (epithelial cells of benign prostate hypertrophy) and dilated cystic glands (AKA "atrophic" cystic glands), as estimated by four pathologists (Stuart et al., supra) for dataset 1 and one pathologist for dataset 2. Dataset 3 samples were tumor-enriched samples. In this study, published datasets 2 and 3 were used for the purpose of validation only. A major goal of this study was to use "external" published datasets to validate the properties deduced for genes based on analysis of the dataset 1.
[0259] Determination of Cell Specific Gene Expression in Prostate Cancer:
[0260] Using linear models applied to microarray data from prostate tissues with various amounts of different cell types as estimated by a team of four pathologists, identified genes were identified as being specifically expressed in different cell types (tumor, stroma, BPH and dilated cystic glands) of prostate tissue following published methods (Stuart et al., supra). Thus, the following linear models were applied for generating tissue specific genes.
[0261] Model 1
[0262] For any gene i, the hybridization intensity, G, from an Affymetrix GeneChip is due to the sum of the cell contributions to the total mRNA:
Gi=(βtumorPtumor+βstromaPstroma+.beta- .BPHPBPH+βBPH dilated cysticPgland dilated cystic gland)i
[0263] Where a "cell contribution" is the amount of the cellular component, Pcell type, multiplied times the characteristic expression level of gene i by that cell type, β. Only the β values are unknown and are determined by simple or multiple linear regressions. Note that in general a minimum of four estimates of Gi (i.e. four cases) are required to estimate four unknown β whereas in practice many dozens of cases are available so that the unknown coefficients are "over determined".
[0264] Model 2
[0265] Since the epithelia of dilated cystic glands were not a major component of prostate tissue, it may be removed from the linear model to simplify the model.
Gi=(βtumorPtumor+βstromaPstroma+.beta- .BPHPBPH)i
[0266] Models 3˜6
[0267] To further simplify the model, cell composition also can be considered as two different cell types, usually one specific cell type and all the other cell types were grouped together.
Gi=(βtumorPtumor+βnon-tumorPnon-tumor- )i
Gi=(βstromaPstroma+βnon-stromaPnon-st- roma)i
Gi=(βBPHPBPH+βnon-BPHPnon-BPH)i
Gi=(βdilated cystic glandPdilated cystic gland+βnon-dilated cystic glandPnon-dilated cystic gland)i
[0268] The gene lists (with p<0.001) developed from models 3 and 4 using dataset 1 are listed in Table 6.
[0269] A New Method for Determination of Cell Type Composition Prediction Using Gene Expression Profiles:
[0270] Using linear models based on a small list of cell specific genes, i.e., genes from Table 6, the approximate percentage of cell types in samples hybridized to the array may be estimated using only the microarray data utilizing model 3. Potentially all of the genes in Table 6 can be used for cell percent composition prediction. For each individual gene, a new sample's gene expression value from microarray data can be fitted to models 3˜6, for a prediction of corresponding cell type percentage. Each gene employed in model 3 provides an estimate of percent tumor cell composition. The median of the predictions based on multiple genes was used to generate a more reliable result estimate of tumor cell content. These prediction genes can be selected/ranked by either their correlation coefficient (for correlation between gene expression level and cell type percentage) or by combination of genes with the best prediction power. In the present case, only a very limited number of genes (8-52 genes) were used for such a prediction. Even fewer genes might be sufficient.
[0271] To validate the method of tumor or stroma percent composition determination, the known percent composition figures of dataset 1 were used to predict the tumor cell and stroma cell compositions for dataset 2 with known cell composition. For example, the number of genes used for cell type (tumor epithelial cells or stroma cells) prediction between dataset 1 and dataset 2 ranges from 8 to 52 genes, which are listed in Table 7A. The Pearson correlation coefficient between predicted cell type percentage (tumor epithelial cells or stroma cells) and pathologist estimated percentage ranged from 0.7 to 0.87. Tissue (tumor or stroma) specific genes identified from dataset 2 and used for prediction are listed in Table 7B.
[0272] Since dataset 1 and dataset 2 data were based on different array platforms, the cross-platform normalization were applied using median rank scores (MRS) method (Warnat et al. (2005) BMC Bioinformatics 6:265). FIGS. 3A and 3B illustrate the use of the parameters of dataset 1 to predict the cell composition of dataset 2. The Pearson correlation coefficients for the correlation of the observed and calculated cell type compositions is 0.74 and 0.70 respectively. The converse calculations of utilizing the parameters of dataset 2 to calculate the tumor and stroma cell percent compositions of dataset 1 are shown in FIGS. 3C and 3D, respectively. The Pearson correlation coefficients were 0.87 and 0.78 respectively. The range of Pearson coefficients among four pathologists determined independently for composition estimates of the same samples in dataset 1 is 0.85-0.95 (Stuart et al., supra). Thus, the in silico estimates have a correlation that is almost completely subsumed in variation among pathologists, indicating that the in silico estimates are at least similar in performance to a pathologist and leaving open the possibility that the in silico estimates are more accurate than the pathologists.
[0273] A New Method for Determination of Cell Specific Relapse Related Genes of Prostate Cancer:
[0274] Using dataset 1, the genes correlating with patient relapse status were estimated using the following linear models.
[0275] Model 7
Gi=β'tumor,iPtumor+β'stroma,iPstroma+- β'BPH,iPBPH+β'dilated cystic gland,iPdilated cystic gland+rs(γtumor,iPtumor+γstroma,iPstroma+γBPH,iPBPH+γdilated cystic gland,iPdilated cystic gland)
[0276] For any gene i, Gi (the array reported gene intensity)=the sum of 4 cell type contributions for non relapsed cases (βcell type,i×Percentcell type)+Sum of 4 cell type contributions for relapsed cases (γcell type,i×Percentcell type)+error term. RS may be either 0 or 1 where 0 is utilized for all non relapse cases and RS=0 is utilized for relapse cases. Thus when RS=0 the expression coefficients β' for non relapse cases are determined while when RS=1 the coefficients (β'+γ) are determined. Coefficients are numerically determined by multiple linear regression using least squares determination of best fit coefficients±error. The differences in expression between non relapse (β') and relapse (β'+γ) is just γ and the significance γ may be estimated by T-test and other standard statistical methods.
[0277] Model 8˜11
[0278] The following models also were implemented to simplify the models:
Gi=β'tumor,iPtumor+β'relapse status,iRS+β'interaction,iPtumor:RS
Gi=β'stroma,iPstroma+β'relapse status,iRS+β'interaction,iPstroma:RS
Gi=β'.sub.Btumor,iPtumor+β'relapse status,iRS+β'intreaction,iPtumor:RS
Gi=β'dilated cystic gland,iPtumor+β'relapse status,iRS+β'interaction,iPdilated cystic gland:RS
[0279] Only the samples with >0% tumor epithelial cells were used for the above analysis to remove those far-stroma samples (i.e., non-tumor cell bearing samples). This exclusion of "far-stroma" accommodates the possibility that stroma may contain expression changes characteristic of prostates with cancer, but that these changes might be confined to stroma regions near tumor cells. Because multiple samples are used from some subjects, the estimating equations approach implemented in the "gee" library for R (i.e., the open source R bioinformatics analysis package) was used (Zeger and Liang (1986) Biometrics 42:121-130). Cell type (tumor epithelial cells or stroma cells) specific genes showed significant (p<0.005) expression level changes between relapse and non-relapse samples using model 8-9, are listed in Tables 8A and 8B.
[0280] The gene list was then validated using independent dataset 3 to test whether any of the same genes were independently identified. Since dataset 3 has unknown tumor/stroma content, the method was first used for predicting tumor/stroma percentage (FIGS. 4A-4C) before testing the prediction potential of the genes of Tables 8A and 8B. Cell type (tumor epithelial cells or stroma cells) specific relapse related genes were generated using p<0.01 as a cut-off. There were 15 genes that were significantly associated with relapse in tumor cells in both datasets. Twelve genes agreed in identity and sign (direction in relapse). The null hypothesis that 12 genes agreeing and identity and sign was not different from random was tested, yielding a p<0.007. Thus these genes appear validated by the criterion of coincidence. The process is summarized in Table 9. These significant genes presented in both dataset 1 and 3 together with three additional genes that did not agree in sign between the two datasets are plotted in FIG. 5A which compares the expression coefficients for these genes in both datasets. Almost all of these genes showed consistency between two datasets, with a Pearson Correlation Coefficient of 0.83. Thus the coincident genes also agree in amplitude. These genes are listed in Table 10.
[0281] An analogous analysis was carried for the determination of stroma cell specific genes (FIG. 5B, Table 9). Sixteen genes exhibited correlation with relapse in both datasets, and all of these genes had the same direction in both datasets (p<0.001). The 16 genes exhibit a Pearson Correlation Coefficient of 0.93. This result indicates that a stroma cell based classifier may have predictive information about relapse. These genes determined from the analysis of datasets 1 and 3 are listed in Table 11.
[0282] An analogous analysis was carried out using datasets 1 and 2 with a significance cut off of 0.2 for dataset 2 (Table 9). Thirteen coincident genes were identified at this threshold even though the array of dataset three is relatively small (˜500 genes). Ten of these 13 genes had the same direction in relapse in both datasets (p<0.011), as shown in FIG. 5c. Thus, these 10 genes are validated in an independent dataset by the criterion of coincidence in independent datasets. The common 10 genes which had the same direction are listed in Table 12. One gene, PPAP2B (Affymetrix ID: 212230_at) is down-regulated in relapse cases and is in common with those of datasets 1 and 2.
[0283] A similar analysis for stroma-specifically expressed genes revealed BTG2 as a stroma specific relapse gene (Affymetrix ID: 201235_s_at) as a common gene in dataset 1 and 2 that exhibited up-regulation in both datasets.
[0284] These results indicate that three sets of validated genes with significant differential expression may be extracted once tumor percentage is taken into account, which may be useful in the prediction of relapse by analysis of expression data obtained at the time of diagnosis.
TABLE-US-00006 TABLE 6 Tissue Specific Genes detected using dataset 1 (p < 0.005). Regular font: up-regulated genes; Italics: down-regulated genes. Tumor Specific Genes Stroma Specific Genes 36830_at 202555_s_at 209424_s_at 201496_x_at 203954_x_at 212730_at 209426_s_at 208792_s_at 212449_s_at 203903_s_at 209425_at 213068_at 212445_s_at 214505_s_at 219360_s_at 205242_at 209398_at 205935_at 203242_s_at 208791_at 204875_s_at 211276_at 221577_x_at 201058_s_at 205542_at 219167_at 216804_s_at 202222_s_at 209114_at 205564_at 204934_s_at 213746_s_at 218638_s_at 204135_at 209813_x_at 205382_s_at 209340_at 209283_at 211144_x_at 204083_s_at 217979_at 207876_s_at 204623_at 222043_at 219736_at 202409_at 215806_x_at 203413_at 214774_x_at 219478_at 203953_s_at 203186_s_at 218835_at 209291_at 221424_s_at 212865_s_at 219312_s_at 208131_s_at 216920_s_at 218087_s_at 204973_at 212843_at 205860_x_at 213071_at 221582_at 209210_s_at 203196_at 214027_x_at 206302_s_at 209292_at 205347_s_at 210299_s_at 203397_s_at 203851_at 217771_at 202992_at 203007_x_at 200953_s_at 215363_x_at 212233_at 214469_at 201431_s_at 211303_x_at 201539_s_at 220192_x_at 202565_s_at 202345_s_at 212992_at 205780_at 203065_s_at 217487_x_at 203296_s_at 204305_at 210002_at 203243_s_at 210298_x_at 209623_at 203324_s_at 206858_s_at 201495_x_at 201690_s_at 215813_s_at 214598_at 207977_s_at 214455_at 209616_s_at 203908_at 203766_s_at 204141_at 210139_s_at 209624_s_at 214752_x_at 221669_s_at 202269_x_at 212412_at 209763_at 209696_at 209156_s_at 213506_at 217897_at 216623_x_at 200906_s_at 218313_s_at 207390_s_at 203304_at 205549_at 201689_s_at 221667_s_at 214087_s_at 208937_s_at 203216_s_at 204273_at 205645_at 202270_at 201839_s_at 221747_at 202454_s_at 212724_at 212218_s_at 200859_x_at 213622_at 200762_at 206558_at 209170_s_at 202427_s_at 201667_at 201688_s_at 212097_at 214463_x_at 217728_at 205776_at 203951_at 219856_at 203323_at 220014_at 213371_at 200790_at 213428_s_at 208579_x_at 208790_s_at 205597_at 212067_s_at 201923_at 222162_s_at 210339_s_at 209351_at 206214_at 217757_at 210377_at 209687_at 203644_s_at 209651_at 217850_at 201842_s_at 204776_at 210869_s_at 200862_at 218730_s_at 46323_at 200621_at 203857_s_at 212977_at 219667_s_at 204939_s_at 204170_s_at 203706_s_at 212686_at 202202_s_at 201596_x_at 209496_at 200644_at 200907_s_at 219127_at 209948_at 216905_s_at 209209_s_at 201079_at 201147_s_at 202890_at 201615_x_at 212789_at 201540_at 204714_s_at 201105_at 222121_at 213994_s_at 200935_at 202274_at 209844_at 204931_at 205830_at 205128_x_at 203917_at 219685_at 218280_x_at 209355_s_at 204667_at 209487_at 217111_at 205547_s_at 218922_s_at 211966_at 201952_at 209427_at 211596_s_at 202748_at 222277_at 203423_at 220933_s_at 218418_s_at 212640_at 221748_s_at 208580_x_at 214247_s_at 203911_at 203729_at 218186_at 206332_s_at 210738_s_at 214091_s_at 217912_at 201641_at 206239_s_at 204894_s_at 214290_s_at 209488_s_at 208837_at 200931_s_at 212812_at 202283_at 202043_s_at 206116_s_at 211137_s_at 204345_at 221732_at 207957_s_at 202148_s_at 209167_at 201014_s_at 201957_at 204942_s_at 209540_at 219584_at 213139_at 209369_at 218718_at 215017_s_at 202007_at 215726_s_at 213093_at 210317_s_at 201150_s_at 214651_s_at 211964_at 203474_at 218980_at 204389_at 212226_s_at 213492_at 205132_at 219017_at 211896_s_at 203739_at 215016_x_at 213148_at 209074_s_at 210787_s_at 204069_at 219118_at 218611_at 210337_s_at 202920_at 215779_s_at 203881_s_at 211689_s_at 200986_at 87100_at 201616_s_at 212252_at 205475_at 213943_at 202995_s_at 201413_at 208966_x_at 220926_s_at 200897_s_at 202457_s_at 221935_s_at 212680_x_at 207480_s_at 220161_s_at 202566_s_at 214404_x_at 202196_s_at 215432_at 201348_at 209935_at 209288_s_at 217973_at 219295_s_at 201761_at 217767_at 202429_s_at 204288_s_at 205309_at 221505_at 208180_s_at 200930_s_at 209031_at 201497_x_at 204394_at 212254_s_at 209806_at 209541_at 215108_x_at 204570_at 220116_at 204041_at 210108_at 203498_at 200969_at 218380_at 210480_s_at 209286_at 208490_x_at 200600_at 218254_s_at 212136_at 202740_at 209621_s_at 219405_at 201787_at 209825_s_at 209087_x_at 201662_s_at 212813_at 203485_at 205384_at 204388_s_at 203562_at 207980_s_at 201313_at 206110_at 208789_at 210788_s_at 212887_at 201951_at 204731_at 208527_x_at 212187_x_at 220380_at 209191_at 213246_at 208637_x_at 205505_at 209335_at 218189_s_at 202073_at 200700_s_at 209118_s_at 221019_s_at 204364_s_at 204485_s_at 206434_at 209030_s_at 212361_s_at 202790_at 204463_s_at 219152_at 201645_at 202668_at 214265_at 214106_s_at 212230_at 212281_s_at 201430_s_at 213285_at 213524_s_at 204319_s_at 207030_s_at 207843_x_at 212091_s_at 201417_at 200982_s_at 217736_s_at 203705_s_at 204751_x_at 208747_s_at 202503_s_at 202760_s_at 206303_s_at 202994_s_at 210222_s_at 205433_at 215071_s_at 204734_at 202770_s_at 207826_s_at 202786_at 213992_at 203219_s_at 209356_x_at 221802_s_at 220595_at 202525_at 218974_at 209459_s_at 209469_at 213143_at 209129_at 217080_s_at 211340_s_at 222067_x_at 219935_at 202241_at 202440_s_at 201848_s_at 213400_s_at 213325_at 204457_s_at 218025_s_at 207836_s_at 213587_s_at 207961_x_at 213812_s_at 204753_s_at 201128_s_at 204284_at 222075_s_at 216598_s_at 214446_at 201843_s_at 210719_s_at 203370_s_at 212295_s_at 204955_at 210328_at 201617_x_at 201577_at 214212_x_at 202061_s_at 220765_s_at 210130_s_at 203710_at 218188_s_at 211813_x_at 219117_s_at 201061_s_at 200656_s_at 202729_s_at 209094_at 204472_at 202769_at 201242_s_at 211559_s_at 201438_at 221589_s_at 204396_s_at 209504_s_at 204464_s_at 202605_at 203131_at 208546_x_at 204938_s_at 204231_s_at 212886_at 201849_at 218224_at 201013_s_at 212288_at 202722_s_at 211562_s_at 221782_at 206938_at 74694_s_at 220532_s_at 207824_s_at 204424_s_at 212745_s_at 212993_at 217875_s_at 214266_s_at 214765_s_at 204940_at 218931_at 204036_at 222209_s_at 205934_at 209836_x_at 211980_at 205924_at 201631_s_at 218979_at 209047_at 220187_at 202177_at 213085_s_at 202719_s_at 219806_s_at 210078_s_at 211576_s_at 206070_s_at 213892_s_at 206433_s_at 205248_at 213338_at 202005_at 201792_at 215380_s_at 217764_s_at 202687_s_at 204030_s_at 201582_at 200696_s_at 203716_s_at 213258_at 201724_s_at 219090_at 203138_at 209685_s_at 202826_at 204359_at 212744_at 202133_at 209113_s_at 203680_at 202089_s_at 200974_at 203430_at 218094_s_at 221781_s_at 212713_at 212694_s_at 209470_s_at 209366_x_at 202350_s_at 219555_s_at 211748_x_at 213712_at 213293_s_at 219518_s_at 212736_at 211724_x_at 213800_at 202088_at 221760_at 219395_at 203603_s_at 201543_s_at 212509_s_at 203180_at 209583_s_at 206352_s_at 206701_x_at 218909_at 212764_at 221561_at 205407_at 205133_s_at 204964_s_at 219476_at 218162_at 205769_at 204602_at 203029_s_at 211343_s_at 212115_at 213572_s_at 200806_s_at 209663_s_at 218258_at 205157_s_at 218027_at 200911_s_at 200078_s_at 212423_at 209460_at 212236_x_at 221865_at 217763_s_at 217901_at 203748_x_at 205003_at 204963_at 201890_at 212848_s_at 205566_at 221584_s_at 219649_at 200795_at 207098_s_at 213568_at 219388_at 206580_s_at 201760_s_at 209868_s_at 212183_at 200824_at 221923_s_at 213924_at 213106_at 218934_s_at 213288_at 211981_at 216483_s_at 214761_at 218248_at 209655_s_at 210541_s_at 222108_at 201912_s_at 204163_at 210652_s_at 200808_s_at 212310_at 201893_x_at 219015_s_at 202393_s_at 200903_s_at 214039_s_at 210293_s_at 211864_s_at 212255_s_at 213010_at 219266_at 200878_at 222258_s_at 201560_at 202688_at 206377_at 206860_s_at 209101_at 214243_s_at 202664_at 201583_s_at 217437_s_at 204957_at 37996_s_at 203386_at 217762_s_at 218140_x_at 212624_s_at 201127_s_at 208029_s_at 207260_at 211663_x_at 204567_s_at 202403_s_at 212543_at 212354_at 202893_at 212135_s_at 205757_at 209612_s_at 218035_s_at 205725_at 201735_s_at 218518_at 203642_s_at 206631_at 212448_at 204777_s_at 217752_s_at 212551_at 208658_at 202732_at 209585_s_at 201798_s_at 200970_s_at 204072_s_at 202929_s_at 201820_at 212978_at 209200_at 208190_s_at 209613_s_at 209854_s_at 210986_s_at 221754_s_at 202075_s_at 213555_at 212419_at 203030_s_at 202822_at 209693_at 212914_at 205942_s_at 207266_x_at 221927_s_at 221127_s_at 203931_s_at 221276_s_at 202489_s_at 212358_at 209934_s_at 200923_at 204121_at 208430_s_at 209302_at 212667_at 201563_at 213564_x_at 204026_s_at 204223_at 202363_at 209337_at 40093_at 205200_at 220432_s_at 202728_s_at 210041_s_at 201462_at 204238_s_at 211985_s_at 218696_at 210987_x_at 212816_s_at 213001_at 209367_at 208370_s_at 205937_at 219064_at 202871_at 201109_s_at 215794_x_at 212647_at 209478_at 204442_x_at 208523_x_at 209550_at 205052_at 204400_at 207431_s_at 219747_at 205155_s_at 213675_at 205833_s_at 212344_at 206385_s_at 210764_s_at 214097_at 221872_at 222216_s_at 205803_s_at 212181_s_at 209883_at 200971_s_at 211160_x_at 212563_at 218901_at 200832_s_at 208944_at 222125_s_at 201603_at 221027_s_at 211538_s_at 202599_s_at 214696_at 218388_at 216474_x_at 200698_at 214104_at 203663_s_at 206211_at 204416_x_at 201300_s_at 201704_at 204754_at 221024_s_at 205083_at 217919_s_at 204793_at 218605_at 213262_at 202941_at 204037_at 216251_s_at 205404_at 218194_at 209821_at 211494_s_at 203921_at 203011_at 201215_at 212474_at 201030_x_at 222140_s_at 205792_at 201892_s_at 202949_s_at 218039_at 201841_s_at 217851_s_at 58780_s_at 212916_at 204352_at 210720_s_at 210072_at 213900_at 201389_at 211715_s_at 213438_at 202721_s_at 211323_s_at 213280_at 214071_at 219121_s_at 209656_s_at 203557_s_at 203638_s_at 221880_s_at 213993_at 214437_s_at 212646_at 209357_at 202686_s_at 218789_s_at 204748_at 222315_at 219179_at 202889_x_at 211564_s_at 202286_s_at 219440_at 217986_s_at 209264_s_at 214733_s_at 205573_s_at 201219_at 214077_x_at 209163_at 203570_at 200852_x_at 221900_at 200052_s_at 221541_at 50400_at 209154_at 202546_at 203088_at 220606_s_at 212104_s_at 200894_s_at 202759_s_at 203228_at 207016_s_at 203966_s_at 211535_s_at 218961_s_at 221814_at 211935_at 212190_at 201943_s_at 203640_at 212282_at 218223_s_at 212116_at 201601_x_at 206351_s_at 212845_at 203164_at 213004_at 213410_at 203810_at 203641_s_at 206391_at 200946_x_at 201426_s_at 212692_s_at 203254_s_at 209917_s_at 211126_s_at 209694_at 205683_x_at 218556_at 213974_at 209911_x_at 201170_s_at 218654_s_at 202551_s_at 218211_s_at 212501_at 200807_s_at 205856_at 218218_at 201151_s_at 206770_s_at 217890_s_at 203616_at 209436_at 212347_x_at 204802_at 206502_s_at 218499_at 202718_at 212675_s_at 206170_at 218204_s_at 219411_at 823_at 201416_at 209285_s_at 201647_s_at 206392_s_at 218888_s_at 207134_x_at 217942_at 218711_s_at 51158_at 219654_at 200681_at 213503_x_at 200670_at 203295_s_at 209531_at 201329_s_at 203215_s_at 216733_s_at 207414_s_at 203620_s_at 211297_s_at 212274_at 210547_x_at 214724_at 219065_s_at 204497_at 204331_s_at 221755_at 209389_x_at 210427_x_at 208788_at 208636_at 204175_at 209169_at 208737_at 201590_x_at 206429_at 218330_s_at 203041_s_at 205127_at 217749_at 202766_s_at 208398_s_at 203571_s_at 218592_s_at 204749_at 221345_at 203688_at 217809_at 209473_at
203387_s_at 210517_s_at 221590_s_at 219647_at 207949_s_at 209897_s_at 218261_at 201387_s_at 205925_s_at 209406_at 209916_at 218824_at 203224_at 201559_s_at 205698_s_at 215382_x_at 208802_at 211737_x_at 218387_s_at 201060_x_at 218883_s_at 57588_at 210715_s_at 212805_at 210024_s_at 212535_at 218465_at 217996_at 202836_s_at 201536_at 207606_s_at 209466_x_at 214875_x_at 209465_x_at 209605_at 212677_s_at 215696_s_at 221676_s_at 222262_s_at 213982_s_at 203593_at 204621_s_at 220625_s_at 210145_at 212186_at 212566_at 222155_s_at 211984_at 202109_at 202086_at AFFX- 218865_at 204422_s_at 202064_s_at HSAC07/X00351_5_at 201401_s_at 206932_at 204127_at 201289_at 205042_at 207547_s_at 201825_s_at 207574_s_at 201579_at 204058_at 218582_at 213290_at 219276_x_at 203637_s_at 215471_s_at 1598_g_at 211498_s_at 204688_at 202939_at 202794_at 201268_at 213005_s_at 218557_at 219410_at 201900_s_at 219922_s_at 219166_at 202762_at 211404_s_at 212554_at 205768_s_at 213156_at 209149_s_at 204114_at 209759_s_at 204099_at 217803_at 212203_x_at 209502_s_at 214022_s_at 212160_at 205802_at 220547_s_at 202898_at 212741_at 209959_at 204608_at 208962_s_at 203115_at 209287_s_at 205078_at 221583_s_at 218608_at 213194_at 218531_at 202796_at 211048_s_at 210095_s_at 217043_s_at 201148_s_at 218275_at 218285_s_at 202279_at 202157_s_at 203009_at 201867_s_at 211070_x_at 208228_s_at 218086_at 208690_s_at 217894_at 201069_at 218434_s_at 202554_s_at 201660_at 215388_s_at 204052_s_at 201602_s_at 203594_at 202720_at 201940_at 212489_at 219115_s_at 205381_at 203765_at 209305_s_at 200652_at 65718_at 204905_s_at 211965_at 217823_s_at 212526_at 204233_s_at 203892_at 212989_at 203002_at 215438_x_at 209135_at 201963_at 210084_x_at 37117_at 204271_s_at 200825_s_at 203636_at 219038_at 205304_s_at 221941_at 218678_at 202183_s_at 209542_x_at 91816_f_at 218963_s_at 219133_at 201315_x_at 218049_s_at 218694_at 221823_at 209645_s_at 209665_at 202388_at 207981_s_at 201037_at 220638_s_at 204149_s_at 203545_at 205608_s_at 203630_s_at 218864_at 212064_x_at 201328_at 205102_at 209199_s_at 218145_at 205743_at 209706_at 201655_s_at 218676_s_at 216331_at 201486_at 217023_x_at 220226_at 206117_at 208583_x_at 219829_at 201115_at 203411_s_at 208910_s_at 206874_s_at 221586_s_at 205265_s_at 210241_s_at 211577_s_at 220642_x_at 206359_at 213996_at 201042_at 203775_at 212817_at 204143_s_at 204418_x_at 201734_at 201136_at 202655_at 208965_s_at 221648_s_at 202499_s_at 214109_at 216264_s_at 212307_s_at 204803_s_at 215125_s_at 209242_at 212204_at 202609_at 208796_s_at 218051_s_at 209625_at 202404_s_at 213600_at 215464_s_at 209600_s_at 202587_s_at 214240_at 203884_s_at 203225_s_at 216887_s_at 211971_s_at 213016_at 200654_at 216321_s_at 217483_at 218368_s_at 206656_s_at 221729_at 221882_s_at 219506_at 207549_x_at 207191_s_at 218996_at 213656_s_at 208787_at 201482_at 200895_s_at 212151_at 213441_x_at 200904_at 205420_at 201719_s_at 203524_s_at 202465_at 219819_s_at 205168_at 202778_s_at 204059_s_at 207275_s_at 209304_x_at 212652_s_at 201243_s_at 221931_s_at 214121_x_at 222118_at 204268_at 204066_s_at 219427_at 200863_s_at 209447_at 201516_at 204929_s_at 204404_at 221773_at 210243_s_at 221718_s_at 209265_s_at 218421_at 217826_s_at 212669_at 201520_s_at 202074_s_at 208702_x_at 212353_at 211899_s_at 207542_s_at 201976_s_at 218502_s_at 210996_s_at 210105_s_at 214710_s_at 201868_s_at 209036_s_at 202401_s_at 212573_at 212793_at 201091_s_at 202917_s_at 218458_at 204304_s_at 208840_s_at 201149_s_at 217871_s_at 201272_at 214919_s_at 212077_at 212749_s_at 215127_s_at 212774_at 204865_at 203207_s_at 208949_s_at 203431_s_at 209318_x_at 219217_at 213274_s_at 202395_at 204755_x_at 217908_s_at 202504_at 218423_x_at 201153_s_at 200093_s_at 201869_s_at 218792_s_at 218298_s_at 201264_at 201508_at 215227_x_at 210471_s_at 216074_x_at 209205_s_at 218073_s_at 212488_at 211747_s_at 213411_at 218969_at 215707_s_at 209593_s_at 203973_s_at 201947_s_at 202071_at 213059_at 203607_at 209905_at 221766_s_at 219787_s_at 211719_x_at 212279_at 208816_x_at 201691_s_at 203725_at 203284_s_at 203140_at 200968_s_at 213275_x_at 203517_at 204115_at 204168_at 213714_at 201066_at 219505_at 201075_s_at 212240_s_at 209224_s_at 201369_s_at 208612_at 202132_at 213244_at 222101_s_at 208918_s_at 201008_s_at 220030_at 209293_x_at 218439_s_at 91703_at 203139_at 212587_s_at 212922_s_at 205051_s_at 218984_at 211962_s_at 205293_x_at 221796_at 211549_s_at 210896_s_at 218291_at 212253_x_at 202918_s_at 212757_s_at 216305_s_at 205303_at 201088_at 45297_at 221739_at 209086_x_at 202961_s_at 206458_s_at 202418_at 205620_at 218001_at 204990_s_at 206299_at 209298_s_at 218500_at 201152_s_at 218206_x_at 207741_x_at 202428_x_at 221246_x_at 64486_at 212195_at 220753_s_at 214464_at 209776_s_at 202411_at 220892_s_at 221045_s_at 212165_at 214660_at 201736_s_at 212464_s_at 218704_at 218486_at 208309_s_at 222288_at 218944_at 203939_at 218966_at 201235_s_at 214214_s_at 212276_at 213308_at 210036_s_at 203102_s_at 209307_at 201722_s_at 203325_s_at 211733_x_at 201958_s_at 205807_s_at 212430_at 214096_s_at 213364_s_at 202660_at 212086_x_at 219215_s_at 220751_s_at 202606_s_at 218435_at 210396_s_at 213381_at 39817_s_at 202724_s_at 202138_x_at 222303_at 214157_at 207002_s_at 212570_at 203753_at 206103_at 213069_at 202346_at 209505_at 201096_s_at 214439_x_at 209482_at 203178_at 209147_s_at 206375_s_at 220741_s_at 213891_s_at 213423_x_at 202228_s_at 203148_s_at 205109_s_at 209921_at 205752_s_at 213734_at 205207_at 201193_at 201312_s_at 220342_x_at 206481_s_at 210886_x_at 203886_s_at 203415_at 201743_at 201941_at 205952_at 200606_at 210495_x_at 214522_x_at 210198_s_at 213234_at 203632_s_at 209228_x_at 211026_s_at 208764_s_at 215193_x_at 208722_s_at 205251_at 210018_x_at 204140_at 218788_s_at 212463_at 206790_s_at 204517_at 203629_s_at 203695_s_at 221637_s_at 212197_x_at 208852_s_at 219902_at 210296_s_at 216215_s_at 207655_s_at 206022_at 218328_at 201744_s_at 200803_s_at 209090_s_at 202233_s_at 209374_s_at 218981_at 212192_at 217900_at 212386_at 217962_at 33760_at 205750_at 202291_s_at 202543_s_at 210276_s_at 212085_at 212239_at 217755_at 211671_s_at 202785_at 202947_s_at 214358_at 206355_at AFFX- 202296_s_at 208146_s_at 212685_s_at HSAC07/X00351_M_at 219920_s_at 201185_at 217956_s_at 204518_s_at 202144_s_at 216442_x_at 200044_at 203477_at 203116_s_at 203813_s_at 220980_s_at 201604_s_at 219521_at 201234_at 211497_x_at 202180_s_at 207362_at 201858_s_at 201135_at 218574_s_at 221610_s_at 201565_s_at 202178_at 221502_at 213713_s_at 216565_x_at 221786_at 214894_x_at 208653_s_at 212268_at 218989_x_at 214771_x_at 201962_s_at 208335_s_at 210962_s_at 201082_s_at 210087_s_at 218683_at 212219_at 221870_at 218647_s_at 219371_s_at 208841_s_at 213519_s_at 219362_at 210632_s_at 218652_s_at 208767_s_at 209903_s_at 203868_s_at 202960_s_at 204151_x_at 213301_x_at 216235_s_at 202793_at 202878_s_at 208843_s_at 215706_x_at 208950_s_at 213901_x_at 203008_x_at 204855_at 220080_at 205364_at 200910_at 213154_s_at 205294_at 203071_at 203213_at 204687_at 214281_s_at 213547_at 213843_x_at 222146_s_at 202697_at 218656_s_at 202406_s_at 208633_s_at 211034_s_at 202644_s_at 218680_x_at 201995_at 203124_s_at 203264_s_at 219061_s_at 212242_at 200929_at 202519_at 203721_s_at 213135_at 208800_at 204993_at 205047_s_at 213620_s_at 212688_at 200771_at 200599_s_at 205022_s_at 201523_x_at 212878_s_at 219762_s_at 218236_s_at 214156_at 209646_x_at 218375_at 205262_at 202779_s_at 203687_at 214005_at 200611_s_at 212305_s_at 212387_at 201284_s_at 213134_x_at 201503_at 212071_s_at 220942_x_at 209896_s_at 201790_s_at 208760_at 200947_s_at 37408_at 218357_s_at 212382_at 204949_at 205577_at 201830_s_at 216033_s_at 204427_s_at 209197_at 218928_s_at 211990_at 213116_at 210613_s_at 212536_at 204730_at 218046_s_at 202156_s_at 221539_at 205782_at 205073_at 211653_x_at 200873_s_at 201445_at 219041_s_at 204797_s_at 203201_at 212148_at 209109_s_at 211991_s_at 214472_at 218031_s_at 206307_s_at 204260_at 202539_s_at 212690_at 200750_s_at 210762_s_at 203165_s_at 213306_at 220189_s_at 203233_at 218213_s_at 209699_x_at 204927_at 215870_s_at 211423_s_at 203887_s_at 218016_s_at 203068_at 221827_at 203604_at 211754_s_at 205578_at 213501_at 204790_at 209796_s_at 202432_at 202832_at 221016_s_at 209873_s_at 209568_s_at 204123_at 202117_at 219060_at 214577_at 201004_at 219228_at 65133_i_at 213110_s_at 201931_at 201648_at 202857_at 202946_s_at 210186_s_at 209379_s_at 201549_x_at 205120_s_at 201961_s_at 213316_at 201791_s_at 203232_s_at 202194_at 207118_s_at 204386_s_at 204344_s_at 221688_s_at 204049_s_at 209326_at 221730_at 208799_at 204640_s_at 202996_at 212605_s_at 200875_s_at 209967_s_at 201821_s_at 212143_s_at 218982_s_at 201721_s_at 209971_x_at 212457_at 220094_s_at 205011_at 209695_at 202908_at 200098_s_at 205824_at 218003_s_at 212923_s_at 210739_x_at 202765_s_at 218112_at 209312_x_at 222001_x_at 203017_s_at 212527_at 214040_s_at 201587_s_at 202207_at 213720_s_at 213138_at 201653_at 202205_at 205449_at 214608_s_at 205774_at 202047_s_at 200037_s_at 213401_s_at 203484_at 209263_x_at 208864_s_at 208723_at 201479_at 202008_s_at 217870_s_at 204979_s_at 201341_at 205348_s_at 217761_at 203749_s_at 205244_s_at 205624_at 208674_x_at 200838_at 209773_s_at 202450_s_at 209872_s_at 202821_s_at 218192_at 200816_s_at 213166_x_at 203231_s_at 203918_at 205478_at 213490_s_at 217795_s_at 209104_s_at 201785_at 218919_at 201425_at 213995_at 218880_at 211778_s_at 212681_at 208801_at 207453_s_at 213132_s_at 217997_at 202300_at 210976_s_at 36936_at 215146_s_at 213152_s_at 200609_s_at 201524_x_at 212561_at 65517_at 217506_at 205661_s_at 212998_x_at 217827_s_at 201696_at 207121_s_at 209691_s_at 201074_at 202643_s_at 213498_at 210751_s_at 200055_at 205805_s_at 217301_x_at 201666_at 203126_at 212503_s_at 53968_at 209443_at 201819_at 211819_s_at 203880_at 204682_at 203316_s_at 212518_at 209739_s_at 202112_at 206724_at 202613_at 201772_at 211986_at 201512_s_at 202422_s_at 201622_at 204491_at 208447_s_at 218892_at 201698_s_at 221903_s_at 202787_s_at 202242_at 219293_s_at 209582_s_at 202934_at 203060_s_at 221962_s_at 207173_x_at 217551_at 205548_s_at 208959_s_at 205383_s_at 219869_s_at 203066_at 202983_at 203590_at 214779_s_at 200839_s_at 201098_at 208963_x_at 215091_s_at 203339_at 209150_s_at 212494_at 214167_s_at 35776_at 202308_at 201108_s_at 218163_at 208609_s_at 219733_s_at 212549_at 218732_at 201795_at 210627_s_at 208096_s_at 218427_at 213075_at 208264_s_at 210973_s_at 202712_s_at 212565_at 214011_s_at 215306_at 202799_at 200985_s_at 212767_at 202931_x_at 209522_s_at 200671_s_at 209545_s_at 201865_x_at 201619_at 203889_at 204332_s_at 201137_s_at 213365_at 213422_s_at 211574_s_at 222024_s_at 200820_at 202856_s_at 219913_s_at 212851_at 202299_s_at 209474_s_at 210907_s_at 201968_s_at 209110_s_at 214055_x_at 201339_s_at 210202_s_at 218009_s_at 202501_at 211762_s_at 212350_at 212316_at 204655_at 222077_s_at 208634_s_at 220584_at 202052_s_at 218681_s_at 216840_s_at 205145_s_at 214767_s_at 218962_s_at 200653_s_at 217868_s_at 219165_at 204333_s_at 205961_s_at 210859_x_at 201311_s_at 218695_at 207978_s_at 203272_s_at 218641_at 218532_s_at 204550_x_at 207147_at 208306_x_at 218045_x_at 205870_at 201568_at 201009_s_at
219053_s_at 201506_at 205687_at 208848_at 208689_s_at 203185_at 212194_s_at 203028_s_at 200889_s_at 212099_at 200048_s_at 202284_s_at 218882_s_at 210201_x_at 214315_x_at 203964_at 209433_s_at 218902_at 209180_at 202950_at 214173_x_at 201537_s_at 218834_s_at 203510_at 217846_at 210875_s_at 201953_at 201020_at 200967_at 204948_s_at 217716_s_at 205933_at 209108_at 205738_s_at 211162_x_at 209737_at 201016_at 212567_s_at 221475_s_at 33850_at 204142_at 209708_at 202802_at 214297_at 217645_at 209082_s_at 202095_s_at 217226_s_at 205107_s_at 203698_s_at 208675_s_at 204670_x_at 215519_x_at 218804_at 201659_s_at 210935_s_at 214857_at 218376_s_at 218110_at 202446_s_at 202381_at 203828_s_at 221620_s_at 217066_s_at 206949_s_at 212414_s_at 203235_at 219416_at 214542_x_at 201850_at 208638_at 209015_s_at 205622_at 243_g_at 202670_at 202598_at 202666_s_at 219304_s_at 217772_s_at 203156_at 210250_x_at 209501_at 212202_s_at 201310_s_at 202886_s_at 207358_x_at 218756_s_at 204134_at 218326_s_at 200601_at 205812_s_at 220108_at 218448_at 218309_at 202736_s_at 216333_x_at 201586_s_at 215543_s_at 218321_x_at 204759_at 201909_at 207124_s_at 220721_at 203662_s_at 207721_x_at 218667_at 209175_at 202803_s_at 203827_at 207317_s_at 208951_at 205960_at 212891_s_at 212328_at 218268_at 218648_at 220768_s_at 207630_s_at 210357_s_at 203661_s_at 211936_at 204863_s_at 221797_at 204310_s_at 212496_s_at 57715_at 212828_at 204000_at 204343_at 209846_s_at 205074_at 204820_s_at 201614_s_at 218152_at 50374_at 201161_s_at 213947_s_at 222088_s_at 203576_at 218084_x_at 213379_at 201266_at 221003_s_at 209454_s_at 214117_s_at 216944_s_at 212461_at 207691_x_at 215812_s_at 212120_at 201942_s_at 220955_x_at 210559_s_at 55081_at 205538_at 209598_at 204922_at 211974_x_at 218272_at 215222_x_at 217785_s_at 207714_s_at 213988_s_at 203794_at 207165_at 205559_s_at 203379_at 217211_at 205875_s_at 217820_s_at 208639_x_at 201566_x_at 205938_at 209437_s_at 222231_s_at 204854_at 201011_at 206710_s_at 216338_s_at 218454_at 209300_s_at 213015_at 201816_s_at 220326_s_at 219874_at 202208_s_at 201764_at 206104_at 212825_at 213309_at 209407_s_at 201169_s_at 221462_x_at 213249_at 208436_s_at 213058_at 217927_at 222158_s_at 212740_at 208070_s_at 217970_s_at 209786_at 208826_x_at 212188_at 208872_s_at 203585_at 201629_s_at 202273_at 214271_x_at 201718_s_at 203605_at 214085_x_at 202737_s_at 209106_at 219076_s_at 212259_s_at 202558_s_at 215333_x_at 221691_x_at 219514_at 204244_s_at 219985_at 212175_s_at 211203_s_at 204290_s_at 218183_at 210854_x_at 205081_at 213687_s_at 212117_at 200693_at 212609_s_at 202211_at 212792_at 221041_s_at 209584_x_at 209998_at 212158_at 201521_s_at 205529_s_at 217748_at 202951_at 205355_at 213170_at 91684_g_at 49452_at 201972_at 212223_at 201263_at 218284_at 207563_s_at 212263_at 201406_at 202820_at 213399_x_at 206071_s_at 203270_at 214736_s_at 213897_s_at 205116_at 200082_s_at 219221_at 218567_x_at 203853_s_at 203360_s_at 212063_at 207668_x_at 202552_s_at 209509_s_at 206382_s_at 218270_at 221816_s_at 212311_at 213451_x_at 209142_s_at 218232_at 220587_s_at 203151_at 203926_x_at 204308_s_at 202932_at 200694_s_at 209434_s_at 204438_at 212739_s_at 37005_at 200657_at 202158_s_at 209100_at 221884_at 205980_s_at 205076_s_at 219048_at 38671_at 201576_s_at 219058_x_at 218241_at 215000_s_at 220647_s_at 219025_at 209864_at 209787_s_at 39729_at 221898_at 212322_at 204794_at 201501_s_at 211944_at 219492_at 201980_s_at 210532_s_at 218472_s_at 212637_s_at 221881_s_at 220104_at 212110_at 202469_s_at 216594_x_at 202119_s_at 202123_s_at 211787_s_at 209198_s_at 218512_at 200758_s_at 205077_s_at 212937_s_at 206782_s_at 219737_s_at 218008_at 212221_x_at 204128_s_at 221565_s_at 209262_s_at 212080_at 202813_at 204341_at 218358_at 212111_at 200088_x_at 218627_at 200715_x_at 209765_at 214983_at 218723_s_at 208828_at 217833_at 221580_s_at 222240_s_at 208905_at 202172_at 221984_s_at 212658_at 206492_at 203811_s_at 217791_s_at 200791_s_at 208985_s_at 201155_s_at 201327_s_at 205100_at 201371_s_at 202616_s_at 200961_at 221527_s_at 204941_s_at 203501_at 205329_s_at 213348_at 201530_x_at 202497_x_at 218633_x_at 221666_s_at 208778_s_at 203256_at 201317_s_at 207838_x_at 214442_s_at 204834_at 212953_x_at 214369_s_at 219517_at 220975_s_at 218972_at 209297_at 202425_x_at 200788_s_at 219283_at 205795_at 202705_at 203518_at 203997_at 204436_at 222212_s_at 219561_at 213607_x_at 202371_at 216958_s_at 208712_at 204435_at 219489_s_at 204228_at 203685_at 208967_s_at 200966_x_at 219732_at 207761_s_at 218219_s_at 209960_at 215300_s_at 202957_at 202645_s_at 204735_at 205512_s_at 203639_s_at 213292_s_at 214812_s_at 204005_s_at 202861_at 203942_s_at 203597_s_at 218684_at 203787_at 207439_s_at 202577_s_at 218481_at 211998_at 216640_s_at 220677_s_at 210386_s_at 218823_s_at 204675_at 211518_s_at 206004_at 204150_at 221868_at 209539_at 209617_s_at 208030_s_at 220865_s_at 202953_at 212623_at 218651_s_at 218548_x_at 202069_s_at 212544_at 202305_s_at 201478_s_at 220272_at 213119_at 201605_x_at 208654_s_at 219229_at 205164_at 209083_at 222025_s_at 201828_x_at 209317_at 212196_at 204391_x_at 202723_s_at 200997_at 203756_at 218563_at 206813_at 208805_at 60471_at 201872_s_at 203986_at 215280_s_at 208679_s_at 218741_at 202508_s_at 207833_s_at 211654_x_at 221206_at 212610_at 202096_s_at 202048_s_at 204659_s_at 210829_s_at 213836_s_at 204028_s_at 201463_s_at 212371_at 218816_at 212702_s_at 211036_x_at 200702_s_at 201023_at 209702_at 211061_s_at 214175_x_at 209323_at 202734_at 218503_at 203404_at 202168_at 205018_s_at 218529_at 209071_s_at 218509_at 202003_s_at 220742_s_at 201930_at 218037_at 212822_at 204340_at 211002_s_at 203133_at 202362_at 212053_at 207233_s_at 203252_at 211473_s_at 221253_s_at 213151_s_at 208756_at 203340_s_at 220525_s_at 200836_s_at 218866_s_at 213455_at 214830_at 202439_s_at 219188_s_at 219024_at 220782_x_at 202561_at 218398_at 203104_at 210027_s_at 218345_at 212340_at 218128_at 210667_s_at 207397_s_at 201584_s_at 45714_at 217746_s_at 212604_at 219223_at 203909_at 209714_s_at 200920_s_at 218440_at 210605_s_at 200809_x_at 201021_s_at 201338_x_at 208112_x_at 212995_x_at 219370_at 218857_s_at 205648_at 204825_at 209203_s_at 213041_s_at 207966_s_at 203647_s_at 201120_s_at 211202_s_at 212670_at 202738_s_at 216236_s_at 219342_at 212367_at 201359_at 200905_x_at 212902_at 205231_s_at 217725_x_at 212758_s_at 208977_x_at 214721_x_at 220235_s_at 209194_at 202614_at 209365_s_at 204264_at 205139_s_at 204545_at 202910_s_at 218198_at 212017_at 201077_s_at 214725_at 212826_s_at 209834_at 211177_s_at 209546_s_at 218252_at 209435_s_at 205084_at 212119_at 201113_at 209321_s_at 218202_x_at 210628_x_at 58696_at 222065_s_at 214855_s_at 212169_at 218795_at 213295_at 206499_s_at 211031_s_at 212129_at 209506_s_at 201490_s_at 215235_at 205219_s_at 43427_at 201376_s_at 206510_at 208941_s_at 202617_s_at 213188_s_at 218831_s_at 217797_at 222221_x_at 208687_x_at 213395_at 212015_x_at 218935_at 211758_x_at 208611_s_at 212433_x_at 203305_at 204025_s_at 218675_at 212109_at 221922_at 209391_at 205611_at 204067_at 210089_s_at 213913_s_at 221485_at 213726_x_at 207069_s_at 212247_at 209075_s_at 204967_at 209039_x_at 204263_s_at 212294_at 212330_at 213603_s_at 207831_x_at 212660_at 213017_at 216100_s_at 204824_at 217911_s_at 211558_s_at 215096_s_at 218320_s_at 211776_s_at 217256_x_at 212409_s_at 203744_at 213817_at 221689_s_at 201336_at 202347_s_at 202756_s_at 206723_s_at 205079_s_at 217964_at 218127_at 219809_at 202522_at 203014_x_at 212608_s_at 201177_s_at 200672_x_at 204212_at 201022_s_at 212597_s_at 202638_s_at 217812_at 209270_at 201293_x_at 212706_at 217007_s_at 212082_s_at 218361_at 203414_at 201415_at 218425_at 218764_at 218634_at 204624_at 219431_at 211765_x_at 220407_s_at 219742_at 201649_at 211033_s_at 1405_i_at 207239_s_at 200655_s_at 206527_at 218660_at 200699_at 218631_at 205339_at 212441_at 204853_at 36030_at 200691_s_at 220634_at 210946_at 213434_at 201256_at 202336_s_at 210594_x_at 212179_at 202282_at 213766_x_at 207348_s_at 202656_s_at 201588_at 200713_s_at 202272_s_at 204249_s_at 210192_at 213925_at 219575_s_at 202897_at 212415_at 202254_at 222206_s_at 203883_s_at 220607_x_at 209324_s_at 220354_at 209732_at 204767_s_at 200951_s_at 201630_s_at 204045_at 214831_at 212829_at 202514_at 211892_s_at 320_at 210840_s_at 204039_at 202657_s_at 210434_x_at 205525_at 208757_at 219525_at 208716_s_at 212408_at 214431_at 208491_s_at 212396_s_at 210702_s_at 65588_at 201040_at 218282_at 202510_s_at 209399_at 204365_s_at 203311_s_at 39582_at 219324_at 212655_at 214129_at 38487_at 202900_s_at 208740_at 212508_at 203508_at 212290_at 218537_at 209925_at 203063_at 213427_at 220233_at 217726_at 209009_at 212127_at 205280_at 201489_at 1294_at 218688_at 202784_s_at 200925_at 202328_s_at 218160_at 209563_x_at 202534_x_at 212798_s_at 209421_at 219670_at 219211_at 203332_s_at 202105_at 214937_x_at 219203_at 213034_at 207871_s_at 216210_x_at 211113_s_at 214719_at 219709_x_at 209069_s_at 214737_x_at 209121_x_at 204266_s_at 211976_at 206831_s_at 204912_at 209014_at 61734_at 212416_at 201090_x_at 213610_s_at 203503_s_at 213581_at 208615_s_at 200046_at 215059_at 218305_at 207172_s_at 214789_x_at 210001_s_at 221665_s_at 211700_s_at 201675_at 203823_at 208696_at 215990_s_at 204295_at 203281_s_at 220285_at 202116_at 201458_s_at 203726_s_at 218908_at 200813_s_at 201682_at 200984_s_at 202246_s_at 202646_s_at 212378_at 201474_s_at 210023_s_at 212504_at 203230_at 200801_x_at 210523_at 219451_at 213223_at 213261_at 201322_at 212855_at 205486_at 217765_at 218540_at 206093_x_at 221654_s_at 212235_at 217861_s_at 203891_s_at 209261_s_at 213567_at 219302_s_at 207571_x_at 211378_x_at 200712_s_at 203023_at 205259_at AFFX- 216583_x_at 205325_at 205246_at HSAC07/X00351_3_at 218562_s_at 32094_at 218725_at 214687_x_at 203312_x_at 203249_at 201385_at 219563_at 218590_at 219496_at 209275_s_at 210785_s_at 200081_s_at 203812_at 205850_s_at 212917_x_at 205310_at 204556_s_at 216895_at 210401_at 201548_s_at 200784_s_at 208214_at 211000_s_at 200739_s_at 32259_at 212661_x_at 218815_s_at 208709_s_at 213646_x_at 219289_at 212420_at 218436_at 44702_at 219428_s_at 201538_s_at 204031_s_at 205153_s_at 203287_at 204136_at 33814_at 201885_s_at 209429_x_at 201380_at 208676_s_at 210073_at 209777_s_at 221447_s_at 215947_s_at 211945_s_at 204247_s_at 209343_at 218511_s_at 220230_s_at 219860_at 214632_at 201723_s_at 213688_at 217720_at 205082_s_at 201913_s_at 211948_x_at 222362_at 207302_at 204811_s_at 213939_s_at 206254_at 203300_x_at 209238_at 207071_s_at 200786_at 202594_at 202072_at 212632_at 219862_s_at 219305_x_at 203458_at 213658_at 200074_s_at 213327_s_at 213083_at 202136_at 209284_s_at 201502_s_at 205617_at 201361_at 218661_at 206453_s_at 213009_s_at 205266_at 210149_s_at 216205_s_at 45526_g_at 218691_s_at 202329_at 210664_s_at 212484_at 221503_s_at 216306_x_at 208671_at 200651_at 204421_s_at 218408_at 213113_s_at 215159_s_at 222111_at 202788_at 204736_s_at 207168_s_at 215051_x_at 221772_s_at 212157_at 219786_at 212958_x_at 218653_at 221905_at 218130_at 204606_at 215482_s_at 209485_s_at 221791_s_at 203369_x_at
219676_at 220911_s_at 208968_s_at 212747_at 200009_at 212262_at 209520_s_at 211458_s_at 201218_at 219523_s_at 220966_x_at 206868_at 222234_s_at 204294_at 202190_at 214909_s_at 219129_s_at 40016_g_at 202791_s_at 208454_s_at 221807_s_at 220974_x_at 217724_at 206757_at 204478_s_at 213867_x_at 221826_at 204192_at 203040_s_at 210926_at 204133_at 203735_x_at 213912_at 215606_s_at 201290_at 214808_at 220174_at 37022_at 204027_s_at 213531_s_at 207396_s_at 212936_at 218780_at 204062_s_at 200068_s_at 219993_at 200740_s_at 202795_x_at 218264_at 203409_at 40359_at 203530_s_at 217930_s_at 218012_at 212838_at 202578_s_at 205709_s_at 214656_x_at 200022_at 221885_at 200734_s_at 219939_s_at 218123_at 219278_at 211978_x_at 211573_x_at 201613_s_at 212938_at 203465_at 210968_s_at 203713_s_at 202174_s_at 221018_s_at 205088_at 212769_at 218062_x_at 218689_at 204542_at 201771_at 203879_at 218829_s_at 221752_at 212121_at 46665_at 209440_at 219602_s_at 208822_s_at 219961_s_at 210005_at 213386_at 212269_s_at 205104_at 209804_at 211058_x_at 44065_at 212759_s_at 208466_at 209193_at 219075_at 212302_at 211271_x_at 214433_s_at 208917_x_at 218032_at 214806_at 202206_at 206722_s_at 203586_s_at 221817_at 211769_x_at 213699_s_at 219770_at 212351_at 212752_at 214310_s_at 209840_s_at 213435_at 212796_s_at 213941_x_at 208981_at 221587_s_at 213944_x_at 208009_s_at 215537_x_at 208369_s_at 221928_at 219148_at 40560_at 202978_s_at 208206_s_at 219080_s_at 205786_s_at 218316_at 202364_at 220773_s_at 203919_at 217903_at 204174_at 214481_at 206972_s_at 219931_s_at 204683_at 211052_s_at 214318_s_at 201758_at 211994_at 202433_at 208617_s_at 203208_s_at 209901_x_at 210927_x_at 213394_at 218817_at 205479_s_at 202658_at 219213_at 208072_s_at 211997_x_at 208759_at 211003_x_at 211658_at 209606_at 206066_s_at 214298_x_at 201095_at 203499_at 219851_at 207053_at 221652_s_at 219767_s_at 212436_at 202590_s_at 218101_s_at 205398_s_at 203867_s_at 205341_at 215023_s_at 218669_at 219209_at 204537_s_at 204169_at 212299_at 201097_s_at 214791_at 218636_s_at 208982_at 207262_at 202022_at 208393_s_at 202575_at 202063_s_at 221656_s_at 203500_at 205006_s_at 205761_s_at 202733_at 202189_x_at 212639_x_at 204003_s_at 48031_r_at 201876_at 218496_at 204618_s_at 212803_at 213189_at 201183_s_at 204034_at 218626_at 213082_s_at 214449_s_at 218151_x_at 201375_s_at 208824_x_at 203278_s_at 211972_x_at 200879_s_at 218199_s_at 220092_s_at 203192_at 204552_at 217127_at 214177_s_at 205441_at 220818_s_at 203573_s_at 219137_s_at 217968_at 209402_s_at 213601_at 204334_at 221196_x_at 211006_s_at 208842_s_at 203592_s_at 218226_s_at 203320_at 202059_s_at 202564_x_at 212048_s_at 212895_s_at 212315_s_at 212360_at 202632_at 210115_at 217740_x_at 212076_at 212479_s_at 203599_s_at 214661_s_at 220142_at 202331_at 202455_at 219562_at 208869_s_at 219189_at 219436_s_at 218070_s_at 204984_at 200057_s_at 212468_at 204798_at 222073_at 217910_x_at 200066_at 213762_x_at 218820_at 218598_at 204462_s_at 217961_at 201752_s_at 219429_at 205112_at 213708_s_at 215493_x_at 218735_s_at 218215_s_at 218565_at 213326_at 218766_s_at 205902_at 202159_at 204633_s_at 204883_s_at 201379_s_at 208856_x_at 202998_s_at 203314_at 213203_at 37831_at 211072_x_at 201330_at 37384_at 217466_x_at 200051_at 201716_at 210794_s_at 33307_at 210102_at 203719_at 202262_x_at 207812_s_at 209867_s_at 211392_s_at 218373_at 212118_at 208786_s_at 205324_s_at 209688_s_at 214537_at 213095_x_at 203022_at 209721_s_at 35201_at 213417_at 221891_x_at 206649_s_at 201349_at 218870_at 219723_x_at 213940_s_at 205634_x_at 203047_at 207654_x_at 213513_x_at 203677_s_at 215346_at 203869_at 208859_s_at 201886_at 222379_at 221572_s_at 218266_s_at 204962_s_at 204882_at 209145_s_at 204198_s_at 204488_at 203894_at 203358_s_at 211043_s_at 37950_at 209251_x_at 206919_at 40472_at 221818_at 202039_at 203947_at 205240_at 200627_at 204989_s_at 206109_at 202921_s_at 201459_at 221473_x_at 201709_s_at 207895_at 201391_at 202652_at 202217_at 202806_at 218868_at 208018_s_at 221777_at 217946_s_at 212395_s_at 202579_x_at 200843_s_at 221484_at 210761_s_at 203944_x_at 209053_s_at 218997_at 201420_s_at 201460_at 216397_s_at 213260_at 218289_s_at 202916_s_at 219033_at 211701_s_at 216652_s_at 203456_at 211720_x_at 203733_at 209188_x_at 213630_at 219176_at 213644_at 32209_at 208868_s_at 218797_s_at 210574_s_at 204117_at 213030_s_at 218455_at 214179_s_at 219050_s_at 204428_s_at 215982_s_at 52651_at 213885_at 213556_at 205909_at 202783_at 202488_s_at 206284_x_at 212871_at 200759_x_at 204809_at 203167_at 216985_s_at 221779_at 204695_at 202858_at 220661_s_at 219457_s_at 219797_at 208964_s_at 209592_s_at 211668_s_at 204108_at 222199_s_at 218953_s_at 209866_s_at 205429_s_at 208158_s_at 206194_at 214181_x_at 204423_at 213698_at 218855_at 203197_s_at 201033_x_at 217362_x_at 213237_at 221991_at 212719_at 212715_s_at 213115_at 203674_at 209618_at 219520_s_at 203160_s_at 53720_at 205963_s_at 202530_at 212486_s_at 207629_s_at 218874_s_at 210224_at 205111_s_at 217904_s_at 204954_s_at 212642_s_at 209831_x_at 40446_at 221800_s_at 213876_x_at 215311_at 218310_at 206173_x_at 222171_s_at 52975_at 204763_s_at 219154_at 202092_s_at 205447_s_at 212227_x_at 203046_s_at 206178_at 212818_s_at 211750_x_at 218988_at 204044_at 206637_at 205111_s_at 204561_x_at 214853_s_at 204636_at 211780_x_at 204903_x_at 208741_at 210140_at 215253_s_at 50965_at 37152_at 204502_at 206050_s_at 218159_at 214285_at 205543_at 210692_s_at 217839_at 214823_at 219838_at 219620_x_at 209830_s_at 219628_at 219801_at 219243_at 43977_at 209726_at 210408_s_at 203062_s_at 208648_at 201934_at 211871_x_at 200886_s_at 65086_at 206009_at 219815_at 206122_at 210410_s_at 213252_at 214078_at 202640_s_at 213608_s_at 36829_at 204221_x_at 212550_at 219828_at 209204_at 209827_s_at 205405_at 216086_at 202894_at 217965_s_at 204513_s_at 201759_at 212695_at 207375_s_at 220027_s_at 221591_s_at 212427_at 213804_at 204303_s_at 204717_s_at 213270_at 207436_x_at 218844_at 221222_s_at 220937_s_at 212550_at 208103_s_at 221738_at 218337_at 219821_s_at 221506_s_at 212429_s_at 219367_s_at 209716_at 200673_at 208903_at 207984_s_at 213533_at 221021_s_at 202945_at 203666_at 219970_at 209877_at 204578_at 212134_at 209603_at 221552_at 204366_s_at 205528_s_at 53991_at 212130_x_at 222081_at 212045_at 202744_at 218950_at 206688_s_at 217025_s_at 203217_s_at 212447_at 220631_at 203045_at 205192_at 207971_s_at 220144_s_at 222217_s_at 207614_s_at 203757_s_at 203483_at 201471_s_at 207457_s_at 31845_at 221886_at 202098_s_at 204437_s_at 208858_s_at 203010_at 208325_s_at 203187_at 212024_x_at 217452_s_at 205121_at 220452_x_at 205270_s_at 214617_at 205918_at 64942_at 204502_at 202663_at 208174_x_at 203734_at 205632_s_at 211256_x_at 206518_s_at 204879_at 211809_x_at 213906_at 215767_at 219390_at 209716_at 220246_at 53991_at 214033_at 217721_at 204982_at 211316_x_at 215506_s_at 213906_at 218029_at 203514_at 208213_s_at 210648_x_at 204504_s_at 210880_s_at 212823_s_at 212516_at 221832_s_at 204627_s_at 205112_at 202191_s_at 219738_s_at 213066_at 203598_s_at 209534_x_at 219464_at 218424_s_at 35846_at 204038_s_at 209243_s_at 205192_at 211843_x_at 218999_at 206403_at 211871_x_at 202530_at 204747_at 200015_s_at 219195_at 204552_at 64942_at 206009_at 221090_s_at 205121_at 209789_at 206178_at 201184_s_at 210692_s_at 208044_s_at 203798_s_at 209320_at 200066_at 211401_s_at 203741_s_at 200015_s_at 218805_at 219815_at 211072_x_at 215439_x_at 219213_at 203734_at 221753_at 35846_at 212639_x_at 210140_at 213509_x_at 205001_s_at 204513_s_at 206682_at 211194_s_at 214604_at 205255_x_at 202828_s_at 212130_x_at 208213_s_at 218266_s_at 207375_s_at 216017_s_at 204043_at 206050_s_at 205447_s_at 203348_s_at 40420_at 218997_at 213012_at 212227_x_at 207747_s_at 201515_s_at 209401_s_at 209789_at 203598_s_at 212926_at 212486_s_at 217914_at 221551_x_at 204642_at 212672_at 40472_at 207643_s_at 213030_s_at 218497_s_at 37152_at 217965_s_at 213066_at 219677_at 217721_at 213467_at 203045_at 219821_s_at 209940_at 214436_at 214118_x_at 212823_s_at 210882_s_at 209243_s_at 205760_s_at 217220_at 220027_s_at 219593_at 214285_at 219801_at 204043_at 201515_s_at 203167_at 219616_at 217220_at 207988_s_at 204038_s_at 204504_s_at 211330_s_at 214078_at 218677_at 212970_at 52837_at 202410_x_at 202410_x_at 214036_at 221044_s_at 211366_x_at 40560_at 213266_at 221656_s_at 221699_s_at 218950_at 218805_at 211809_x_at 205575_at 205240_at 207034_s_at 214995_s_at 211729_x_at 211780_x_at 35617_at 211325_x_at 209970_x_at 213932_x_at 219039_at 219114_at 219114_at 219529_at 211256_x_at 203197_s_at 207614_s_at 213922_at 212836_at 210079_x_at 207457_s_at 203456_at 216705_s_at 212079_s_at 221901_at 219616_at 52837_at 37384_at 213269_at 221779_at 221753_at 221552_at 221883_at 214853_s_at 217691_x_at 207053_at 219944_at 208325_s_at 203187_at 212134_at 210079_x_at 219195_at 202663_at 221699_s_at 204982_at 203069_at 212818_s_at 220016_at 336_at 215439_x_at 219390_at 206191_at 213804_at 202092_s_at 32502_at 210794_s_at 216017_s_at 206087_x_at 203904_x_at 219768_at 212400_at 204627_s_at 635_s_at 52651_at 218775_s_at 200886_s_at 205543_at 221551_x_at 219970_at 205159_at 203490_at 218775_s_at 218029_at 209688_s_at 208460_at 36829_at 204642_at 203592_s_at 210882_s_at 210347_s_at 213530_at 213644_at 220452_x_at 211058_x_at 221234_s_at 203047_at 201270_x_at 209877_at 205277_at 218807_at 213885_at 220937_s_at 203488_at 205405_at 50965_at 207747_s_at 205599_at 203757_s_at 209171_at 209320_at 48117_at 207984_s_at 212280_x_at 202098_s_at 203348_s_at 204047_s_at 209618_at 203530_s_at 38149_at 204428_s_at 221052_at 204747_at 212748_at 217312_s_at 215734_at 201934_at 218429_s_at 202652_at 204234_s_at 209721_s_at 202256_at 218802_at 208842_s_at 218310_at 221832_s_at 212695_at 219148_at 217608_at 210144_at 206033_s_at 205429_s_at 213269_at 214617_at 204044_at 214806_at 31845_at 45749_at 222217_s_at 203046_s_at 208103_s_at 205911_at 202590_s_at 207654_x_at 213270_at 210607_at 220142_at 221036_s_at 217993_s_at 205560_at 213646_x_at 218766_s_at 217904_s_at 220399_at 204763_s_at 211801_x_at 207988_s_at 220144_s_at 219767_s_at 208393_s_at 211892_s_at 206688_s_at 213100_at 202059_s_at 213630_at 213679_at 219684_at 201977_s_at 211401_s_at 207018_s_at 212076_at 212479_s_at 211668_s_at 209910_at 204174_at 201420_s_at 207971_s_at 212790_x_at 204589_at 219238_at 213467_at 34221_at 203666_at 217910_x_at 205104_at 217598_at 202191_s_at 209145_s_at 221234_s_at 219154_at 205528_s_at 205243_at 205008_s_at 210410_s_at 204177_s_at 212436_at 215767_at 209745_at 201294_s_at 204883_s_at 208018_s_at 208903_at 209257_s_at 213685_at 210702_s_at 214210_at 61734_at 212719_at 210736_x_at 213608_s_at 201090_x_at 220661_s_at 212360_at 43977_at 209841_s_at 217930_s_at 209534_x_at 202945_at 204633_s_at 218868_at 212803_at 205909_at 216187_x_at 207396_s_at 205786_s_at 209672_s_at 209308_s_at 205850_s_at 209867_s_at 221550_at 204556_s_at 218558_s_at 220071_x_at 213393_at 206122_at 213237_at 218424_s_at 205432_at 201183_s_at 202791_s_at 40446_at 218953_s_at 219134_at 221818_at
221885_at 221738_at 204736_s_at 219538_at 212373_at 207059_at 210785_s_at 203208_s_at 214036_at 211720_x_at 219628_at 218874_s_at 212427_at 218159_at 205902_at 208009_s_at 214909_s_at 219635_at 203278_s_at 204809_at 219602_s_at 213115_at 202831_at 214481_at 40837_at 218146_at 53720_at 209195_s_at 212235_at 219723_x_at 213260_at 212395_s_at 215493_x_at 208648_at 215411_s_at 213063_at 214436_at 208569_at 221795_at 208955_at 209866_s_at 33307_at 200813_s_at 218562_s_at 211366_x_at 204402_at 219243_at 204476_s_at 212299_at 222018_at 203879_at 213223_at 218373_at 218598_at 203944_x_at 204798_at 220634_at 213601_at 219563_at 213009_s_at 203586_s_at 204903_x_at 212706_at 219209_at 200697_at 201033_x_at 202646_s_at 208856_x_at 205632_s_at 203947_at 206032_at 217740_x_at 212468_at 216652_s_at 204882_at 203790_s_at 204062_s_at 219033_at 209726_at 208923_at 205453_at 202632_at 203369_x_at 211378_x_at 202783_at 44065_at 220818_s_at 204003_s_at 208158_s_at 209188_x_at 211006_s_at 221018_s_at 202022_at 221508_at 205325_at 39966_at 204063_s_at 220773_s_at 211316_x_at 219129_s_at 207895_at 215215_s_at 212629_s_at 203040_s_at 214298_x_at 202063_s_at 202522_at 206919_at 219436_s_at 209440_at 219961_s_at 213708_s_at 206972_s_at 204169_at 218691_s_at 203287_at 202733_at 204423_at 208869_s_at 208778_s_at 203812_at 218199_s_at 212796_s_at 218988_at 213095_x_at 208696_at 210926_at 211765_x_at 215606_s_at 218797_s_at 205525_at 201709_s_at 202578_s_at 218249_at 221484_at 210192_at 214725_at 208822_s_at 203853_s_at 212127_at 211701_s_at 206587_at 202206_at 213083_at 39582_at 203800_s_at 209901_x_at 208968_s_at 204334_at 213189_at 221991_at 211658_at 203662_s_at 218511_s_at 202254_at 201771_at 208206_s_at 218316_at 213394_at 209777_s_at 38487_at 217961_at 211657_at 212121_at 212715_s_at 202031_s_at 221901_at 204008_at 219545_at 202331_at 219939_s_at 212342_at 208616_s_at 210005_at 202116_at 203500_at 209970_x_at 37831_at 214791_at 204853_at 200916_at 215482_s_at 204198_s_at 204618_s_at 203320_at 211972_x_at 203894_at 222362_at 219520_s_at 220966_x_at 201146_at 217256_x_at 212157_at 206109_at 222171_s_at 201489_at 210073_at 208985_s_at 214629_x_at 221156_x_at 213203_at 203677_s_at 201361_at 205928_at 221473_x_at 211212_s_at 203661_s_at 211113_s_at 202795_x_at 211978_x_at 203037_s_at 34764_at 207571_x_at 219080_s_at 219523_s_at 201723_s_at 202998_s_at 219742_at 209332_s_at 219562_at 203797_at 207262_at 203919_at 204353_s_at 203508_at 203573_s_at 220677_s_at 212155_at 203074_at 219075_at 205231_s_at 219066_at 200673_at 213941_x_at 48031_r_at 204050_s_at 203599_s_at 209925_at 201380_at 218911_at 218032_at 202713_s_at 214177_s_at 202306_at 215990_s_at 209429_x_at 209402_s_at 200651_at 213590_at 218392_x_at 202000_at 218289_s_at 219597_s_at 204488_at 219014_at 218725_at 37022_at 214864_s_at 220108_at 213435_at 222073_at 201758_at 210401_at 218688_at 214052_x_at 216945_x_at 202613_at 201293_x_at 203249_at 221791_s_at 32094_at 208596_s_at 205398_s_at 219097_x_at 205611_at 207168_s_at 213271_s_at 208369_s_at 211031_s_at 203816_at 221928_at 218160_at 204421_s_at 212661_x_at 213556_at 200739_s_at 213217_at 203330_s_at 222221_x_at 209284_s_at 202328_s_at 40359_at 204683_at 212015_x_at 213478_at 202272_s_at 211368_s_at 200734_s_at 207071_s_at 220318_at 204912_at 215947_s_at 205823_at 200068_s_at 205479_s_at 202105_at 213113_s_at 200022_at 46665_at 208466_at 202965_s_at 218512_at 44702_at 201113_at 212409_s_at 218540_at 202449_s_at 210761_s_at 211726_s_at 218070_s_at 208786_s_at 216380_x_at 210089_s_at 208687_x_at 32259_at 219223_at 218487_at 205339_at 208112_x_at 208941_s_at 209703_x_at 218817_at 204462_s_at 203713_s_at 208964_s_at 205371_s_at 210224_at 58696_at 213326_at 219321_at 203185_at 204247_s_at 204606_at 222206_s_at 216594_x_at 205634_x_at 215059_at 202487_s_at 200788_s_at 218741_at AFFX- 218669_at 201209_at HSAC07/X00351_3_at 201913_s_at 218634_at 202282_at 216100_s_at 221196_x_at 214604_at 219463_at 209198_s_at 208072_s_at 218820_at 217968_at 220092_s_at 218653_at 221905_at 213699_s_at 218935_at 209391_at 202579_x_at 221807_s_at 204150_at 201239_s_at 203063_at 208759_at 209015_s_at 209421_at 215051_x_at 200657_at 212855_at 213427_at 211675_s_at 217944_at 213531_s_at 216895_at 208491_s_at 218069_at 213295_at 200809_x_at 201474_s_at 207871_s_at 209474_s_at 204378_at 200801_x_at 222234_s_at 205116_at 219255_x_at 217802_s_at 209238_at 213513_x_at 203437_at 213567_at 212861_at 219496_at 214271_x_at 202897_at 218123_at 208859_s_at 220603_s_at 204546_at 222025_s_at 201718_s_at 219203_at 212326_at 219289_at 220974_x_at 201512_s_at 212262_at 217976_s_at 207691_x_at 201672_s_at 209606_at 209262_s_at 204537_s_at 204360_s_at 213867_x_at 213912_at 213925_at 217791_s_at 203650_at 212351_at 205259_at 205441_at 208454_s_at 218101_s_at 218815_s_at 218436_at 204341_at 215023_s_at 211819_s_at 202811_at 203811_s_at 206556_at 36030_at 218636_s_at 200713_s_at 211098_x_at 212177_at 209804_at 218472_s_at 207156_at 201375_s_at 202900_s_at 214808_at 221696_s_at 212371_at 206004_at 222008_at 202322_s_at 204134_at 204295_at 215313_x_at 206492_at 211000_s_at 201629_s_at 201537_s_at 202488_s_at 215346_at 202514_at 205088_at 212433_x_at 203482_at 208659_at 219431_at 91684_g_at 200984_s_at 219676_at 201980_s_at 211036_x_at 204136_at 206831_s_at 209602_s_at 210768_x_at 205315_s_at 201077_s_at 221485_at 214442_s_at 218731_s_at 209617_s_at 204436_at 218834_s_at 221503_s_at 205761_s_at 211769_x_at 221826_at 209598_at 211558_s_at 209960_at 215300_s_at 203499_at 219786_at 219764_at 204478_s_at 210875_s_at 206533_at 218012_at 202433_at 218425_at 201614_s_at 210840_s_at 201886_at 218128_at 201385_at 216210_x_at 204034_at 212082_s_at 207833_s_at 209039_x_at 210594_x_at 218651_s_at 205617_at 206243_at 207827_x_at 202910_s_at 218209_s_at 213766_x_at 208107_s_at 200676_s_at 36475_at 201403_s_at 203252_at 209840_s_at 212740_at 217109_at 210023_s_at 210880_s_at 218252_at 202561_at 206066_s_at 202136_at 203738_at 213034_at 203569_s_at 202048_s_at 217958_at 33850_at 213188_s_at 212504_at 200740_s_at 213817_at 208821_at 43427_at 214831_at 212188_at 201613_s_at 209765_at 213610_s_at 207317_s_at 201588_at 214297_at 219307_at 60471_at 219709_x_at 217066_s_at 200691_s_at 202510_s_at 203926_x_at 200758_s_at 209317_at 202439_s_at 219428_s_at 201785_at 206722_s_at 222199_s_at 220607_x_at 212798_s_at 209433_s_at 213658_at 200875_s_at 221875_x_at 220934_s_at 205795_at 220174_at 209570_s_at 201095_at 209719_x_at 220647_s_at 200900_s_at 205512_s_at 208617_s_at 202190_at 213940_s_at 219860_at 213434_at 218180_s_at 221805_at 219575_s_at 205006_s_at 203682_s_at 212758_s_at 203458_at 221447_s_at 218509_at 220911_s_at 204088_at 209203_s_at 218133_s_at 204222_s_at 218780_at 212408_at 202852_s_at 218844_at 204675_at 203535_at 217249_x_at 207302_at 210927_x_at 204308_s_at 219771_at 209539_at 202705_at 202856_s_at 214011_s_at 219058_x_at 218198_at 220230_s_at 200088_x_at 205139_s_at 203925_at 210829_s_at 201175_at 204365_s_at 211061_s_at 220115_s_at 218481_at 202803_s_at 200925_at 213939_s_at 203154_s_at 212658_at 221206_at 211776_s_at 209323_at 210561_s_at 207563_s_at 206868_at 201478_s_at 202362_at 205140_at 205005_s_at 219324_at 205551_at 208805_at 204045_at 201682_at 218062_x_at 207831_x_at 203409_at 208405_s_at 218127_at 219188_s_at 212196_at 202604_x_at 205267_at 200750_s_at 201885_s_at 206527_at 220955_x_at 214789_x_at 210976_s_at 203621_at 202861_at 220334_at 204542_at 217835_x_at 209009_at 219874_at 243_g_at 217861_s_at 220272_at 204862_s_at 214812_s_at 222001_x_at 219451_at 203312_x_at 209435_s_at 217720_at 203909_at 221797_at 219514_at 203014_x_at 211653_x_at 206782_s_at 212792_at 218008_at 207714_s_at 204212_at 217211_at 212426_s_at 204989_s_at 204228_at 218345_at 217797_at 219670_at 221253_s_at 207069_s_at 211202_s_at 202594_at 208756_at 204215_at 204025_s_at 1294_at 202671_s_at 203567_s_at 219302_s_at 212822_at 212902_at 209083_at 217929_s_at 212169_at 218005_at 203787_at 219851_at 38671_at 207439_s_at 207838_x_at 221817_at 201021_s_at 220865_s_at 203340_s_at 201338_x_at 218332_at 202697_at 212567_s_at 204811_s_at 212294_at 210409_at 206854_s_at 209434_s_at 201828_x_at 212508_at 201506_at 201256_at 205738_s_at 204244_s_at 211203_s_at 213913_s_at 204249_s_at 221654_s_at 209297_at 218756_s_at 207705_s_at 217772_s_at 209699_x_at 212416_at 202656_s_at 203152_at 213603_s_at 210532_s_at 215222_x_at 219809_at 1405_i_at 207147_at 209702_at 212597_s_at 208096_s_at 202329_at 203726_s_at 218270_at 213395_at 212006_at 204151_x_at 202120_x_at 202617_s_at 216295_s_at 201649_at 201371_s_at 205076_s_at 214156_at 221527_s_at 212622_at 215867_x_at 218788_s_at 203503_s_at 210386_s_at 218660_at 209399_at 214937_x_at 209817_at 204834_at 220587_s_at 212565_at 218684_at 201336_at 217785_s_at 213698_at 213307_at 209563_x_at 218529_at 209194_at 201909_at 201287_s_at 202788_at 203151_at 213947_s_at 209732_at 205190_at 207397_s_at 218264_at 213261_at 219293_s_at 212441_at 200997_at 201795_at 212637_s_at 202657_s_at 221689_s_at 206382_s_at 221868_at 202378_s_at 209104_s_at 207233_s_at 204167_at 201155_s_at 214983_at 214369_s_at 206993_at 221730_at 218320_s_at 219305_x_at 212995_x_at 219025_at 213607_x_at 213151_s_at 220525_s_at 209454_s_at 220495_s_at 205082_s_at 218398_at 202158_s_at 214006_s_at 207453_s_at 210250_x_at 211997_x_at 204161_s_at 206071_s_at 221597_s_at 213386_at 220235_s_at 201022_s_at 217812_at 202784_s_at 202658_at 205079_s_at 218689_at 204682_at 203744_at 205153_s_at 220285_at 202273_at 218361_at 203883_s_at 219517_at 211473_s_at 205774_at 209834_at 203987_at 212063_at 205770_at 201108_s_at 217932_at 211458_s_at 208906_at 212660_at 218764_at 217820_s_at 210058_at 204048_s_at 217809_at 209569_x_at 218882_s_at 204482_at 212129_at 202820_at 33814_at 202478_at 204263_s_at 202756_s_at 202802_at 214656_x_at 218795_at 204438_at 200620_at 219416_at 201349_at 218631_at 203647_s_at 218084_x_at 219733_s_at 203698_s_at 213292_s_at 206600_s_at 211787_s_at 207124_s_at 220104_at 218648_at 202813_at 220326_s_at 209100_at 203794_at 35671_at 219229_at 209407_s_at 212223_at 222231_s_at 202501_at 213897_s_at 203332_s_at 218358_at 212420_at 219053_s_at 208030_s_at 200693_at 202577_s_at 202144_s_at 209365_s_at 201530_x_at 213455_at 219211_at 205559_s_at 207165_at 214577_at 218772_x_at 202957_at 221539_at 200655_s_at 202799_at 212457_at 201458_s_at 218368_s_at 201456_s_at 202552_s_at 202347_s_at 49452_at 217827_s_at 203828_s_at 214751_at 218641_at 217898_at 214624_at 202645_s_at 213138_at 204067_at 212702_s_at 212415_at 204948_s_at 201576_s_at 200791_s_at 210854_x_at 211700_s_at 201415_at 202723_s_at 214173_x_at 202508_s_at 209014_at 203756_at 201317_s_at 202003_s_at 212544_at 214211_at 221475_s_at 205100_at 221665_s_at 203104_at 201406_at 212080_at 203942_s_at 221565_s_at 204435_at 212367_at 212519_at 203281_s_at 218341_at 214460_at 204624_at 211518_s_at 208613_s_at 208763_s_at 218282_at 216944_s_at 218440_at 212259_s_at 217746_s_at 205870_at 222212_s_at 208070_s_at 202168_at 218309_at 218427_at 220975_s_at 50374_at
202371_at 203351_s_at 219561_at 206949_s_at 218831_s_at 201023_at 204670_x_at 218202_x_at 209321_s_at 220354_at 35776_at 217748_at 200920_s_at 218866_s_at 212917_x_at 205661_s_at 208671_at 217726_at 200694_s_at 219060_at 202259_s_at 218219_s_at 209582_s_at 218111_s_at 216840_s_at 218695_at 219525_at 200037_s_at 210605_s_at 201587_s_at 205648_at 213498_at 212263_at 202025_x_at 204979_s_at 202670_at 204797_s_at 221462_x_at 205207_at 200082_s_at 205529_s_at 212825_at 204011_at 219492_at 215096_s_at 201501_s_at 209081_s_at 217716_s_at 200884_at 201003_x_at 220952_s_at 212461_at 216894_x_at 207722_s_at 209437_s_at 207121_s_at 212117_at 202767_at 204854_at 202959_at 209485_s_at 202320_at 204000_at 206723_s_at 213737_x_at 205161_s_at 212851_at 201341_at 202616_s_at 218163_at 206458_s_at 217200_x_at 210762_s_at 209130_at 206375_s_at 208757_at 214823_at 202738_s_at 210201_x_at 219215_s_at 214736_s_at 209479_at 202446_s_at 204266_s_at 209075_s_at 203270_at 209506_s_at 36936_at 209307_at 209233_at 213058_at 210523_at 202575_at 218037_at 204820_s_at 219521_at 200702_s_at 201074_at 210102_at 207668_x_at 200609_s_at 208270_s_at 212494_at 204066_s_at 208679_s_at 210357_s_at 205824_at 204290_s_at 201040_at 202787_s_at 218183_at 218491_s_at 218627_at 220768_s_at 202734_at 208674_x_at 208712_at 39729_at 218284_at 209509_s_at 215000_s_at 202614_at 202047_s_at 212739_s_at 213422_s_at 200715_x_at 210973_s_at 203213_at 209069_s_at 204264_at 216033_s_at 205329_s_at 202291_s_at 216640_s_at 219165_at 218110_at 201121_s_at 205317_s_at 219489_s_at 219732_at 206813_at 203576_at 212221_x_at 209110_s_at 209546_s_at 215812_s_at 212503_s_at 201586_s_at 202117_at 209142_s_at 219370_at 204985_s_at 203501_at 221003_s_at 212111_at 212953_x_at 212518_at 201675_at 218454_at 212316_at 211944_at 209971_x_at 212158_at 217970_s_at 210968_s_at 211758_x_at 212586_at 215519_x_at 210628_x_at 205246_at 202643_s_at 206254_at 205044_at 212032_s_at 208306_x_at 200098_s_at 212119_at 218567_x_at 201730_s_at 213490_s_at 202450_s_at 209180_at 222240_s_at 217959_s_at 212179_at 202886_s_at 214660_at 210434_x_at 208335_s_at 213687_s_at 204790_at 204340_at 202464_s_at 205084_at 201311_s_at 208799_at 207118_s_at 205687_at 209967_s_at 203316_s_at 57715_at 218493_at 222024_s_at 220742_s_at 209263_x_at 215091_s_at 203749_s_at 201780_s_at 203071_at 217846_at 209596_at 204343_at 218667_at 218563_at 201721_s_at 201931_at 205805_s_at 205145_s_at 33322_i_at 214167_s_at 201605_x_at 218548_x_at 204794_at 201016_at 209343_at 208852_s_at 211796_s_at 201479_at 203518_at 203317_at 201696_at 200055_at 203597_s_at 208864_s_at 202172_at 201826_s_at 218892_at 214117_s_at 213249_at 211033_s_at 207542_s_at 202923_s_at 204260_at 208800_at 204310_s_at 208436_s_at 213170_at 209739_s_at 202765_s_at 200831_s_at 204344_s_at 203272_s_at 204491_at 217127_at 202208_s_at 200087_s_at 200611_s_at 210312_s_at 204294_at 222356_at 203156_at 65133_i_at 212120_at 212527_at 205201_at 218503_at 210632_s_at 207181_s_at 203339_at 218321_x_at 205478_at 203246_s_at 210915_x_at 202300_at 217795_s_at 200942_s_at 218723_s_at 204391_x_at 218902_at 213245_at 212878_s_at 203133_at 209312_x_at 212219_at 214085_x_at 213720_s_at 215306_at 201066_at 200905_x_at 205244_s_at 221898_at 205355_at 212197_x_at 212340_at 213519_s_at 218732_at 214894_x_at 221511_x_at 202908_at 208959_s_at 215543_s_at 212165_at 202305_s_at 218448_at 208634_s_at 218357_s_at 204803_s_at 218816_at 205857_at 202710_at 212353_at 220925_at 203889_at 201630_s_at 218152_at 202138_x_at 55081_at 213843_x_at 214771_x_at 221620_s_at 214608_s_at 211708_s_at 208760_at 216958_s_at 202931_x_at 217284_x_at 208502_s_at 219041_s_at 204730_at 211177_s_at 201743_at 217824_at 219304_s_at 203581_at 201120_s_at 201011_at 219024_at 201463_s_at 200985_s_at 201830_s_at 203028_s_at 209545_s_at 200816_s_at 219819_s_at 213316_at 218857_s_at 219985_at 219913_s_at 212549_at 205980_s_at 33323_r_at 204466_s_at 218196_at 206724_at 213348_at 207721_x_at 207966_s_at 208801_at 209645_s_at 210186_s_at 217226_s_at 218010_x_at 217997_at 201772_at 208633_s_at 218016_s_at 212561_at 221588_x_at 202878_s_at 215280_s_at 211998_at 209776_s_at 210202_s_at 39817_s_at 219534_x_at 201653_at 203233_at 202119_s_at 201648_at 213379_at 208615_s_at 212751_at 213309_at 212246_at 205782_at 200873_s_at 202821_s_at 218112_at 201752_s_at 202737_s_at 203264_s_at 214240_at 208835_s_at 203827_at 212071_s_at 202666_s_at 206710_s_at 205750_at 213182_x_at 212563_at 203639_s_at 205294_at 211990_at 218969_at 202422_s_at 201268_at 211974_x_at 202299_s_at 203068_at 212053_at 219221_at 201819_at 205898_at 208264_s_at 203964_at 214542_x_at 205577_at 219125_s_at 215706_x_at 203605_at 218376_s_at 202502_at 205348_s_at 213116_at 208146_s_at 210859_x_at 221816_s_at 203918_at 205882_x_at 221786_at 222158_s_at 202195_s_at 58916_at 205613_at 218823_s_at 217870_s_at 208848_at 204333_s_at 202156_s_at 208702_x_at 202180_s_at 219342_at 218804_at 212406_s_at 212604_at 200961_at 212923_s_at 209998_at 201859_at 201597_at 213901_x_at 205709_s_at 213075_at 214140_at 218656_s_at 213836_s_at 203017_s_at 201619_at 205961_s_at 209864_at 209374_s_at 203544_s_at 204993_at 201947_s_at 205933_at 203177_x_at 213620_s_at 203360_s_at 212510_at 201523_x_at 209379_s_at 218046_s_at 209086_x_at 213132_s_at 215146_s_at 201733_at 201869_s_at 206307_s_at 219228_at 220945_x_at 209786_at 203024_s_at 212253_x_at 208764_s_at 202432_at 219283_at 221676_s_at 208843_s_at 202341_s_at 213166_x_at 212681_at 208639_x_at 201958_s_at 200910_at 201137_s_at 218174_s_at 215333_x_at 208638_at 202242_at 201549_x_at 204655_at 209921_at 201037_at 208654_s_at 214721_x_at 201410_at 205011_at 220721_at 211991_s_at 204426_at 203695_s_at 205486_at 209298_s_at 208826_x_at 212350_at 201216_at 209787_s_at 210627_s_at 201559_s_at 213059_at 221884_at 202983_at 201995_at 214779_s_at 203685_at 209175_at 219936_s_at 213017_at 202008_s_at 212767_at 215193_x_at 203997_at 201968_s_at 218375_at 204759_at 219787_s_at 212430_at 203880_at 209846_s_at 210136_at 221870_at 211971_s_at 204640_s_at 205807_s_at 214121_x_at 213152_s_at 203178_at 203415_at 213547_at 201622_at 221666_s_at 201096_s_at 203813_s_at 203379_at 209568_s_at 214472_at 218675_at 218681_s_at 203604_at 209872_s_at 211986_at 201359_at 201566_x_at 201972_at 203619_s_at 218647_s_at 211026_s_at 218001_at 204028_s_at 204123_at 205624_at 218944_at 209691_s_at 208951_at 213135_at 212311_at 204140_at 209036_s_at 204735_at 201486_at 206453_s_at 200967_at 202132_at 209593_s_at 209612_s_at 205938_at 213015_at 214895_s_at 209197_at 212109_at 204049_s_at 215125_s_at 213306_at 208886_at AFFX- 202207_at 221531_at HSAC07/X00351_M_at 205622_at 213714_at 200699_at 219737_s_at 221041_s_at 208767_s_at 220584_at 37408_at 220342_x_at 202401_s_at 215923_s_at 213154_s_at 213491_x_at 201604_s_at 201659_s_at 213364_s_at 217551_at 218486_at 208074_s_at 206355_at 206103_at 212414_s_at 213119_at 201858_s_at 205875_s_at 221016_s_at 217868_s_at 203590_at 212175_s_at 201153_s_at 202233_s_at 205262_at 203148_s_at 220233_at 210087_s_at 202947_s_at 203123_s_at 202946_s_at 219036_at 212328_at 209576_at 209082_s_at 218633_x_at 204021_s_at 218073_s_at 215870_s_at 202558_s_at 200839_s_at 214096_s_at 203868_s_at 208716_s_at 203939_at 201524_x_at 222146_s_at 202712_s_at 216235_s_at 208918_s_at 203325_s_at 214214_s_at 214055_x_at 203207_s_at 205022_s_at 201091_s_at 212143_s_at 218928_s_at 221502_at 213996_at 208723_at 221827_at 202950_at 221984_s_at 204863_s_at 218272_at 202644_s_at 214855_s_at 205120_s_at 53968_at 202411_at 203582_s_at 218204_s_at 220761_s_at 205168_at 214710_s_at 213290_at 209227_at 213228_at 200804_at 212382_at 201358_s_at 201655_s_at 209007_s_at 221246_x_at 213857_s_at 207741_x_at 219061_s_at 202724_s_at 209482_at 222101_s_at 218283_at 221718_s_at 204949_at 204802_at 216338_s_at 201719_s_at 219200_at 214439_x_at 200846_s_at 212268_at 205698_s_at 218683_at 210739_x_at 209473_at 201722_s_at 209584_x_at 210296_s_at 201744_s_at 208722_s_at 205127_at 202308_at 203140_at 204039_at 210896_s_at 202425_x_at 213656_s_at 203235_at 209737_at 212688_at 203232_s_at 217927_at 211538_s_at 203721_s_at 200653_s_at 204427_s_at 219902_at 219603_s_at 204304_s_at 218039_at 209199_s_at 201115_at 203687_at 201698_s_at 205109_s_at 203139_at 212566_at 208796_s_at 200838_at 206827_s_at 201666_at 202832_at 91703_at 222155_s_at 212086_x_at 218680_x_at 212387_at 214857_at 218864_at 201736_s_at 203231_s_at 221542_s_at 205265_s_at 205293_x_at 203510_at 208787_at 204497_at 217908_s_at 222288_at 220638_s_at 213262_at 202838_at 201152_s_at 205073_at 209318_x_at 218984_at 216215_s_at 205107_s_at 201310_s_at 216064_s_at 205752_s_at 65517_at 218574_s_at 206790_s_at 221796_at 209608_s_at 215707_s_at 210946_at 212488_at 211034_s_at 201621_at 201961_s_at 205548_s_at 213129_s_at 212757_s_at 215438_x_at 212099_at 217900_at 204550_x_at 210962_s_at 205578_at 218268_at 207191_s_at 218792_s_at 201009_s_at 205019_s_at 203725_at 201520_s_at 201234_at 219762_s_at 213891_s_at 202996_at 206481_s_at 213995_at 210198_s_at 218192_at 218051_s_at 202606_s_at 33760_at 218241_at 218711_s_at 202793_at 204929_s_at 204922_at 205620_at 200889_s_at 212148_at 203484_at 202074_s_at 202603_at 220751_s_at 202346_at 212276_at 216074_x_at 201149_s_at 209300_s_at 210036_s_at 219335_at 205792_at 218972_at 204271_s_at 202543_s_at 222303_at 201264_at 213069_at 204301_at 209406_at 200968_s_at 209121_x_at 213050_at 213401_s_at 211416_x_at 209613_s_at 220189_s_at 202587_s_at 212322_at 204518_s_at 221648_s_at 203884_s_at 209064_x_at 207002_s_at 201078_at 210276_s_at 204392_at 213381_at 218291_at 209242_at 212305_s_at 211002_s_at 211936_at 221671_x_at 217964_at 201482_at 202064_s_at 209270_at 204927_at 209959_at 203201_at 212489_at 202918_s_at 201868_s_at 205876_at 210751_s_at 209218_at 45297_at 200820_at 202898_at 210816_s_at 204517_at 211404_s_at 201508_at 209150_s_at 210105_s_at 218500_at 201425_at 209662_at 202762_at 201098_at 204058_at 218439_s_at 216331_at 221941_at 203002_at 203971_at 213982_s_at 212496_s_at 219506_at 212536_at 209447_at 202418_at 202609_at 213234_at 212690_at 208653_s_at 218236_s_at 201892_s_at 201368_at 205593_s_at 203753_at 218275_at 212817_at 220094_s_at 205251_at 218981_at 214767_s_at 204175_at 201865_x_at 214005_at 213134_x_at 220741_s_at 204149_s_at 203102_s_at 202796_at 203225_s_at 203256_at 208802_at 212386_at 219848_s_at 205381_at 210886_x_at 216887_s_at 203008_x_at 215382_x_at 218206_x_at 203411_s_at 217790_s_at 205743_at 218888_s_at 201151_s_at 202096_s_at 201286_at 213301_x_at 209090_s_at 201568_at 221773_at 210024_s_at 209305_s_at 201005_at 208963_x_at 200806_s_at 212793_at 205812_s_at 206117_at 214522_x_at 210145_at 209873_s_at 216264_s_at 200929_at 216565_x_at 209265_s_at 201312_s_at 213308_at 221651_x_at 213410_at 203607_at 201953_at 204205_at 221882_s_at 215127_s_at 200803_s_at 203886_s_at 219048_at 221900_at 202655_at 37005_at 218826_at 201599_at 218326_s_at 205383_s_at 201790_s_at 201536_at 205164_at 201148_s_at 218704_at 207761_s_at 206557_at 201387_s_at 218701_at 1598_g_at 205594_at 206104_at 219217_at 212239_at 208840_s_at 204422_s_at 216305_s_at 221045_s_at 202194_at
210613_s_at 204386_s_at 209264_s_at 214307_at 201012_at 203775_at 212646_at 214281_s_at 212463_at 202395_at 212669_at 204608_at 219829_at 200048_s_at 218678_at 208910_s_at 205364_at 203165_s_at 218934_s_at 200599_s_at 221766_s_at 218532_s_at 202917_s_at 204127_at 203585_at 220942_x_at 215388_s_at 202211_at 202720_at 210243_s_at 202228_s_at 210241_s_at 203066_at 210907_s_at 202465_at 202660_at 208430_s_at 219065_s_at 204115_at 212623_at 204059_s_at 221586_s_at 214464_at 212410_at AFFX- 212805_at 205077_s_at HSAC07/X00351_5_at 211747_s_at 218421_at 205538_at 215464_s_at 211754_s_at 202157_s_at 201219_at 208965_s_at 201339_s_at 202388_at 218883_s_at 201185_at 214875_x_at 201008_s_at 205160_at 212195_at 218213_s_at 210471_s_at 206299_at 201272_at 213365_at 213993_at 201401_s_at 213158_at 204967_at 209135_at 218328_at 218502_s_at 202406_s_at 210072_at 217871_s_at 209287_s_at 221688_s_at 201867_s_at 204332_s_at 210517_s_at 201943_s_at 204037_at 213600_at 206359_at 211497_x_at 58780_s_at 204331_s_at 221276_s_at 212741_at 212240_s_at 218003_s_at 206022_at 209250_at 212358_at 203431_s_at 219647_at 213399_x_at 212845_at 217986_s_at 201289_at 218989_x_at 211962_s_at 209759_s_at 212535_at 202296_s_at 203810_at 204160_s_at 204114_at 212307_s_at 204455_at 202960_s_at 211984_at 212116_at 219427_at 204142_at 204755_x_at 200636_s_at 212203_x_at 213518_at 219505_at 201284_s_at 201329_s_at 206429_at 209604_s_at 219920_s_at 209200_at 212685_s_at 209883_at 64486_at 212354_at 218676_s_at 213004_at 208872_s_at 202766_s_at 208612_at 204621_s_at 215227_x_at 212077_at 211574_s_at 209505_at 214358_at 201389_at 218608_at 203636_at 201135_at 203688_at 212064_x_at 213110_s_at 219076_s_at 218435_at 201955_at 221583_s_at 220625_s_at 214724_at 204233_s_at 217023_x_at 221920_s_at 206932_at 206351_s_at 201602_s_at 208689_s_at 214077_x_at 200052_s_at 202086_at 200863_s_at 201315_x_at 212749_s_at 204688_at 202857_at 57588_at 209326_at 212151_at 217645_at 213274_s_at 202279_at 212554_at 205937_at 200808_s_at 218145_at 202759_s_at 212279_at 201109_s_at 200895_s_at 202794_at 221637_s_at 207547_s_at 201004_at 211564_s_at 209796_s_at 202728_s_at 218049_s_at 203570_at 201962_s_at 213016_at 201941_at 201850_at 202785_at 204072_s_at 211899_s_at 203088_at 201976_s_at 217890_s_at 218027_at 209047_at 218962_s_at 212526_at 221739_at 212274_at 217755_at 206211_at 217483_at 203254_s_at 203524_s_at 200904_at 220753_s_at 205303_at 218961_s_at 209293_x_at 208950_s_at 206874_s_at 50400_at 212501_at 207655_s_at 212587_s_at 219362_at 205304_s_at 200807_s_at 212190_at 213988_s_at 216733_s_at 212922_s_at 204777_s_at 217962_at 209897_s_at 221823_at 212242_at 218194_at 203620_s_at 213713_s_at 206701_x_at 200652_at 203637_s_at 212314_at 213974_at 218557_at 209470_s_at 208309_s_at 202686_s_at 201791_s_at 204990_s_at 219133_at 218298_s_at 210018_x_at 219179_at 213501_at 217996_at 217800_s_at 213438_at 209149_s_at 212344_at 204905_s_at 218499_at 204238_s_at 210084_x_at 220642_x_at 213275_x_at 213280_at 211323_s_at 214315_x_at 201060_x_at 215471_s_at 221755_at 204168_at 201565_s_at 203116_s_at 204749_at 217956_s_at 203295_s_at 209357_at 202071_at 213441_x_at 201069_at 218592_s_at 205051_s_at 222262_s_at 203921_at 215696_s_at 204418_x_at 220892_s_at 208816_x_at 204404_at 204099_at 201890_at 202554_s_at 218261_at 209663_s_at 218996_at 211981_at 208583_x_at 218854_at 202836_s_at 221814_at 212186_at 208944_at 209224_s_at 201601_x_at 203641_s_at 211671_s_at 218923_at 214022_s_at 210541_s_at 201136_at 91816_f_at 209285_s_at 206352_s_at 214071_at 200825_s_at 202760_s_at 202721_s_at 205683_x_at 200093_s_at 209101_at 218546_at 210095_s_at 219166_at 212886_at 222216_s_at 205433_at 218789_s_at 219440_at 218652_s_at 212624_s_at 217825_s_at 203640_at 219301_s_at 204687_at 205757_at 209656_s_at 209164_s_at 213411_at 203517_at 206377_at 209694_at 218223_s_at 207809_s_at 203632_s_at 221345_at 212677_s_at 212570_at 209154_at 202778_s_at 208636_at 203224_at 201560_at 217803_at 204352_at 202961_s_at 201426_s_at 201912_s_at 201328_at 219115_s_at 213675_at 211075_s_at 213010_at 200044_at 211577_s_at 202540_s_at 207134_x_at 220080_at 217764_s_at 217851_s_at 218330_s_at 222118_at 202664_at 214274_s_at 211160_x_at 203629_s_at 210764_s_at 208398_s_at 213005_s_at 201940_at 202551_s_at 214097_at 65718_at 207414_s_at 213001_at 219038_at 204223_at 205768_s_at 218901_at 218605_at 212419_at 221590_s_at 212104_s_at 209502_s_at 202732_at 203931_s_at 208228_s_at 219276_x_at 219922_s_at 216251_s_at 209583_s_at 214157_at 201603_at 218387_s_at 209469_at 222125_s_at 201243_s_at 220980_s_at 217762_s_at 202889_x_at 211535_s_at 203557_s_at 202729_s_at 218865_at 205802_at 208841_s_at 218285_s_at 217758_s_at 216474_x_at 219551_at 212764_at 210371_s_at 201170_s_at 209147_s_at 221760_at 203228_at 212675_s_at 218458_at 219064_at 201543_s_at 214696_at 212202_s_at 216321_s_at 211498_s_at 204430_s_at 207949_s_at 204754_at 211778_s_at 209205_s_at 201579_at 221584_s_at 203594_at 222108_at 200894_s_at 209466_x_at 212474_at 37996_s_at 202939_at 204424_s_at 214437_s_at 208370_s_at 206656_s_at 204748_at 203663_s_at 214266_s_at 200852_x_at 212647_at 212652_s_at 221127_s_at 200947_s_at 202719_s_at 218434_s_at 209016_s_at 209665_at 211985_s_at 211715_s_at 201841_s_at 202941_at 212423_at 203115_at 208949_s_at 209605_at 209436_at 201647_s_at 201369_s_at 211733_x_at 204268_at 202718_at 209655_s_at 212347_x_at 208690_s_at 212204_at 203603_s_at 213244_at 217763_s_at 211417_x_at 205803_s_at 221428_s_at 204971_at 217168_s_at 206433_s_at 209108_at 219410_at 212989_at 212914_at 201825_s_at 212993_at 209228_x_at 203748_x_at 203545_at 206580_s_at 221245_s_at 218824_at 203616_at 204472_at 203124_s_at 205608_s_at 201116_s_at 201430_s_at 210996_s_at 201313_at 220226_at 211562_s_at 201760_s_at 202075_s_at 200654_at 204163_at 209919_x_at 204396_s_at 205925_s_at 202133_at 213812_s_at 209465_x_at 218720_x_at 201215_at 205155_s_at 213924_at 217894_at 218094_s_at 205420_at 207935_s_at 217942_at 204753_s_at 207131_x_at 218162_at 212160_at 204442_x_at 202843_at 213194_at 218654_s_at 203680_at 210547_x_at 205952_at 211297_s_at 213400_s_at 211576_s_at 206391_at 202599_s_at 202403_s_at 217919_s_at 218518_at 217761_at 217437_s_at 201761_at 211965_at 218966_at 209868_s_at 220547_s_at 214104_at 202178_at 210096_at 221923_s_at 205200_at 214109_at 213524_s_at 212694_s_at 209621_s_at 218140_x_at 202949_s_at 201661_s_at 208962_s_at 203630_s_at 205934_at 208523_x_at 209821_at 200698_at 212509_s_at 209905_at 212713_at 201127_s_at 201030_x_at 218388_at 212736_at 212916_at 200696_s_at 203009_at 202822_at 205074_at 202177_at 209109_s_at 212848_s_at 207606_s_at 209542_x_at 203765_at 207266_x_at 214919_s_at 208029_s_at 209917_s_at 201300_s_at 202183_s_at 212288_at 209916_at 204855_at 217043_s_at 204940_at 208783_s_at 212135_s_at 211048_s_at 210427_x_at 207260_at 212667_at 207981_s_at 201893_x_at 207980_s_at 205573_s_at 218582_at 205083_at 212680_x_at 209337_at 214243_s_at 206392_s_at 220030_at 200911_s_at 205003_at 204793_at 219649_at 206631_at 213900_at 213800_at 204170_s_at 213572_s_at 203215_s_at 207016_s_at 217826_s_at 201792_at 218423_x_at 210986_s_at 209302_at 212551_at 217749_at 208637_x_at 203387_s_at 219654_at 214308_s_at 211864_s_at 209836_x_at 200878_at 212816_s_at 200795_at 202016_at 211980_at 215794_x_at 202393_s_at 221610_s_at 205229_s_at 221782_at 211737_x_at 202539_s_at 219935_at 218931_at 204938_s_at 203966_s_at 823_at 201197_at 219090_at 211935_at 202073_at 201691_s_at 201617_x_at 202109_at 204602_at 201900_s_at 214039_s_at 209600_s_at 213258_at 203011_at 220532_s_at 201013_s_at 220765_s_at 220816_at 203370_s_at 220187_at 209550_at 222140_s_at 209863_s_at 213143_at 214761_at 200946_x_at 215813_s_at 218218_at 212361_s_at 204026_s_at 201798_s_at 204567_s_at 212091_s_at 218465_at 200824_at 205309_at 201462_at 208284_x_at 211966_at 201735_s_at 210987_x_at 203138_at 204359_at 206170_at 211813_x_at 221754_s_at 211964_at 201704_at 205128_x_at 200903_s_at 200600_at 220606_s_at 207836_s_at 204143_s_at 213338_at 221788_at 203705_s_at 211494_s_at 201616_s_at 205833_s_at 204030_s_at 218924_s_at 200982_s_at 202061_s_at 214265_at 207431_s_at 201061_s_at 204957_at 213503_x_at 202871_at 206434_at 209113_s_at 209356_x_at 206385_s_at 207826_s_at 205042_at 201590_x_at 203130_s_at 204345_at 203593_at 203638_s_at 221027_s_at 202920_at 216483_s_at 213156_at 201734_at 213293_s_at 212692_s_at 204412_s_at 219395_at 206332_s_at 214446_at 202504_at 205078_at 203710_at 204121_at 212887_at 213423_x_at 218974_at 206069_s_at 216598_s_at 219152_at 200974_at 212573_at 211343_s_at 213943_at 205384_at 212899_at 203892_at 219121_s_at 203571_s_at 202363_at 219747_at 207362_at 210078_s_at 207824_s_at 209118_s_at 209772_s_at 202350_s_at 219933_at 218694_at 207549_x_at 206070_s_at 218556_at 211340_s_at 201660_at 208789_at 202929_s_at 209087_x_at 205316_at 218963_s_at 219555_s_at 204963_at 212282_at 207961_x_at 221927_s_at 209191_at 218531_at 207957_s_at 213148_at 209129_at 200681_at 200930_s_at 202503_s_at 204964_s_at 205566_at 204041_at 209625_at 217767_at 203164_at 221935_s_at 210108_at 213564_x_at 202023_at 202994_s_at 209504_s_at 221872_at 207275_s_at 209488_s_at 222315_at 203562_at 201130_s_at 218224_at 218979_at 209685_s_at 217823_s_at 204731_at 201577_at 219250_s_at 221781_s_at 203498_at 215407_s_at 204036_at 37117_at 203881_s_at 205133_s_at 211126_s_at 205942_s_at 201147_s_at 209367_at 201438_at 215380_s_at 213994_s_at 200970_s_at 214212_x_at 219518_s_at 206938_at 202605_at 213568_at 200971_s_at 205609_at 63825_at 201631_s_at 221874_at 201645_at 205505_at 202440_s_at 212978_at 209496_at 218025_s_at 212977_at 210720_s_at 212067_s_at 206110_at 221541_at 218188_s_at 204364_s_at 204942_s_at 200923_at 201724_s_at 212236_x_at 217111_at 220595_at 208737_at 212813_at 203219_s_at 204284_at 218909_at 218380_at 204019_s_at 208747_s_at 209531_at 212230_at 212295_s_at 203131_at 201417_at 218418_s_at 209855_s_at 201242_s_at 202893_at 205132_at 221024_s_at 204463_s_at 218086_at 200931_s_at 221865_at 204464_s_at 51158_at 209427_at 203386_at 201843_s_at 219411_at 204288_s_at 210719_s_at 202748_at 218258_at 218730_s_at 221880_s_at 202018_s_at 201583_s_at 218980_at 220432_s_at 208966_x_at 209825_s_at 213371_at 202546_at 209209_s_at 222121_at 203706_s_at 211423_s_at 200897_s_at 204388_s_at 205856_at 217736_s_at 209487_at 219850_s_at 221748_s_at 207098_s_at 210869_s_at 204389_at 200907_s_at 200606_at 211896_s_at 215108_x_at 222162_s_at 219388_at 219295_s_at 201196_s_at 209286_at 213085_s_at 209335_at 209478_at 204955_at 200078_s_at 211663_x_at 214733_s_at 212843_at 206860_s_at 202566_s_at 205769_at 205157_s_at 202668_at 204570_at 209030_s_at 204069_at 218248_at 209074_s_at 201014_s_at 200953_s_at 219584_at 201348_at 202005_at 203851_at 211559_s_at 201957_at 206068_s_at 205725_at 206303_s_at 202202_s_at 203029_s_at 212226_s_at 205248_at 213428_s_at 203430_at 208131_s_at 217776_at 201497_x_at 219015_s_at 200621_at 201963_at 213992_at 200700_s_at 211748_x_at 202769_at 218611_at 212181_s_at 207977_s_at 213325_at 212254_s_at 205102_at 207876_s_at 209585_s_at 209948_at 204319_s_at 206116_s_at 208580_x_at
217757_at 200670_at 204273_at 202790_at 204457_s_at 266_s_at 201787_at 204141_at 221505_at 210787_s_at 209651_at 218696_at 201540_at 206770_s_at 204931_at 209514_s_at 200986_at 214106_s_at 202283_at 210480_s_at 200906_s_at 203042_at 209687_at 212744_at 203729_at 210715_s_at 201842_s_at 209934_s_at 218718_at 212448_at 201431_s_at 215432_at 214091_s_at 212115_at 209156_s_at 202428_x_at 202196_s_at 87100_at 202269_x_at 217014_s_at 204400_at 200656_s_at 202007_at 209693_at 201105_at 213892_s_at 219167_at 211596_s_at 209288_s_at 208658_at 201150_s_at 222258_s_at 214505_s_at 203030_s_at 202565_s_at 204394_at 200762_at 220014_at 209616_s_at 208788_at 212136_at 217912_at 214247_s_at 213288_at 203423_at 210293_s_at 209283_at 209031_at 201641_at 211724_x_at 212187_x_at 221589_s_at 213093_at 202148_s_at 217728_at 213712_at 202995_s_at 221019_s_at 201539_s_at 201951_at 204939_s_at 212183_at 210298_x_at 203180_at 204894_s_at 201193_at 205547_s_at 208190_s_at 215016_x_at 201582_at 207030_s_at 203642_s_at 210139_s_at 208527_x_at 209167_at 218211_s_at 219685_at 202770_s_at 209291_at 202826_at 201495_x_at 210951_x_at 213068_at 208180_s_at 203065_s_at 212745_s_at 209351_at 219017_at 205549_at 207843_x_at 209170_s_at 219405_at 203324_s_at 217775_s_at 202222_s_at 205645_at 219478_at 40093_at 202992_at 203717_at 209210_s_at 212252_at 213746_s_at 201079_at 203323_at 204776_at 208791_at 209389_x_at 212768_s_at 210738_s_at 208792_s_at 210041_s_at 204135_at 222067_x_at 205564_at 202688_at 213071_at 201848_s_at 204734_at 210652_s_at 202274_at 205221_at 201058_s_at 203946_s_at 209540_at 209366_x_at 205382_s_at 202088_at 209355_s_at 219266_at 205242_at 202457_s_at 33767_at 210337_s_at 201496_x_at 200832_s_at 201615_x_at 201131_s_at 202722_s_at 209541_at 202786_at 209706_at 212724_at 208546_x_at 204583_x_at 213139_at 202740_at 220933_s_at 212233_at 220926_s_at 214404_x_at 203903_s_at 211070_x_at 213246_at 207480_s_at 213920_at 222209_s_at 208790_s_at 209094_at 200969_at 210299_s_at 220380_at 213285_at 221747_at 215779_s_at 202429_s_at 205935_at 202708_s_at 210387_at 201820_at 213106_at 203911_at 209292_at 200790_at 217875_s_at 212992_at 209911_x_at 221802_s_at 202409_at 208490_x_at 201128_s_at 203766_s_at 204751_x_at 219118_at 203186_s_at 212310_at 219667_s_at 212730_at 203041_s_at 210130_s_at 212097_at 216623_x_at 203739_at 217897_at 214329_x_at 204231_s_at 203951_at 212281_s_at 215726_s_at 200859_x_at 210317_s_at 205052_at 222043_at 217850_at 214765_s_at 221667_s_at 218922_s_at 201849_at 211276_at 213555_at 209460_at 201667_at 201413_at 222277_at 214752_x_at 217752_s_at 213587_s_at 212865_s_at 210222_s_at 210377_at 218087_s_at 204582_s_at 213622_at 203296_s_at 221561_at 222075_s_at 208937_s_at 202286_s_at 202525_at 214027_x_at 74694_s_at 204485_s_at 202555_s_at 209806_at 212543_at 207390_s_at 209163_at 220116_at 209763_at 212255_s_at 214774_x_at 204083_s_at 205924_at 203304_at 208650_s_at 218035_s_at 203644_s_at 201596_x_at 217901_at 205597_at 214463_x_at 209844_at 219127_at 217973_at 201562_s_at 209459_s_at 219117_s_at 202427_s_at 218254_s_at 214290_s_at 221582_at 214469_at 209696_at 219312_s_at 216905_s_at 209623_at 200935_at 219736_at 203485_at 211137_s_at 202687_s_at 46323_at 212640_at 219856_at 202089_s_at 218186_at 218189_s_at 206302_s_at 214651_s_at 212686_at 201952_at 203007_x_at 215017_s_at 202454_s_at 208837_at 206558_at 203857_s_at 202043_s_at 212812_at 214087_s_at 209935_at 205830_at 201662_s_at 209173_at 204973_at 205780_at 200644_at 218280_x_at 204305_at 204875_s_at 220161_s_at 209369_at 201923_at 202890_at 221732_at 205776_at 208579_x_at 212789_at 219806_s_at 221669_s_at 202489_s_at 218638_s_at 201563_at 217979_at 217080_s_at 36830_at 214455_at 218835_at 210328_at 203954_x_at 211478_s_at 210339_s_at 209340_at 203397_s_at 210788_s_at 220192_x_at 203716_s_at 209114_at 206214_at 209398_at 219476_at 212449_s_at 204667_at 211689_s_at 215071_s_at 203216_s_at 209854_s_at 206858_s_at 203917_at 212445_s_at 205862_at 201690_s_at 200862_at 212412_at 203474_at 203243_s_at 209624_s_at 211303_x_at 212218_s_at 204623_at 201688_s_at 215363_x_at 205542_at 205347_s_at 201839_s_at 219360_s_at 202345_s_at 203196_at 213506_at 203953_s_at 218313_s_at 205860_x_at 214598_at 216920_s_at 221424_s_at 215806_x_at 217487_x_at 221577_x_at 216804_s_at 211144_x_at 201689_s_at 209813_x_at 204934_s_at 209425_at 217771_at 209426_s_at 203908_at 209424_s_at 203242_s_at
TABLE-US-00007 TABLE 7A Tissue (tumor or stroma) specific genes used for prediction. Regular font: up-regulated genes. Italics: down-regulated genes. Tumor Specific Gene List 1 - genes used for tumor percentage prediction based on models developed by dataset 1. Tumor Specific Gene List 2 - genes used for tumor percentage prediction based on models developed by dataset 2. Stroma Specific Gene List 1 - genes used for stroma percentage prediction based on models developed by dataset 1. Stroma Specific Gene List 2 - genes used for stroma percentage prediction based on models developed by dataset 2. Tumor Specific Tumor Specific Stroma Specific Stroma Specific Gene List 1 Gene List 2 Gene List 1 Gene List 2 211194_s_at 201739_at 214460_at 202088_at 209854_s_at 202310_s_at 209854_s_at 201394_s_at 200931_s_at 200795_at 216062_at 33322_i_at 202525_at 209854_s_at 207169_x_at 211872_s_at 209706_at 201577_at 205780_at 212647_at 215240_at 205780_at 205645_at 217487_x_at 201131_s_at 204748_at 205780_at 203425_s_at 221788_at 214800_x_at 204742_s_at 201577_at 202404_s_at 202089_s_at 202404_s_at 204926_at 209706_at 200795_at 211194_s_at 219960_s_at 205042_at 200931_s_at 214800_x_at 201615_x_at 222043_at 202088_at 207169_x_at 205541_s_at 212984_at 202436_s_at 209854_s_at 203084_at 215775_at 209283_at 207956_x_at 204742_s_at 202088_at 201995_at 203698_s_at 202088_at 205645_at 209771_x_at 215350_at 201577_at 202089_s_at 201394_s_at 209771_x_at 202525_at 201839_s_at 214460_at 205834_s_at 209935_at 211834_s_at 221788_at 210930_s_at 212230_at 202089_s_at 201409_s_at 201555_at 33322_i_at 217487_x_at 201744_s_at 201215_at 211748_x_at 221788_at 215564_at 201555_at 33322_i_at 211964_at
TABLE-US-00008 TABLE 7B Tissue (tumor or stroma) specific genes identified from dataset 2 used for prediction. Tumor Tumor Stroma Stroma specific, up- specific, specific, up- specific, down regulated down-regulated regulated regulated SIM2 EXT1 TBXA2R STRA13 AMACR ANXA2 XLKD1 ZABC1 MKI67 TIMP2 DCC SIAT1 CRISP3 KIAA0172 SLIT3 ARFIP2 HOXC6 VCL FGF18 SLC39A6 RET_var1 MET STAC TUSC3 DNAH5 ILK GNAZ STEAP2 MELK TGFB2 NTRK3 CAMKK2 HPN_var1 STOM SYNE1 BNIP3 PCGEM1 MLCK DAT1 BDH GI_2094528 TGFBR3 MAL REPS2 TMSNB MEIS2 NGFB GDF15 MYBL2 KIP2 DF TMEPAI UBE2C PDLIM7 SIAT7D ATP2C1 FOLH1 PPAP2B NTN1 GI_22761402 DKFZp434C0931 IGF2 CES1 GI_4884218 F5 UB1 ZAKI-4 memD HPN_var2 CRYAB FGF2 tom1-like RAB3B CNN1 G6PD TNFSF10 HNF-3-alpha FZD7 EDNRB PRSS8 EZH2 KAI1 IFI27 MCCC2 ECT2 NBL1 GSTP1 TFAP2C CDC6 MMP2 GSTM4 ACPP NY-REN-41 SERPINF1 GAS1 DHCR24 GPR43 UNC5C ITGA5 MLP NETO2 CAV2 RRAS ERBB3 D-PCa-2_mRNA HNMP-1 BC008967 LIPH BIK GJA1 MMP2 PYCR1 GALNT3 TGFB3 ITGB3 NSP PTTG1 ITPR1 AKAP2 LOC129642 FBP1 GSTM3 LAMA4 CLUL1 rap1GAP CLU BCL2_beta TSPAN-1 GI_3360414 TU3A SOLH NKX3-1 KIAA0869 CAV1 UNC5C hAG-2/R MLP GSTM4 CAV1 hRVP1 TACSTD1 ZAKI-4 KIAK0002 CDH1 GI_10437016 TGFB2_cds CLU MOAT-B MCCC2 LTBP4 PLS3 SYT7 STEAP ITGB3 ITPR1 KLK4 LOC129642 BC008967 HNMP-1 STEAP GI_4884218 KIAK0002 COL4A2 NY-REN-41 ERBB3 GSTM5 FZD7 GI_3360414 KIAA0389 EDNRB GSTM5 GI_10437016 PYCR1 KIAA0003 LOC119587 FBP1 memD PTGS2 LTBP4 NETO2 GI_22761402 RRAS HGF BMPR1B LIM GAS1 CAV2 GPR43 GALNT1 G6PD TRAF5 TACSTD1 BMPR1B ALDH1A2 COL5A2 MYBL2 SLC43A1 FGF2 GJA1 GALNT3 MCM2 LSAMP TGFB2_cds KIAA0869 COBLL1 BCL2_beta KIAA0003 ESM1 REPS2 MAL KIP2 UBE2C NKX3-1 ITGA5 UB1 F5 NME1 FGFR2 GSTM3 D-PCa-2_var2 DKFZP564B167 FGF18 CRYAB GI_2094528 HSD17B4 SLIT3 ANTXR1 MELK TMEPAI TRIM29 CNN1 HOXC6 CAMKK2 SIAT7D TU3A SPDEF GDF15 GSTP1 IGF2 RET_var1 P1 GNAZ SERPINF1 rap1GAP PAICS XLKD1 PDLIM7 HPN_var2 NTRK3 PPAP2B BIK DF TGFBR3 MKI67 CES1 GI_2056367 HNF-3-alpha SYNE1 ANGPTL2 D-PCa-2_var1 NTN1 ILK D-PCa-2_mRNA SRD5A2 ITSN TRPM8 DCC COL1A1 DNAH5 STAC STOM CRISP3 TBXA2R VCL RAB3B CCK KAI1 AMACR CAPL HPN_var1 MLCK TMSNB KIAA0172 FOLH1 SPARCL1 PCGEM1 MMP14 DD3 TIMP2 SIM2 CALM1 MEIS2 EXT1
TABLE-US-00009 TABLE 8A Tissue (tumor or stroma) specific relapse related genes. Tumor Specific Relapse Related Genes Stroma Specific Relapse Related Genes U95 Probe U133 Probe U95 Probe U133 Probe Set ID Set ID Gene Symbol Set ID Set ID Gene Symbol 1019_g_at 206213_at WNT10B 1019_g_at 206213_at WNT10B 1042_at 206392_s_at RARRES1 1050_at 206426_at MLA 1052_s_at 203973_s_at CEBPD 1051_g_at 206426_at MLA 1078_at 206346_at PRLR 1052_s_at 203973_s_at CEBPD 1079_g_at 206346_at PRLR 1134_at 203839_s_at TNK2 1087_at 209962_at EPOR 1157_s_at 204191_at IFR1 1087_at 209963_s_at EPOR 1176_at 216261_at ITGB3 1158_s_at 200623_s_at CALM3 117_at 213418_at HSPA6 1162_g_at 203307_at GNL1 1206_at 204247_s_at CDK5 1206_at 204247_s_at CDK5 1229_at 205076_s_at MTMR11 1229_at 205076_s_at MTMR11 1278_at 202686_s_at AXL 54581_at 213900_at C9orf61 54581_at 213900_at C9orf61 54673_s_at 218221_at ARNT 1284_at 211084_x_at PRKD3 54690_at 210674_s_at 1318_at 217301_x_at RBBP4 1318_at 217301_x_at RBBP4 1337_s_at 211605_s_at RARA 1343_s_at 209720_s_at SERPINB3 1343_s_at 209720_s_at SERPINB3 1368_at 202948_at IL1R1 1368_at 202948_at IL1R1 1385_at 201506_at TGFBI 1385_at 201506_at TGFBI 1397_at 203652_at MAP3K11 1408_at 206783_at FGF4 1398_g_at 203652_at MAP3K11 1460_g_at 205171_at PTPN4 139_at 206490_at DLGAP1 1536_at 203967_at CDC6 1456_s_at 206332_s_at IFI16 1543_at 205699_at -- 1456_s_at 208966_x_at IFI16 1560_g_at 205962_at PAK2 1499_at 200090_at FNTA 1565_s_at 215075_s_at GRB2 1499_at 200090_at FNTA 1598_g_at 202177_at GAS6 1504_s_at 207501_s_at FGF12 1610_s_at 202533_s_at DHFR /// LOC643509 /// LOC653874 1507_s_at 204464_s_at EDNRA 1707_g_at 201895_at ARAF 1536_at 203967_at CDC6 1747_at 214992_s_at DSE2 1543_at 205699_at -- 1747_at 209831_x_at DSE2 1565_s_at 215075_s_at GRB2 1749_at 208369_s_at GCDH 1575_at 209993_at ABCB1 1749_at 203500_at GCDH 1576_g_at 209993_at ABCB1 1754_at 201763_s_at DAXX 1598_g_at 202177_at GAS6 1755_i_at 208367_x_at CYP3A4 160030_at 205498_at GHR 1786_at 206028_s_at MERTK 1610_s_at 202533_s_at DHFR /// 178_f_at 214473_x_at PMS2L3 LOC643509 /// LOC653874 1627_at 221715_at MYST3 1794_at 201700_at CCND3 1747_at 214992_s_at DSE2 1795_g_at 201700_at CCND3 1747_at 209831_x_at DSE2 1875_f_at 214473_x_at PMS2L3 1749_at 208369_s_at GCDH 190_at 209959_at NR4A3 1749_at 203500_at GCDH 1915_s_at 209189_at FOS 1750_at 216602_s_at FARSLA 1945_at 214710_s_at CCNB1 1754_at 201763_s_at DAXX 1951_at 205572_at ANGPT2 1761_at 205226_at PDGFRL 1951_at 211148_s_at ANGPT2 177_at 205203_at PLD1 1954_at 203934_at KDR 178_f_at 214756_x_at PMS2L1 2008_s_at 211832_s_at MDM2 178_f_at 216525_x_at PMS2L3 2039_s_at 210105_s_at FYN 178_f_at 214473_x_at PMS2L3 2080_s_at 207347_at ERCC6 1875_f_at 216525_x_at PMS2L3 222_at 201995_at EXT1 1875_f_at 214473_x_at PMS2L3 243_g_at 200836_s_at MAP4 1875_f_at 214756_x_at PMS2L1 266_s_at 216379_x_at CD24 1880_at 205386_s_at MDM2 266_s_at 209771_x_at CD24 1945_at 214710_s_at CCNB1 266_s_at 208651_x_at CD24 1954_at 203934_at KDR 284_at 207156_at HIST1H2AG 201_s_at 216231_s_at B2M 285_g_at 207156_at HIST1H2AG 2042_s_at 204798_at MYB 310_s_at 206401_s_at MAPT 2055_s_at 215878_at ITGB1 310_s_at 203928_x_at MAPT 2065_s_at 208478_s_at BAX 31343_at 216244_at IL1RN 2066_at 208478_s_at BAX 31464_at 216513_at DCT 2067_f_at 208478_s_at BAX 31465_g_at 216513_at DCT 242_at 200836_s_at MAP4 31478_at 207077_at ELA2B 243_g_at 200836_s_at MAP4 31478_at 206446_s_at ELA2A 262_at 201196_s_at AMD1 31506_s_at 205033_s_at DEFA1 /// DEFA3 /// LOC653600 263_g_at 201196_s_at AMD1 31523_f_at 208527_x_at HIST1H2BE 272_at 206326_at GRP 31524_f_at 208523_x_at HIST1H2BI 273_g_at 206326_at GRP 31574_i_at 216405_at LGALS1 307_at 204446_s_at ALOX5 31619_at 217126_at -- 310_s_at 206401_s_at MAPT 31621_s_at 216269_s_at ELN 310_s_at 203928_x_at MAPT 31631_f_at 214557_at PTTG2 31343_at 216244_at IL1RN 31663_at 211111_at -- 31382_f_at 211682_x_at UGT2B28 31723_at 207925_at CST5 31478_at 207077_at ELA2B 31815_r_at 204381_at LRP3 31478_at 206446_s_at ELA2A 31843_at 207981_s_at ESRRG 31479_f_at 216659_at LOC647294 /// 31854_at 211208_s_at CASK LOC652593 31506_s_at 205033_s_at DEFA1 /// DEFA3 31862_at 205990_s_at WNT5A /// LOC653600 31508_at 201010_s_at TXNIP 31889_at 206426_at MLA 31509_at 208929_x_at RPL13 31897_at 204135_at DOC1 31512_at 216207_x_at IGKV1D-13 /// 31941_s_at 207936_x_at RFPL3 LOC649876 31525_s_at 211745_x_at HBA1 31941_s_at 207227_x_at RFPL2 31525_s_at 204018_x_at HBA1 /// HBA2 32001_s_at 207414_s_at PCSK6 31525_s_at 209458_x_at HBA1 /// HBA2 32004_s_at 215329_s_at CDC2L1 /// CDC2L2 31525_s_at 211699_x_at HBA1 /// HBA2 32028_at 203201_at PMM2 31525_s_at 217414_x_at HBA1 /// HBA2 32033_at 204193_at CHKB /// CPT1B 31574_i_at 216405_at LGALS1 32045_at 213213_at DIDO1 31584_at 212869_x_at TPT1 32076_at 203498_at DSCR1L1 31600_s_at 214756_x_at PMS2L1 32138_at 215116_s_at DNM1 31619_at 217126_at -- 32146_s_at 214726_x_at ADD1 31631_f_at 214557_at PTTG2 32176_at 212707_s_at RASA4 /// FLJ21767 /// LOC648426 31663_at 211111_at -- 32177_s_at 208534_s_at RASA4 /// FLJ21767 31769_at 207612_at WNT8B 32263_at 202705_at CCNB2 31806_at 205666_at FMO1 32267_at 207236_at ZNF345 31815_r_at 204381_at LRP3 32313_at 204083_s_at TPM2 31835_at 206226_at HRG 32314_g_at 204083_s_at TPM2 31843_at 207981_s_at ESRRG 32338_at 216028_at DKFZP564C152 31879_at 212824_at FUBP3 32420_at 214655_at GPR6 31897_at 204135_at DOC1 32521_at 202037_s_at SFRP1 31941_s_at 207936_x_at RFPL3 32542_at 201540_at FHL1 31941_s_at 207227_x_at RFPL2 32543_at 200935_at CALR 32001_s_at 207414_s_at PCSK6 32543_at 212953_x_at CALR 32004_s_at 215329_s_at CDC2L1 /// 32556_at 218382_s_at U2AF2 CDC2L2 32028_at 203201_at PMM2 32571_at 200769_s_at MAT2A 32045_at 213213_at DIDO1 32622_at 202253_s_at DNM2 32076_at 203498_at DSCR1L1 32642_at 205143_at CSPG3 32104_i_at 212669_at CAMK2G 32649_at 205255_x_at TCF7 32138_at 215116_s_at DNM1 32668_at 203787_at SSBP2 32146_s_at 214726_x_at ADD1 32689_s_at 210831_s_at PTGER3 32176_at 212707_s_at RASA4 /// 32710_at 208213_s_at KCB1 FLJ21767 /// LOC648426 32222_at 212809_at NFATC2IP 32712_at 210016_at MYT1L 32267_at 207236_at ZNF345 32728_at 205257_s_at AMPH 32318_s_at 200801_x_at ACTB 32758_g_at 211318_s_at RAE1 32318_s_at 224594_x_at ACTB 32759_at 211318_s_at RAE1 32318_s_at 213867_x_at ACTB 32780_at 212254_s_at DST 32338_at 216028_at DKFZP564C152 32805_at 204151_x_at AKR1C1 32420_at 214655_at GPR6 32813_s_at 203163_at KATNB1 32435_at 200029_at RPL19 32826_at 209473_at -- 32435_at 200029_at RPL19 32885_f_at 207752_x_at PRB1 /// PRB2 32521_at 202037_s_at SFRP1 32885_f_at 211531_x_at PRB1 /// PRB2 32543_at 200935_at CALR 32885_f_at 210597_x_at PRB1 /// PRB2 32561_at 212523_s_at KIAA0146 32906_at 207254_at SLC15A1 32571_at 200769_s_at MAT2A 32935_at 214758_at WDR21A 32577_s_at 213951_s_at PSMC3IP 32971_at 213900_at C9orf61 32577_s_at 205956_x_at PSMC3IP 32980_f_at 208527_x_at HIST1H2BE 32622_at 202253_s_at DNM2 33015_at 215768_at SOX5 32642_at 205143_at CSPG3 33023_at 214481_at HIST1H2AM 32649_at 205255_x_at TCF7 33127_at 202998_s_at LOXL2 32676_at 221588_x_at ALDH6A1 33170_at 212911_at DJC16 32676_at 204290_s_at ALDH6A1 33215_g_at 204331_s_at MRPS12 32689_s_at 210831_s_at PTGER3 33282_at 203287_at LAD1 32710_at 208213_s_at KCB1 33329_at 206929_s_at NFIC 32712_at 210016_at MYT1L 33427_s_at 211852_s_at ATRN 32728_at 205257_s_at AMPH 33435_r_at 202710_at BET1 32775_r_at 202430_s_at PLSCR1 33460_at 207455_at P2RY1 32779_s_at 211323_s_at ITPR1 33520_at 207300_s_at F7 32793_at 213193_x_at TRBV19 /// 33527_at 207142_at KCNJ3 TRBC1 32794_g_at 213193_x_at TRBV19 /// 33533_at 203811_s_at DJB4 TRBC1 32813_s_at 203163_at KATNB1 33534_at 208394_x_at ESM1 32817_at 204541_at SEC14L2 33536_at 207505_at PRKG2 32860_g_at 200887_s_at STAT1 33540_at 216211_at C10orf18 32885_f_at 207752_x_at PRB1 /// PRB2 33572_at 206683_at ZNF165 32885_f_at 211531_x_at PRB1 /// PRB2 33620_at 208414_s_at HOXB3 32885_f_at 210597_x_at PRB1 /// PRB2 33641_g_at 215051_x_at AIF1 32971_at 213900_at C9orf61 33673_r_at 207245_at UGT2B17 33015_at 215768_at SOX5 33690_at 215322_at LONRF1 33092_at 214560_at FPRL2 33698_at 204251_s_at CEP164 33127_at 202998_s_at LOXL2 33700_at 204011_at SPRY2 33153_at 213952_s_at ALOX5 33722_at 212517_at ATRN 33166_at 213443_at TRADD 33729_at 204587_at SLC25A14 33207_at 221742_at CUGBP1 33729_at 211855_s_at SLC25A14 33215_g_at 204331_s_at MRPS12 33746_at 203013_at ECD 33243_at 208296_x_at TNFAIP8 33773_at 205408_at MLLT10 33329_at 206929_s_at NFIC 33804_at 203110_at PTK2B 33424_at 201011_at RPN1 33819_at 201030_x_at LDHB 33425_at 200990_at TRIM28 33819_at 213564_x_at LDHB 33435_r_at 202710_at BET1 33883_at 204400_at EFS 33505_at 206392_s_at RARRES1 33883_at 210880_s_at EFS 33515_at 207503_at TCP10 33884_s_at 215533_s_at UBE4B 33520_at 207300_s_at F7 33884_s_at 202316_x_at UBE4B 33527_at 207142_at KCNJ3 33892_at 207717_s_at PKP2 33533_at 203811_s_at DJB4 33920_at 209190_s_at DIAPH1 33534_at 208394_x_at ESM1 33936_at 204417_at GALC 33540_at 216211_at C10orf18 33938_g_at 215433_at DPY19L1 33546_at 213796_at SPRR1A 33991_g_at 211298_s_at ALB 33586_at 216006_at WIRE 33992_at 211298_s_at ALB 33601_at 215767_at C2orf10 34016_s_at 202805_s_at ABCC1 33613_at 215118_s_at IGHG1 34033_s_at 207857_at LILRA2 33620_at 208414_s_at HOXB3 34052_at 207346_at STX2 33633_at 214546_s_at P2RY11 34065_at 207676_at ONECUT2 33641_g_at 215051_x_at AIF1 34090_at 216065_at -- 33641_g_at 209901_x_at AIF1 34096_at 215170_s_at CEP152 33650_at 221780_s_at DDX27 34187_at 205228_at RBMS2 33673_r_at 207245_at UGT2B17 34191_at 212919_at DCP2 33690_at 215322_at LONRF1 34226_at 203553_s_at MAP4K5 33698_at 204251_s_at CEP164 34227_i_at 206007_at PRG4 33700_at 204011_at SPRY2 34228_r_at 206007_at PRG4 33722_at 212517_at ATRN 34243_i_at 210306_at L3MBTL 33729_at 204587_at SLC25A14 34288_at 212977_at CMKOR1 33729_at 211855_s_at SLC25A14 34312_at 212867_at -- 33746_at 203013_at ECD 34379_at 212087_s_at ERAL1 33758_f_at 206570_s_at PSG1 /// PSG4 /// 34385_at 202004_x_at SDHC /// PSG7 /// PSG11 LOC642502 /// PSG8 33766_at 205019_s_at VIPR1 34395_at 203026_at ZBTB5 33773_at 205408_at MLLT10 34476_r_at 205767_at EREG 33819_at 201030_x_at LDHB 34497_at 216941_s_at TAF1B 33819_at 213564_x_at LDHB 34594_at 204761_at USP6NL 33857_at 217830_s_at NSFL1C 34617_at 210614_at TTPA /// LOC649495 33861_at 217798_at CNOT2 34622_at 207814_at DEFA6 33883_at 204400_at EFS 34631_at 207327_at EYA4 33883_at 210880_s_at EFS 34647_at 200033_at DDX5 33884_s_at 215533_s_at UBE4B 34647_at 200033_at DDX5 33884_s_at 202316_x_at UBE4B 34699_at 203593_at CD2AP 33891_at 201560_at CLIC4 34724_at 202045_s_at GRLF1 33892_at 207717_s_at PKP2 34726_at 209530_at CACNB3 33920_at 209190_s_at DIAPH1 34735_at 214578_s_at LOC651633 33936_at 204417_at GALC 34735_at 213044_at LOC651633 33938_g_at 215433_at DPY19L1 34736_at 214710_s_at CCNB1 33991_g_at 211298_s_at ALB 34778_at 213909_at LRRC15 33992_at 211298_s_at ALB 34789_at 211474_s_at SERPINB6 34016_s_at 202805_s_at ABCC1 34820_at 209465_x_at PTN 34033_s_at 207857_at LILRA2 34902_at 215109_at KIAA0492 34065_at 207676_at ONECUT2 34959_at 206760_s_at FCER2 34090_at 216065_at -- 34959_at 206759_at FCER2 34096_at 215170_s_at CEP152 34964_at 214472_at HIST1H3D 34148_at 206634_at SIX3 34973_at 210192_at ATP8A1 34187_at 205228_at RBMS2 35005_at 205851_at NME6 34191_at 212919_at DCP2 35031_r_at 215052_at -- 34226_at 203553_s_at MAP4K5 35043_at 207347_at ERCC6 34243_i_at 210306_at L3MBTL 35048_at 206730_at GRIA3 34257_at 209737_at MAGI2 35049_g_at 206730_at GRIA3 34312_at 212867_at -- 35057_at 214775_at N4BP3 34364_at 202494_at PPIE 35074_at 206734_at JRKL 34379_at 212087_s_at ERAL1 35106_at 210642_at CCIN 34395_at 203026_at ZBTB5 35152_at 205326_at RAMP3 34470_at 206715_at TFEC 35203_at 212462_at -- 34476_r_at 205767_at EREG 35207_at 203453_at SCNN1A 34521_at 206249_at MAP3K13 35211_at 209632_at PPP2R3A 34594_at 204761_at USP6NL 35214_at 203343_at UGDH 34631_at 207327_at EYA4 35216_at 204663_at ME3 34644_at 216231_s_at B2M 35224_at 214696_at MGC14376 34647_at 200033_at DDX5 35249_at 205034_at CCNE2 34647_at 200033_at DDX5 35265_at 203172_at FXR2 34678_at 201798_s_at FER1L3 35302_at 208922_s_at NXF1 34718_at 203627_at IGF1R 35337_at 201178_at FBXO7 34724_at 202045_s_at GRLF1 35352_at 202986_at ARNT2 34726_at 209530_at CACNB3 35361_at 209018_s_at PINK1
34837_at 212480_at KIAA0376 35391_at 206616_s_at ADAM22 34894_r_at 205847_at PRSS22 35392_g_at 206616_s_at ADAM22 34902_at 215109_at KIAA0492 35394_at 214778_at MEGF8 34964_at 214472_at HIST1H3D 35469_at 207135_at HTR2A 34964_at 214522_x_at HIST1H3D 35472_at 210119_at KCNJ15 34973_at 210192_at ATP8A1 35549_at 210115_at RPL39L 35005_at 205851_at NME6 35576_f_at 208523_x_at HIST1H2BI 35069_at 208312_s_at PRAMEF1 /// 35588_at 205928_at ZNF443 PRAMEF2 35071_s_at 214106_s_at GMDS 35614_at 204849_at TCFL5 35074_at 206734_at JRKL 35650_at 212717_at PLEKHM1 35106_at 210642_at CCIN 35666_at 209730_at SEMA3F 35137_at 205610_at MYOM1 35677_at 213528_at C1orf156 35152_at 205326_at RAMP3 35683_at 203956_at MORC2 35203_at 212462_at -- 35683_at 216863_s_at MORC2 35205_at 202757_at COBRA1 35689_at 206183_s_at HERC3 35207_at 203453_at SCNN1A 35693_at 212552_at HPCAL1 35211_at 209632_at PPP2R3A 356_at 202183_s_at KIF22 35352_at 202986_at ARNT2 35744_at 201978_s_at KIAA0141 35361_at 209018_s_at PINK1 35755_at 210740_s_at ITPK1 35385_at 210820_x_at COQ7 35803_at 212724_at RND3 35394_at 214778_at MEGF8 35817_at 209072_at MBP 35472_at 210119_at KCNJ15 35859_f_at 214473_x_at PMS2L3 35549_at 210115_at RPL39L 35933_f_at 214473_x_at PMS2L3 35614_at 204849_at TCFL5 35938_at 210145_at PLA2G4A 35677_at 213528_at C1orf156 35988_i_at 221820_s_at MYST1 35698_at 203854_at CFI 35995_at 204026_s_at ZWINT 35744_at 201978_s_at KIAA0141 36004_at 209929_s_at IKBKG 35755_at 210740_s_at ITPK1 36037_g_at 208416_s_at SPTB 35859_f_at 214473_x_at PMS2L3 36043_at 214111_at OPCML 35859_f_at 216525_x_at PMS2L3 36057_at 203404_at ARMCX2 35907_at 204826_at CCNF 36059_at 212850_s_at LRP4 35926_s_at 213975_s_at LYZ /// LILRB1 36061_at 213169_at -- 35927_r_at 213975_s_at LYZ /// LILRB1 36066_at 212814_at KIAA0828 35933_f_at 216525_x_at PMS2L3 36067_at 210072_at CCL19 35933_f_at 214473_x_at PMS2L3 36087_at 203170_at KIAA0409 35954_at 206803_at PDYN 36103_at 205114_s_at CCL3 /// CCL3L1 /// CCL3L3 /// LOC643930 35988_i_at 221820_s_at MYST1 36139_at 215411_s_at TRAF3IP2 35995_at 204026_s_at ZWINT 36146_at 201365_at OAZ2 36004_at 209929_s_at IKBKG 36183_at 202676_x_at FASTK 36037_g_at 208416_s_at SPTB 36183_at 214114_x_at FASTK 36043_at 214111_at OPCML 36183_at 210975_x_at FASTK 36052_at 205268_s_at ADD2 36214_at 220266_s_at KLF4 36059_at 212850_s_at LRP4 36229_at 205707_at IL17RA 36061_at 213169_at -- 36272_r_at 206826_at PMP2 36066_at 212814_at KIAA0828 36347_f_at 208527_x_at HIST1H2BE 36067_at 210072_at CCL19 36374_at 215304_at -- 36079_at 210609_s_at TP53I3 36412_s_at 208436_s_at IRF7 36083_at 203227_s_at TSPAN31 36451_at 213198_at ACVR1B 36103_at 205114_s_at CCL3 /// CCL3L1 36452_at 202796_at SYNPO /// CCL3L3 /// LOC643930 36139_at 215411_s_at TRAF3IP2 36459_at 204161_s_at ENPP4 36144_at 209197_at SYT11 36577_at 209210_s_at PLEKHC1 36146_at 201365_at OAZ2 36607_at 202944_at GA 36151_at 201050_at PLD3 36658_at 200862_at DHCR24 36191_at 203177_x_at TFAM 36669_at 202768_at FOSB 36214_at 220266_s_at KLF4 36685_at 201197_at AMD1 36229_at 205707_at IL17RA 36711_at 205193_at MAFF 36256_at 214460_at LSAMP 36735_f_at 216907_x_at KIR3DL2 36272_r_at 206826_at PMP2 36739_at 205960_at PDK4 36318_at 206376_at SLC6A15 36746_s_at 207886_s_at CALCR 36326_at 215228_at NHLH2 36751_at 206107_at RGS11 36374_at 215304_at -- 36757_at 206110_at HIST1H3H 36412_s_at 208436_s_at IRF7 36782_s_at 202410_x_at IGF2 36451_at 213198_at ACVR1B 36782_s_at 210881_s_at IGF2 36452_at 202796_at SYNPO 36825_at 213293_s_at TRIM22 36459_at 204161_s_at ENPP4 36858_at 209567_at RRS1 36460_at 209317_at POLR1C 36861_at 209596_at MXRA5 36462_at 209516_at SMYD5 36915_at 203758_at CTSO 36551_at 213701_at C12orf29 36917_at 213519_s_at LAMA2 36600_at 200814_at PSME1 36917_at 216840_s_at LAMA2 36621_at 204551_s_at AHSG 36970_at 212056_at KIAA0182 36627_at 200795_at SPARCL1 37011_at 215051_x_at AIF1 36735_f_at 216907_x_at KIR3DL2 37013_at 209749_s_at ACE 36746_s_at 207886_s_at CALCR 37022_at 204223_at PRELP 36748_at 210315_at SYN2 37088_at 211107_s_at AURKC 36782_s_at 202410_x_at IGF2 37098_at 204788_s_at PPOX 36782_s_at 210881_s_at IGF2 37103_at 214068_at BEAN 36790_at 210987_x_at TPM1 37124_i_at 205765_at CYP3A5 36791_g_at 210987_x_at TPM1 37156_at 221911_at ETV1 36792_at 210986_s_at TPM1 37161_at 213750_at -- 36825_at 213293_s_at TRIM22 37162_at 204716_at CCDC6 36861_at 209596_at MXRA5 37163_at 213497_at ABTB2 36890_at 203407_at PPL 37164_at 210429_at RHD 36915_at 203758_at CTSO 37192_at 204505_s_at EPB49 36917_at 213519_s_at LAMA2 37205_at 213249_at FBXL7 36917_at 216840_s_at LAMA2 37260_at 208562_s_at ABCC9 36942_at 200851_s_at KIAA0174 37260_at 208561_at ABCC9 36970_at 212056_at KIAA0182 37264_at 214741_at ZNF131 37011_at 209901_x_at AIF1 37264_at 221842_s_at ZNF131 37011_at 215051_x_at AIF1 37281_at 202771_at FAM38A 37022_at 204223_at PRELP 37322_s_at 211549_s_at HPGD 37043_at 207826_s_at ID3 37353_g_at 202864_s_at SP100 37088_at 211107_s_at AURKC 37353_g_at 202863_at SP100 37098_at 204788_s_at PPOX 37356_r_at 201832_s_at VDP 37103_at 214068_at BEAN 37407_s_at 207961_x_at MYH11 37124_i_at 205765_at CYP3A5 37423_at 204404_at SLC12A2 37156_at 221911_at ETV1 37457_at 206408_at LRRTM2 37161_at 213750_at -- 37469_at 206316_s_at KNTC1 37162_at 204716_at CCDC6 37519_at 206743_s_at ASGR1 37163_at 213497_at ABTB2 37548_at 216239_at PTHB1 37189_at 203467_at PMM1 37549_g_at 216239_at PTHB1 37192_at 204505_s_at EPB49 37561_at 204108_at NFYA 37237_at 203410_at AP3M2 37565_at 203414_at MMD 37238_s_at 204267_x_at PKMYT1 37630_at 209763_at CHRDL1 37260_at 208562_s_at ABCC9 37635_at 213780_at TCHH 37260_at 208561_at ABCC9 37690_at 202993_at ILVBL 37264_at 214741_at ZNF131 37690_at 210624_s_at ILVBL 37264_at 221842_s_at ZNF131 37709_at 203974_at HDHD1A 37281_at 202771_at FAM38A 37721_at 207831_x_at DHPS 37322_s_at 211549_s_at HPGD 37722_s_at 207831_x_at DHPS 37335_at 203816_at DGUOK 37762_at 201324_at EMP1 37335_at 209549_s_at DGUOK 37762_at 201325_s_at EMP1 37347_at 201897_s_at CKS1B 37828_at 213694_at RSBN1 37356_r_at 201832_s_at VDP 37835_at 205987_at CD1C 37415_at 214070_s_at ATP10B 37874_at 205776_at FMO5 37423_at 204404_at SLC12A2 37919_at 204368_at SLCO2A1 37449_i_at 214548_x_at GS 37939_at 209584_x_at APOBEC3C 37449_i_at 200780_x_at GS 37960_at 203921_at CHST2 37449_i_at 212273_x_at GS 37963_at 204443_at ARSA 37449_i_at 200981_x_at GS 38004_at 214297_at CSPG4 37450_r_at 214548_x_at GS 38004_at 204736_s_at CSPG4 37450_r_at 200780_x_at GS 38044_at 209074_s_at FAM107A 37450_r_at 212273_x_at GS 38099_r_at 202422_s_at ACSL4 37450_r_at 200981_x_at GS 38139_at 205140_at FPGT 37458_at 204126_s_at CDC45L 38150_at 204956_at MTAP 37469_at 206316_s_at KNTC1 38153_at 204884_s_at HUS1 37498_at 214595_at KCNG1 38158_at 204817_at ESPL1 37548_at 216239_at PTHB1 38169_s_at 207626_s_at SLC7A2 37549_g_at 216239_at PTHB1 38181_at 203878_s_at MMP11 37565_at 203414_at MMD 38195_at 204525_at PHF14 37686_s_at 202330_s_at UNG 38249_at 215729_s_at VGLL1 37690_at 202993_at ILVBL 38256_s_at 213794_s_at C14orf120 37690_at 210624_s_at ILVBL 38257_at 203190_at NDUFS8 37709_at 203974_at HDHD1A 38257_at 203189_s_at NDUFS8 37721_at 211558_s_at DHPS 38262_at 213288_at -- 37722_s_at 211558_s_at DHPS 38277_at 209817_at PPP3CB 37762_at 201324_at EMP1 38281_at 207181_s_at CASP7 37762_at 201325_s_at EMP1 38323_at 208146_s_at CPVL 37765_at 203766_s_at LMOD1 38342_at 212660_at PHF15 37814_g_at 214968_at DDX51 38391_at 201850_at CAPG 37828_at 213694_at RSBN1 38394_at 212510_at GPD1L 37835_at 205987_at CD1C 38414_at 202870_s_at CDC20 37874_at 205776_at FMO5 38445_at 203055_s_at ARHGEF1 37887_at 210416_s_at CHEK2 38449_at 201886_at WDR23 37919_at 204368_at SLCO2A1 38453_at 204683_at ICAM2 37937_at 203866_at NLE1 38454_g_at 213620_s_at ICAM2 37939_at 209584_x_at APOBEC3C 38454_g_at 204683_at ICAM2 37969_at 205127_at PTGS1 38466_at 202450_s_at CTSK 37992_s_at 203926_x_at ATP5D 38477_at 202632_at DPH1 /// OVCA2 37993_at 203926_x_at ATP5D 38510_at 213817_at -- 38000_at 204476_s_at PC 38535_at 208216_at DLX4 38047_at 209487_at RBPMS 38546_at 205227_at IL1RAP 38052_at 203305_at F13A1 38574_at 213353_at ABCA5 38068_at 202203_s_at AMFR 38576_at 209911_x_at HIST1H2BD 38079_at 212294_at GNG12 38625_g_at 209402_s_at SLC12A4 38089_at 201377_at UBAP2L 38625_g_at 211112_at SLC12A4 38105_at 202302_s_at FLJ11021 38628_at 202182_at GCN5L2 38139_at 205140_at FPGT 38637_at 215446_s_at LOX 38150_at 204956_at MTAP 38666_at 202880_s_at PSCD1 38153_at 204884_s_at HUS1 38674_at 213233_s_at KLHL9 38169_s_at 207626_s_at SLC7A2 38721_at 209002_s_at CALCOCO1 38192_at 204576_s_at CLUAP1 38723_at 209450_at OSGEP 38194_s_at 214836_x_at IGKC /// IGKV1-5 38743_f_at 201244_s_at RAF1 38249_at 215729_s_at VGLL1 38752_r_at 209492_x_at ATP5I 38254_at 212956_at TBC1D9 38752_r_at 207335_x_at ATP5I 38256_s_at 213794_s_at C14orf120 38795_s_at 214881_s_at UBTF 38262_at 213288_at -- 38810_at 202455_at HDAC5 38263_at 214044_at -- 38816_at 202289_s_at TACC2 38271_at 204225_at HDAC4 38816_at 211382_s_at TACC2 38281_at 207181_s_at CASP7 38847_at 204825_at MELK 38323_at 208146_s_at CPVL 38858_at 205262_at KCNH2 38342_at 212660_at PHF15 38875_r_at 205862_at GREB1 38368_at 209932_s_at DUT 38883_at 217615_at LRRC37A 38434_at 201511_at AAMP 38915_at 206088_at LOC474170 38449_at 201886_at WDR23 38976_at 209083_at CORO1A 38453_at 204683_at ICAM2 38982_at 201174_s_at TERF2IP 38454_g_at 213620_s_at ICAM2 39053_at 202251_at PRPF3 38454_g_at 204683_at ICAM2 39064_at 203433_at MTHFS 38487_at 204150_at STAB1 39070_at 201564_s_at FSCN1 38510_at 213817_at -- 39070_at 210933_s_at FSCN1 38543_at 208211_s_at ALK 39086_g_at 202591_s_at SSBP1 38543_at 208212_s_at ALK 39103_s_at 213279_at DHRS1 38546_at 205227_at IL1RAP 39111_s_at 217407_x_at PPIL2 38574_at 213353_at ABCA5 39111_s_at 209299_x_at PPIL2 38576_at 209911_x_at HIST1H2BD 39111_s_at 214986_x_at PPIL2 38617_at 202193_at LIMK2 39111_s_at 206063_x_at PPIL2 38617_at 210582_s_at LIMK2 39115_at 203368_at CRELD1 38625_g_at 209402_s_at SLC12A4 39140_at 212648_at DHX29 38625_g_at 211112_at SLC12A4 39224_at 213618_at CENTD1 38637_at 215446_s_at LOX 39284_at 205800_at SLC3A1 38646_s_at 209752_at REG1A 39306_at 208165_s_at PRSS16 38665_at 210701_at CFDP1 39309_at 218175_at CCDC92 38666_at 202880_s_at PSCD1 39319_at 205270_s_at LCP2 38674_at 213233_s_at KLHL9 39319_at 205269_at LCP2 38721_at 209002_s_at CALCOCO1 39332_at 214023_x_at TUBB2B 38723_at 209450_at OSGEP 39412_at 202702_at TRIM26 38729_at 200895_s_at FKBP4 39416_at 209154_at TAX1BP3 38749_at 212909_at LYPD1 39416_at 215464_s_at TAX1BP3 38763_at 201563_at SORD 39430_at 202561_at TNKS 38795_s_at 214881_s_at UBTF 39565_at 204832_s_at BMPR1A 38810_at 202455_at HDAC5 39609_at 208157_at SIM2 38816_at 202289_s_at TACC2 39610_at 205453_at HOXB2 38816_at 211382_s_at TACC2 39629_at 206178_at PLA2G5 38823_s_at 202693_s_at STK17A 39629_at 215870_s_at PLA2G5 38826_at 212414_s_at SEPT6 /// N-PAC 39642_at 213712_at ELOVL2 38826_at 212413_at 6-Sep 39677_at 206102_at GINS1 38858_at 205262_at KCNH2 39690_at 209621_s_at PDLIM3 38875_r_at 205862_at GREB1 39702_at 203436_at RPP30 388_at 207105_s_at PIK3R2 39704_s_at 206074_s_at HMGA1 38908_s_at 208070_s_at REV3L 39737_at 203326_x_at -- 38915_at 206088_at LOC474170 39737_at 213818_x_at -- 38976_at 209083_at CORO1A 39748_at 212295_s_at SLC7A1 39007_at 201069_at MMP2 39797_at 212760_at UBR2 39053_at 202251_at PRPF3 39845_at 211152_s_at HTRA2 39064_at 203433_at MTHFS 39846_at 203657_s_at CTSF 39069_at 201792_at AEBP1 39854_r_at 212705_x_at PNPLA2 39070_at 210933_s_at FSCN1 39885_at 213598_at HSA9761 39086_g_at 202591_s_at SSBP1 39897_at 212455_at YTHDC1 39103_s_at 213279_at DHRS1 39904_at 214065_s_at CIB2 39111_s_at 217407_x_at PPIL2 40023_at 206382_s_at BDNF 39111_s_at 209299_x_at PPIL2 40090_at 207628_s_at WBSCR22 39111_s_at 214986_x_at PPIL2 40092_at 201354_s_at BAZ2A 39111_s_at 206063_x_at PPIL2 40118_at 212684_at ZNF3 39115_at 203368_at CRELD1 40145_at 201292_at TOP2A 39120_at 204326_x_at MT1X 40148_at 213419_at APBB2 39120_at 208581_x_at MT1X 40151_s_at 203244_at PEX5 39141_at 200045_at ABCF1 40194_at 215470_at DKFZP686M0199 39141_at 200045_at ABCF1 40203_at 212227_x_at EIF1 39172_at 212500_at C10orf22 40235_at 203839_s_at TNK2 39215_at 206801_at NPPB 40322_at 207526_s_at IL1RL1 39224_at 213618_at CENTD1 40330_at 205111_s_at PLCE1 39284_at 205800_at SLC3A1 40330_at 214159_at PLCE1 39291_at 205450_at PHKA1 40371_at 216924_s_at DRD2 39332_at 214023_x_at TUBB2B 40409_at 202054_s_at ALDH3A2 39412_at 202702_at TRIM26 40412_at 203554_x_at PTTG1 39416_at 209154_at TAX1BP3 40443_at 208407_s_at CTNND1 39503_s_at 205493_s_at DPYSL4 40480_s_at 210105_s_at FYN 39530_at 203370_s_at PDLIM7 40522_at 215001_s_at GLUL 39565_at 204832_s_at BMPR1A 40576_f_at 209068_at HNRPDL 39570_at 212712_at CAMSAP1 40659_at 209959_at NR4A3 39606_at 211381_x_at SPAG11 40674_s_at 206858_s_at HOXC6 39629_at 206178_at PLA2G5 40681_at 205422_s_at ITGBL1 39629_at 215870_s_at PLA2G5 40691_at 204937_s_at ZNF274 39637_at 205097_at SLC26A2 40717_at 210074_at CTSL2 39638_at 205688_at TFAP4 40734_r_at 210319_x_at MSX2 39642_at 213712_at ELOVL2 40756_at 205129_at NPM3 39677_at 206102_at GINS1 40775_at 202746_at ITM2A
39704_s_at 206074_s_at HMGA1 40820_at 217856_at RBM8A 39710_at 201310_s_at C5orf13 40823_s_at 210555_s_at NFATC3 39748_at 212295_s_at SLC7A1 40823_s_at 210556_at NFATC3 39797_at 212760_at UBR2 40856_at 202283_at SERPINF1 39854_r_at 212705_x_at PNPLA2 40890_at 210386_s_at MTX1 39885_at 213598_at HSA9761 40893_at 202930_s_at SUCLA2 39897_at 212455_at YTHDC1 40939_at 205332_at RCE1 39904_at 214065_s_at CIB2 40991_at 213963_s_at SAP30 39995_s_at 210695_s_at WWOX 41015_at 209799_at PRKAA1 40023_at 206382_s_at BDNF 41024_f_at 207854_at GYPE 40118_at 212684_at ZNF3 41024_f_at 216833_x_at GYPB /// GYPE 40124_at 201614_s_at RUVBL1 41024_f_at 214407_x_at GYPB 40127_at 220974_x_at SFXN3 41061_at 205425_at HIP1 40127_at 217226_s_at SFXN3 41070_r_at 204871_at MTERF 40148_at 213419_at APBB2 41100_at 204950_at CARD8 40194_at 215470_at DKFZP686M0199 41106_at 204401_at KCNN4 40322_at 207526_s_at IL1RL1 41107_at 205104_at SNPH 40330_at 205111_s_at PLCE1 41110_at 203533_s_at CUL5 40330_at 214159_at PLCE1 41161_at 201763_s_at DAXX 40336_at 207813_s_at FDXR 41229_at 213029_at NFIB 40409_at 202054_s_at ALDH3A2 41359_at 209873_s_at PKP3 40414_at 201797_s_at VARS 41414_at 204402_at RHBDD3 40419_at 201061_s_at STOM 41484_r_at 214326_x_at JUND 40449_at 208021_s_at RFC1 41509_at 200690_at HSPA9B 40489_at 208871_at ATN1 41549_s_at 203300_x_at AP1S2 40522_at 215001_s_at GLUL 41562_at 202265_at BMI1 40537_at 201025_at EIF5B 41638_at 213483_at PPWD1 40544_g_at 209987_s_at ASCL1 41646_at 221508_at TAOK3 40598_at 213820_s_at STARD5 41665_at 203378_at PCF11 40646_at 205898_at CX3CR1 41693_r_at 204573_at CROT 40673_at 205355_at ACADSB 41715_at 204484_at PIK3C2B 40674_s_at 206858_s_at HOXC6 41762_at 202406_s_at TIAL1 40679_at 206058_at SLC6A12 41763_g_at 202406_s_at TIAL1 40681_at 205422_s_at ITGBL1 41816_at 210026_s_at CARD10 40691_at 204937_s_at ZNF274 41851_at 213250_at CCDC85B 40734_r_at 210319_x_at MSX2 42980_at 226912_at ZDHHC23 40756_at 205129_at NPM3 43022_at 224728_at ATPAF1 40767_at 213258_at TFPI 43511_s_at 221861_at -- 40775_at 202746_at ITM2A 43525_at 217721_at -- 40820_at 217856_at RBM8A 43579_at 242440_at CUGBP1 40823_s_at 210555_s_at NFATC3 43646_at 219854_at ZNF14 40823_s_at 210556_at NFATC3 43827_s_at 201030_x_at LDHB 40856_at 202283_at SERPINF1 43827_s_at 213564_x_at LDHB 40893_at 202930_s_at SUCLA2 43839_f_at 221510_s_at GLS 40899_at 201650_at KRT19 43919_at 226824_at CPXM2 40939_at 205332_at RCE1 44026_at 226350_at CHML 40991_at 213963_s_at SAP30 44060_at 226317_at PPP4R2 41024_f_at 207854_at GYPE 440_at 206929_s_at NFIC 41024_f_at 216833_x_at GYPB /// GYPE 440_at 213298_at NFIC 41024_f_at 214407_x_at GYPB 44108_at 211952_at RANBP5 41044_at 214061_at WDR67 44131_s_at 231714_s_at AP4B1 41100_at 204950_at CARD8 44603_at 228555_at CAMK2D 41106_at 204401_at KCNN4 44659_at 219034_at PARP16 41107_at 205104_at SNPH 44787_s_at 217913_at VPS4A 41110_at 203533_s_at CUL5 447_g_at 202574_s_at CSNK1G2 41161_at 201763_s_at DAXX 44841_at 218284_at SMAD3 41316_s_at 201748_s_at SAFB 44967_r_at 242724_x_at NR6A1 41321_s_at 213297_at RMND5B 44973_at 218950_at CENTD3 41359_at 209873_s_at PKP3 44986_s_at 218284_at SMAD3 41484_r_at 214326_x_at JUND 45114_at 226363_at ABCC5 41489_at 203221_at TLE1 45322_at 225022_at GOPC 41505_r_at 209348_s_at MAF 45441_r_at 204915_s_at SOX11 41509_at 200690_at HSPA9B 45490_s_at 226214_at MIR16 41524_at 202794_at INPP1 45536_at 205348_s_at DYNC1I1 41549_s_at 203300_x_at AP1S2 45538_s_at 218704_at RNF43 41562_at 202265_at BMI1 45541_s_at 227044_at TBC1D22A 41582_at 205539_at AVIL 45652_at 227812_at TNFRSF19 41598_at 214257_s_at SEC22B 45799_at 218009_s_at PRC1 41606_at 202810_at DRG1 45820_at 218934_s_at HSPB7 41638_at 213483_at PPWD1 45880_at 223737_x_at CHST9 41643_at 215043_s_at SMA3 /// SMA5 45880_at 224400_s_at CHST9 41646_at 221508_at TAOK3 46037_at 243767_at -- 41650_at 203536_s_at WDR39 46242_at 218298_s_at C14orf159 41665_at 203378_at PCF11 46256_at 221769_at SPSB3 41693_r_at 204573_at CROT 46426_at 219758_at TTC26 41715_at 204484_at PIK3C2B 47300_s_at 219801_at ZNF34 41809_at 204215_at C7orf23 47688_at 240131_at -- 41816_at 210026_s_at CARD10 48079_at 226985_at FGD5 42327_at 233076_at C10orf39 48364_at 219089_s_at ZNF576 42342_r_at 242531_at RRAGC 48561_g_at 221851_at LOC90379 428_s_at 216231_s_at B2M 48762_r_at 218552_at ECHDC2 42980_at 226912_at ZDHHC23 49111_at 221861_at -- 43046_at 209167_at GPM6B 49125_at 222810_s_at RASAL2 43468_at 226914_at ARPC5L 49173_at 218731_s_at VWA1 43468_at 226915_s_at ARPC5L 49187_at 218372_at MED9 43511_s_at 221861_at -- 49316_at 218704_at RNF43 43569_at 244586_x_at ALS2CR19 49810_s_at 237685_at LOC339760 /// LOC651281 43579_at 242440_at CUGBP1 508_at 201484_at SUPT4H1 43727_at 235665_at PTOV1 50926_s_at 219429_at FA2H 43827_s_at 201030_x_at LDHB 51145_at 226286_at RBED1 43827_s_at 213564_x_at LDHB 51318_r_at 236002_at RPS2 43839_f_at 221510_s_at GLS 51406_at 219507_at RSRC1 43927_at 218927_s_at CHST12 51543_at 222536_s_at ZNF395 44060_at 226317_at PPP4R2 51625_at 204495_s_at C15orf39 440_at 206929_s_at NFIC 51803_g_at 218999_at TMEM140 440_at 213298_at NFIC 51822_at 230780_at -- 44131_s_at 231714_s_at AP4B1 51848_at 227542_at -- 44259_at 228630_at ZNF84 51850_s_at 221860_at HNRPL 44603_at 228555_at CAMK2D 51856_at 219686_at STK32B 44615_at 226969_at LOC149448 51871_at 219687_at HHAT 44659_at 219034_at PARP16 51936_at 238332_at ANKRD29 44787_s_at 217913_at VPS4A 52204_at 239574_at ECHDC3 44967_r_at 242724_x_at NR6A1 52207_at 220764_at PPP4R2 44973_at 218950_at CENTD3 52327_s_at 225688_s_at PHLDB2 44983_at 213193_x_at TRBV19 /// 52576_s_at 218638_s_at SPON2 TRBC1 45114_at 226363_at ABCC5 52658_at 222088_s_at SLC2A3 45299_at 218001_at MRPS2 526_s_at 209805_at PMS2 /// PMS2CL 45322_at 225022_at GOPC 52837_at 221901_at KIAA1644 45341_at 201278_at DAB2 52941_at 221823_at LOC90355 45342_at 217844_at CTDSP1 53122_at 218933_at SPATA5L1 45383_at 203926_x_at ATP5D 53122_at 222163_s_at SPATA5L1 45385_g_at 222597_at SP29 53550_at 236038_at -- 45536_at 205348_s_at DYNC1I1 53784_at 227894_at KIAA1924 45538_s_at 218704_at RNF43 53835_at 212528_at -- 45541_s_at 227044_at TBC1D22A 54000_at 223203_at TMEM29 /// LOC653094 /// LOC653504 /// LOC653507 45598_at 219403_s_at HPSE 54077_at 218888_s_at NETO2 45652_at 227812_at TNFRSF19 54093_at 218403_at TRIAP1 45676_at 218741_at C22orf18 54280_at 240555_at MITF 45799_at 218009_s_at PRC1 54420_at 221218_s_at TPK1 45880_at 223737_x_at CHST9 54420_at 223686_at TPK1 45880_at 224400_s_at CHST9 54886_at 225688_s_at PHLDB2 46037_at 243767_at -- 55013_at 225147_at PSCD3 46137_at 229962_at FLJ34306 55028_at 224715_at WDR34 46256_at 221769_at SPSB3 55117_at 243453_at -- 46290_at 217961_at FLJ20551 55150_at 239413_at CEP152 46295_at 221515_s_at LCMT1 55185_at 239436_at CHORDC1 46364_at 236537_at -- 55449_i_at 229459_at FAM19A5 46426_at 219758_at TTC26 55639_at 215974_at HCG4P6 46595_at 221780_s_at DDX27 55868_at 230157_at CDH24 46659_at 226702_at LOC129607 56126_at 219370_at RPRM 46694_at 218162_at OLFML3 56142_r_at 230698_at -- 47088_at 229598_at COBLL1 56251_at 212177_at C6orf111 47110_at 227174_at WDR72 56295_at 225075_at PDRG1 47550_at 219042_at LZTS1 57205_at 223007_s_at C9orf5 47688_at 240131_at -- 57302_at 206783_at FGF4 47778_at 230357_at GMDS 56401_at 218005_at ZNF22 47884_at 236456_at PTPN5 56712_at 236704_at PDE4DIP 48079_at 226985_at FGD5 56812_at 219148_at PBK 480_at 204267_x_at PKMYT1 56819_at 230184_at -- 48114_g_at 218865_at MOSC1 56870_g_at 219222_at RBKS 48364_at 219089_s_at ZNF576 57013_s_at 218996_at TFPT 48384_at 229661_at SALL4 57085_s_at 215411_s_at TRAF3IP2 48550_at 218454_at FLJ22662 57531_at 228448_at MAP6 48581_at 225187_at KIAA1967 57534_at 226987_at RBM15B 49111_at 221861_at -- 57539_at 221848_at ZGPAT 49125_at 222810_s_at RASAL2 57540_at 219222_at RBKS 49161_at 240512_x_at KCTD4 57781_at 244648_at CCDC93 49187_at 218372_at MED9 57954_at 225407_at MBP 49316_at 218704_at RNF43 57984_at 236284_at KIAA0146 49519_at 218037_at C2orf17 58082_at 232237_at MDGA1 49587_at 218873_at GON4L 58366_at 228694_at -- 49589_g_at 218873_at GON4L 583_s_at 203868_s_at VCAM1 49810_s_at 237685_at LOC339760 /// 58622_at 230466_s_at RASSF3 LOC651281 49874_at 229592_at -- 58799_at 229191_at TBCD 50098_at 220979_s_at ST6GALC5 58984_at 229672_at C20orf44 50354_at 219117_s_at FKBP11 59616_at 229121_at -- 50926_s_at 219429_at FA2H 59658_at 215731_s_at MPHOSPH9 51092_at 221816_s_at PHF11 59658_at 221965_at MPHOSPH9 51145_at 226286_at RBED1 59661_at 227614_at HKDC1 51406_at 219507_at RSRC1 599_at 214438_at HLX1 51543_at 222536_s_at ZNF395 600_at 206113_s_at RAB5A 51625_at 204495_s_at C15orf39 60199_at 218521_s_at UBE2W 51702_at 238649_at PITPNC1 60517_at 228717_at PANK1 51755_at 220107_s_at C14orf140 60535_g_at 221042_s_at CLMN 51816_at 219078_at GPATC2 61003_at 243139_at SV2C 51822_at 230780_at -- 61119_at 204039_at CEBPA 51848_at 227542_at -- 61274_s_at 208772_at ANKHD1 /// MASK-BP3 51856_at 219686_at STK32B 615_s_at 210355_at PTHLH 51871_at 219687_at HHAT 61659_at 227188_at C21orf63 51936_at 238332_at ANKRD29 62210_at 218996_at TFPT 52170_at 204037_at EDG2 /// 63325_at 221860_at HNRPL LOC644923 52204_at 239574_at ECHDC3 63361_at 218638_s_at SPON2 52327_s_at 225688_s_at PHLDB2 63388_at 200856_x_at NCOR1 /// C20orf191 52574_at 243424_at SOX6 63872_g_at 218552_at ECHDC2 52720_r_at 236705_at MGC42090 64184_at 219596_at THAP10 52837_at 221901_at KIAA1644 64339_s_at 218636_s_at MAN1B1 52941_at 221823_at LOC90355 64364_at 201354_s_at BAZ2A 53122_at 218933_at SPATA5L1 64475_at 221447_s_at GLT8D2 53122_at 222163_s_at SPATA5L1 64489_at 218039_at NUSAP1 53550_at 236038_at -- 65079_at 226668_at WDSUB1 53714_at 222540_s_at RSF1 65492_at 225835_at SLC12A2 53784_at 227894_at KIAA1924 65720_at 218418_s_at ANKRD25 53835_at 212528_at -- 65884_at 218636_s_at MAN1B1 53911_at 218220_at C12orf10 65983_at 218284_at SMAD3 53968_at 221818_at INTS5 66148_i_at 244231_at -- 54000_at 223203_at TMEM29 /// 679_at 205653_at CTSG LOC653094 /// LOC653504 /// LOC653507 54280_at 240555_at MITF 69680_at 207445_s_at CCR9 54420_at 221218_s_at TPK1 71949_at 202903_at LSM5 54420_at 223686_at TPK1 72441_at 202885_s_at PPP2R1B 54886_at 225688_s_at PHLDB2 744_at 203334_at DHX8 55009_at 224452_s_at MGC12966 76343_at 218658_s_at ACTR8 55013_at 225147_at PSCD3 767_at 207961_x_at MYH11 55026_at 219142_at RASL11B 773_at 201496_x_at MYH11 55093_at 221799_at CSGlcA-T 774_g_at 201496_x_at MYH11 55117_at 243453_at -- 78359_at 219125_s_at RAG1AP1 55150_at 239413_at CEP152 78684_at 212230_at PPAP2B 55185_at 239436_at CHORDC1 80446_at 204883_s_at HUS1 55449_i_at 229459_at FAM19A5 80572_at 201540_at FHL1 55469_at 205521_at ENDOGL1 806_at 204958_at PLK3 55650_at 218656_s_at LHFP 809_at 209514_s_at RAB27A 55798_at 218775_s_at WWC2 809_at 210951_x_at RAB27A 55806_at 235430_at C14orf43 823_at 203687_at CX3CL1 55853_at 219923_at TRIM45 828_at 206631_at PTGER2 55912_at 218534_s_at AGGF1 829_s_at 200824_at GSTP1 56126_at 219370_at RPRM 83193_at 222073_at COL4A3 56142_r_at 230698_at -- 85141_at 202970_at -- 56251_at 212177_at C6orf111 85822_at 219797_at MGAT4A 56295_at 225075_at PDRG1 873_at 213844_at HOXA5 56305_at 219316_s_at C14orf58 877_at 204314_s_at CREB1 57205_at 223007_s_at C9orf5 877_at 204313_s_at CREB1 57272_at 210695_s_at WWOX 88242_at 209527_at EXOSC2 57404_at 241224_x_at DSCR8 89217_at 213722_at SOX2 56409_at 218087_s_at SORBS1 89799_at 219997_s_at COPS7B 56504_at 218584_at FLJ21127 89919_s_at 209154_at TAX1BP3 56712_at 236704_at PDE4DIP 89919_s_at 215464_s_at TAX1BP3 56967_at 219606_at PHF20L1 90412_i_at 219538_at WDR5B 57085_s_at 215411_s_at TRAF3IP2 90414_f_at 219538_at WDR5B 57516_at 222120_at MGC13138 90695_at 222307_at LOC282997 57567_at 226031_at FLJ20097 91099_i_at 214695_at UBAP2L 57684_at 221049_s_at POLL 91101_r_at 214695_at UBAP2L 57718_at 224694_at ANTXR1 91137_at 214695_at UBAP2L 57755_at 231165_at DDHD1 914_g_at 211626_x_at ERG 57781_at 244648_at CCDC93 914_g_at 213541_s_at ERG 57839_g_at 220788_s_at RNF31 993_at 205546_s_at TYK2 57954_at 225407_at MBP 200784_s_at LRP1 58082_at 232237_at MDGA1 200923_at LGALS3BP 58329_at 218944_at PYCRL 201044_x_at DUSP1 58356_at 219100_at OBFC1 201169_s_at BHLHB2 58366_at 228694_at -- 201208_s_at TNFAIP1 58472_f_at 238570_at -- 201297_s_at MOBK1B 58589_s_at 214460_at LSAMP 201367_s_at ZFP36L2 58622_at 230466_s_at RASSF3 201371_s_at CUL3 58666_at 242178_at LIPI 201685_s_at C14orf92 58798_at 201590_x_at ANXA2 201739_at SGK 58799_at 229191_at TBCD 201793_x_at SMG7 58984_at 229672_at C20orf44 201796_s_at VARS 59038_at 228784_at ST3GAL2 202186_x_at PPP2R5A 59616_at 229121_at -- 202358_s_at SNX19
59658_at 215731_s_at MPHOSPH9 202924_s_at PLAGL2 59658_at 221965_at MPHOSPH9 202935_s_at SOX9 59661_at 227614_at HKDC1 203383_s_at GOLGA1 59719_at 229191_at TBCD 203479_s_at OTUD4 59766_at 230640_at PRPF40B 203597_s_at WBP4 599_at 214438_at HLX1 204298_s_at LOX 60034_at 226360_at ZNRF3 205625_s_at CALB1 600_at 206113_s_at RAB5A 205915_x_at GRIN1 60517_at 228717_at PANK1 207045_at FLJ20097 60535_g_at 221042_s_at CLMN 207331_at CENPF 61003_at 243139_at SV2C 207465_at -- 61119_at 204039_at CEBPA 207746_at POLQ 61274_s_at 208772_at ANKHD1 /// 207902_at IL5RA MASK-BP3 61342_at 227934_at -- 208144_s_at -- 61538_r_at 214600_at TEAD1 208461_at HIC1 615_s_at 210355_at PTHLH 208504_x_at PCDHB11 61931_at 228270_at DKFZp434J1015 208545_x_at TAF4 /// DKFZp547K054 61931_at 232884_s_at DKFZp434J1015 208583_x_at HIST1H2AJ 62940_f_at 221872_at RARRES1 209034_at PNRC1 62941_r_at 221872_at RARRES1 209052_s_at WHSC1 63361_at 218638_s_at SPON2 209053_s_at WHSC1 63388_at 200856_x_at NCOR1 /// 209078_s_at TXN2 C20orf191 63396_at 222258_s_at SH3BP4 209368_at EPHX2 634_at 202525_at PRSS8 209677_at PRKCI 63883_at 222130_s_at FTSJ2 210197_at ITPK1 639_s_at 202819_s_at TCEB3 210245_at ABCC8 64006_s_at 218656_s_at LHFP 210256_s_at PIP5K1A 64048_at 218396_at VPS13C 210572_at PCDHA2 64145_at 218741_at C22orf18 210712_at LDHAL6B 64292_s_at 218312_s_at ZNF447 211001_at TRIM29 64339_s_at 218636_s_at MAN1B1 211077_s_at TLK1 64526_at 220595_at PDZRN4 211127_x_at EDA 64881_at 219986_s_at ACAD10 211304_x_at KCNJ5 649_s_at 217028_at CXCR4 211310_at EZH1 65079_at 226668_at WDSUB1 211337_s_at 76P 65443_at 218272_at FLJ20699 211427_s_at KCNJ13 65484_f_at 221510_s_at GLS 211502_s_at PFTK1 65492_at 225835_at SLC12A2 211520_s_at GRIA1 65604_at 218730_s_at OGN 211572_s_at SLC23A2 65613_at 218331_s_at C10orf18 211731_x_at SSX3 656_at 202794_at INPP1 211776_s_at EPB41L3 65710_at 217832_at SYNCRIP 211864_s_at FER1L3 65884_at 218636_s_at MAN1B1 212283_at AGRN 66148_i_at 244231_at -- 212743_at RCHY1 668_s_at 204259_at MMP7 212862_at CDS2 669_s_at 202531_at IRF1 213006_at CEBPD 671_at 200665_s_at SPARC 213274_s_at CTSB 675_at 214022_s_at IFITM1 213328_at NEK1 675_at 201601_x_at IFITM1 213772_s_at GGA2 676_g_at 214022_s_at IFITM1 214250_at NUMA1 676_g_at 201601_x_at IFITM1 214283_at TMEM97 679_at 205653_at CTSG 214366_s_at ALOX5 73236_g_at 202269_x_at GBP1 214842_s_at ALB 740_at 216615_s_at HTR3A 215103_at CYP2C18 740_at 217002_s_at HTR3A 215198_s_at CALD1 744_at 203334_at DHX8 215249_at RPL35A 74576_at 219660_s_at ATP8A2 215531_s_at GABRA5 /// LOC653222 74779_s_at 205666_at FMO1 215560_x_at MTRF1L 74932_at 202333_s_at UBE2B 215611_at TCF12 75229_at 213732_at TCF3 215615_x_at RERE 753_at 204114_at NID2 215637_at TSGA14 75722_at 219634_at CHST11 215758_x_at ZNF93 769_s_at 201590_x_at ANXA2 215779_s_at HIST1H2BG 77595_at 221189_s_at TARSL1 215978_x_at LOC152719 78107_at 213741_s_at KP1 216002_at FNTB 78622_r_at 218312_s_at ZNF447 216017_s_at B2 78684_at 212230_at PPAP2B 216146_at -- 78737_at 201408_at PPP1CB 216161_at SBNO1 80446_at 204883_s_at HUS1 216284_at -- 80456_s_at 208676_s_at PA2G4 216319_at -- 806_at 204958_at PLK3 216340_s_at CYP2A7P1 809_at 209514_s_at RAB27A 216422_at PA2G4 809_at 210951_x_at RAB27A 216522_at OR2B6 81410_at 214681_at GK 216583_x_at -- 820_at 204168_at MGST2 216592_at MAGEC3 828_at 206631_at PTGER2 216810_at KRTAP4-7 829_s_at 200824_at GSTP1 216860_s_at GDF11 83413_at 231432_at GRP 216928_at TAL1 85141_at 202970_at -- 217112_at PDGFB 873_at 213844_at HOXA5 217136_at PPIAL4 /// LOC653505 /// LOC653598 877_at 204314_s_at CREB1 217362_x_at HLA-DRB6 877_at 204313_s_at CREB1 217612_at TIMM50 87833_at 213732_at TCF3 218182_s_at CLDN1 881_at 208083_s_at ITGB6 218564_at RFWD3 881_at 208084_at ITGB6 218621_at HEMK1 89799_at 219997_s_at COPS7B 218744_s_at PACSIN3 89882_at 214022_s_at IFITM1 220444_at ZNF557 89898_at 222006_at LETM1 220549_at RAD54B 89919_s_at 209154_at TAX1BP3 220631_at OSGEPL1 89960_at 202333_s_at UBE2B 220791_x_at SCN11A 90410_at 219055_at SRBD1 221358_at NPBWR2 90695_at 222307_at LOC282997 221409_at OR2S2 914_g_at 211626_x_at ERG 221595_at -- 914_g_at 213541_s_at ERG 221905_at CYLD 916_at 204945_at PTPRN 222038_s_at UTP18 917_g_at 204945_at PTPRN 222184_at -- 1552286_at ATP6V1E2 222264_at HNRPUL2 1557372_at ATP6V1E2 31845_at ELF4 1561574_at SLIT3 35776_at ITSN1 201060_x_at STOM 40359_at RASSF7 201137_s_at HLA-DPB1 52651_at COL8A2 201309_x_at C5orf13 65884_at MAN1B1 201793_x_at SMG7 52651_at COL8A2 201796_s_at VARS 65884_at MAN1B1 201905_s_at CTDSPL 202255_s_at SIPA1L1 202291_s_at MGP 202358_s_at SNX19 202472_at MPI 202897_at SIRPA 202935_s_at SOX9 203290_at HLA-DQA1 203398_s_at GALNT3 203532_x_at CUL5 203705_s_at FZD7 203793_x_at PCGF2 203810_at DJB4 203813_s_at SLIT3 204036_at EDG2 204111_at HNMT 204222_s_at GLIPR1 204298_s_at LOX 204364_s_at REEP1 204514_at DPH2 204939_s_at PLN 205158_at RSE4 205371_s_at DBT 205625_s_at CALB1 206389_s_at PDE3A 207511_s_at C2orf24 207772_s_at PRMT8 207797_s_at LRP2BP 208180_s_at HIST1H4H 208504_x_at PCDHB11 209034_at PNRC1 209053_s_at WHSC1 209078_s_at TXN2 209168_at GPM6B 209247_s_at ABCF2 209288_s_at CDC42EP3 209291_at ID4 209423_s_at PHF20 209500_x_at TNFSF13 /// TNFSF12- TNFSF13 209658_at CDC16 209802_at PHLDA2 210132_at EF3 210256_s_at PIP5K1A 210314_x_at TNFSF13 /// TNFSF12- TNFSF13 210572_at PCDHA2 210635_s_at KLHL20 210712_at LDHAL6B 210718_s_at ARL17P1 210931_at RNF6 211077_s_at TLK1 211310_at EZH1 211337_s_at 76P 211389_x_at KIR3DL1 211427_s_at KCNJ13 211520_s_at GRIA1 211776_s_at EPB41L3 212092_at PEG10 212671_s_at HLA-DQA1 /// HLA-DQA2 /// LOC650946 212743_at RCHY1 213006_at CEBPD 213490_s_at MAP2K2 213688_at CALM1 213957_s_at CEP350 214252_s_at CLN5 214283_at TMEM97 214543_x_at QKI 214649_s_at MTMR2 214675_at NUP188 215187_at FLJ11292 215198_s_at CALD1 215468_at LOC647070 215637_at TSGA14 216002_at FNTB 216091_s_at BTRC 216161_at SBNO1 216216_at SLIT3 216315_x_at UBE2V1 /// Kua- UEV 216354_at -- 216514_at -- 216592_at MAGEC3 216810_at KRTAP4-7 216813_at -- 216850_at SNRPN 216969_s_at KIF22 217071_s_at MTHFR 217187_at MUC5AC 217209_at -- 217362_x_at HLA-DRB6 217392_at CAPZA1 217401_at -- 217448_s_at C14orf92 217538_at RUTBC1 217612_at TIMM50 217618_x_at HUS1 218182_s_at CLDN1 218564_at RFWD3 218589_at P2RY5 218621_at HEMK1 218744_s_at PACSIN3 219451_at MSRB2 219810_at VCPIP1 220037_s_at XLKD1 220564_at C10orf59 220584_at FLJ22184 220631_at OSGEPL1 220789_s_at TBRG4 220791_x_at SCN11A 220908_at CCDC33 221356_x_at P2RX2 221440_s_at RBBP9 221595_at -- 221683_s_at CEP290 222038_s_at UTP18 222141_at KLHL22 222170_at LOC440334 222176_at PTEN 222247_at DXS542 34868_at SMG5 35776_at ITSN1 37278_at TAZ 40489_at ATN1 53968_at INTS5 42447_at SLIT3 GI_3253412 GI_9120119 PRO1489
TABLE-US-00010 TABLE 8B Tissue (tumor or stroma) specific relapse related genes. Normal font: up-regulated genes. Italics: down-regulated genes. Tumor Specific Relapse Stroma Specific Related Genes Relapse Related Genes Gene U133 Probe U133 Probe Set ID Symbol Set ID Gene Symbol 218312_s_at ZNF447 209959_at NR4A3 209737_at MAGI2 202935_s_at SOX9 201137_s_at HLA-DPB1 201650_at KRT19 201408_at PPP1CB 201496_x_at MYH11 208180_s_at HIST1H4H 203453_at SCNN1A 213789_at -- 213629_x_at MT1F 214600_at TEAD1 210915_x_at TRBV19 /// TRBC1 210314_x_at TNFSF13 /// 218888_s_at NETO2 TNFSF12- TNFSF13 204384_at GOLGA2 203932_at HLA-DMB 204916_at RAMP1 206391_at RARRES1 212909_at LYPD1 200923_at LGALS3BP 209078_s_at TXN2 201044_x_at DUSP1 221799_at CSGlcA-T 213564_x_at LDHB 216450_x_at HSP90B1 213746_s_at FL 205226_at PDGFRL 210299_s_at FHL1 201267_s_at PSMC3 218731_s_at VWA1 220584_at FLJ22184 222162_s_at ADAMTS1 214472_at HIST1H3D 204135_at DOC1 203467_at PMM1 222073_at COL4A3 202525_at PRSS8 201367_s_at ZFP36L2 200811_at CIRBP 202222_s_at DES 214522_x_at HIST1H3D 201495_x_at MYH11 209500_x_at TNFSF13 /// 201030_x_at LDHB TNFSF12- TNFSF13 211558_s_at DHPS 211864_s_at FER1L3 201748_s_at SAFB 202269_x_at GBP1 208490_x_at HIST1H2BF 205928_at ZNF443 208579_x_at H2BFS 216860_s_at GDF11 201797_s_at VARS 213293_s_at TRIM22 208546_x_at HIST1H2BH 211417_x_at GGT1 201101_s_at BCLAF1 207826_s_at ID3 219660_s_at ATP8A2 201297_s_at MOBK1B 205750_at BPHL 200974_at ACTA2 219438_at FAM77C 200953_s_at CCND2 208523_x_at HIST1H2BI 212254_s_at DST 205371_s_at DBT 207961_x_at MYH11 221742_at CUGBP1 201787_at FBLN1 202102_s_at BRD4 201235_s_at BTG2 212684_at ZNF3 202283_at SERPINF1 201897_s_at CKS1B 201169_s_at BHLHB2 216354_at -- 205383_s_at ZBTB20 209218_at SQLE 210298_x_at FHL1 214460_at LSAMP 222088_s_at SLC2A3 205480_s_at UGP2 210072_at CCL19 203368_at CRELD1 201540_at FHL1 53968_at INTS5 201310_s_at C5orf13 210052_s_at TPX2 211798_x_at IGLJ3 205376_at INPP4B 213258_at TFPI 210410_s_at MSH5 209154_at TAX1BP3 204343_at ABCA3 215016_x_at DST 211389_x_at KIR3DL1 203851_at IGFBP6 207950_s_at ANK3 201484_at SUPT4H1 209317_at POLR1C 214040_s_at GSN 203767_s_at STS 202498_s_at SLC2A3 207156_at HIST1H2AG 202688_at TNFSF10 204173_at MYL6B 217741_s_at ZA20D2 222130_s_at FTSJ2 211634_x_at IGHM 208583_x_at HIST1H2AJ 212150_at KIAA0143 219464_at CA14 202561_at TNKS 206667_s_at SCAMP1 204079_at TPST2 211697_x_at LOC56902 215464_s_at TAX1BP3 208675_s_at DDOST 208966_x_at IFI16 220480_at HAND2 215446_s_at LOX 203221_at TLE1 211653_x_at 217968_at TSSC1 211573_x_at TGM2 217844_at CTDSP1 201280_s_at DAB2 203557_s_at PCBD1 218418_s_at ANKRD25 220107_s_at C14orf140 218552_at ECHDC2 210820_x_at COQ7 212203_x_at IFITM3 208478_s_at BAX 209699_x_at AKR1C2 209805_at PMS2 /// 216269_s_at ELN PMS2CL 201791_s_at DHCR7 204151_x_at AKR1C1 206226_at HRG 203890_s_at DAPK3 218873_at GON4L 202450_s_at CTSK 213272_s_at LOC57146 211429_s_at SERPI1 209302_at POLR2H 211991_s_at HLA-DPA1 208676_s_at PA2G4 201506_at TGFBI 215198_s_at CALD1 219370_at RPRM 218636_s_at MAN1B1 205471_s_at DACH1 210589_s_at GBA /// GBAP 206332_s_at IFI16 209516_at SMYD5 202084_s_at SEC14L1 218001_at MRPS2 212937_s_at COL6A1 216813_at -- 202177_at GAS6 209059_s_at EDF1 209034_at PNRC1 201405_s_at COPS6 201371_s_at CUL3 214061_at WDR67 209083_at CORO1A 209701_at ARTS-1 208146_s_at CPVL 213336_at GTF2I 213249_at FBXL7 203720_s_at ERCC1 202827_s_at MMP14 208312_s_at PRAMEF1 /// 220595_at PDZRN4 PRAMEF2 210501_x_at EIF3S12 219179_at DACT1 212487_at KIAA0553 208091_s_at ECOP 204431_at TLE2 209118_s_at TUBA3 200708_at GOT2 204298_s_at LOX 204676_at C16orf51 217173_s_at LDLR 214546_s_at P2RY11 210105_s_at FYN 203926_x_at ATP5D 204456_s_at GAS1 214784_x_at XPO6 222154_s_at DPTP6 207501_s_at FGF12 210269_s_at RP13-297E16.1 203147_s_at TRIM14 200033_at DDX5 218168_s_at CABC1 209168_at GPM6B 201904_s_at CTDSPL 206360_s_at SOCS3 218548_x_at TEX264 215116_s_at DNM1 209247_s_at ABCF2 203300_x_at AP1S2 216315_x_at UBE2V1 /// Kua- 37408_at MRC2 UEV 215535_s_at AGPAT1 209932_s_at DUT 220908_at CCDC33 201278_at DAB2 216525_x_at PMS2L3 200784_s_at LRP1 218464_s_at C17orf63 213780_at TCHH 217872_at NOP17 40359_at RASSF7 203410_at AP3M2 215411_s_at TRAF3IP2 201511_at AAMP 216583_x_at -- 210635_s_at KLHL20 211536_x_at MAP3K7 200895_s_at FKBP4 201354_s_at BAZ2A 210113_s_at LP1 204352_at TRAF5 217961_at FLJ20551 203854_at CFI 214473_x_at PMS2L3 212938_at COL6A1 213893_x_at PMS2L5 /// 204525_at PHF14 LOC441259 /// LOC641799 /// LOC641800 /// LOC645243 /// LOC645248 217586_x_at -- 222264_at HNRPUL2 203364_s_at KIAA0652 203567_s_at TRIM38 217094_s_at ITCH 214366_s_at ALOX5 218037_at C2orf17 218290_at PLEKHJ1 207511_s_at C2orf24 215051_x_at AIF1 219403_s_at HPSE 216028_at DKFZP564C152 205795_at NRXN3 208306_x_at HLA-DRB1 214756_x_at PMS2L1 202286_s_at TACSTD2 218944_at PYCRL 213233_s_at KLHL9 222006_at LETM1 210026_s_at CARD10 218004_at BSDC1 209566_at INSIG2 218673_s_at ATG7 204907_s_at BCL3 222176_at PTEN 217798_at CNOT2 216843_x_at PMS2L1 218864_at TNS1 200851_s_at KIAA0174 211065_x_at PFKL 221189_s_at TARSL1 58780_s_at FLJ10357 200990_at TRIM28 221774_x_at FAM48A 221780_s_at DDX27 209877_at SNCG 216267_s_at TMEM115 211776_s_at EPB41L3 220789_s_at TBRG4 204150_at STAB1 201905_s_at CTDSPL 208461_at HIC1 209741_x_at ZNF291 218454_at FLJ22662 211127_x_at EDA 214250_at NUMA1 218621_at HEMK1 206743_s_at ASGR1 202394_s_at ABCF3 221901_at KIAA1644 204476_s_at PC 209826_at EGFL8 /// LOC653870 217209_at -- 220318_at EPN3 215321_at RPIB9 204108_at NFYA 216514_at -- 204882_at ARHGAP25 214116_at -- 218999_at TMEM140 213957_s_at CEP350 205135_s_at NUFIP1 205610_at MYOM1 217362_x_at HLA-DRB6 214507_s_at EXOSC2 209659_s_at CDC16 217830_s_at NSFL1C 212552_at HPCAL1 205851_at NME6 219653_at LSM14B 217187_at MUC5AC 211001_at TRIM29 202255_s_at SIPA1L1 218614_at C12orf35 205910_s_at CEL 209280_at MRC2 204212_at ACOT8 221934_s_at DALRD3 214283_at TMEM97 221447_s_at GLT8D2 217485_x_at PMS2L1 202099_s_at DGCR2 206389_s_at PDE3A 209929_s_at IKBKG 221515_s_at LCMT1 221483_s_at ARPP-19 212712_at CAMSAP1 203172_at FXR2 207505_at PRKG2 210245_at ABCC8 221219_s_at KLHDC4 205453_at HOXB2 220444_at ZNF557 201700_at CCND3 207631_at NBR2 204407_at TTF2 210132_at EF3 209777_s_at SLC19A1 202570_s_at DLGAP4 219729_at PRRX2 202472_at MPI 206616_s_at ADAM22 201377_at UBAP2L 211605_s_at RARA 203793_x_at PCGF2 211208_s_at CASK 210022_at PCGF1 213772_s_at GGA2 206376_at SLC6A15 202380_s_at NKTR 34868_at SMG5 217125_at -- 221049_s_at POLL 218182_s_at CLDN1 217618_x_at HUS1 221297_at GPRC5D 214199_at SFTPD 216928_at TAL1 205631_at KIAA0586 216017_s_at B2 201966_at NDUFS2 214084_x_at LOC648998 /// LOC653361 /// LOC653840 222247_at DXS542 210831_s_at PTGER3 208420_x_at SUPT6H 216627_s_at B4GALT1 211381_x_at SPAG11 213443_at TRADD 219451_at MSRB2 211322_s_at SARDH 218220_at C12orf10 210344_at OSBPL7 213952_s_at ALOX5 220577_at GVIN1 210695_s_at WWOX 211432_s_at TYRO3 222120_at MGC13138 221039_s_at DDEF1 216568_x_at -- 212869_x_at TPT1 222184_at -- 215242_at PIGC 218564_at RFWD3 214327_x_at TPT1 204883_s_at HUS1 212284_x_at TPT1 203918_at PCDH1 211838_x_at PCDHA5 215043_s_at SMA3 /// SMA5 207676_at ONECUT2 214070_s_at ATP10B 213888_s_at TRAF3IP3 209165_at AATF 214390_s_at BCAT1 221818_at INTS5 221358_at NPBWR2 222228_s_at ALKBH4 205950_s_at CA1 211977_at GPR107 217136_at PPIAL4 /// LOC653505 /// LOC653598 209743_s_at ITCH 221233_s_at KIAA1411 222170_at LOC440334 216839_at LAMA2 204283_at FARS2 215231_at ABP1 216222_s_at MYO10 216814_at -- 212087_s_at ERAL1 217321_x_at ATXN3 213847_at PRPH 216819_at -- 217538_at RUTBC1 202865_at DJB12 210192_at ATP8A1 206490_at DLGAP1 222064_s_at AARSD1 207479_at -- 219022_at C12orf43 219688_at BBS7 209423_s_at PHF20 220791_x_at SCN11A 205699_at -- 207465_at -- 32402_s_at SYMPK AFFX- -- PheX-5_at 220967_s_at ZNF696 204884_s_at HUS1 215931_s_at ARFGEF2 217392_at CAPZA1 202513_s_at PPP2R5D 214702_at FN1 205666_at FMO1 214636_at CALCB 212238_at ASXL1 208181_at HIST1H4H 216091_s_at BTRC 215228_at NHLH2 220086_at ZNFN1A5 220507_s_at UPB1 216204_at COMT 205539_at AVIL 210701_at CFDP1 220869_at UBE1L2 204717_s_at SLC29A2 204945_at PTPRN 205334_at S100A1 217048_at -- 206941_x_at SEMA3E 215053_at SRCAP 212523_s_at KIAA0146 221617_at TAF9B 206611_at C2orf27 214222_at DH7 219420_s_at C1orf163 210520_at FETUB
214675_at NUP188 220832_at TLR8 217448_s_at C14orf92 211310_at EZH1 221440_s_at RBBP9 221414_s_at DEFB126 201763_s_at DAXX 206731_at CNKSR2 216658_at -- 215615_x_at RERE 212743_at RCHY1 222048_at ADRBK2 214842_s_at ALB 212743_at RCHY1 204183_s_at ADRBK2 213631_x_at HP 211566_x_at BRE 222176_at PTEN 204514_at DPH2 213909_at LRRC15 201184_s_at CHD4 215611_at TCF12 205355_at ACADSB 221409_at OR2S2 217612_at TIMM50 220793_at SAGE1 215412_x_at PMS2L2 206730_at GRIA3 215430_at GK2 217112_at PDGFB 200029_at RPL19 215560_x_at MTRF1L 210712_at LDHAL6B 216422_at PA2G4 204757_s_at TMEM24 220776_at KCNJ14 210197_at ITPK1 206249_at MAP3K13 220793_at SAGE1 220764_at PPP4R2 209802_at PHLDA2 215768_at SOX5 205115_s_at RBM19 216536_at OR7E19P 214655_at GPR6 207615_s_at C16orf3 211402_x_at NR6A1 203866_at NLE1 219997_s_at COPS7B 205336_at PVALB 207044_at THRB 207254_at SLC15A1 202707_at UMPS 203998_s_at SYT1 220122_at MCTP1 207236_at ZNF345 205741_s_at DT 215652_at 221949_at LOC222070 214675_at NUP188 207772_s_at PRMT8 210712_at LDHAL6B 202508_s_at SP25 214655_at GPR6 200045_at ABCF1 221049_s_at POLL 207797_s_at LRP2BP 219997_s_at COPS7B 205322_s_at MTF1 219928_s_at CABYR 202819_s_at TCEB3 204191_at IFR1 204652_s_at NRF1 219711_at ZNF586 203998_s_at SYT1 215249_at RPL35A 221683_s_at CEP290 215868_x_at SOX5 219316_s_at C14orf58 211402_x_at NR6A1 220070_at JMJD5 214245_at RPS14 208145_at LOC642671 207409_at LECT2 207602_at TMPRSS11D 217612_at TIMM50 201684_s_at C14orf92 207902_at IL5RA 206249_at MAP3K13 210695_s_at WWOX 217454_at LOC203510 216340_s_at CYP2A7P1 220875_at -- 217171_at SMPD1 212092_at PEG10 214842_s_at ALB 37278_at TAZ 221905_at CYLD 214901_at ZNF8 205610_at MYOM1 207459_x_at GYPB 210197_at ITPK1 203866_at NLE1 207045_at FLJ20097 215834_x_at SCARB1 210701_at CFDP1 215768_at SOX5 212308_at CLASP2 213514_s_at DIAPH1 201763_s_at DAXX 217238_s_at ALDOB 216661_x_at CYP2C9 217071_s_at MTHFR 220122_at MCTP1 216422_at PA2G4 211318_s_at RAE1 219198_at GTF3C4 205915_x_at GRIN1 210345_s_at DH9 208281_x_at DAZ1 /// DAZ3 /// DAZ2 /// DAZ4 210476_s_at PRLR 218564_at RFWD3 206731_at CNKSR2 213971_s_at SUZ12 /// SUZ12P 213732_at TCF3 213957_s_at CEP350 204945_at PTPRN 203839_s_at TNK2 205521_at ENDOGL1 214283_at TMEM97 210520_at FETUB 217830_s_at NSFL1C 208537_at EDG5 207331_at CENPF 213909_at LRRC15 218621_at HEMK1 208904_s_at RPS28 /// 207455_at P2RY1 LOC645899 /// LOC646195 /// LOC651434 214557_at PTTG2 220444_at ZNF557 208140_s_at LRRC48 201208_s_at TNFAIP1 207254_at SLC15A1 204283_at FARS2 215656_at LMAN2 202885_s_at PPP2R1B 219810_at VCPIP1 203383_s_at GOLGA1 207545_s_at NUMB 209072_at MBP 215228_at NHLH2 203171_s_at KIAA0409 216043_x_at RAB11FIP3 202550_s_at VAPB 211310_at EZH1 205851_at NME6 219606_at PHF20L1 217721_at -- 215187_at FLJ11292 210005_at GART 205539_at AVIL 207735_at RNF125 216659_at LOC647294 /// 212087_s_at ERAL1 LOC652593 221697_at MAP1LC3C 222184_at -- 217048_at -- 205238_at CXorf34 216718_at C1orf46 214526_x_at PMS2L1 215433_at DPY19L1 219543_at MAWBP 220564_at C10orf59 204883_s_at HUS1 217392_at CAPZA1 217094_s_at ITCH 207465_at -- 214756_x_at PMS2L1 207331_at CENPF 207511_s_at C2orf24 215419_at KIAA1086 219854_at ZNF14 217401_at -- 213893_x_at PMS2L5 /// LOC441259 /// LOC641799 /// LOC641800 /// LOC645243 /// LOC645248 210316_at FLT4 207505_at PRKG2 220049_s_at PDCD1LG2 203436_at RPP30 205106_at MTCP1 205829_at HSD17B1 206490_at DLGAP1 201905_s_at CTDSPL 204884_s_at HUS1 214507_s_at EXOSC2 AFFX-PheX-5_at -- 209677_at PRKCI 44040_at FBXO41 208676_s_at PA2G4 211306_s_at FCAR 207347_at ERCC6 220791_x_at SCN11A 201961_s_at RNF41 220031_at ZA20D1 209029_at COPS7A 216819_at -- 219797_at MGAT4A 215516_at LAMB4 219596_at THAP10 216839_at LAMA2 221984_s_at C2orf17 204267_x_at PKMYT1 222006_at LETM1 215468_at LOC647070 222192_s_at FLJ21820 217136_at PPIAL4 /// 202004_x_at SDHC /// LOC642502 LOC653505 /// LOC653598 220037_s_at XLKD1 217586_x_at -- 206962_x_at -- 218540_at THTPA 204111_at HNMT 215198_s_at CALD1 214681_at GK 217931_at TNRC5 213888_s_at TRAF3IP3 202801_at PRKACA 212284_x_at TPT1 202821_s_at LPP 203015_s_at SSX2IP 208157_at SIM2 204551_s_at AHSG 218636_s_at MAN1B1 214327_x_at TPT1 202924_s_at PLAGL2 220491_at HAMP 219222_at RBKS 210931_at RNF6 213328_at NEK1 219901_at FGD6 214473_x_at PMS2L3 207503_at TCP10 210187_at FKBP1A 219634_at CHST11 200786_at PSMB7 212869_x_at TPT1 209222_s_at OSBPL2 201319_at MRCL3 205355_at ACADSB 219616_at FLJ21963 214481_at HIST1H2AM 208018_s_at HCK 214315_x_at CALR 213273_at ODZ4 221838_at KLHL22 214543_x_at QKI 216315_x_at UBE2V1 /// Kua-UEV 213443_at TRADD 205047_s_at ASNS 208929_x_at RPL13 218026_at CCDC56 221356_x_at P2RX2 204173_at MYL6B 209929_s_at IKBKG 211127_x_at EDA 220673_s_at KIAA1622 207831_x_at DHPS 214649_s_at MTMR2 218711_s_at SDPR 206715_at TFEC 203190_at NDUFS8 201025_at EIF5B 202406_s_at TIAL1 217687_at ADCY2 52651_at COL8A2 221447_s_at GLT8D2 212684_at ZNF3 209826_at EGFL8 /// 201791_s_at DHCR7 LOC653870 212961_x_at CXorf40B 206667_s_at SCAMP1 206801_at NPPB 214117_s_at BTD 218182_s_at CLDN1 203368_at CRELD1 219594_at NINJ2 218658_s_at ACTR8 203652_at MAP3K11 219278_at MAP3K6 221907_at C14orf172 207156_at HIST1H2AG 213688_at CALM1 214460_at LSAMP 204989_s_at ITGB4 65884_at MAN1B1 202055_at KP1 221058_s_at CKLF 217362_x_at HLA-DRB6 202903_at LSM5 219055_at SRBD1 201685_s_at C14orf92 206987_x_at FGF18 209231_s_at DCTN5 201309_x_at C5orf13 212862_at CDS2 203017_s_at SSX2IP 219736_at TRIM36 203227_s_at TSPAN31 212283_at AGRN 207616_s_at TANK 202186_x_at PPP2R5A 221901_at KIAA1644 209527_at EXOSC2 202302_s_at FLJ11021 200868_s_at ZNF313 210933_s_at FSCN1 209247_s_at ABCF2 222148_s_at RHOT1 204089_x_at MAP3K4 213095_x_at AIF1 214695_at UBAP2L 212613_at BTN3A2 215203_at GOLGA4 218013_x_at DCTN4 203189_s_at NDUFS8 210831_s_at PTGER3 218830_at RPL26L1 211776_s_at EPB41L3 221860_at HNRPL 212535_at MEF2A 208523_x_at HIST1H2BI 201594_s_at PPP4R1 218996_at TFPT 58780_s_at FLJ10357 203593_at CD2AP 209658_at CDC16 219125_s_at RAG1AP1 202000_at NDUFA6 218403_at TRIAP1 205479_s_at PLAU 208490_x_at HIST1H2BF 211323_s_at ITPR1 221261_x_at MAGED4 /// LOC653210 210473_s_at GPR125 208527_x_at HIST1H2BE 215051_x_at AIF1 205501_at -- 219078_at GPATC2 209078_s_at TXN2 212371_at C1orf121 206110_at HIST1H3H 200978_at MDH1 202098_s_at PRMT2 202286_s_at TACSTD2 208546_x_at HIST1H2BH 203705_s_at FZD7 208579_x_at H2BFS 216583_x_at -- 219538_at WDR5B 210102_at LOH11CR2A 212744_at BBS4 203177_x_at TFAM 214472_at HIST1H3D 218534_s_at AGGF1 215779_s_at HIST1H2BG 204215_at C7orf23 208180_s_at HIST1H4H 218454_at FLJ22662 214469_at HIST1H2AE 202794_at INPP1 211474_s_at SERPINB6 204037_at EDG2 /// 208583_x_at HIST1H2AJ LOC644923 213233_s_at KLHL9 215978_x_at LOC152719 212222_at PSME4 217775_s_at RDH11 204222_s_at GLIPR1 213789_at -- 204456_s_at GAS1 214455_at HIST1H2BC 211945_s_at ITGB1 209210_s_at PLEKHC1 217798_at CNOT2 203567_s_at TRIM38 203854_at CFI 200982_s_at ANXA6 216231_s_at B2M 209901_x_at AIF1 209083_at CORO1A 215116_s_at DNM1 215411_s_at TRAF3IP2 212314_at KIAA0746 218047_at OSBPL9 210273_at PCDH7 217732_s_at ITM2B 208070_s_at REV3L 204150_at STAB1 208985_s_at EIF3S1 201278_at DAB2 209550_at NDN 213741_s_at KP1 210285_x_at WTAP 201887_at IL13RA1 206117_at TPM1 213716_s_at SECTM1 202693_s_at STK17A 212500_at C10orf22 219179_at DACT1 219140_s_at RBP4 203868_s_at VCAM1 212294_at GNG12 204298_s_at LOX 215313_x_at HLA-A 205698_s_at MAP2K6 220955_x_at RAB23 203300_x_at AP1S2 209191_at TUBB6 210915_x_at TRBV19 /// TRBC1 200033_at DDX5 202810_at DRG1 218396_at VPS13C 204114_at NID2 204364_s_at REEP1 219687_at HHAT 201590_x_at ANXA2 209168_at GPM6B 201060_x_at STOM 212203_x_at IFITM3
213258_at TFPI 202450_s_at CTSK 204244_s_at DBF4 210416_s_at CHEK2 209932_s_at DUT 208146_s_at CPVL 203153_at IFIT1 214252_s_at CLN5 203961_at NEBL 204168_at MGST2 40489_at ATN1 209034_at PNRC1 201280_s_at DAB2 213572_s_at SERPINB1 212586_at CAST 203323_at CAV2 221816_s_at PHF11 219370_at RPRM 201506_at TGFBI 201540_at FHL1 211429_s_at SERPI1 218656_s_at LHFP 210275_s_at ZA20D2 201842_s_at EFEMP1 201061_s_at STOM 209648_x_at SOCS5 222088_s_at SLC2A3 203706_s_at FZD7 201132_at HNRPH2 210139_s_at PMP22 212149_at KIAA0143 214257_s_at SEC22B 214022_s_at IFITM1 218741_at C22orf18 221523_s_at RRAGD 220595_at PDZRN4 201601_x_at IFITM1 202446_s_at PLSCR1 206662_at GLRX 201560_at CLIC4 206332_s_at IFI16 217741_s_at ZA20D2 202609_at EPS8 202936_s_at SOX9 209154_at TAX1BP3 203305_at F13A1 212824_at FUBP3 208296_x_at TNFAIP8 209498_at CEACAM1 217832_at SYNCRIP 212533_at WEE1 213193_x_at TRBV19 /// TRBC1 204472_at GEM 205898_at CX3CR1 200887_s_at STAT1 209170_s_at GPM6B 209488_s_at RBPMS 210986_s_at TPM1 204036_at EDG2 208966_x_at IFI16 202283_at SERPINF1 203640_at MBNL2 203810_at DJB4 210072_at CCL19 213791_at PENK 212230_at PPAP2B 210987_x_at TPM1 205110_s_at FGF13 212097_at CAV1 215716_s_at ATP2B1 200935_at CALR 218162_at OLFML3 201645_at TNC 203710_at ITPR1 211864_s_at FER1L3 204939_s_at PLN 202430_s_at PLSCR1 209487_at RBPMS 202037_s_at SFRP1 204135_at DOC1 206991_s_at CCR5 /// LOC653725 200836_s_at MAP4 209167_at GPM6B 212417_at SCAMP1 210299_s_at FHL1 209288_s_at CDC42EP3 212671_s_at HLA-DQA1 /// HLA-DQA2 /// LOC650946 209684_at RIN2 201310_s_at C5orf13 201196_s_at AMD1 202269_x_at GBP1 201798_s_at FER1L3 204955_at SRPX 201787_at FBLN1 209687_at CXCL12 202291_s_at MGP 219117_s_at FKBP11 207826_s_at ID3 218730_s_at OGN 209291_at ID4 209541_at IGF1 204464_s_at EDNRA 201030_x_at LDHB 204172_at CPOX 217546_at MT1M 203453_at SCNN1A 203932_at HLA-DMB 205498_at GHR 213293_s_at TRIM22 218087_s_at SORBS1 205158_at RSE4 216598_s_at CCL2 213975_s_at LYZ /// LILRB1 221510_s_at GLS 202258_s_at PFAAP5 205097_at SLC26A2 202333_s_at UBE2B 218589_at P2RY5 202935_s_at SOX9 213564_x_at LDHB 214836_x_at IGKC /// IGKV1-5 204070_at RARRES3 206392_s_at RARRES1 218331_s_at C10orf18 204259_at MMP7 217028_at CXCR4 221872_at RARRES1 201650_at KRT19
TABLE-US-00011 TABLE 9 Summary of Use of Independent Prostate Case Sets for Gene Validation p up- down- Validation threshold regulated regulated Significant Tumor Specific Relapse-associated Genes (Data set 1 & 3) data set 1 p < 0.005 332 258 data set 3 p < 0.01 310 147 Number of genes presented in 22283 both data set Number of overlapping significant 15 genes Number of overlapping significant 12 genes agreed in sign p value 0.007 Significant Stroma Specific Relapse-associated Genes (Data set 1 & 3) data set 1 p < 0.005 197 219 data set 3 p < 0.01 200 474 Number of genes presented in both 22283 data set Number of overlapping significant 16 genes Number of overlapping significant 16 genes agreed in sign p value <0.001 Significant Tumor Specific Relapse-associated Genes (Data set 1 & 2) data set 1 p < 0.005 10 20 data set 2 p < 0.2 108 142 Number of genes presented in both 730 data set Number of overlapping significant 13 genes Number of overlapping significant 10 genes agreed in sign p value 0.011
TABLE-US-00012 TABLE 10 Tumor specific relapse related genes, identified by both dataset 1 and dataset 3 using linear model. U133A ID Gene Symbol Genes up-regulated in relapse samples 208180_s_at HIST1H4H 210052_s_at TPX2 219464_at CA14 221189_s_at TARSL1 205699_at -- 215768_at SOX5 Genes down-regulated in relapse 215411_s_at TRAF3IP2 samples 218047_at OSBPL9 212230_at PPAP2B 202037_s_at SFRP1 205498_at GHR 218589_at P2RY5
TABLE-US-00013 TABLE 11 Stroma specific relapse related genes, identified by both dataset 1 and dataset 3 using linear model. U133A ID Gene Symbol Genes up-regulated in relapse 201496_x_at MYH11 samples 201367_s_at ZFP36L2 201495_x_at MYH11 203851_at IGFBP6 218552_at ECHDC2 215116_s_at DNM1 215411_s_at TRAF3IP2 Genes down-regulated in relapse 220791_x_at SCN11A samples 217392_at CAPZA1 220869_at UBE1L2 215768_at SOX5 215652_at 208281_x_at DAZ1 /// DAZ3 /// DAZ2 /// DAZ4 204883_s_at HUS1 214481_at HIST1H2AM 212862_at CDS2
TABLE-US-00014 TABLE 12 Tumor specific relapse related genes, identified by both dataset 1 and dataset 2 using linear model. U133A ID Gene Symbol Genes down-regulated in 209541_at IGF1 relapse samples 212097_at CAV1 212230_at PPAP2B 201061_s_at STOM 203323_at CAV2 201060_x_at STOM 201590_x_at ANXA2 204298_s_at LOX 211945_s_at ITGB1
Example 3
In Silico Estimates of Tissue Components in Cancer Tissue Based on Expression Profiling Data
[0285] This example relates to the use of linear models to predict the tissue component of prostate samples based on microarray data. This strategy can be used to estimate the proportion of tissue components in each case and thereby reduce the impact of tissue proportions as a major source of variability among samples. The prediction model was tested by 10-fold cross validation within each data set, and also by mutual prediction across independent data sets.
[0286] Prostate Cancer Microarray Data Sets:
[0287] Four publicly available prostate cancer data sets (datasets 1 through 4) with pathologist-estimated tissue component information were included in this study (Table 13). For all data sets, four major tissue components (tumor cells, stroma cells, epithelial cells of BPH, and epithelial cells of dilated cystic glands) were determined from sections prepared immediately before and after the sections pooled for RNA preparation by pathologists. The tissue component distributions for the four data sets are shown in Table 13.
[0288] Four publicly available microarray data sets (datasets 5 through 8) also were collected. These included a total of 238 arrays that were generated from 219 tumor enriched and 19 non-tumor parts of prostate tissue, as shown in Table 14. Dataset 5 consists of two groups (37 recurrence and 42 non-recurrence) for a total of 79 cases. The samples used in these four datasets do not have associated details of tissue component information.
[0289] Selection of Genes for Model-Training:
[0290] Subsets of genes were selected to train the prediction model using two strategies. In the first strategy, each gene was ranked by the correlation coefficient between its intensity values and the percentage of a given tissue component across all samples. In the second strategy, the genes were ranked by their F-statistic, a measure of their fit in the multiple linear regression model as described below. The two strategies produced very similar results.
[0291] Multiple Linear Regression Model:
[0292] A multi-variate linear regression model was used for prediction of tissue components. This is based on the assumption that the observed gene expression intensity of a gene is the summation of the contributions from different types of cells:
g = β 0 + j = 1 C β j p j + e , ( 1 ) ##EQU00014##
[0293] where g is the expression value for a gene, pj is the percentage of a given tissue component determined by the pathologists, and βj is the expression coefficient associated with a given cell type. In this model, C is the number of tissue types under consideration. In the current study, only β's of two major tissue types, tumor and stroma, were estimated to minimize the noise caused by other minority cell types. The contribution of other cell types to the total intensity g is subsumed into β0 and e. Note that βj is suggestive of the relative expression level in cell type j compared to the overall mean expression level β0. The regression model was used to predict the percentage of tissue components after the parameters were determined on a training data set.
[0294] Cross-Validation within Data Sets:
[0295] Ten-fold cross-validation was used to estimate the prediction error rates for each data set. Briefly, one tenth of the samples were randomly selected as the test set using a boot strapping strategy and the remaining nine tenths of the samples were used as training set. Prediction models are constructed using the training sets with a pre-defined number of genes selected with the strategy mentioned above. The prediction is then tested on the test set. The sample selection and prediction step are repeated 10 times using different test samples each time until all the samples are used as test samples only once. This whole procedure is repeated five times using different sets of 10% of the data in each iteration to generate reliable results.
[0296] Validation Between Data Sets:
[0297] Mutual predictions were performed among datasets 1, 2, 3 and 4 to assess the applicability of prediction models across different data sets. Because the microarray platforms differ among the four data sets, quantile normalization are applied to preprocess the microarray data (Bolstad et al. (2003) Bioinformatics 19:185-193) with one modification. Quantile normalization method was applied on the test data set with the entire training set as the reference. This change means that the training set that is used to build prediction models will not be re-calculated and the prediction models will likely stay the same.
[0298] The mapping of probe sets from different Affymetrix platforms is based on the array comparison files downloaded from the Affymetrix website (World Wide Web at affymetrix.com). Probe sets of Probes in Affymetrix U133A array are a sublist of those in Affymetrix U133Plus2.0 array, and the DNA sequences of the common probes of two platforms are identical, suggesting these two platforms are very similar. The Illumina DASL platform used in data set 4 only provided gene symbols as the probe annotation, which was used to map to Affymetrix platforms. The numbers of genes mapped among different platforms are shown in Table 15.
[0299] Prediction on Data Sets that do not have Pathologist's Estimates of Tissue Proportions:
[0300] Datasets 5, 6, 7, and 8 do not have previous estimates of tissue composition (Table 14). Datasets 1, 5, and 6 were generated from Affymetrix U133A arrays. Thus, the prediction models constructed with data set 1 were used to predict tissue components of samples used in datasets 5 and 6. Likewise, datasets 2, 7, and 8 were generated with Affymetrix U133Plus2.0 arrays, so prediction models constructed with dataset 2 were used to predict tissue components of samples used in datasets 7 and 8. The modified quantile normalization method described above was used for preprocessing the test data sets.
[0301] Comparison of in Silico Predictions and Pathologist's Estimates within the Same Data Set:
[0302] Four sets of microarray expression data for which tissue percentages had been determined by pathologists (Table 13), were used to develop in silico models that could predict tissue percentages in other samples that had array data but did not have pathologist data on tissue percentages. The discrepancies between in silico predictions and pathologist's estimates were measured by the mean absolute difference between values predicted in silico and the observation values estimated by pathologists. Ten-fold cross-validation was used to estimate the prediction discrepancies for datasets 1, 2, 3 and 4. To determine the best number of genes for constructing prediction model, the most significant 5, 10, 20, 50, 100 or 250 genes were compared. The prediction results are shown in FIGS. 6A and 6B, and Tables 16 and 17.
[0303] Among the four datasets, dataset 1 has the most similar in silico prediction to the pathologist's estimation, with 8% average discrepancy rate for tumor and 16% average discrepancy rate for stroma using the 250-gene model. This may because: 1) this dataset has four pathologists' estimation of tissue components, which will certainly be more accurate than that by one pathologist; 2) fresh frozen tissues were used which generate intact RNA for profiling; and/or 3) relatively larger sample size. Dataset 4 has the least accurate prediction, which may be because: 1) the dataset was generated from degraded total RNA samples from the FFPE blocks; and/or 2) the total number of genes on the Illumina DASL array platform are much less than that of other array platforms (511 probes versus 12626 or more probe sets for the other data sets).
[0304] The predictions of tumor components are slightly better than that of stroma, which may be explained in part by the fact that prostate stroma is a mixture of fibroblast cells, smooth muscle cells, blood vessels et al.
[0305] As shown in FIG. 6, the prediction model does not require many genes. The prediction model can reliable predict tumor components with as few as 10 genes, and predict stroma components with 50 genes.
[0306] Dataset 2 contains twelve laser capture micro-dissected tumor samples, the average in silico predicted tumor components for these samples are 91% in average. Assuming these samples really are all nearly pure tumor then the error rate is 9% or less for these samples, which is close to the average error rates of all samples in dataset 2.
[0307] The possibility of predicting of two other prostate cell types--the epithelial cells of BPH and dilated cystic glands by extending the current multi-variate model--also were explored. It was found that in silico prediction on these two tissue components are much less accurate than tumor and stroma component, largely because their percentage values are usually small and the pathologists differed in their estimates of these tissues. The extended prediction model including these tissues also slightly lowers the prediction accuracy of tumor and stroma components.
[0308] In the original study for dataset 3, agreement analysis on the tissue components that were estimated by four pathologists were assessed as inter-observer Pearson correlation coefficients. The average coefficients for tumor and stroma were 0.92 and 0.77. This is better than the correlation coefficients between in silico prediction and pathologist's estimation for the same dataset, which is 0.72 for the tumor component and 0.57 for stroma component. However, pathologists reviewed the same sections and the tissue components of the adjacent but non-identical samples processed for array assay may differ.
[0309] One indication that the prediction model may be optimized to the limits of the data available is the fact that the discrepancy between in silico predicted tissue components and pathologist's estimate for the predictions made on the test sets is often barely 1% different from that of the predictions made on the training set. See the example of 250-gene model as below. Data on other models were very similar.
[0310] Data set 1 (training/test): tumor 7.6%/8.1%; stroma 11.7%/12.8%.
[0311] Data set 2 (training/test): tumor 8.4%/9.5%; stroma 11.5%/12.5%.
[0312] Data set 3 (training/test): tumor 10.3%/11.4%; stroma 15.2%/17.3%.
[0313] Data set 4 (training/test): tumor 11.9%/12.5%; stroma 14.7%/15.4%.
[0314] To construct the best prediction models from each data set, a 10-fold permutation strategy was adopted to select the most suitable genes to be used in the final prediction model. To construct a n (i.e., 5, 10, 20, 50, 100, 250) gene model for each data set, only nine tenths of randomly chosen samples were used in the multi-variate linear regression analysis for selecting the n most significant genes. This step was repeated nine more times until all the samples were used nine times, which also means that all samples were skipped once. All selected genes (n×10) were pooled and ranked by their incidence. The n genes with the most hits, which are listed in Table 18, were used to construct prediction models that are integrated into CellPred program, as described below.
[0315] Comparison Between in Silico Predictions Across Data Sets and Pathologist's Estimates:
[0316] Discrepancies for predictions made across different data sets are shown in Table 19. The 250-gene model is used for the mutual prediction. The prediction models constructed on fewer genes also were performed, and the prediction was less accurate than the 250-gene model. In general, the in silico predictions across different datasets are less similar to the pathologist's estimates than the in silico prediction made within the same dataset. However, the discrepancy in predictions across datasets is similar to the discrepancy within datasets when the array platforms are very similar (Affymetrix U133A and U133Plus2.0) and sample types are the same (i.e., fresh frozen sample). For the example of datasets 1 and 2, the prediction discrepancy is 11.0% for tumor and 16.7% for stroma when data set 1 was used as a training set, whereas vice versa, the numbers are 11.6% for tumor and 11.8% for stroma. In the case that microarray platforms and sample types vary (between fresh frozen and FFPE, for example), the cross data set prediction error rates increase and vary largely from 12.1% 28.6% for tumor and 14.7% to 38.2% for stroma depending on the comparison. The mutual prediction results strongly suggest that the feasibility of tissue components prediction across data sets when array platform and sample type are the same. For other cases, prediction of tissue percentages is also possible, but has a large error.
[0317] In Silico Prediction of Tissue Components of Samples in Publicly Available Prostate Data Sets:
[0318] The in silico predicted tumor and stroma components of 238 samples used in datasets 5, 6, 7, and 8 are documented in Table 17. When 219 of 238 samples were prepared as tumor-enriched prostate tissue, the in silico predicted tumor proportions for these 219 samples showed a wide range from 0 to 87% tumor cells. There are 44 (20.1%) samples predicted with less than 30% tumor cells, as shown in FIG. 7A. These 44 samples with low amounts of predicted tumor appeared in dataset 5 (5 out of 79 tumor samples, 6.3%), dataset 6 (7 out of 44 tumor samples, 15.9%), dataset 7 (2 out of 13 tumor samples, 15.4%), and dataset 8 (30 out of 83 tumor samples, 36.1%), suggesting a large variation of tumor enrichment occurred in all the different data sets.
[0319] Dataset 5 includes information regarding recurrence of cancer after prostatectomy for patients, which was used to divide the samples into two groups for comparison (Stephenson, supra). The average tumor tissue component predicted for the recurrence group (58.5%) was noted to be about 10% higher than that of non-recurrence group (48.0%), as shown in FIG. 7B. Unless recognized and taken into account, this skew has the potential to provide false data regarding recurrence. Thus, tumor-specific genes are enriched in univariate analysis of the recurrent cases simply because such genes are naturally enriched in samples with more tumor cells.
[0320] To further illustrate this effect, the percentage of tumor predicted on dataset 5 using the dataset 1 in silico model was plotted as the x axis in a heat map with the non-recurrence and recurrence groups plotted separately. The Y axis consists of the expression levels in data set 5 of the top 100 (50 up- and 50 down-regulated) significant differential expressed genes between tumor and normal tissue identified in dataset 6. The gradient effects from left to right on two groups (non-recurrence and recurrence group) of samples from dataset 5 shows that expression levels of tissue specific genes selected from dataset 6 greatly correlate with the in silico predicted tumor contents with the prediction models developed from dataset 1. Moreover, samples in the recurrence group show slightly higher expression levels in up-regulated genes and lower expression level in down-regulated genes (also shown in FIG. 7B), indicating that the tumor components vary among two groups that may cause bias if two groups were compared directly without corrections.
[0321] Software for Prostate Cancer Tissue Prediction:
[0322] CellPred, a web service freely available on the World Wide Web at webarraydb.org, was designed for prediction of the tissue components of prostate samples used in high-throughput expression studies, such as microarrays. CellPred was developed on a LAMP system (a GNU Linux server with Apache, MySQL and Python). The modules were written in python (World Wide Web at python.org) while analysis functions were written in R language (World Wide Web at r-project.org). The R script for modeling/training/prediction is downloadable from the World Wide Web at webarraydb.org/softwares/CellPred/. Users have the option to choose the number of genes for constructing the model. Genes used for generating the model are provided as an output file. Other details about the program can be found in the online help document.
[0323] Users can upload their own data sets for construction of prediction models. However, as an example, data has already been uploaded to allow prediction models constructed on datasets 1, 2 and 3 to be used for making predictions for a user-supplied data set. The user needs to upload the Affymetrix Cel file or any other type of microarray intensity file processed appropriately to make it compatible for making predictions. The most accurate prediction is made for Affymetrix U133A, U133Plus2.0 and U95Av2 array data using the prediction models developed on dataset 1, 2, or 3 respectively. For all other types of microarray platforms, prediction is likely quite noisy. In such cases, probes/probe sets on the platform of the test sets will be mapped to the probes on the training set of choice based on the gene symbols, gene IDs (i.e. GenBank IDs, refSeq IDs) or a mapping file (Xia et al. (2009) Bioinformatics 25:2425-2429). Modified quantile normalization is integrated for preprocessing the intensity values of the test arrays. Then the prediction is made on the test sets using the prediction models constructed with the training set. High-throughput expression sequence tags are accepted by the program if the data are condensed into a file equivalent to an intensity file, along with gene names or IDs that can be mapped to the training data sets.
TABLE-US-00015 TABLE 13 Prostate cancer microarray data sets with known tissue component information. Data Set 1 Data Set 2 Data Set 3 Data Set 4 Microarray Platform U133A U133Plus2 U95Av2 Illumina DASL arrays Sample Type Fresh Fresh Fresh Frozen FFPE Frozen Frozen n. of Arrays 136 149 88 114 Sample Source Prostatectomy 132 110 88 114 Autopsy* 4 13 LCM** 16{circumflex over ( )} Prostate 10 Biopsy Data Source GSE8218 GSE17951 GSE1431*** **** n. of Probes or Probe 22283 54675 12626 511 Sets n. of Pathologists 4 1 4 1 Tumor (%) Maximum 80 100 80 90 Mean 20 26 17 24 Minimum 0 0 0 0 Stroma (%) Maximum 100 100 100 100 Mean 61 63 59 54 Minimum 4 0 4 0 Epithelium from BPH Maximum 50 53 55 60 (%) Mean 11 6 12 14 Minimum 0 0 0 0 Atrophic Gland (%) Maximum 20 49 32 50 Mean 6 4 7 7 Minimum 0 0 0 0 *Autopsy prostate samples from normal subjects. **Laser capture micro-dissected samples; {circumflex over ( )}12 tumor samples and 4 stroma samples. ***Stuart et al., supra **** Bibikova et al. (2007) Genomics 89: 666-672
TABLE-US-00016 TABLE 14 Prostate cancer microarray data sets without known tissue component information. Data Set 5 Data Set 6 Data Set 7 Data Set 8 Array Platform U133A U133A U133Plus2 U133Plus2 n. of Arrays 79 57 19 83 Sample Type Fresh Fresh Frozen Fresh Fresh Frozen Frozen Frozen Tumor-enriched 13 Samples 79 44 83 Stroma Samples 0 13 6 0 Data Source * http://www.ebi.ac.uk/microarray-as/ GSE3225 GSE2109 ae/browse.html?keywords= E-TABM-26
TABLE-US-00017 TABLE 15 In silico tissue components (tumor/stroma) prediction discrepancies (%) and correlation coefficients compared to pathologist's estimates using 10-fold cross validation. Data Set 1 Data Set 2 Data Set 3 Data Set 4 5-gene model Tumor 10.1/0.78 22.9/0.41 16.5/0.48 16.1/0.64 Cells 20.8/0.51 28.4/0.38 31.9/0.16 21.5/0.5 Stroma 10-gene model Tumor 8.5/0.83 12.6/0.84 11.6/0.7 13.7/0.71 Cells 18/0.57 19.6/0.61 21.7/0.52 17.8/0.62 Stroma 20-gene model Tumor 8.2/0.85 11.8/0.86 10.5/0.74 14.7/0.63 Cells 15.9/0.64 16.6/0.72 18.6/0.5 18.6/0.6 Stroma 50-gene model Tumor 8.4/0.86 11.7/0.85 10.9/0.72 13.9/0.69 Cells 13.3/0.72 14.3/0.78 18.3/0.55 16.9/0.66 Stroma 100-gene Tumor 8/0.87 10.6/0.87 10.6/0.75 12.7/0.7 model Cells 12.9/0.74 13.5/0.79 17.1/0.56 15.6/0.7 Stroma 250-gene Tumor 8.1/0.87 9.5/0.9 11.4/0.72 12.5/0.73 model Cells 12.8/0.73 12.5/0.82 17.3/0.57 15.4/0.72 Stroma
TABLE-US-00018 TABLE 16 Number of probes/probe sets mapped across different microarray platforms. Illumina U133A U133Plus2.0 U95Av2 DASL array U133A -- -- -- -- U133Plus2.0 22277 -- -- -- U95Av2 12310 12323 -- -- Illumina DASL array 359 359 330 --
TABLE-US-00019 TABLE 17 In silico predicted tissue components for datasets 5, 6, 7 and 8 (%). Data Sets sample name sample type Platform Tumor Stroma Data Set 5 SL_U133A_PG_12 tumor-enriched samples U133A 75 25 Data Set 5 SL_U133A_PG_42 tumor-enriched samples U133A 42 48 Data Set 5 SL_U133A_PG_45 tumor-enriched samples U133A 42 58 Data Set 5 SL_U133A_PG_50 tumor-enriched samples U133A 70 30 Data Set 5 SL_U133A_PG_53 tumor-enriched samples U133A 31 69 Data Set 5 SL_U133A_PG_8 tumor-enriched samples U133A 38 60 Data Set 5 SL_U133A_PR22.T tumor-enriched samples U133A 61 29 Data Set 5 SL_U133A_PR24.T tumor-enriched samples U133A 63 34 Data Set 5 SL_U133A_PR25.T tumor-enriched samples U133A 61 31 Data Set 5 SL_U133A_PR28.T tumor-enriched samples U133A 35 65 Data Set 5 SL_U133A_PR31.T tumor-enriched samples U133A 52 47 Data Set 5 SL_U133A_PR32.T tumor-enriched samples U133A 60 33 Data Set 5 SL_U133A_PR33.T tumor-enriched samples U133A 39 46 Data Set 5 SL_U133A_PR35.T tumor-enriched samples U133A 62 37 Data Set 5 SL_U133A_PR37.T tumor-enriched samples U133A 77 23 Data Set 5 SL_U133A_PR39.T tumor-enriched samples U133A 31 69 Data Set 5 SL_U133A_PR40.T tumor-enriched samples U133A 47 52 Data Set 5 SL_U133A_PR41.T tumor-enriched samples U133A 25 75 Data Set 5 SL_U133A_PR42.T tumor-enriched samples U133A 61 32 Data Set 5 SL_U133A_PR43.T tumor-enriched samples U133A 66 34 Data Set 5 SL_U133A_PR44.T tumor-enriched samples U133A 35 53 Data Set 5 SL_U133A_PR45.T tumor-enriched samples U133A 37 31 Data Set 5 SL_U133A_PR47.T tumor-enriched samples U133A 66 34 Data Set 5 SL_U133A_PR50.T tumor-enriched samples U133A 48 45 Data Set 5 SL_U133A_PR52.T tumor-enriched samples U133A 69 30 Data Set 5 SL_U133A_PR53.T tumor-enriched samples U133A 56 42 Data Set 5 SL_U133A_PR54.T tumor-enriched samples U133A 65 35 Data Set 5 SL_U133A_PR55.T tumor-enriched samples U133A 25 47 Data Set 5 SL_U133A_PR56.T tumor-enriched samples U133A 51 31 Data Set 5 SL_U133A_PR57.T tumor-enriched samples U133A 27 57 Data Set 5 SL_U133A_PR58.T tumor-enriched samples U133A 33 42 Data Set 5 SL_U133A_PR59.T.REP tumor-enriched samples U133A 32 68 Data Set 5 SL_U133A_PR60.T tumor-enriched samples U133A 55 45 Data Set 5 SL_U133A_PR61.T tumor-enriched samples U133A 60 35 Data Set 5 SL_U133A_PR62.T tumor-enriched samples U133A 24 50 Data Set 5 SL_U133A_PR64.T tumor-enriched samples U133A 45 55 Data Set 5 SL_U133A_PR65.T tumor-enriched samples U133A 57 43 Data Set 5 SL_U133A_PR66.T tumor-enriched samples U133A 53 47 Data Set 5 SL_U133A_PR68.T tumor-enriched samples U133A 45 42 Data Set 5 SL_U133A_PR69.T tumor-enriched samples U133A 33 56 Data Set 5 SL_U133A_PR70.T tumor-enriched samples U133A 29 71 Data Set 5 SL_U133A_PR71.T tumor-enriched samples U133A 35 48 Data Set 5 SL_U133A_PG_13 tumor-enriched samples U133A 67 33 Data Set 5 SL_U133A_PG_15 tumor-enriched samples U133A 33 64 Data Set 5 SL_U133A_PG_37 tumor-enriched samples U133A 72 28 Data Set 5 SL_U133A_PG_41 tumor-enriched samples U133A 59 35 Data Set 5 SL_U133A_PG_46 tumor-enriched samples U133A 49 51 Data Set 5 SL_U133A_PG_52 tumor-enriched samples U133A 64 36 Data Set 5 SL_U133A_PR10.T tumor-enriched samples U133A 60 40 Data Set 5 SL_U133A_PR11.T tumor-enriched samples U133A 35 61 Data Set 5 SL_U133A_PR12.Trpt tumor-enriched samples U133A 46 54 Data Set 5 SL_U133A_PR13.T tumor-enriched samples U133A 60 31 Data Set 5 SL_U133A_PR14.T tumor-enriched samples U133A 41 46 Data Set 5 SL_U133A_PR15.T tumor-enriched samples U133A 52 39 Data Set 5 SL_U133A_PR16.T tumor-enriched samples U133A 87 13 Data Set 5 SL_U133A_PR17.T tumor-enriched samples U133A 61 31 Data Set 5 SL_U133A_PR18.T tumor-enriched samples U133A 73 27 Data Set 5 SL_U133A_PR19.T tumor-enriched samples U133A 68 32 Data Set 5 SL_U133A_PR1.Tredo tumor-enriched samples U133A 39 45 Data Set 5 SL_U133A_PR20.T tumor-enriched samples U133A 57 43 Data Set 5 SL_U133A_PR21.Trep tumor-enriched samples U133A 62 38 Data Set 5 SL_U133A_PR26.T tumor-enriched samples U133A 34 66 Data Set 5 SL_U133A_PR27.T tumor-enriched samples U133A 42 51 Data Set 5 SL_U133A_PR29.T tumor-enriched samples U133A 82 18 Data Set 5 SL_U133A_PR2.Tredo tumor-enriched samples U133A 50 50 Data Set 5 SL_U133A_PR3.TREDO tumor-enriched samples U133A 59 41 Data Set 5 SL_U133A_PR48.T tumor-enriched samples U133A 74 26 Data Set 5 SL_U133A_PR49.T tumor-enriched samples U133A 53 38 Data Set 5 SL_U133A_PR4.TREDO tumor-enriched samples U133A 30 60 Data Set 5 SL_U133A_PR51.T tumor-enriched samples U133A 58 30 Data Set 5 SL_U133A_PR5.TREDO tumor-enriched samples U133A 82 18 Data Set 5 SL_U133A_PR63.T tumor-enriched samples U133A 48 51 Data Set 5 SL_U133A_PR6.TREDO tumor-enriched samples U133A 61 39 Data Set 5 SL_U133A_PR72.T tumor-enriched samples U133A 72 28 Data Set 5 SL_U133A_PR73.T tumor-enriched samples U133A 68 21 Data Set 5 SL_U133A_PR74.B tumor-enriched samples U133A 84 16 Data Set 5 SL_U133A_PR7.TRED02 tumor-enriched samples U133A 49 32 Data Set 5 SL_U133A_PR8.TREDO tumor-enriched samples U133A 76 24 Data Set 5 SL_U133A_PR9.TREDO tumor-enriched samples U133A 56 44 Data Set 6 A-1940339465.CEL tumor-enriched samples U133A 37 33 Data Set 6 A-2393346053.CEL tumor-enriched samples U133A 62 30 Data Set 6 A-3010184133.CEL tumor-enriched samples U133A 67 28 Data Set 6 A-3435720971.CEL tumor-enriched samples U133A 59 35 Data Set 6 A-4418592762.CEL tumor-enriched samples U133A 62 30 Data Set 6 A-4464625690.CEL tumor-enriched samples U133A 12 34 Data Set 6 A-4472570235.CEL tumor-enriched samples U133A 61 36 Data Set 6 A-4917290232.CEL tumor-enriched samples U133A 74 19 Data Set 6 A-4963842013.CEL tumor-enriched samples U133A 18 63 Data Set 6 A-5173529673.CEL tumor-enriched samples U133A 62 38 Data Set 6 A-5292628126.CEL tumor-enriched samples U133A 37 39 Data Set 6 A-5642567629.CEL tumor-enriched samples U133A 80 18 Data Set 6 A-7270793196.CEL tumor-enriched samples U133A 0 84 Data Set 6 A-7350218006.CEL tumor-enriched samples U133A 20 53 Data Set 6 A-8500920543.CEL tumor-enriched samples U133A 44 45 Data Set 6 A-9763059872.CEL tumor-enriched samples U133A 43 36 Data Set 6 111T-A.CEL tumor-enriched samples U133A 44 43 Data Set 6 A-135T.CEL tumor-enriched samples U133A 38 39 Data Set 6 A-169T.CEL tumor-enriched samples U133A 45 49 Data Set 6 A-171T.CEL tumor-enriched samples U133A 62 38 Data Set 6 A-185N.CEL stroma samples U133A 0 69 Data Set 6 185T-A.CEL tumor-enriched samples U133A 49 31 Data Set 6 195T-A.CEL tumor-enriched samples U133A 46 42 Data Set 6 A-226T.CEL tumor-enriched samples U133A 43 46 Data Set 6 A-237T.CEL tumor-enriched samples U133A 37 57 Data Set 6 A-23N.CEL stroma samples U133A 19 78 Data Set 6 A-23T.CEL tumor-enriched samples U133A 48 52 Data Set 6 243T-A.CEL tumor-enriched samples U133A 53 38 Data Set 6 246T-A.CEL tumor-enriched samples U133A 45 55 Data Set 6 A-257T.CEL tumor-enriched samples U133A 58 39 Data Set 6 A-340N.CEL stroma samples U133A 25 52 Data Set 6 340T.CEL tumor-enriched samples U133A 32 68 Data Set 6 357T.CEL tumor-enriched samples U133A 51 49 Data Set 6 362T.CEL tumor-enriched samples U133A 46 54 Data Set 6 370T.CEL tumor-enriched samples U133A 36 50 Data Set 6 A-399N.CEL stroma samples U133A 0 63 Data Set 6 399T.CEL tumor-enriched samples U133A 15 85 Data Set 6 405T.CEL tumor-enriched samples U133A 38 39 Data Set 6 A-EP01N.CEL stroma samples U133A 0 77 Data Set 6 A-EP01T.CEL tumor-enriched samples U133A 24 73 Data Set 6 A-EP02N.CEL stroma samples U133A 5 71 Data Set 6 A-EP02T.CEL tumor-enriched samples U133A 38 62 Data Set 6 A-EP03N.CEL stroma samples U133A 8 56 Data Set 6 A-EP03T.CEL tumor-enriched samples U133A 41 53 Data Set 6 A-EP04N.CEL stroma samples U133A 0 65 Data Set 6 A-EP04T.CEL tumor-enriched samples U133A 30 53 Data Set 6 A-EP06N.CEL stroma samples U133A 0 76 Data Set 6 A-EP06T.CEL tumor-enriched samples U133A 38 61 Data Set 6 A-V16N.CEL stroma samples U133A 7 69 Data Set 6 A-V16T2.CEL tumor-enriched samples U133A 13 73 Data Set 6 A-V19N.CEL stroma samples U133A 0 67 Data Set 6 A-V19T.CEL tumor-enriched samples U133A 32 56 Data Set 6 A-V21N.CEL stroma samples U133A 10 82 Data Set 6 A-V21T.CEL tumor-enriched samples U133A 58 42 Data Set 6 A-V29N.CEL stroma samples U133A 0 82 Data Set 6 A-V29T.CEL tumor-enriched samples U133A 42 38 Data Set 6 A-V30T.CEL tumor-enriched samples U133A 41 30 Data Set 7 GSM74875.CEL stroma samples U133P2 9 91 Data Set 7 GSM74876.CEL stroma samples U133P2 21 68 Data Set 7 GSM74877.CEL stroma samples U133P2 2 98 Data Set 7 GSM74878.CEL stroma samples U133P2 19 76 Data Set 7 GSM74879.CEL stroma samples U133P2 10 90 Data Set 7 GSM74880.CEL stroma samples U133P2 9 91 Data Set 7 GSM74881.CEL tumor-enriched samples U133P2 33 67 Data Set 7 GSM74882.CEL tumor-enriched samples U133P2 26 74 Data Set 7 GSM74883.CEL tumor-enriched samples U133P2 37 63 Data Set 7 GSM74884.CEL tumor-enriched samples U133P2 41 59 Data Set 7 GSM74885.CEL tumor-enriched samples U133P2 32 68 Data Set 7 GSM74886.CEL tumor-enriched samples U133P2 34 66 Data Set 7 GSM74887.CEL tumor-enriched samples U133P2 34 66 Data Set 7 GSM74888.CEL tumor-enriched samples U133P2 82 18 Data Set 7 GSM74889.CEL tumor-enriched samples U133P2 76 24 Data Set 7 GSM74890.CEL tumor-enriched samples U133P2 61 39 Data Set 7 GSM74891.CEL tumor-enriched samples U133P2 59 41 Data Set 7 GSM74892.CEL tumor-enriched samples U133P2 75 25 Data Set 7 GSM74893.CEL tumor-enriched samples U133P2 72 28 Data Set 8 GSM38079.CEL tumor-enriched samples U133P2 29 71 Data Set 8 GSM46837.CEL tumor-enriched samples U133P2 58 42 Data Set 8 GSM46866.CEL tumor-enriched samples U133P2 40 60 Data Set 8 GSM137971.CEL tumor-enriched samples U133P2 54 46 Data Set 8 GSM138038.CEL tumor-enriched samples U133P2 48 36 Data Set 8 GSM152575.CEL tumor-enriched samples U133P2 51 49 Data Set 8 GSM152611.CEL tumor-enriched samples U133P2 64 32 Data Set 8 GSM152617.CEL tumor-enriched samples U133P2 23 73 Data Set 8 GSM152622.CEL tumor-enriched samples U133P2 19 76 Data Set 8 GSM152631.CEL tumor-enriched samples U133P2 20 80 Data Set 8 GSM152772.CEL tumor-enriched samples U133P2 38 62 Data Set 8 GSM152778.CEL tumor-enriched samples U133P2 59 41 Data Set 8 GSM152783.CEL tumor-enriched samples U133P2 36 64 Data Set 8 GSM179790.CEL tumor-enriched samples U133P2 27 73 Data Set 8 GSM179792.CEL tumor-enriched samples U133P2 31 69 Data Set 8 GSM179843.CEL tumor-enriched samples U133P2 28 72 Data Set 8 GSM179849.CEL tumor-enriched samples U133P2 15 85 Data Set 8 GSM102498.CEL tumor-enriched samples U133P2 46 54 Data Set 8 GSM102510.CEL tumor-enriched samples U133P2 35 65 Data Set 8 GSM117726.CEL tumor-enriched samples U133P2 57 43 Data Set 8 GSM117727.CEL tumor-enriched samples U133P2 36 64 Data Set 8 GSM117741.CEL tumor-enriched samples U133P2 29 69 Data Set 8 GSM76640.CEL tumor-enriched samples U133P2 28 49 Data Set 8 GSM76648.CEL tumor-enriched samples U133P2 45 55 Data Set 8 GSM88977.CEL tumor-enriched samples U133P2 57 43 Data Set 8 GSM89017.CEL tumor-enriched samples U133P2 59 41 Data Set 8 GSM102435.CEL tumor-enriched samples U133P2 22 78 Data Set 8 GSM53061.CEL tumor-enriched samples U133P2 32 68 Data Set 8 GSM53114.CEL tumor-enriched samples U133P2 30 60 Data Set 8 GSM53152.CEL tumor-enriched samples U133P2 62 38 Data Set 8 GSM53162.CEL tumor-enriched samples U133P2 67 33 Data Set 8 GSM76516.CEL tumor-enriched samples U133P2 44 56 Data Set 8 GSM76544.CEL tumor-enriched samples U133P2 17 83 Data Set 8 GSM76553.CEL tumor-enriched samples U133P2 55 45 Data Set 8 GSM325799.CEL tumor-enriched samples U133P2 45 55 Data Set 8 GSM325802.CEL tumor-enriched samples U133P2 11 89 Data Set 8 GSM325804.CEL tumor-enriched samples U133P2 33 67 Data Set 8 GSM325810.CEL tumor-enriched samples U133P2 23 77 Data Set 8 GSM353882.CEL tumor-enriched samples U133P2 49 51 Data Set 8 GSM353884.CEL tumor-enriched samples U133P2 19 81 Data Set 8 GSM353891.CEL tumor-enriched samples U133P2 52 48 Data Set 8 GSM353892.CEL tumor-enriched samples U133P2 56 44 Data Set 8 GSM353893.CEL tumor-enriched samples U133P2 29 65 Data Set 8 GSM353894.CEL tumor-enriched samples U133P2 23 61 Data Set 8 GSM353899.CEL tumor-enriched samples U133P2 33 67 Data Set 8 GSM353910.CEL tumor-enriched samples U133P2 44 56 Data Set 8 GSM353917.CEL tumor-enriched samples U133P2 41 59 Data Set 8 GSM353940.CEL tumor-enriched samples U133P2 29 71 Data Set 8 GSM179901.CEL tumor-enriched samples U133P2 56 44 Data Set 8 GSM179903.CEL tumor-enriched samples U133P2 27 73 Data Set 8 GSM179954.CEL tumor-enriched samples U133P2 58 42 Data Set 8 GSM203677.CEL tumor-enriched samples U133P2 17 83 Data Set 8 GSM203707.CEL tumor-enriched samples U133P2 24 76 Data Set 8 GSM203711.CEL tumor-enriched samples U133P2 30 70 Data Set 8 GSM203715.CEL tumor-enriched samples U133P2 37 63 Data Set 8 GSM203722.CEL tumor-enriched samples U133P2 25 75 Data Set 8 GSM203740.CEL tumor-enriched samples U133P2 45 55 Data Set 8 GSM203764.CEL tumor-enriched samples U133P2 47 53 Data Set 8 GSM203778.CEL tumor-enriched samples U133P2 59 39 Data Set 8 GSM203786.CEL tumor-enriched samples U133P2 52 48 Data Set 8 GSM231872.CEL tumor-enriched samples U133P2 57 43 Data Set 8 GSM231876.CEL tumor-enriched samples U133P2 10 90 Data Set 8 GSM231881.CEL tumor-enriched samples U133P2 24 76 Data Set 8 GSM231888.CEL tumor-enriched samples U133P2 28 72 Data Set 8 GSM231894.CEL tumor-enriched samples U133P2 30 70 Data Set 8 GSM231944.CEL tumor-enriched samples U133P2 37 63 Data Set 8 GSM231951.CEL tumor-enriched samples U133P2 23 57 Data Set 8 GSM231957.CEL tumor-enriched samples U133P2 57 43 Data Set 8 GSM231978.CEL tumor-enriched samples U133P2 41 59 Data Set 8 GSM231979.CEL tumor-enriched samples U133P2 36 57 Data Set 8 GSM231990.CEL tumor-enriched samples U133P2 29 71 Data Set 8 GSM277677.CEL tumor-enriched samples U133P2 12 82 Data Set 8 GSM277683.CEL tumor-enriched samples U133P2 55 45 Data Set 8 GSM277694.CEL tumor-enriched samples U133P2 40 60 Data Set 8 GSM301659.CEL tumor-enriched samples U133P2 15 85 Data Set 8 GSM301665.CEL tumor-enriched samples U133P2 3 78 Data Set 8 GSM301666.CEL tumor-enriched samples U133P2 14 66 Data Set 8 GSM301670.CEL tumor-enriched samples U133P2 30 70 Data Set 8 GSM301674.CEL tumor-enriched samples U133P2 16 84 Data Set 8 GSM301679.CEL tumor-enriched samples U133P2 42 58 Data Set 8 GSM301701.CEL tumor-enriched samples U133P2 34 66 Data Set 8 GSM301709.CEL tumor-enriched samples U133P2 46 54 Data Set 8 GSM38053.CEL tumor-enriched samples U133P2 39 61
TABLE-US-00020 TABLE 18 Genes identified by permutation strategy to select the most suitable genes for the final prediction model DataSet geneModel uniqueID Gene Symbol Gene Description Data Set 1 5 gene model 202555_s_at MYLK myosin, light polypeptide kinase /// myosin, light polypeptide kinase Data Set 1 5 gene model 219360_s_at TRPM4 transient receptor potential cation channel, subfamily M, member 4 Data Set 1 5 gene model 209825_s_at UCK2 uridine-cytidine kinase 2 Data Set 1 5 gene model 204973_at GJB1 gap junction protein, beta 1, 32 kDa (connexin 32, Charcot-Marie-Tooth neuropathy, X-linked) Data Set 1 5 gene model 214027_x_at DES /// FAM48A desmin /// family with sequence similarity 48, member A Data Set 1 10 gene model 202222_s_at DES desmin Data Set 1 10 gene model 205547_s_at TAGLN transgelin Data Set 1 10 gene model 203766_s_at LMOD1 leiomodin 1 (smooth muscle) Data Set 1 10 gene model 217728_at S100A6 S100 calcium binding protein A6 (calcyclin) Data Set 1 10 gene model 209825_s_at UCK2 uridine-cytidine kinase 2 Data Set 1 10 gene model 208792_s_at CLU clusterin (complement lysis inhibitor, SP-40,40, sulfated glycoprotein 2, testosterone-repressed prostate message 2, apolipoprotein J) Data Set 1 10 gene model 212412_at PDLIM5 PDZ and LIM domain 5 Data Set 1 10 gene model 219360_s_at TRPM4 transient receptor potential cation channel, subfamily M, member 4 Data Set 1 10 gene model 201061_s_at STOM stomatin Data Set 1 10 gene model 209283_at CRYAB crystallin, alpha B Data Set 1 20 gene model 200982_s_at ANXA6 annexin A6 Data Set 1 20 gene model 218094_s_at C20orf35 chromosome 20 open reading frame 35 Data Set 1 20 gene model 203951_at CNN1 calponin 1, basic, smooth muscle Data Set 1 20 gene model 209356_x_at EFEMP2 EGF-containing fibulin-like extracellular matrix protein 2 Data Set 1 20 gene model 206580_s_at EFEMP2 EGF-containing fibulin-like extracellular matrix protein 2 Data Set 1 20 gene model 201590_x_at ANXA2 annexin A2 Data Set 1 20 gene model 219167_at RASL12 RAS-like, family 12 Data Set 1 20 gene model 201105_at LGALS1 lectin, galactoside-binding, soluble, 1 (galectin 1) Data Set 1 20 gene model 206558_at SIM2 single-minded homolog 2 (Drosophila) Data Set 1 20 gene model 217728_at S100A6 S100 calcium binding protein A6 (calcyclin) Data Set 1 20 gene model 202148_s_at PYCR1 pyrroline-5-carboxylate reductase 1 Data Set 1 20 gene model 205547_s_at TAGLN transgelin Data Set 1 20 gene model 209825_s_at UCK2 uridine-cytidine kinase 2 Data Set 1 20 gene model 212412_at PDLIM5 PDZ and LIM domain 5 Data Set 1 20 gene model 209283_at CRYAB crystallin, alpha B Data Set 1 20 gene model 205645_at REPS2 RALBP1 associated Eps domain containing 2 Data Set 1 20 gene model 203766_s_at LMOD1 leiomodin 1 (smooth muscle) Data Set 1 20 gene model 208792_s_at CLU clusterin (complement lysis inhibitor, SP-40,40, sulfated glycoprotein 2 testosterone-repressed prostate message 2, apolipoprotein J) Data Set 1 20 gene model 201061_s_at STOM stomatin Data Set 1 20 gene model 201820_at KRT5 keratin 5 (epidermolysis bullosa simplex, Dowling-Meara/Kobner/Weber- Cockayne types) Data Set 1 50 gene model 200621_at CSRP1 cysteine and glycine-rich protein 1 Data Set 1 50 gene model 212236_x_at KRT17 keratin 17 Data Set 1 50 gene model 205856_at SLC14A1 solute carrier family 14 (urea transporter), member 1 (Kidd blood group) Data Set 1 50 gene model 207949_s_at ICA1 islet cell autoantigen 1, 69 kDa Data Set 1 50 gene model 205505_at GCNT1 glucosaminyl (N-acetyl) transferase 1, core 2 (beta-1,6-N-acetylglucosa- minyltransferase) Data Set 1 50 gene model 205935_at FOXF1 forkhead box F1 Data Set 1 50 gene model 213503_x_at ANXA2 annexin A2 Data Set 1 50 gene model 210427_x_at ANXA2 annexin A2 Data Set 1 50 gene model 208816_x_at ANXA2P2 annexin A2 pseudogene 2 Data Set 1 50 gene model 203638_s_at FGFR2 fibroblast growth factor receptor 2 (bacteria-expressed kinase, keratinocyte growth factor receptor, craniofacial dysostosis 1, Crouzon syndrome, Pfeiffer syndrome, Jackson-Weiss syndrome) Data Set 1 50 gene model 203892_at WFDC2 WAP four-disulfide core domain 2 Data Set 1 50 gene model 210986_s_at TPM1 tropomyosin 1 (alpha) Data Set 1 50 gene model 202565_s_at SVIL supervillin Data Set 1 50 gene model 203228_at PAFAH1B3 platelet-activating factor acetylhydrolase, isoform Ib, gamma subunit 29 kDa Data Set 1 50 gene model 213288_at OACT2 O-acyltransferase (membrane bound) domain containing 2 Data Set 1 50 gene model 204394_at SLC43A1 solute carrier family 43, member 1 Data Set 1 50 gene model 203243_s_at PDLIM5 PDZ and LIM domain 5 Data Set 1 50 gene model 201431_s_at DPYSL3 dihydropyrimidinase-like 3 Data Set 1 50 gene model 219736_at TRIM36 tripartite motif-containing 36 Data Set 1 50 gene model 201058_s_at MYL9 myosin, light polypeptide 9, regulatory Data Set 1 50 gene model 212509_s_at MXRA7 matrix-remodelling associated 7 Data Set 1 50 gene model 46323_at CANT1 calcium activated nucleotidase 1 Data Set 1 50 gene model 205309_at SMPDL3B sphingomyelin phosphodiesterase, acid-like 3B Data Set 1 50 gene model 209545_s_at RIPK2 receptor-interacting serine-threonine kinase 2 Data Set 1 50 gene model 209763_at CHRDL1 chordin-like 1 Data Set 1 50 gene model 205687_at UBPH ubiquitin-binding protein homolog Data Set 1 50 gene model 202283_at SERPINF1 serpin peptidase inhibitor, clade F (alpha-2 antiplasmin, pigment epithelium derived factor), member 1 Data Set 1 50 gene model 203323_at CAV2 caveolin 2 Data Set 1 50 gene model 210869_s_at MCAM melanoma cell adhesion molecule Data Set 1 50 gene model 212116_at RFP ret finger protein Data Set 1 50 gene model 221732_at CANT1 calcium activated nucleotidase 1 Data Set 1 50 gene model 219478_at WFDC1 WAP four-disulfide core domain 1 Data Set 1 50 gene model 218865_at MOSC1 MOCO sulphurase C-terminal domain containing 1 Data Set 1 50 gene model 200897_s_at KIAA0992 palladin Data Set 1 50 gene model 203632_s_at GPRC5B G protein-coupled receptor, family C, group 5, member B Data Set 1 50 gene model 211576_s_at SLC19A1 solute carrier family 19 (folate transporter), member 1 Data Set 1 50 gene model 212886_at DKFZP434C171 DKFZP434C171 protein Data Set 1 50 gene model 202949_s_at FHL2 four and a half LIM domains 2 Data Set 1 50 gene model 208690_s_at PDLIM1 PDZ and LIM domain 1 (elfin) Data Set 1 50 gene model 217912_at DUS1L dihydrouridine synthase 1-like (S. cerevisiae) Data Set 1 50 gene model 206580_s_at EFEMP2 EGF-containing fibulin-like extracellular matrix protein 2 Data Set 1 50 gene model 212097_at CAV1 caveolin 1, caveolae protein, 22 kDa Data Set 1 50 gene model 202274_at ACTG2 actin, gamma 2, smooth muscle, enteric Data Set 1 50 gene model 212813_at JAM3 junctional adhesion molecule 3 Data Set 1 50 gene model 201105_at LGALS1 lectin, galactoside-binding, soluble, 1 (galectin 1) Data Set 1 50 gene model 201014_s_at PAICS phosphoribosylaminoimidazole carboxylase, phosphoribosyl- aminoimidazole succinocarboxamide synthetase Data Set 1 50 gene model 206558_at SIM2 single-minded homolog 2 (Drosophila) Data Set 1 50 gene model 202440_s_at ST5 suppression of tumorigenicity 5 Data Set 1 50 gene model 200795_at SPARCL1 SPARC-like 1 (mast9, hevin) Data Set 1 50 gene model 212724_at RND3 Rho family GTPase 3 Data Set 1 100 gene model 202740_at ACY1 aminoacylase 1 Data Set 1 100 gene model 204400_at EFS embryonal Fyn-associated substrate Data Set 1 100 gene model 204570_at COX7A1 cytochrome c oxidase subunit VIIa polypeptide 1 (muscle) Data Set 1 100 gene model 201272_at AKR1B1 aldo-keto reductase family 1, member B1 (aldose reductase) Data Set 1 100 gene model 201284_s_at APEH N-acylaminoacyl-peptide hydrolase Data Set 1 100 gene model 214156_at MYRIP myosin VIIA and Rab interacting protein Data Set 1 100 gene model 203562_at FEZ1 fasciculation and elongation protein zeta 1 (zygin I) Data Set 1 100 gene model 209170_s_at GPM6B glycoprotein M6B Data Set 1 100 gene model 202429_s_at PPP3CA protein phosphatase 3 (formerly 2B), catalytic subunit, alpha isoform (calcineurin A alpha) Data Set 1 100 gene model 212680_x_at PPP1R14B protein phosphatase 1, regulatory (inhibitor) subunit 14B Data Set 1 100 gene model 213996_at YPEL1 yippee-like 1 (Drosophila) Data Set 1 100 gene model 200700_s_at KDELR2 KDEL (Lys-Asp-Glu-Leu) endoplasmic reticulum protein retention receptor 2 Data Set 1 100 gene model 216565_x_at LOC391020 similar to Interferon-induced transmembrane protein 3 (Interferon- inducible protein 1-8U) Data Set 1 100 gene model 213001_at ANGPTL2 angiopoietin-like 2 Data Set 1 100 gene model 221586_s_at E2F5 E2F transcription factor 5, p130-binding Data Set 1 100 gene model 200971_s_at SERP1 stress-associated endoplasmic reticulum protein 1 Data Set 1 100 gene model 200923_at LGALS3BP lectin, galactoside-binding, soluble, 3 binding protein Data Set 1 100 gene model 202073_at OPTN optineurin Data Set 1 100 gene model 203498_at DSCR1L1 Down syndrome critical region gene 1-like 1 Data Set 1 100 gene model 206860_s_at FLJ20323 hypothetical protein FLJ20323 Data Set 1 100 gene model 217973_at DCXR dicarbonyl/L-xylulose reductase Data Set 1 100 gene model 209616_s_at CES1 carboxylesterase 1 (monocyte/macrophage serine esterase 1) Data Set 1 100 gene model 204754_at HLF Hepatic leukemia factor Data Set 1 100 gene model 209550_at NDN necdin homolog (mouse) Data Set 1 100 gene model 208131_s_at PTGIS prostaglandin I2 (prostacyclin) synthase /// prostaglandin I2 (prostacyclin) synthase Data Set 1 100 gene model 203729_at EMP3 epithelial membrane protein 3 Data Set 1 100 gene model 203892_at WFDC2 WAP four-disulfide core domain 2 Data Set 1 100 gene model 202794_at INPP1 inositol polyphosphate-1-phosphatase Data Set 1 100 gene model 209210_s_at PLEKHC1 pleckstrin homology domain containing, family C (with FERM domain) member 1 Data Set 1 100 gene model 209191_at TUBB6 tubulin, beta 6 Data Set 1 100 gene model 217897_at FXYD6 FXYD domain containing ion transport regulator 6 Data Set 1 100 gene model 209434_s_at PPAT phosphoribosyl pyrophosphate amidotransferase Data Set 1 100 gene model 202427_s_at BRP44 brain protein 44 Data Set 1 100 gene model 204041_at MAOB monoamine oxidase B Data Set 1 100 gene model 202177_at GAS6 growth arrest-specific 6 Data Set 1 100 gene model 212067_s_at C1R complement component 1, r subcomponent Data Set 1 100 gene model 214247_s_at DKK3 dickkopf homolog 3 (Xenopus laevis) Data Set 1 100 gene model 205780_at BIK BCL2-interacting killer (apoptosis-inducing) Data Set 1 100 gene model 205776_at FMO5 flavin containing monooxygenase 5 Data Set 1 100 gene model 220192_x_at SPDEF SAM pointed domain containing ets transcription factor Data Set 1 100 gene model 218922_s_at LASS4 LAG1 longevity assurance homolog 4 (S. cerevisiae) Data Set 1 100 gene model 200907_s_at KIAA0992 palladin Data Set 1 100 gene model 207836_s_at RBPMS RNA binding protein with multiple splicing Data Set 1 100 gene model 203638_s_at FGFR2 fibroblast growth factor receptor 2 (bacteria-expressed kinase, keratinocyte growth factor receptor, craniofacial dysostosis 1, Crouzon syndrome, Pfeiffer syndrome, Jackson-Weiss syndrome) Data Set 1 100 gene model 203242_s_at PDLIM5 PDZ and LIM domain 5 Data Set 1 100 gene model 209624_s_at MCCC2 methylcrotonoyl-Coenzyme A carboxylase 2 (beta) Data Set 1 100 gene model 212736_at C16orf45 chromosome 16 open reading frame 45 Data Set 1 100 gene model 206116_s_at TPM1 tropomyosin 1 (alpha) Data Set 1 100 gene model 212843_at NCAM1 neural cell adhesion molecule 1 Data Set 1 100 gene model 202947_s_at GYPC glycophorin C (Gerbich blood group) Data Set 1 100 gene model 207876_s_at FLNC filamin C, gamma (actin binding protein 280) Data Set 1 100 gene model 204069_at MEIS1 Meis1, myeloid ecotropic viral integration site 1 homolog (mouse) Data Set 1 100 gene model 209087_x_at MCAM melanoma cell adhesion molecule Data Set 1 100 gene model 212236_x_at KRT17 keratin 17 Data Set 1 100 gene model 204394_at SLC43A1 solute carrier family 43, member 1 Data Set 1 100 gene model 212115_at C16orf34 chromosome 16 open reading frame 34 Data Set 1 100 gene model 202074_s_at OPTN optineurin Data Set 1 100 gene model 222043_at CLU clusterin (complement lysis inhibitor, SP-40,40, sulfated glycoprotein 2, testosterone-repressed prostate message 2, apolipoprotein J) Data Set 1 100 gene model 206858_s_at HOXC6 homeo box C6 Data Set 1 100 gene model 218418_s_at ANKRD25 ankyrin repeat domain 25 Data Set 1 100 gene model 213924_at MPPE1 Metallophosphoesterase 1 Data Set 1 100 gene model 202504_at TRIM29 tripartite motif-containing 29
Data Set 1 100 gene model 205937_at CGREF1 cell growth regulator with EF-hand domain 1 Data Set 1 100 gene model 208837_at TMED3 transmembrane emp24 protein transport domain containing 3 Data Set 1 100 gene model 216804_s_at PDLIM5 PDZ and LIM domain 5 Data Set 1 100 gene model 203911_at RAP1GA1 RAP1, GTPase activating protein 1 Data Set 1 100 gene model 210299_s_at FHL1 four and a half LIM domains 1 Data Set 1 100 gene model 210427_x_at ANXA2 annexin A2 Data Set 1 100 gene model 210987_x_at TPM1 tropomyosin 1 (alpha) Data Set 1 100 gene model 210243_s_at B4GALT3 UDP-Gal:betaGlcNAc beta 1,4-galactosyltransferase, polypeptide 3 Data Set 1 100 gene model 209665_at CYB561D2 cytochrome b-561 domain containing 2 Data Set 1 100 gene model 210986_s_at TPM1 tropomyosin 1 (alpha) Data Set 1 100 gene model 203243_s_at PDLIM5 PDZ and LIM domain 5 Data Set 1 100 gene model 205856_at SLC14A1 solute carrier family 14 (urea transporter), member 1 (Kidd blood group) Data Set 1 100 gene model 200974_at ACTA2 actin, alpha 2, smooth muscle, aorta Data Set 1 100 gene model 202283_at SERPINF1 serpin peptidase inhibitor, clade F (alpha-2 antiplasmin, pigment epithelium derived factor), member 1 Data Set 1 100 gene model 209545_s_at RIPK2 receptor-interacting serine-threonine kinase 2 Data Set 1 100 gene model 203228_at PAFAH1B3 platelet-activating factor acetylhydrolase, isoform Ib, gamma subunit 29 kDa Data Set 1 100 gene model 201058_s_at MYL9 myosin, light polypeptide 9, regulatory Data Set 1 100 gene model 205309_at SMPDL3B sphingomyelin phosphodiesterase, acid-like 3B Data Set 1 100 gene model 212116_at RFP ret finger protein Data Set 1 100 gene model 212509_s_at MXRA7 matrix-remodelling associated 7 Data Set 1 100 gene model 209118_s_at TUBA3 tubulin, alpha 3 Data Set 1 100 gene model 202565_s_at SVIL supervillin Data Set 1 100 gene model 218865_at MOSC1 MOCO sulphurase C-terminal domain containing 1 Data Set 1 100 gene model 203632_s_at GPRC5B G protein-coupled receptor, family C, group 5, member B Data Set 1 100 gene model 201431_s_at DPYSL3 dihydropyrimidinase-like 3 Data Set 1 100 gene model 207949_s_at ICA1 islet cell autoantigen 1, 69 kDa Data Set 1 100 gene model 209948_at KCNMB1 potassium large conductance calcium-activated channel, subfamily M, beta member 1 Data Set 1 100 gene model 209426_s_at AMACR alpha-methylacyl-CoA racemase Data Set 1 100 gene model 209424_s_at AMACR alpha-methylacyl-CoA racemase Data Set 1 100 gene model 209425_at AMACR alpha-methylacyl-CoA racemase Data Set 1 100 gene model 204083_s_at TPM2 tropomyosin 2 (beta) Data Set 1 100 gene model 204934_s_at HPN hepsin (transmembrane protease, serine 1) Data Set 1 100 gene model 211276_at TCEAL2 transcription elongation factor A (SII)-like 2 Data Set 1 100 gene model 201061_s_at STOM stomatin Data Set 1 100 gene model 204973_at GJB1 gap junction protein, beta 1, 32 kDa (connexin 32, Charcot-Marie-Tooth neuropathy, X-linked) Data Set 1 100 gene model 200824_at GSTP1 glutathione S-transferase pi Data Set 1 100 gene model 202555_s_at MYLK myosin, light polypeptide kinase /// myosin, light polypeptide kinase Data Set 1 100 gene model 214027_x_at DES /// FAM48A desmin /// family with sequence similarity 48, member A Data Set 1 250 gene model 222199_s_at BIN3 bridging integrator 3 Data Set 1 250 gene model 209623_at MCCC2 methylcrotonoyl-Coenzyme A carboxylase 2 (beta) Data Set 1 250 gene model 202889_x_at MAP7 microtubule-associated protein 7 Data Set 1 250 gene model 200862_at DHCR24 24-dehydrocholesterol reductase Data Set 1 250 gene model 217736_s_at EIF2AK1 eukaryotic translation initiation factor 2-alpha kinase 1 Data Set 1 250 gene model 209813_x_at TRGC2 /// TRGV9 T cell receptor gamma constant 2 /// T cell receptor gamma constant 2 /// /// LOC442532 /// T cell receptor gamma variable 9 /// T cell receptor gamma variable 9 /// LOC442670 /// similar to T-cell receptor gamma chain C region PT-gamma-1/2 /// similar TARP to T-cell receptor gamma chain C region PT-gamma-1/2 /// similar to T-cell receptor gamma chain V region PT-gamma-1/2 precursor /// similar to T-cell receptor gamma chain V region PT-gamma-1/2 precursor /// TCR gamma alternate reading frame protein /// TCR gamma alternate reading frame protein Data Set 1 250 gene model 215806_x_at TRGC2 /// TRGV9 T cell receptor gamma constant 2 /// T cell receptor gamma variable 9 /// /// LOC442532 /// similar to T-cell receptor gamma chain C region PT-gamma-1/2 /// similar to LOC442670 /// T-cell receptor gamma chain V region PT-gamma-1/2 precursor /// TCR TARP gamma alternate reading frame protein Data Set 1 250 gene model 222121_at SGEF Src homology 3 domain-containing guanine nucleotide exchange factor Data Set 1 250 gene model 216920_s_at TRGC2 /// TRGV9 T cell receptor gamma constant 2 /// T cell receptor gamma variable 9 /// LOC442532 /// /// similar to T-cell receptor gamma chain C region PT-gamma-1/2 /// LOC442670 /// similar to T-cell receptor gamma chain V region PT-gamma-1/2 precursor TARP /// TCR gamma alternate reading frame protein Data Set 1 250 gene model 202729_s_at LTBP1 latent transforming growth factor beta binding protein 1 Data Set 1 250 gene model 204667_at FOXA1 forkhead box A1 Data Set 1 250 gene model 209584_x_at APOBEC3C apolipoprotein B mRNA editing enzyme, catalytic polypeptide-like 3C Data Set 1 250 gene model 203662_s_at TMOD1 tropomodulin 1 Data Set 1 250 gene model 203629_s_at COG5 component of oligomeric golgi complex 5 Data Set 1 250 gene model 201839_s_at TACSTD1 tumor-associated calcium signal transducer 1 Data Set 1 250 gene model 201128_s_at ACLY ATP citrate lyase Data Set 1 250 gene model 214106_s_at GMDS GDP-mannose 4,6-dehydratase Data Set 1 250 gene model 210224_at MR1 major histocompatibility complex, class I-related Data Set 1 250 gene model 202071_at SDC4 syndecan 4 (amphiglycan, ryudocan) Data Set 1 250 gene model 214733_s_at YIPF1 Yip1 domain family, member 1 Data Set 1 250 gene model 219806_s_at FN5 FN5 protein Data Set 1 250 gene model 213506_at F2RL1 coagulation factor II (thrombin) receptor-like 1 Data Set 1 250 gene model 221565_s_at FAM26B family with sequence similarity 26, member B Data Set 1 250 gene model 219920_s_at GMPPB GDP-mannose pyrophosphorylase B Data Set 1 250 gene model 221027_s_at PLA2G12A phospholipase A2, group XIIA /// phospholipase A2, group XIIA Data Set 1 250 gene model 209086_x_at MCAM melanoma cell adhesion molecule Data Set 1 250 gene model 207957_s_at PRKCB1 Protein kinase C, beta 1 Data Set 1 250 gene model 221880_s_at LOC400451 hypothetical gene supported by AK075564; BC060873 Data Set 1 250 gene model 221669_s_at ACAD8 acyl-Coenzyme A dehydrogenase family, member 8 Data Set 1 250 gene model 205248_at C21orf5 chromosome 21 open reading frame 5 Data Set 1 250 gene model 206656_s_at C20orf3 chromosome 20 open reading frame 3 Data Set 1 250 gene model 202566_s_at SVIL supervillin Data Set 1 250 gene model 214765_s_at ASAHL N-acylsphingosine amidohydrolase (acid ceramidase)-like Data Set 1 250 gene model 210652_s_at C1orf34 chromosome 1 open reading frame 34 Data Set 1 250 gene model 202202_s_at LAMA4 laminin, alpha 4 Data Set 1 250 gene model 201605_x_at CNN2 calponin 2 Data Set 1 250 gene model 212551_at CAP2 CAP, adenylate cyclase-associated protein, 2 (yeast) Data Set 1 250 gene model 201136_at PLP2 proteolipid protein 2 (colonic epithelium-enriched) Data Set 1 250 gene model 218328_at COQ4 coenzyme Q4 homolog (yeast) Data Set 1 250 gene model 219786_at MTL5 metallothionein-like 5, testis-specific (tesmin) Data Set 1 250 gene model 206375_s_at HSPB3 heat shock 27 kDa protein 3 Data Set 1 250 gene model 212563_at BOP1 block of proliferation 1 Data Set 1 250 gene model 218792_s_at BSPRY B-box and SPRY domain containing Data Set 1 250 gene model 209270_at LAMB3 laminin, beta 3 Data Set 1 250 gene model 221898_at PDPN podoplanin Data Set 1 250 gene model 206110_at HIST1H3H histone 1, H3h Data Set 1 250 gene model 213547_at CAND2 cullin-associated and neddylation-dissociated 2 (putative) Data Set 1 250 gene model 204345_at COL16A1 collagen, type XVI, alpha 1 Data Set 1 250 gene model 208579_x_at H2BFS H2B histone family, member S Data Set 1 250 gene model 205850_s_at GABRB3 gamma-aminobutyric acid (GABA) A receptor, beta 3 Data Set 1 250 gene model 205304_s_at KCNJ8 potassium inwardly-rectifying channel, subfamily J, member 8 Data Set 1 250 gene model 201284_s_at APEH N-acylaminoacyl-peptide hydrolase Data Set 1 250 gene model 208490_x_at HIST1H2BF histone 1, H2bf Data Set 1 250 gene model 218944_at PYCRL pyrroline-5-carboxylate reductase-like Data Set 1 250 gene model 209154_at TAX1BP3 Tax1 (human T-cell leukemia virus type I) binding protein 3 Data Set 1 250 gene model 215380_s_at C7orf24 chromosome 7 open reading frame 24 Data Set 1 250 gene model 219517_at ELL3 elongation factor RNA polymerase II-like 3 Data Set 1 250 gene model 213275_x_at CTSB cathepsin B Data Set 1 250 gene model 201300_s_at PRNP prion protein (p27-30) (Creutzfeld-Jakob disease, Gerstmann- Strausler-Scheinker syndrome, fatal familial insomnia) Data Set 1 250 gene model 204294_at AMT aminomethyltransferase (glycine cleavage system protein T) Data Set 1 250 gene model 219935_at ADAMTS5 ADAM metallopeptidase with thrombospondin type 1 motif, 5 (aggrecanase-2) Data Set 1 250 gene model 201030_x_at LDHB lactate dehydrogenase B Data Set 1 250 gene model 217890_s_at PARVA parvin, alpha Data Set 1 250 gene model 213148_at LOC257407 hypothetical protein LOC257407 Data Set 1 250 gene model 203931_s_at MRPL12 mitochondrial ribosomal protein L12 Data Set 1 250 gene model 214077_x_at MEIS4 Meis1, myeloid ecotropic viral integration site 1 homolog 4 (mouse) Data Set 1 250 gene model 221505_at ANP32E acidic (leucine-rich) nuclear phosphoprotein 32 family, member E Data Set 1 250 gene model 218087_s_at SORBS1 sorbin and SH3 domain containing 1 Data Set 1 250 gene model 217764_s_at RAB31 RAB31, member RAS oncogene family Data Set 1 250 gene model 205011_at LOH11CR2A loss of heterozygosity, 11, chromosomal region 2, gene A Data Set 1 250 gene model 213293_s_at TRIM22 tripartite motif-containing 22 Data Set 1 250 gene model 204231_s_at FAAH fatty acid amide hydrolase Data Set 1 250 gene model 200878_at EPAS1 endothelial PAS domain protein 1 Data Set 1 250 gene model 203296_s_at ATP1A2 ATPase, Na+/K+ transporting, alpha 2 (+) polypeptide Data Set 1 250 gene model 202724_s_at FOXO1A forkhead box O1A (rhabdomyosarcoma) Data Set 1 250 gene model 201952_at ALCAM activated leukocyte cell adhesion molecule Data Set 1 250 gene model 208658_at PDIA4 protein disulfide isomerase family A, member 4 Data Set 1 250 gene model 203857_s_at PDIA5 protein disulfide isomerase family A, member 5 Data Set 1 250 gene model 219395_at RBM35B RNA binding motif protein 35B Data Set 1 250 gene model 209776_s_at SLC19A1 solute carrier family 19 (folate transporter), member 1 Data Set 1 250 gene model 209806_at HIST1H2BK histone 1, H2bk Data Set 1 250 gene model 211144_x_at TRGC2 T cell receptor gamma constant 2 Data Set 1 250 gene model 216905_s_at ST14 suppression of tumorigenicity 14 (colon carcinoma, matriptase, epithin) Data Set 1 250 gene model 218275_at SLC25A10 solute carrier family 25 (mitochondrial carrier; dicarboxylate transporter), member 10 Data Set 1 250 gene model 203921_at CHST2 carbohydrate (N-acetylglucosamine-6-O) sulfotransferase 2 Data Set 1 250 gene model 202429_s_at PPP3CA protein phosphatase 3 (formerly 2B), catalytic subunit, alpha isoform (calcineurin A alpha) Data Set 1 250 gene model 201185_at HTRA1 HtrA serine peptidase 1 Data Set 1 250 gene model 204141_at TUBB2 tubulin, beta 2 Data Set 1 250 gene model 219561_at COPZ2 coatomer protein complex, subunit zeta 2 Data Set 1 250 gene model 204123_at LIG3 ligase III, DNA, ATP-dependent Data Set 1 250 gene model 204777_s_at MAL mal, T-cell differentiation protein Data Set 1 250 gene model 205157_s_at KRT17 keratin 17 Data Set 1 250 gene model 212347_x_at MXD4 MAX dimerization protein 4 Data Set 1 250 gene model 213143_at LOC257407 hypothetical protein LOC257407 Data Set 1 250 gene model 202920_at ANK2 ankyrin 2, neuronal Data Set 1 250 gene model 217551_at LOC441453 similar to olfactory receptor, family 7, subfamily A, member 17 Data Set 1 250 gene model 212233_at MAP1B Microtubule-associated protein 1B /// Homo sapiens, clone IMAGE: 5535936, mRNA
Data Set 1 250 gene model 205429_s_at MPP6 membrane protein, palmitoylated 6 (MAGUK p55 subfamily member 6) Data Set 1 250 gene model 202180_s_at MVP major vault protein Data Set 1 250 gene model 213982_s_at RABGAP1L RAB GTPase activating protein 1-like Data Set 1 250 gene model 211126_s_at CSRP2 cysteine and glycine-rich protein 2 Data Set 1 250 gene model 205132_at ACTC actin, alpha, cardiac muscle Data Set 1 250 gene model 213071_at DPT dermatopontin Data Set 1 250 gene model 208430_s_at DTNA dystrobrevin, alpha Data Set 1 250 gene model 206453_s_at NDRG2 NDRG family member 2 Data Set 1 250 gene model 218979_at C9orf76 chromosome 9 open reading frame 76 Data Set 1 250 gene model 220751_s_at C5orf4 chromosome 5 open reading frame 4 Data Set 1 250 gene model 213564_x_at LDHB lactate dehydrogenase B Data Set 1 250 gene model 209651_at TGFB1I1 transforming growth factor beta 1 induced transcript 1 Data Set 1 250 gene model 218224_at PNMA1 paraneoplastic antigen MA1 Data Set 1 250 gene model 203219_s_at APRT adenine phosphoribosyltransferase Data Set 1 250 gene model 201798_s_at FER1L3 fer-1-like 3, myoferlin (C. elegans) Data Set 1 250 gene model 201462_at SCRN1 secernin 1 Data Set 1 250 gene model 212254_s_at DST dystonin Data Set 1 250 gene model 204352_at TRAF5 TNF receptor-associated factor 5 Data Set 1 250 gene model 201583_s_at SEC23B Sec23 homolog B (S. cerevisiae) Data Set 1 250 gene model 218073_s_at TMEM48 transmembrane protein 48 Data Set 1 250 gene model 209934_s_at ATP2C1 ATPase, Ca++ transporting, type 2C, member 1 Data Set 1 250 gene model 204099_at SMARCD3 SWI/SNF related, matrix associated, actin dependent regulator of chromatin, subfamily d, member 3 Data Set 1 250 gene model 205128_x_at PTGS1 prostaglandin-endoperoxide synthase 1 (prostaglandin G/H synthase and cyclooxygenase) Data Set 1 250 gene model 219127_at MGC11242 hypothetical protein MGC11242 Data Set 1 250 gene model 203281_s_at UBE1L ubiquitin-activating enzyme E1-like Data Set 1 250 gene model 203705_s_at FZD7 frizzled homolog 7 (Drosophila) Data Set 1 250 gene model 217979_at TM4SF13 Tetraspanin 13 Data Set 1 250 gene model 823_at CX3CL1 chemokine (C--X3--C motif) ligand 1 Data Set 1 250 gene model 210298_x_at FHL1 four and a half LIM domains 1 Data Set 1 250 gene model 208789_at PTRF polymerase I and transcript release factor Data Set 1 250 gene model 221016_s_at TCF7L1 transcription factor 7-like 1 (T-cell specific, HMG-box) /// transcription factor 7-like 1 (T-cell specific, HMG-box) Data Set 1 250 gene model 200807_s_at HSPD1 heat shock 60 kDa protein 1 (chaperonin) Data Set 1 250 gene model 201900_s_at AKR1A1 aldo-keto reductase family 1, member A1 (aldehyde reductase) Data Set 1 250 gene model 202269_x_at GBP1 guanylate binding protein 1, interferon-inducible, 67 kDa /// guanylate binding protein 1, interferon-inducible, 67 kDa Data Set 1 250 gene model 204793_at GPRASP1 G protein-coupled receptor associated sorting protein 1 Data Set 1 250 gene model 212187_x_at PTGDS prostaglandin D2 synthase 21 kDa (brain) Data Set 1 250 gene model 201923_at PRDX4 peroxiredoxin 4 Data Set 1 250 gene model 210751_s_at RGN regucalcin (senescence marker protein-30) Data Set 1 250 gene model 209288_s_at CDC42EP3 CDC42 effector protein (Rho GTPase binding) 3 Data Set 1 250 gene model 207414_s_at PCSK6 proprotein convertase subtilisin/kexin type 6 Data Set 1 250 gene model 204875_s_at GMDS GDP-mannose 4,6-dehydratase Data Set 1 250 gene model 219405_at TRIM68 tripartite motif-containing 68 Data Set 1 250 gene model 205364_at ACOX2 acyl-Coenzyme A oxidase 2, branched chain Data Set 1 250 gene model 214404_x_at SPDEF SAM pointed domain containing ets transcription factor Data Set 1 250 gene model 202732_at PKIG protein kinase (cAMP-dependent, catalytic) inhibitor gamma Data Set 1 250 gene model 212463_at CD59 CD59 antigen p18-20 (antigen identified by monoclonal antibodies 16.3A5, EJ16, EJ30, EL32 and G344) Data Set 1 250 gene model 217762_s_at RAB31 RAB31, member RAS oncogene family Data Set 1 250 gene model 201850_at CAPG capping protein (actin filament), gelsolin-like Data Set 1 250 gene model 217763_s_at RAB31 RAB31, member RAS oncogene family Data Set 1 250 gene model 213010_at PRKCDBP protein kinase C, delta binding protein Data Set 1 250 gene model 219518_s_at ELL3 elongation factor RNA polymerase II-like 3 Data Set 1 250 gene model 201689_s_at TPD52 tumor protein D52 Data Set 1 250 gene model 214505_s_at FHL1 four and a half LIM domains 1 Data Set 1 250 gene model 201601_x_at IFITM1 interferon induced transmembrane protein 1 (9-27) Data Set 1 250 gene model 209074_s_at TU3A TU3A protein Data Set 1 250 gene model 218427_at SDCCAG3 serologically defined colon cancer antigen 3 Data Set 1 250 gene model 204753_s_at HLF hepatic leukemia factor Data Set 1 250 gene model 214598_at CLDN8 claudin 8 Data Set 1 250 gene model 201631_s_at IER3 immediate early response 3 Data Set 1 250 gene model 204400_at EFS embryonal Fyn-associated substrate Data Set 1 250 gene model 217771_at GOLPH2 golgi phosphoprotein 2 Data Set 1 250 gene model 219152_at PODXL2 podocalyxin-like 2 Data Set 1 250 gene model 202454_s_at ERBB3 v-erb-b2 erythroblastic leukemia viral oncogene homolog 3 (avian) Data Set 1 250 gene model 214039_s_at LAPTM4B lysosomal associated protein transmembrane 4 beta Data Set 1 250 gene model 205303_at KCNJ8 potassium inwardly-rectifying channel, subfamily J, member 8 Data Set 1 250 gene model 209583_s_at CD200 CD200 antigen Data Set 1 250 gene model 205743_at STAC SH3 and cysteine rich domain Data Set 1 250 gene model 204284_at PPP1R3C protein phosphatase 1, regulatory (inhibitor) subunit 3C Data Set 1 250 gene model 218611_at IER5 immediate early response 5 Data Set 1 250 gene model 207030_s_at CSRP2 cysteine and glycine-rich protein 2 Data Set 1 250 gene model 201690_s_at TPD52 tumor protein D52 Data Set 1 250 gene model 214091_s_at GPX3 glutathione peroxidase 3 (plasma) Data Set 1 250 gene model 211724_x_at FLJ20323 hypothetical protein FLJ20323 /// hypothetical protein FLJ20323 Data Set 1 250 gene model 201539_s_at FHL1 four and a half LIM domains 1 Data Set 1 250 gene model 201060_x_at STOM stomatin Data Set 1 250 gene model 203966_s_at PPM1A protein phosphatase 1A (formerly 2C), magnesium-dependent, alpha isoform /// protein phosphatase 1A (formerly 2C), magnesium-dependent, alpha isoform Data Set 1 250 gene model 203851_at IGFBP6 insulin-like growth factor binding protein 6 Data Set 1 250 gene model 200903_s_at AHCY S-adenosylhomocysteine hydrolase Data Set 1 250 gene model 215016_x_at DST dystonin Data Set 1 250 gene model 209291_at ID4 inhibitor of DNA binding 4, dominant negative helix-loop-helix protein Data Set 1 250 gene model 207480_s_at MEIS2 Meis1, myeloid ecotropic viral integration site 1 homolog 2 (mouse) Data Set 1 250 gene model 219856_at C1orf116 chromosome 1 open reading frame 116 Data Set 1 250 gene model 201272_at AKR1B1 aldo-keto reductase family 1, member B1 (aldose reductase) Data Set 1 250 gene model 216251_s_at KIAA0153 KIAA0153 protein Data Set 1 250 gene model 213085_s_at KIBRA KIBRA protein Data Set 1 250 gene model 205769_at SLC27A2 solute carrier family 27 (fatty acid transporter), member 2 Data Set 1 250 gene model 203423_at RBP1 retinol binding protein 1, cellular Data Set 1 250 gene model 203186_s_at S100A4 S100 calcium binding protein A4 (calcium protein, calvasculin, metastasin, murine placental homolog) Data Set 1 250 gene model 212445_s_at NEDD4L neural precursor cell expressed, developmentally down-regulated 4-like Data Set 1 250 gene model 220933_s_at ZCCHC6 zinc finger, CCHC domain containing 6 Data Set 1 250 gene model 218186_at RAB25 RAB25, member RAS oncogene family Data Set 1 250 gene model 212640_at PTPLB protein tyrosine phosphatase-like (proline instead of catalytic arginine), member b Data Set 1 250 gene model 209550_at NDN necdin homolog (mouse) Data Set 1 250 gene model 201348_at GPX3 glutathione peroxidase 3 (plasma) Data Set 1 250 gene model 207266_x_at RBMS1 RNA binding motif, single stranded interacting protein 1 Data Set 1 250 gene model 203397_s_at GALNT3 UDP-N-acetyl-alpha-D-galactosamine:polypeptide N-acetylgalactosaminyl transferase 3 (GalNAc-T3) Data Set 1 250 gene model 218198_at DHX32 DEAH (Asp-Glu-Ala-His) box polypeptide 32 Data Set 1 250 gene model 200986_at SERPING1 serpin peptidase inhibitor, clade G (C1 inhibitor), member 1 (angioedema, hereditary) Data Set 1 250 gene model 221582_at HIST3H2A histone 3, H2a Data Set 1 250 gene model 204570_at COX7A1 cytochrome c oxidase subunit VIIa polypeptide 1 (muscle) Data Set 1 250 gene model 200644_at MARCKSL1 MARCKS-like 1 Data Set 1 250 gene model 201667_at GJA1 gap junction protein, alpha 1, 43 kDa (connexin 43) Data Set 1 250 gene model 211715_s_at BDH 3-hydroxybutyrate dehydrogenase (heart, mitochondrial) /// 3-hydroxybutyrate dehydrogenase (heart, mitochondrial) Data Set 1 250 gene model 217080_s_at HOMER2 homer homolog 2 (Drosophila) Data Set 1 250 gene model 219121_s_at RBM35A RNA binding motif protein 35A Data Set 1 250 gene model 218223_s_at CKIP-1 CK2 interacting protein 1; HQ0024c protein Data Set 1 250 gene model 213288_at OACT2 O-acyltransferase (membrane bound) domain containing 2 Data Set 1 250 gene model 209863_s_at TP73L tumor protein p73-like Data Set 1 250 gene model 202005_at ST14 suppression of tumorigenicity 14 (colon carcinoma, matriptase, epithin) Data Set 1 250 gene model 203324_s_at CAV2 caveolin 2 Data Set 1 250 gene model 205265_s_at APEG1 aortic preferentially expressed gene 1 Data Set 1 250 gene model 208747_s_at C1S complement component 1, s subcomponent Data Set 1 250 gene model 212647_at RRAS related RAS viral (r-ras) oncogene homolog Data Set 1 250 gene model 214156_at MYRIP myosin VIIA and Rab interacting protein Data Set 1 250 gene model 203065_s_at CAV1 caveolin 1, caveolae protein, 22 kDa Data Set 1 250 gene model 200923_at LGALS3BP lectin, galactoside-binding, soluble, 3 binding protein Data Set 1 250 gene model 203748_x_at RBMS1 RNA binding motif, single stranded interacting protein 1 Data Set 1 250 gene model 205578_at ROR2 receptor tyrosine kinase-like orphan receptor 2 Data Set 1 250 gene model 212430_at RNPC1 RNA-binding region (RNP1, RRM) containing 1 /// RNA-binding region (RNP1, RRM) containing 1 Data Set 1 250 gene model 218980_at FHOD3 formin homology 2 domain containing 3 Data Set 1 250 gene model 200895_s_at FKBP4 FK506 binding protein 4, 59 kDa Data Set 1 250 gene model 219829_at ITGB1BP2 integrin beta 1 binding protein (melusin) 2 Data Set 1 250 gene model 201482_at QSCN6 quiescin Q6 Data Set 1 250 gene model 203545_at ALG8 asparagine-linked glycosylation 8 homolog (yeast, alpha-1,3-glucosyl- transferase) Data Set 1 250 gene model 217973_at DCXR dicarbonyl/L-xylulose reductase Data Set 1 250 gene model 201315_x_at IFITM2 interferon induced transmembrane protein 2 (1-8D) Data Set 1 250 gene model 203706_s_at FZD7 frizzled homolog 7 (Drosophila) Data Set 1 250 gene model 221462_x_at KLK15 kallikrein 15 Data Set 1 250 gene model 209170_s_at GPM6B glycoprotein M6B Data Set 1 250 gene model 204993_at GNAZ guanine nucleotide binding protein (G protein), alpha z polypeptide Data Set 1 250 gene model 209114_at TSPAN1 tetraspanin 1 Data Set 1 250 gene model 219685_at TMEM35 transmembrane protein 35 Data Set 1 250 gene model 209691_s_at DOK4 docking protein 4 Data Set 1 250 gene model 212203_x_at IFITM3 interferon induced transmembrane protein 3 (1-8U) Data Set 1 250 gene model 205542_at STEAP1 six transmembrane epithelial antigen of the prostate 1 Data Set 1 250 gene model 212680_x_at PPP1R14B protein phosphatase 1, regulatory (inhibitor) subunit 14B Data Set 1 250 gene model 1598_g_at GAS6 growth arrest-specific 6 Data Set 1 250 gene model 209340_at UAP1 UDP-N-acteylglucosamine pyrophosphorylase 1 Data Set 1 250 gene model 208131_s_at PTGIS prostaglandin I2 (prostacyclin) synthase /// prostaglandin I2 (prostacyclin) synthase Data Set 1 250 gene model 213004_at ANGPTL2 angiopoietin-like 2 Data Set 1 250 gene model 203892_at WFDC2 WAP four-disulfide core domain 2
Data Set 1 250 gene model 203911_at RAP1GA1 RAP1, GTPase activating protein 1 Data Set 1 250 gene model 206860_s_at FLJ20323 hypothetical protein FLJ20323 Data Set 1 250 gene model 209696_at FBP1 fructose-1,6-bisphosphatase 1 Data Set 1 250 gene model 210547_x_at ICA1 islet cell autoantigen 1, 69 kDa Data Set 1 250 gene model 204734_at KRT15 keratin 15 Data Set 1 250 gene model 203638_s_at FGFR2 fibroblast growth factor receptor 2 (bacteria-expressed kinase, keratinocyte growth factor receptor, craniofacial dysostosis 1, Crouzon syndrome, Pfeiffer syndrome, Jackson-Weiss syndrome) Data Set 1 250 gene model 200971_s_at SERP1 stress-associated endoplasmic reticulum protein 1 Data Set 1 250 gene model 216565_x_at LOC391020 similar to Interferon-induced transmembrane protein 3 (Interferon-inducible protein 1-8U) Data Set 1 250 gene model 209434_s_at PPAT phosphoribosyl pyrophosphate amidotransferase Data Set 1 250 gene model 209804_at DCLRE1A DNA cross-link repair 1A (PSO2 homolog, S. cerevisiae) Data Set 1 250 gene model 202893_at UNC13B unc-13 homolog B (C. elegans) Data Set 1 250 gene model 218313_s_at GALNT7 UDP-N-acetyl-alpha-D-galactosamine:polypeptide N-acetyl- galactosaminyltransferase 7 (GalNAc-T7) Data Set 2 5 gene model 200982_s_at ANXA6 annexin A6 Data Set 2 5 gene model 205304_s_at KCNJ8 potassium inwardly-rectifying channel, subfamily J, member 8 Data Set 2 5 gene model 227554_at LOC402560 Hypothetical LOC402560 Data Set 2 5 gene model 235867_at GSTM3 glutathione S-transferase M3 (brain) Data Set 2 5 gene model 213556_at LOC390940 similar to R28379_1 Data Set 2 10 gene model 213924_at MPPE1 Metallophosphoesterase 1 Data Set 2 10 gene model 205303_at KCNJ8 potassium inwardly-rectifying channel, subfamily J, member 8 Data Set 2 10 gene model 208792_s_at CLU clusterin Data Set 2 10 gene model 230087_at PRIMA1 proline rich membrane anchor 1 Data Set 2 10 gene model 218094_s_at DBNDD2 dysbindin (dystrobrevin binding protein 1) domain containing 2 Data Set 2 10 gene model 205304_s_at KCNJ8 potassium inwardly-rectifying channel, subfamily J, member 8 Data Set 2 10 gene model 1553102_a_at CCDC69 coiled-coil domain containing 69 Data Set 2 10 gene model 227554_at LOC402560 Hypothetical LOC402560 Data Set 2 10 gene model 209434_s_at PPAT phosphoribosyl pyrophosphate amidotransferase Data Set 2 10 gene model 231118_at ANKRD35 ankyrin repeat domain 35 Data Set 2 20 gene model 201798_s_at FER1L3 fer-1-like 3, myoferlin (C. elegans) Data Set 2 20 gene model 222043_at CLU clusterin Data Set 2 20 gene model 219670_at C1orf165 chromosome 1 open reading frame 165 Data Set 2 20 gene model 223843_at SCARA3 scavenger receptor class A, member 3 Data Set 2 20 gene model 203323_at CAV2 caveolin 2 Data Set 2 20 gene model 230067_at FLJ30707 Hypothetical protein FLJ30707 Data Set 2 20 gene model 212736_at C16orf45 chromosome 16 open reading frame 45 Data Set 2 20 gene model 221898_at PDPN podoplanin Data Set 2 20 gene model 205577_at PYGM phosphorylase, glycogen; muscle (McArdle syndrome, glycogen storage disease type V) Data Set 2 20 gene model 204099_at SMARCD3 SWI/SNF related, matrix associated, actin dependent regulator of chromatin, subfamily d, member 3 Data Set 2 20 gene model 224710_at RAB34 RAB34, member RAS oncogene family Data Set 2 20 gene model 203151_at MAP1A microtubule-associated protein 1A Data Set 2 20 gene model 201590_x_at ANXA2 annexin A2 Data Set 2 20 gene model 210427_x_at ANXA2 annexin A2 Data Set 2 20 gene model 218421_at CERK ceramide kinase Data Set 2 20 gene model 209356_x_at EFEMP2 EGF-containing fibulin-like extracellular matrix protein 2 Data Set 2 20 gene model 208792_s_at CLU clusterin Data Set 2 20 gene model 219525_at FLJ10847 hypothetical protein FLJ10847 Data Set 2 20 gene model 204777_s_at MAL mal, T-cell differentiation protein Data Set 2 20 gene model 213503_x_at ANXA2 annexin A2 Data Set 2 50 gene model 1552701_a_at COP1 caspase-1 dominant-negative inhibitor pseudo-ICE Data Set 2 50 gene model 204115_at GNG11 guanine nucleotide binding protein (G protein), gamma 11 Data Set 2 50 gene model 244111_at KA21 truncated type I keratin KA21 Data Set 2 50 gene model 220751_s_at C5orf4 chromosome 5 open reading frame 4 Data Set 2 50 gene model 244050_at PTPLAD2 protein tyrosine phosphatase-like A domain containing 2 Data Set 2 50 gene model 214027_x_at DES /// FAM48A desmin /// family with sequence similarity 48, member A Data Set 2 50 gene model 222744_s_at TMLHE trimethyllysine hydroxylase, epsilon Data Set 2 50 gene model 1553995_a_at NT5E 5'-nucleotidase, ecto (CD73) Data Set 2 50 gene model 208791_at CLU clusterin Data Set 2 50 gene model 201136_at PLP2 proteolipid protein 2 (colonic epithelium-enriched) Data Set 2 50 gene model 226047_at MRVI1 Murine retrovirus integration site 1 homolog Data Set 2 50 gene model 236383_at -- Transcribed locus Data Set 2 50 gene model 211562_s_at LMOD1 leiomodin 1 (smooth muscle) Data Set 2 50 gene model 222669_s_at SBDS Shwachman-Bodian-Diamond syndrome Data Set 2 50 gene model 207030_s_at CSRP2 cysteine and glycine-rich protein 2 Data Set 2 50 gene model 204735_at PDE4A phosphodiesterase 4A, cAMP-specific (phosphodiesterase E2 dunce homolog, Drosophila) Data Set 2 50 gene model 218864_at TNS1 tensin 1 Data Set 2 50 gene model 214369_s_at RASGRP2 RAS guanyl releasing protein 2 (calcium and DAG-regulated) Data Set 2 50 gene model 205578_at ROR2 receptor tyrosine kinase-like orphan receptor 2 Data Set 2 50 gene model 204099_at SMARCD3 SWI/SNF related, matrix associated, actin dependent regulator of chromatin, subfamily d, member 3 Data Set 2 50 gene model 213309_at PLCL2 phospholipase C-like 2 Data Set 2 50 gene model 207836_s_at RBPMS RNA binding protein with multiple splicing Data Set 2 50 gene model 203921_at CHST2 carbohydrate (N-acetylglucosamine-6-O) sulfotransferase 2 Data Set 2 50 gene model 203951_at CNN1 calponin 1, basic, smooth muscle Data Set 2 50 gene model 217111_at AMACR alpha-methylacyl-CoA racemase Data Set 2 50 gene model 210869_s_at MCAM melanoma cell adhesion molecule Data Set 2 50 gene model 226926_at ZD52F10 dermokine Data Set 2 50 gene model 220034_at IRAK3 interleukin-1 receptor-associated kinase 3 Data Set 2 50 gene model 238151_at TUBB6 Tubulin, beta 6 Data Set 2 50 gene model 201842_s_at EFEMP1 EGF-containing fibulin-like extracellular matrix protein 1 Data Set 2 50 gene model 209651_at TGFB1I1 transforming growth factor beta 1 induced transcript 1 Data Set 2 50 gene model 203632_s_at GPRC5B G protein-coupled receptor, family C, group 5, member B Data Set 2 50 gene model 49452_at ACACB acetyl-Coenzyme A carboxylase beta Data Set 2 50 gene model 203766_s_at LMOD1 leiomodin 1 (smooth muscle) Data Set 2 50 gene model 225381_at LOC399959 hypothetical gene supported by BX647608 Data Set 2 50 gene model 209948_at KCNMB1 potassium large conductance calcium-activated channel, subfamily M, beta member 1 Data Set 2 50 gene model 235657_at -- Transcribed locus Data Set 2 50 gene model 213426_s_at CAV2 caveolin 2 Data Set 2 50 gene model 205088_at CXorf6 chromosome X open reading frame 6 Data Set 2 50 gene model 227006_at PPP1R14A protein phosphatase 1, regulatory (inhibitor) subunit 14A Data Set 2 50 gene model 211276_at TCEAL2 transcription elongation factor A (SII)-like 2 Data Set 2 50 gene model 221016_s_at TCF7L1 transcription factor 7-like 1 (T-cell specific, HMG-box) /// transcription factor 7-like 1 (T-cell specific, HMG-box) Data Set 2 50 gene model 207390_s_at SMTN smoothelin Data Set 2 50 gene model 211340_s_at MCAM melanoma cell adhesion molecule Data Set 2 50 gene model 228080_at LAYN layilin Data Set 2 50 gene model 214767_s_at HSPB6 heat shock protein, alpha-crystallin-related, B6 Data Set 2 50 gene model 242170_at ZNF154 Zinc finger protein 154 (pHZ-92) Data Set 2 50 gene model 205577_at PYGM phosphorylase, glycogen; muscle (McArdle syndrome, glycogen storage disease type V) Data Set 2 50 gene model 230519_at FLJ30707 hypothetical protein FLJ30707 Data Set 2 50 gene model 222043_at CLU clusterin Data Set 2 100 gene model 203892_at WFDC2 WAP four-disulfide core domain 2 Data Set 2 100 gene model 239911_at -- Full-length cDNA clone CS0DJ013YP06 of T cells (Jurkat cell line) Cot 10-normalized of Homo sapiens (human) Data Set 2 100 gene model 216548_x_at HMG4L high-mobility group (nonhistone chromosomal) protein 4-like Data Set 2 100 gene model 207016_s_at ALDH1A2 aldehyde dehydrogenase 1 family, member A2 Data Set 2 100 gene model 210224_at MR1 major histocompatibility complex, class I-related Data Set 2 100 gene model 226638_at ARHGAP23 Rho GTPase activating protein 23 Data Set 2 100 gene model 214369_s_at RASGRP2 RAS guanyl releasing protein 2 (calcium and DAG-regulated) Data Set 2 100 gene model 227188_at C21orf63 chromosome 21 open reading frame 63 Data Set 2 100 gene model 205478_at PPP1R1A protein phosphatase 1, regulatory (inhibitor) subunit 1A Data Set 2 100 gene model 202949_s_at FHL2 four and a half LIM domains 2 Data Set 2 100 gene model 235593_at ZFHX1B zinc finger homeobox 1b Data Set 2 100 gene model 228202_at PLN Phospholamban Data Set 2 100 gene model 204940_at PLN phospholamban Data Set 2 100 gene model 206030_at ASPA aspartoacylase (Canavan disease) Data Set 2 100 gene model 212358_at CLIPR-59 CLIP-170-related protein Data Set 2 100 gene model 227862_at LOC388610 hypothetical LOC388610 Data Set 2 100 gene model 227236_at TSPAN2 tetraspanin 2 Data Set 2 100 gene model 225288_at -- Full-length cDNA clone CS0DI001YP15 of Placenta Cot 25-normalized of Homo sapiens (human) Data Set 2 100 gene model 218691_s_at PDLIM4 PDZ and LIM domain 4 Data Set 2 100 gene model 1552703_s_at CASP1 /// COP1 caspase 1, apoptosis-related cysteine peptidase (interleukin 1, beta, convertase) /// caspase-1 dominant-negative inhibitor pseudo-ICE Data Set 2 100 gene model 231292_at EID3 E1A-like inhibitor of differentiation 3 Data Set 2 100 gene model 210102_at LOH11CR2A loss of heterozygosity, 11, chromosomal region 2, gene A Data Set 2 100 gene model 206355_at GNAL guanine nucleotide binding protein (G protein), alpha activating activity polypeptide, olfactory type Data Set 2 100 gene model 227742_at CLIC6 chloride intracellular channel 6 Data Set 2 100 gene model 231202_at ALDH1L2 aldehyde dehydrogenase 1 family, member L2 Data Set 2 100 gene model 205132_at ACTC actin, alpha, cardiac muscle Data Set 2 100 gene model 209087_x_at MCAM melanoma cell adhesion molecule Data Set 2 100 gene model 236936_at -- -- Data Set 2 100 gene model 211126_s_at CSRP2 cysteine and glycine-rich protein 2 Data Set 2 100 gene model 202794_at INPP1 inositol polyphosphate-1-phosphatase Data Set 2 100 gene model 241803_s_at -- -- Data Set 2 100 gene model 204037_at EDG2 /// endothelial differentiation, lysophosphatidic acid G-protein-coupled LOC644923 receptor, 2 /// hypothetical protein LOC644923 Data Set 2 100 gene model 204993_at GNAZ guanine nucleotide binding protein (G protein), alpha z polypeptide Data Set 2 100 gene model 1555630_a_at RAB34 RAB34, member RAS oncogene family Data Set 2 100 gene model 209789_at CORO2B coronin, actin binding protein, 2B Data Set 2 100 gene model 244167_at SERGEF Secretion regulating guanine nucleotide exchange factor Data Set 2 100 gene model 203851_at IGFBP6 insulin-like growth factor binding protein 6 Data Set 2 100 gene model 229648_at -- Transcribed locus Data Set 2 100 gene model 202196_s_at DKK3 dickkopf homolog 3 (Xenopus laevis) Data Set 2 100 gene model 226303_at PGM5 phosphoglucomutase 5 Data Set 2 100 gene model 201431_s_at DPYSL3 dihydropyrimidinase-like 3 Data Set 2 100 gene model 213746_s_at FLNA filamin A, alpha (actin binding protein 280) Data Set 2 100 gene model 212091_s_at COL6A1 collagen, type VI, alpha 1 Data Set 2 100 gene model 1569956_at -- Homo sapiens, clone IMAGE: 4413783, mRNA Data Set 2 100 gene model 203650_at PROCR protein C receptor, endothelial (EPCR) Data Set 2 100 gene model 204310_s_at NPR2 natriuretic peptide receptor B/guanylate cyclase B (atrionatriuretic peptide receptor B) Data Set 2 100 gene model 222669_s_at SBDS Shwachman-Bodian-Diamond syndrome Data Set 2 100 gene model 205578_at ROR2 receptor tyrosine kinase-like orphan receptor 2 Data Set 2 100 gene model 212813_at JAM3 junctional adhesion molecule 3
Data Set 2 100 gene model 230271_at -- Homo sapiens, clone IMAGE: 4512785, mRNA Data Set 2 100 gene model 236383_at -- Transcribed locus Data Set 2 100 gene model 210880_s_at EFS embryonal Fyn-associated substrate Data Set 2 100 gene model 206813_at CTF1 cardiotrophin 1 Data Set 2 100 gene model 45297_at EHD2 EH-domain containing 2 Data Set 2 100 gene model 200621_at CSRP1 cysteine and glycine-rich protein 1 Data Set 2 100 gene model 226280_at -- CDNA FLJ43545 fis, clone PROST2011631 Data Set 2 100 gene model 213170_at GPX7 glutathione peroxidase 7 Data Set 2 100 gene model 1552785_at FLJ37549 hypothetical protein FLJ37549 Data Set 2 100 gene model 203370_s_at PDLIM7 PDZ and LIM domain 7 (enigma) Data Set 2 100 gene model 223842_s_at SCARA3 scavenger receptor class A, member 3 Data Set 2 100 gene model 206465_at ACSBG1 acyl-CoA synthetase bubblegum family member 1 Data Set 2 100 gene model 201136_at PLP2 proteolipid protein 2 (colonic epithelium-enriched) Data Set 2 100 gene model 43427_at ACACB acetyl-Coenzyme A carboxylase beta Data Set 2 100 gene model 204735_at PDE4A phosphodiesterase 4A, cAMP-specific (phosphodiesterase E2 dunce homolog, Drosophila) Data Set 2 100 gene model 213010_at PRKCDBP protein kinase C, delta binding protein Data Set 2 100 gene model 223095_at MARVELD1 MARVEL domain containing 1 Data Set 2 100 gene model 226304_at HSPB6 heat shock protein, alpha-crystallin-related, B6 Data Set 2 100 gene model 243209_at KCNQ4 potassium voltage-gated channel, KQT-like subfamily, member 4 Data Set 2 100 gene model 244111_at KA21 truncated type I keratin KA21 Data Set 2 100 gene model 1552701_a_at COP1 caspase-1 dominant-negative inhibitor pseudo-ICE Data Set 2 100 gene model 207836_s_at RBPMS RNA binding protein with multiple splicing Data Set 2 100 gene model 211564_s_at PDLIM4 PDZ and LIM domain 4 Data Set 2 100 gene model 208690_s_at PDLIM1 PDZ and LIM domain 1 (elfin) Data Set 2 100 gene model 207030_s_at CSRP2 cysteine and glycine-rich protein 2 Data Set 2 100 gene model 217111_at AMACR alpha-methylacyl-CoA racemase Data Set 2 100 gene model 214027_x_at DES /// FAM48A desmin /// family with sequence similarity 48, member A Data Set 2 100 gene model 211562_s_at LMOD1 leiomodin 1 (smooth muscle) Data Set 2 100 gene model 244050_at PTPLAD2 protein tyrosine phosphatase-like A domain containing 2 Data Set 2 100 gene model 1553995_a_at NT5E 5'-nucleotidase, ecto (CD73) Data Set 2 100 gene model 204069_at MEIS1 Meis1, myeloid ecotropic viral integration site 1 homolog (mouse) Data Set 2 100 gene model 206122_at SOX15 SRY (sex determining region Y)-box 15 Data Set 2 100 gene model 210869_s_at MCAM melanoma cell adhesion molecule Data Set 2 100 gene model 204115_at GNG11 guanine nucleotide binding protein (G protein), gamma 11 Data Set 2 100 gene model 225381_at LOC399959 hypothetical gene supported by BX647608 Data Set 2 100 gene model 226926_at ZD52F10 dermokine Data Set 2 100 gene model 204099_at SMARCD3 SWI/SNF related, matrix associated, actin dependent regulator of chromatin, subfamily d, member 3 Data Set 2 100 gene model 205088_at CXorf6 chromosome X open reading frame 6 Data Set 2 100 gene model 203632_s_at GPRC5B G protein-coupled receptor, family C, group 5, member B Data Set 2 100 gene model 203921_at CHST2 carbohydrate (N-acetylglucosamine-6-O) sulfotransferase 2 Data Set 2 100 gene model 228080_at LAYN layilin Data Set 2 100 gene model 218864_at TNS1 tensin 1 Data Set 2 100 gene model 203951_at CNN1 calponin 1, basic, smooth muscle Data Set 2 100 gene model 220751_s_at C5orf4 chromosome 5 open reading frame 4 Data Set 2 100 gene model 208791_at CLU clusterin Data Set 2 100 gene model 212886_at CCDC69 coiled-coil domain containing 69 Data Set 2 100 gene model 229480_at LOC402560 hypothetical LOC402560 Data Set 2 100 gene model 209434_s_at PPAT phosphoribosyl pyrophosphate amidotransferase Data Set 2 100 gene model 213556_at LOC390940 similar to R28379_1 Data Set 2 100 gene model 231118_at ANKRD35 ankyrin repeat domain 35 Data Set 2 100 gene model 205083_at AOX1 aldehyde oxidase 1 Data Set 2 250 gene model 202274_at ACTG2 actin, gamma 2, smooth muscle, enteric Data Set 2 250 gene model 213290_at COL6A2 collagen, type VI, alpha 2 Data Set 2 250 gene model 210139_s_at PMP22 peripheral myelin protein 22 Data Set 2 250 gene model 229127_at ATP5J ATP synthase, H+ transporting, mitochondrial F0 complex, subunit F6 Data Set 2 250 gene model 209427_at SMTN smoothelin Data Set 2 250 gene model 223786_at CHST6 carbohydrate (N-acetylglucosamine 6-O) sulfotransferase 6 Data Set 2 250 gene model 206600_s_at SLC16A5 solute carrier family 16 (monocarboxylic acid transporters), member 5 Data Set 2 250 gene model 219213_at JAM2 junctional adhesion molecule 2 Data Set 2 250 gene model 206580_s_at EFEMP2 EGF-containing fibulin-like extracellular matrix protein 2 Data Set 2 250 gene model 228141_at LOC493869 Similar to RIKEN cDNA 2310016C16 Data Set 2 250 gene model 227862_at LOC388610 hypothetical LOC388610 Data Set 2 250 gene model 204570_at COX7A1 cytochrome c oxidase subunit VIIa polypeptide 1 (muscle) Data Set 2 250 gene model 227998_at S100A16 S100 calcium binding protein A16 Data Set 2 250 gene model 228726_at -- -- Data Set 2 250 gene model 213106_at -- -- Data Set 2 250 gene model 205392_s_at CCL14 /// CCL15 chemokine (C-C motif) ligand 14 /// chemokine (C-C motif) ligand 15 Data Set 2 250 gene model 238657_at UBXD3 UBX domain containing 3 Data Set 2 250 gene model 216594_x_at AKR1C1 aldo-keto reductase family 1, member C1 (dihydrodiol dehydrogenase 1; 20-alpha (3-alpha)-hydroxysteroid dehydrogenase) Data Set 2 250 gene model 212647_at RRAS related RAS viral (r-ras) oncogene homolog Data Set 2 250 gene model 230264_s_at AP1S2 adaptor-related protein complex 1, sigma 2 subunit Data Set 2 250 gene model 210619_s_at HYAL1 hyaluronoglucosaminidase 1 Data Set 2 250 gene model 224724_at SULF2 sulfatase 2 Data Set 2 250 gene model 225242_s_at CCDC80 coiled-coil domain containing 80 Data Set 2 250 gene model 218454_at FLJ22662 hypothetical protein FLJ22662 Data Set 2 250 gene model 220933_s_at ZCCHC6 zinc finger, CCHC domain containing 6 Data Set 2 250 gene model 230933_at -- Transcribed locus Data Set 2 250 gene model 218423_x_at VPS54 vacuolar protein sorting 54 (S. cerevisiae) Data Set 2 250 gene model 218660_at DYSF dysferlin, limb girdle muscular dystrophy 2B (autosomal recessive) Data Set 2 250 gene model 213139_at SNAI2 snail homolog 2 (Drosophila) Data Set 2 250 gene model 228494_at PPP1R9A protein phosphatase 1, regulatory (inhibitor) subunit 9A Data Set 2 250 gene model 201300_s_at PRNP prion protein (p27-30) (Creutzfeldt-Jakob disease, Gerstmann-Strausler- Scheinker syndrome, fatal familial insomnia) Data Set 2 250 gene model 214212_x_at PLEKHC1 pleckstrin homology domain containing, family C (with FERM domain) member 1 Data Set 2 250 gene model 200795_at SPARCL1 SPARC-like 1 (mast9, hevin) Data Set 2 250 gene model 1556696_s_at FLJ42709 Hypothetical gene supported by AK124699 Data Set 2 250 gene model 200859_x_at FLNA filamin A, alpha (actin binding protein 280) Data Set 2 250 gene model 207480_s_at MEIS2 Meis1, myeloid ecotropic viral integration site 1 homolog 2 (mouse) Data Set 2 250 gene model 202222_s_at DES desmin Data Set 2 250 gene model 201060_x_at STOM stomatin Data Set 2 250 gene model 220795_s_at KIAA1446 likely ortholog of rat brain-enriched guanylate kinase-associated protein Data Set 2 250 gene model 212097_at CAV1 caveolin 1, caveolae protein, 22 kDa Data Set 2 250 gene model 227826_s_at SORBS2 Sorbin and SH3 domain containing 2 Data Set 2 250 gene model 1555127_at MOCS1 molybdenum cofactor synthesis 1 Data Set 2 250 gene model 212793_at DAAM2 dishevelled associated activator of morphogenesis 2 Data Set 2 250 gene model 213001_at ANGPTL2 angiopoietin-like 2 Data Set 2 250 gene model 205560_at PCSK5 proprotein convertase subtilisin/kexin type 5 Data Set 2 250 gene model 201234_at ILK integrin-linked kinase Data Set 2 250 gene model 227899_at VIT vitrin Data Set 2 250 gene model 234015_at NAALADL2 N-acetylated alpha-linked acidic dipeptidase-like 2 Data Set 2 250 gene model 227066_at MOBKL2C MOB1, Mps One Binder kinase activator-like 2C (yeast) Data Set 2 250 gene model 209118_s_at TUBA3 tubulin, alpha 3 Data Set 2 250 gene model 202422_s_at ACSL4 acyl-CoA synthetase long-chain family member 4 Data Set 2 250 gene model 242874_at C14orf161 Chromosome 14 open reading frame 161 Data Set 2 250 gene model 236270_at NFATC4 nuclear factor of activated T-cells, cytoplasmic, calcineurin-dependent 4 Data Set 2 250 gene model 221748_s_at TNS1 tensin 1 /// tensin 1 Data Set 2 250 gene model 204793_at GPRASP1 G protein-coupled receptor associated sorting protein 1 Data Set 2 250 gene model 238115_at DNAJC18 DnaJ (Hsp40) homolog, subfamily C, member 18 Data Set 2 250 gene model 220911_s_at KIAA1305 KIAA1305 Data Set 2 250 gene model 227233_at TSPAN2 tetraspanin 2 Data Set 2 250 gene model 227565_at -- Transcribed locus Data Set 2 250 gene model 229014_at FLJ42709 hypothetical gene supported by AK124699 Data Set 2 250 gene model 201425_at ALDH2 aldehyde dehydrogenase 2 family (mitochondrial) Data Set 2 250 gene model 226225_at MCC mutated in colorectal cancers Data Set 2 250 gene model 242086_at SPATA6 Spermatogenesis associated 6 Data Set 2 250 gene model 239183_at ANGPTL1 angiopoietin-like 1 Data Set 2 250 gene model 1568868_at FLJ16008 FLJ16008 protein Data Set 2 250 gene model 202148_s_at PYCR1 pyrroline-5-carboxylate reductase 1 Data Set 2 250 gene model 204030_s_at SCHIP1 schwannomin interacting protein 1 Data Set 2 250 gene model 214066_x_at NPR2 natriuretic peptide receptor B/guanylate cyclase B (atrionatriuretic peptide receptor B) Data Set 2 250 gene model 221436_s_at CDCA3 cell division cycle associated 3 /// cell division cycle associated 3 Data Set 2 250 gene model 209685_s_at PRKCB1 protein kinase C, beta 1 Data Set 2 250 gene model 227486_at NT5E 5'-nucleotidase, ecto (CD73) Data Set 2 250 gene model 1559477_s_at MEIS1 Meis1, myeloid ecotropic viral integration site 1 homolog (mouse) Data Set 2 250 gene model 217220_at -- -- Data Set 2 250 gene model 232276_at HS6ST3 heparan sulfate 6-O-sulfotransferase 3 Data Set 2 250 gene model 58916_at KCTD14 potassium channel tetramerisation domain containing 14 Data Set 2 250 gene model 238463_at -- Homo sapiens, clone IMAGE: 5309572, mRNA Data Set 2 250 gene model 220974_x_at SFXN3 sideroflexin 3 /// sideroflexin 3 Data Set 2 250 gene model 209735_at ABCG2 ATP-binding cassette, sub-family G (WHITE), member 2 Data Set 2 250 gene model 228113_at RAB37 RAB37, member RAS oncogene family Data Set 2 250 gene model 223395_at ABI3BP ABI gene family, member 3 (NESH) binding protein Data Set 2 250 gene model 235897_at COPZ2 coatomer protein complex, subunit zeta 2 Data Set 2 250 gene model 241310_at -- Transcribed locus Data Set 2 250 gene model 202409_at C11orf43 chromosome 11 open reading frame 43 Data Set 2 250 gene model 210632_s_at SGCA sarcoglycan, alpha (50 kDa dystrophin-associated glycoprotein) Data Set 2 250 gene model 204879_at PDPN podoplanin Data Set 2 250 gene model 213068_at DPT dermatopontin Data Set 2 250 gene model 211682_x_at UGT2B28 UDP glucuronosyltransferase 2 family, polypeptide B28 /// UDP glucuronosyltransferase 2 family, polypeptide B28 Data Set 2 250 gene model 205547_s_at TAGLN transgelin Data Set 2 250 gene model 220113_x_at POLR1B polymerase (RNA) I polypeptide B, 128 kDa Data Set 2 250 gene model 57588_at SLC24A3 solute carrier family 24 (sodium/potassium/calcium exchanger), member 3 Data Set 2 250 gene model 1554206_at TMLHE trimethyllysine hydroxylase, epsilon Data Set 2 250 gene model 204688_at SGCE sarcoglycan, epsilon Data Set 2 250 gene model 228584_at SGCB sarcoglycan, beta (43 kDa dystrophin-associated glycoprotein) Data Set 2 250 gene model 203510_at MET met proto-oncogene (hepatocyte growth factor receptor) Data Set 2 250 gene model 226955_at FLJ36748 hypothetical protein FLJ36748 Data Set 2 250 gene model 208335_s_at DARC Duffy blood group, chemokine receptor Data Set 2 250 gene model 204418_x_at GSTM2 glutathione S-transferase M2 (muscle) Data Set 2 250 gene model 220541_at MMP26 matrix metallopeptidase 26 Data Set 2 250 gene model 204955_at SRPX sushi-repeat-containing protein, X-linked
Data Set 2 250 gene model 207397_s_at HOXD13 homeobox D13 Data Set 2 250 gene model 225721_at SYNPO2 synaptopodin 2 Data Set 2 250 gene model 225782_at MSRB3 methionine sulfoxide reductase B3 Data Set 2 250 gene model 227827_at SORBS2 Sorbin and SH3 domain containing 2 Data Set 2 250 gene model 221870_at EHD2 EH-domain containing 2 Data Set 2 250 gene model 223623_at ECRG4 esophageal cancer related gene 4 protein Data Set 2 250 gene model 225020_at DAB2IP DAB2 interacting protein Data Set 2 250 gene model 208131_s_at PTGIS prostaglandin I2 (prostacyclin) synthase /// prostaglandin I2 (prostacyclin) synthase Data Set 2 250 gene model 238526_at RAB3IP RAB3A interacting protein (rabin3) Data Set 2 250 gene model 204750_s_at DSC2 desmocollin 2 Data Set 2 250 gene model 212276_at LPIN1 lipin 1 Data Set 2 250 gene model 229839_at SCARA5 Scavenger receptor class A, member 5 (putative) Data Set 2 250 gene model 230986_at KLF8 Kruppel-like factor 8 Data Set 2 250 gene model 238877_at -- -- Data Set 2 250 gene model 204422_s_at FGF2 fibroblast growth factor 2 (basic) Data Set 2 250 gene model 228554_at -- MRNA; cDNA DKFZp586G0321 (from clone DKFZp586G0321) Data Set 2 250 gene model 204430_s_at SLC2A5 solute carrier family 2 (facilitated glucose/fructose transporter), member 5 Data Set 2 250 gene model 217728_at S100A6 S100 calcium binding protein A6 (calcyclin) Data Set 2 250 gene model 204149_s_at GSTM4 glutathione S-transferase M4 Data Set 2 250 gene model 210188_at GABPA /// GA binding protein transcription factor, alpha subunit 60 kDa /// GA GABPAP binding protein transcription factor, alpha subunit pseudogene Data Set 2 250 gene model 231137_at ACSBG1 Acyl-CoA synthetase bubblegum family member 1 Data Set 2 250 gene model 226627_at 8-Sep septin 8 Data Set 2 250 gene model 201841_s_at HSPB1 heat shock 27 kDa protein 1 Data Set 2 250 gene model 227249_at NDE1 NudE nuclear distribution gene E homolog 1 (A. nidulans) Data Set 2 250 gene model 209583_s_at CD200 CD200 molecule Data Set 2 250 gene model 201348_at GPX3 glutathione peroxidase 3 (plasma) Data Set 2 250 gene model 219761_at CLEC1A C-type lectin domain family 1, member A Data Set 2 250 gene model 214247_s_at DKK3 dickkopf homolog 3 (Xenopus laevis) Data Set 2 250 gene model 224964_s_at GNG2 guanine nucleotide binding protein (G protein), gamma 2 Data Set 2 250 gene model 229313_at -- -- Data Set 2 250 gene model 209763_at CHRDL1 chordin-like 1 Data Set 2 250 gene model 221781_s_at DNAJC10 DnaJ (Hsp40) homolog, subfamily C, member 10 Data Set 2 250 gene model 218980_at FHOD3 formin homology 2 domain containing 3 Data Set 2 250 gene model 214121_x_at PDLIM7 PDZ and LIM domain 7 (enigma) Data Set 2 250 gene model 226834_at -- Transcribed locus, strongly similar to NP_079045.1 adipocyte-specific adhesion molecule; CAR-like membrane protein [Homo sapiens] Data Set 2 250 gene model 1559266_s_at FLJ45187 hypothetical protein LOC387640 Data Set 2 250 gene model 244710_at FLJ32786 hypothetical protein FLJ32786 Data Set 2 250 gene model 225912_at TP53INP1 tumor protein p53 inducible nuclear protein 1 Data Set 2 250 gene model 225464_at FRMD6 FERM domain containing 6 Data Set 2 250 gene model 210096_at CYP4B1 cytochrome P450, family 4, subfamily B, polypeptide 1 Data Set 2 250 gene model 213386_at RNF20 Ring finger protein 20 Data Set 2 250 gene model 204058_at ME1 Malic enzyme 1, NADP(+)-dependent, cytosolic Data Set 2 250 gene model 225288_at -- Full-length cDNA clone CS0DI001YP15 of Placenta Cot 25-normalized of Homo sapiens (human) Data Set 2 250 gene model 239503_at -- CDNA clone IMAGE: 5301910 Data Set 2 250 gene model 241198_s_at C11orf70 chromosome 11 open reading frame 70 Data Set 2 250 gene model 228195_at MGC13057 Hypothetical protein MGC13057 Data Set 2 250 gene model 210105_s_at FYN FYN oncogene related to SRC, FGR, YES Data Set 2 250 gene model 205384_at FXYD1 FXYD domain containing ion transport regulator 1 (phospholemman) Data Set 2 250 gene model 225968_at PRICKLE2 prickle-like 2 (Drosophila) Data Set 2 250 gene model 220532_s_at LR8 LR8 protein Data Set 2 250 gene model 207957_s_at PRKCB1 Protein kinase C, beta 1 Data Set 2 250 gene model 206816_s_at SPAG8 sperm associated antigen 8 Data Set 2 250 gene model 200911_s_at TACC1 transforming, acidic coiled-coil containing protein 1 Data Set 2 250 gene model 226436_at RASSF4 Ras association (RalGDS/AF-6) domain family 4 Data Set 2 250 gene model 204400_at EFS embryonal Fyn-associated substrate Data Set 2 250 gene model 244289_at LOC134466 hypothetical protein LOC134466 Data Set 2 250 gene model 238484_s_at -- MRNA; clone CD 43T7 Data Set 2 250 gene model 32094_at CHST3 carbohydrate (chondroitin 6) sulfotransferase 3 Data Set 2 250 gene model 228260_at ELAVL2 ELAV (embryonic lethal, abnormal vision, Drosophila)-like 2 (Hu antigen B) Data Set 2 250 gene model 204205_at APOBEC3G apolipoprotein B mRNA editing enzyme, catalytic polypeptide-like 3G Data Set 2 250 gene model 212914_at CBX7 chromobox homolog 7 Data Set 2 250 gene model 206625_at RDS retinal degeneration, slow Data Set 2 250 gene model 222666_s_at RCL1 RNA terminal phosphate cyclase-like 1 Data Set 2 250 gene model 222744_s_at TMLHE trimethyllysine hydroxylase, epsilon Data Set 2 250 gene model 219478_at WFDC1 WAP four-disulfide core domain 1 Data Set 2 250 gene model 211535_s_at FGFR1 fibroblast growth factor receptor 1 (fms-related tyrosine kinase 2, Pfeiffer syndrome) Data Set 2 250 gene model 209191_at TUBB6 tubulin, beta 6 Data Set 2 250 gene model 225790_at MSRB3 methionine sulfoxide reductase B3 Data Set 2 250 gene model 238613_at ZAK sterile alpha motif and leucine zipper containing kinase AZK Data Set 2 250 gene model 241386_at -- Transcribed locus Data Set 2 250 gene model 203939_at NT5E 5'-nucleotidase, ecto (CD73) Data Set 2 250 gene model 200986_at SERPING1 serpin peptidase inhibitor, Glade G (C1 inhibitor), member 1, (angioedema, hereditary) Data Set 2 250 gene model 204940_at PLN phospholamban Data Set 2 250 gene model 225798_at tcag7.981 juxtaposed with another zinc finger gene 1 Data Set 2 250 gene model 222722_at OGN osteoglycin (osteoinductive factor, mimecan) Data Set 2 250 gene model 203619_s_at FAIM2 Fas apoptotic inhibitory molecule 2 Data Set 2 250 gene model 220233_at FBXO17 F-box protein 17 Data Set 2 250 gene model 231672_at -- Transcribed locus, strongly similar to NP_057364.1 carboxylesterase 4-like; carboxylesterase-related protein [Homo sapiens] Data Set 2 250 gene model 204894_s_at AOC3 amine oxidase, copper containing 3 (vascular adhesion protein 1) Data Set 2 250 gene model 202794_at INPP1 inositol polyphosphate-1-phosphatase Data Set 2 250 gene model 221935_s_at C3orf64 chromosome 3 open reading frame 64 Data Set 2 250 gene model 207961_x_at MYH11 myosin, heavy polypeptide 11, smooth muscle Data Set 2 250 gene model 205973_at FEZ1 fasciculation and elongation protein zeta 1 (zygin I) Data Set 2 250 gene model 223734_at OSAP ovary-specific acidic protein Data Set 2 250 gene model 228802_at RBPMS2 RNA binding protein with multiple splicing 2 Data Set 2 250 gene model 204939_s_at PLN phospholamban Data Set 2 250 gene model 227188_at C21orf63 chromosome 21 open reading frame 63 Data Set 2 250 gene model 202242_at TSPAN7 tetraspanin 7 Data Set 2 250 gene model 227915_at ASB2 ankyrin repeat and SOCS box-containing 2 Data Set 2 250 gene model 201185_at HTRA1 HtrA serine peptidase 1 Data Set 2 250 gene model 205475_at SCRG1 scrapie responsive protein 1 Data Set 2 250 gene model 203892_at WFDC2 WAP four-disulfide core domain 2 Data Set 2 250 gene model 210102_at LOH11CR2A loss of heterozygosity, 11, chromosomal region 2, gene A Data Set 2 250 gene model 228585_at ENTPD1 Ectonucleoside triphosphate diphosphohydrolase 1 Data Set 2 250 gene model 209686_at S100B S100 calcium binding protein, beta (neural) Data Set 2 250 gene model 232298_at LOC401093 hypothetical LOC401093 Data Set 2 250 gene model 212509_s_at MXRA7 matrix-remodelling associated 7 Data Set 2 250 gene model 203068_at KLHL21 kelch-like 21 (Drosophila) Data Set 2 250 gene model 65718_at GPR124 G protein-coupled receptor 124 Data Set 2 250 gene model 203729_at EMP3 epithelial membrane protein 3 Data Set 2 250 gene model 212274_at LPIN1 lipin 1 Data Set 2 250 gene model 214606_at TSPAN2 tetraspanin 2 Data Set 2 250 gene model 202796_at SYNPO synaptopodin Data Set 2 250 gene model 209343_at EFHD1 EF-hand domain family, member D1 Data Set 2 250 gene model 227115_at -- Full-length cDNA clone CS0DF020YJ04 of Fetal brain of Homo sapiens (human) Data Set 2 250 gene model 205573_s_at SNX7 sorting nexin 7 Data Set 2 250 gene model 208789_at PTRF polymerase I and transcript release factor Data Set 2 250 gene model 219167_at RASL12 RAS-like, family 12 Data Set 2 250 gene model 213415_at CLIC2 chloride intracellular channel 2 Data Set 2 250 gene model 205132_at ACTC actin, alpha, cardiac muscle Data Set 2 250 gene model 228807_at -- -- Data Set 2 250 gene model 202949_s_at FHL2 four and a half LIM domains 2 Data Set 2 250 gene model 218691_s_at PDLIM4 PDZ and LIM domain 4 Data Set 2 250 gene model 224929_at LOC340061 hypothetical protein LOC340061 Data Set 2 250 gene model 231798_at NOG Noggin Data Set 2 250 gene model 231292_at EID3 E1A-like inhibitor of differentiation 3 Data Set 2 250 gene model 227742_at CLIC6 chloride intracellular channel 6 Data Set 2 250 gene model 243481_at RHOJ ras homolog gene family, member J Data Set 2 250 gene model 236936_at -- -- Data Set 2 250 gene model 206194_at HOXC4 homeobox C4 Data Set 2 250 gene model 221747_at TNS1 Tensin 1 /// Tensin 1 Data Set 2 250 gene model 235737_at TSLP thymic stromal lymphopoietin Data Set 2 250 gene model 223506_at ZC3H8 zinc finger CCCH-type containing 8 Data Set 2 250 gene model 211864_s_at FER1L3 fer-1-like 3, myoferlin (C. elegans) Data Set 2 250 gene model 228202_at PLN Phospholamban Data Set 2 250 gene model 235898_at -- Transcribed locus Data Set 2 250 gene model 238584_at IQCA IQ motif containing with AAA domain Data Set 2 250 gene model 207547_s_at FAM107A family with sequence similarity 107, member A Data Set 2 250 gene model 229480_at LOC402560 hypothetical LOC402560 Data Set 2 250 gene model 212886_at CCDC69 coiled-coil domain containing 69 Data Set 2 250 gene model 227976_at LOC644538 hypothetical protein LOC644538 Data Set 2 250 gene model 209434_s_at PPAT phosphoribosyl pyrophosphate amidotransferase Data Set 2 250 gene model 205083_at AOX1 aldehyde oxidase 1 Data Set 2 250 gene model 213556_at LOC390940 similar to R28379_1 Data Set 2 250 gene model 205304_s_at KCNJ8 potassium inwardly-rectifying channel, subfamily J, member 8 Data Set 2 250 gene model 227554_at LOC402560 Hypothetical LOC402560 Data Set 2 250 gene model 231118_at ANKRD35 ankyrin repeat domain 35 Data Set 2 250 gene model 230087_at PRIMA1 proline rich membrane anchor 1 Data Set 2 250 gene model 200982_s_at ANXA6 annexin A6 Data Set 2 250 gene model 1553102_a_at CCDC69 coiled-coil domain containing 69 Data Set 2 250 gene model 203324_s_at CAV2 caveolin 2 Data Set 2 250 gene model 221898_at PDPN podoplanin Data Set 2 250 gene model 235867_at GSTM3 glutathione S-transferase M3 (brain) Data Set 2 250 gene model 205303_at KCNJ8 potassium inwardly-rectifying channel, subfamily J, member 8 Data Set 2 250 gene model 209356_x_at EFEMP2 EGF-containing fibulin-like extracellular matrix protein 2 Data Set 2 250 gene model 218094_s_at DBNDD2 dysbindin (dystrobrevin binding protein 1) domain containing 2 Data Set 2 250 gene model 204777_s_at MAL mal, T-cell differentiation protein Data Set 2 250 gene model 208792_s_at CLU clusterin Data Set 2 250 gene model 242170_at ZNF154 Zinc finger protein 154 (pHZ-92) Data Set 2 250 gene model 213924_at MPPE1 Metallophosphoesterase 1 Data Set 2 250 gene model 209488_s_at RBPMS RNA binding protein with multiple splicing Data Set 3 5 gene model 1251_g_at RAP1GAP RAP1 GTPase activating protein Data Set 3 5 gene model 32565_at SMARCD3 SWI/SNF related, matrix associated, actin dependent regulator of chromatin, subfamily d, member 3 Data Set 3 5 gene model 36495_at FBP1 fructose-1,6-bisphosphatase 1 Data Set 3 5 gene model 31444_s_at ANXA2 /// annexin A2 /// annexin A2
pseudogene 1 /// annexin A2 pseudogene 3 ANXA2P1 /// ANXA2P3 Data Set 3 5 gene model 575_s_at TACSTD1 tumor-associated calcium signal transducer 1 Data Set 3 10 gene model 36495_at FBP1 fructose-1,6-bisphosphatase 1 Data Set 3 10 gene model 33121_g_at RGS10 regulator of G-protein signalling 10 Data Set 3 10 gene model 39598_at GJB1 gap junction protein, beta 1, 32 kDa (connexin 32, Charcot-Marie-Tooth neuropathy, X-linked) Data Set 3 10 gene model 36666_at P4HB procollagen-proline, 2-oxoglutarate 4-dioxygenase (proline 4-hydroxylase), beta polypeptide Data Set 3 10 gene model 40060_r_at PDLIM5 PDZ and LIM domain 5 Data Set 3 10 gene model 36931_at TAGLN transgelin Data Set 3 10 gene model 34203_at CNN1 calponin 1, basic, smooth muscle Data Set 3 10 gene model 32444_at ATP6V0E2L ATPase, H+ transporting V0 subunit E2-like (rat) Data Set 3 10 gene model 32531_at GJA1 gap junction protein, alpha 1, 43 kDa (connexin 43) Data Set 3 10 gene model 34800_at LRIG1 leucine-rich repeats and immunoglobulin-like domains 1 Data Set 3 20 gene model 38098_at LPIN1 lipin 1 Data Set 3 20 gene model 691_g_at P4HB procollagen-proline, 2-oxoglutarate 4-dioxygenase (proline 4-hydroxylase), beta polypeptide Data Set 3 20 gene model 36785_at HSPB1 heat shock 27 kDa protein 1 Data Set 3 20 gene model 38716_at CAMKK2 calcium/calmodulin-dependent protein kinase kinase 2, beta Data Set 3 20 gene model 35071_s_at GMDS GDP-mannose 4,6-dehydratase Data Set 3 20 gene model 36495_at FBP1 fructose-1,6-bisphosphatase 1 Data Set 3 20 gene model 35823_at PPIB peptidylprolyl isomerase B (cyclophilin B) Data Set 3 20 gene model 32135_at SREBF1 sterol regulatory element binding transcription factor 1 Data Set 3 20 gene model 38435_at PRDX4 peroxiredoxin 4 Data Set 3 20 gene model 37000_at BRP44 brain protein 44 Data Set 3 20 gene model 34885_at SYNGR2 synaptogyrin 2 Data Set 3 20 gene model 41163_at TMED3 transmembrane emp24 protein transport domain containing 3 Data Set 3 20 gene model 39965_at RAC3 ras-related C3 botulinum toxin substrate 3 (rho family, small GTP binding protein Rac3) Data Set 3 20 gene model 37648_at TTLL12 tubulin tyrosine ligase-like family, member 12 Data Set 3 20 gene model 33121_g_at RGS10 regulator of G-protein signalling 10 Data Set 3 20 gene model 33396_at GSTP1 glutathione S-transferase pi Data Set 3 20 gene model 41839_at GAS1 growth arrest-specific 1 Data Set 3 20 gene model 34678_at FER1L3 fer-1-like 3, myoferlin (C. elegans) Data Set 3 20 gene model 40776_at DES desmin Data Set 3 20 gene model 41306_at APBA2BP amyloid beta (A4) precursor protein-binding, family A, member 2 binding protein Data Set 3 50 gene model 37730_at SND1 staphylococcal nuclease domain containing 1 Data Set 3 50 gene model 37809_at HOXA9 homeobox A9 Data Set 3 50 gene model 36624_at IMPDH2 IMP (inosine monophosphate) dehydrogenase 2 Data Set 3 50 gene model 38044_at FAM107A family with sequence similarity 107, member A Data Set 3 50 gene model 35071_s_at GMDS GDP-mannose 4,6-dehydratase Data Set 3 50 gene model 39315_at ANGPT1 angiopoietin 1 Data Set 3 50 gene model 36791_g_at TPM1 tropomyosin 1 (alpha) Data Set 3 50 gene model 37958_at TMEM47 transmembrane protein 47 Data Set 3 50 gene model 36073_at NDN necdin homolog (mouse) Data Set 3 50 gene model 32971_at C9orf61 chromosome 9 open reading frame 61 Data Set 3 50 gene model 32542_at FHL1 four and a half LIM domains 1 Data Set 3 50 gene model 41163_at TMED3 transmembrane emp24 protein transport domain containing 3 Data Set 3 50 gene model 38719_at NSF N-ethylmaleimide-sensitive factor Data Set 3 50 gene model 41696_at C7orf24 chromosome 7 open reading frame 24 Data Set 3 50 gene model 33308_at GUSB glucuronidase, beta Data Set 3 50 gene model 41812_s_at NUP210 nucleoporin 210 kDa Data Set 3 50 gene model 41742_s_at OPTN optineurin Data Set 3 50 gene model 37917_at FLJ20323 hypothetical protein FLJ20323 Data Set 3 50 gene model 40437_at TMEM87A transmembrane protein 87A Data Set 3 50 gene model 1424_s_at YWHAH tyrosine 3-monooxygenase/tryptophan 5-monooxygenase activation protein, eta polypeptide Data Set 3 50 gene model 34739_at FNBP1L formin binding protein 1-like Data Set 3 50 gene model 37000_at BRP44 brain protein 44 Data Set 3 50 gene model 37599_at AOX1 aldehyde oxidase 1 Data Set 3 50 gene model 829_s_at GSTP1 glutathione S-transferase pi Data Set 3 50 gene model 38262_at -- Clone 23620 mRNA sequence Data Set 3 50 gene model 33371_s_at RAB31 RAB31, member RAS oncogene family Data Set 3 50 gene model 33611_g_at CLDN8 claudin 8 Data Set 3 50 gene model 36617_at ID1 inhibitor of DNA binding 1, dominant negative helix-loop-helix protein Data Set 3 50 gene model 40674_s_at HOXC6 homeobox C6 Data Set 3 50 gene model 661_at GAS1 growth arrest-specific 1 Data Set 3 50 gene model 38435_at PRDX4 peroxiredoxin 4 Data Set 3 50 gene model 39031_at COX7A1 cytochrome c oxidase subunit VIIa polypeptide 1 (muscle) Data Set 3 50 gene model 39099_at SEC23A Sec23 homolog A (S. cerevisiae) Data Set 3 50 gene model 32787_at ERBB3 v-erb-b2 erythroblastic leukemia viral oncogene homolog 3 (avian) Data Set 3 50 gene model 36931_at TAGLN transgelin Data Set 3 50 gene model 36432_at MCCC2 methylcrotonoyl-Coenzyme A carboxylase 2 (beta) Data Set 3 50 gene model 41745_at IFITM3 interferon induced transmembrane protein 3 (1-8U) Data Set 3 50 gene model 32314_g_at TPM2 tropomyosin 2 (beta) Data Set 3 50 gene model 36673_at MPI mannose phosphate isomerase Data Set 3 50 gene model 456_at SMARCD3 SWI/SNF related, matrix associated, actin dependent regulator of chromatin, subfamily d, member 3 Data Set 3 50 gene model 34775_at TSPAN1 tetraspanin 1 Data Set 3 50 gene model 38098_at LPIN1 lipin 1 Data Set 3 50 gene model 38716_at CAMKK2 calcium/calmodulin-dependent protein kinase kinase 2, beta Data Set 3 50 gene model 1237_at IER3 immediate early response 3 Data Set 3 50 gene model 33891_at CLIC4 chloride intracellular channel 4 Data Set 3 50 gene model 39965_at RAC3 ras-related C3 botulinum toxin substrate 3 (rho family, small GTP binding protein Rac3) Data Set 3 50 gene model 41306_at APBA2BP amyloid beta (A4) precursor protein-binding, family A, member 2 binding protein Data Set 3 50 gene model 1257_s_at QSCN6 quiescin Q6 Data Set 3 50 gene model 41273_at MXRA7 matrix-remodelling associated 7 Data Set 3 50 gene model 38298_at KCNMB1 potassium large conductance calcium-activated channel, subfamily M, beta member 1 Data Set 3 100 gene model 37043_at ID3 inhibitor of DNA binding 3, dominant negative helix-loop-helix protein Data Set 3 100 gene model 37539_at RGL1 ral guanine nucleotide dissociation stimulator-like 1 Data Set 3 100 gene model 39351_at CD59 CD59 molecule, complement regulatory protein Data Set 3 100 gene model 38422_s_at FHL2 four and a half LIM domains 2 Data Set 3 100 gene model 31684_at ANXA2P1 annexin A2 pseudogene 1 Data Set 3 100 gene model 38739_at ETS2 v-ets erythroblastosis virus E26 oncogene homolog 2 (avian) Data Set 3 100 gene model 36591_at TUBA1 tubulin, alpha 1 (testis specific) Data Set 3 100 gene model 36614_at HSPA5 heat shock 70 kDa protein 5 (glucose-regulated protein, 78 kDa) Data Set 3 100 gene model 32109_at FXYD1 FXYD domain containing ion transport regulator 1 (phospholemman) Data Set 3 100 gene model 38634_at RBP1 retinol binding protein 1, cellular Data Set 3 100 gene model 37326_at PLP2 proteolipid protein 2 (colonic epithelium-enriched) Data Set 3 100 gene model 35771_at DEAF1 deformed epidermal autoregulatory factor 1 (Drosophila) Data Set 3 100 gene model 1363_at FGFR2 fibroblast growth factor receptor 2 (bacteria-expressed kinase, keratinocyte growth factor receptor, craniofacial dysostosis 1, Crouzon syndrome, Pfeiffer syndrome, Jackson-Weiss syndrome) Data Set 3 100 gene model 40674_s_at HOXC6 homeobox C6 Data Set 3 100 gene model 36617_at ID1 inhibitor of DNA binding 1, dominant negative helix-loop-helix protein Data Set 3 100 gene model 38802_at PGRMC1 progesterone receptor membrane component 1 Data Set 3 100 gene model 34793_s_at PLS3 plastin 3 (T isoform) Data Set 3 100 gene model 33317_at CDK7 cyclin-dependent kinase 7 (MO15 homolog, Xenopus laevis, cdk-activating kinase) Data Set 3 100 gene model 34310_at APRT adenine phosphoribosyltransferase Data Set 3 100 gene model 38328_at SLC25A13 solute carrier family 25, member 13 (citrin) Data Set 3 100 gene model 35631_at POLR2H polymerase (RNA) II (DNA directed) polypeptide H Data Set 3 100 gene model 36650_at CCND2 cyclin D2 Data Set 3 100 gene model 1814_at TGFBR2 transforming growth factor, beta receptor II (70/80 kDa) Data Set 3 100 gene model 34320_at PTRF polymerase I and transcript release factor Data Set 3 100 gene model 33610_at CLDN8 claudin 8 Data Set 3 100 gene model 38326_at G0S2 G0/G1switch 2 Data Set 3 100 gene model 212_at ROR2 receptor tyrosine kinase-like orphan receptor 2 Data Set 3 100 gene model 31693_f_at HIST1H2AD /// histone 1, H2ad /// histone 1, H3d HIST1H3D Data Set 3 100 gene model 37599_at AOX1 aldehyde oxidase 1 Data Set 3 100 gene model 38921_at PDE1B phosphodiesterase 1B, calmodulin-dependent Data Set 3 100 gene model 41720_r_at FADS1 fatty acid desaturase 1 Data Set 3 100 gene model 33102_at ADD3 adducin 3 (gamma) Data Set 3 100 gene model 35071_s_at GMDS GDP-mannose 4,6-dehydratase Data Set 3 100 gene model 286_at HIST2H2AA /// histone 2, H2aa /// similar to Histone H2A.o (H2A/o) (H2A.2) (H2a-615) LOC653610 /// /// histone H2A/r H2A/R Data Set 3 100 gene model 32609_at HIST2H2AA /// histone 2, H2aa /// similar to Histone H2A.o (H2A/o) (H2A.2) (H2a-615) LOC653610 /// /// histone H2A/r H2A/R Data Set 3 100 gene model 153_f_at HIST1H2BJ histone 1, H2bj Data Set 3 100 gene model 31524_f_at HIST1H2BI histone 1, H2bi Data Set 3 100 gene model 32971_at C9orf61 chromosome 9 open reading frame 61 Data Set 3 100 gene model 32819_at HIST1H2BK histone 1, H2bk Data Set 3 100 gene model 1662_r_at -- -- Data Set 3 100 gene model 35127_at HIST1H2AE histone 1, H2ae Data Set 3 100 gene model 36347_f_at HIST1H2BN histone 1, H2bn Data Set 3 100 gene model 37485_at SLC27A2 solute carrier family 27 (fatty acid transporter), member 2 Data Set 3 100 gene model 37761_at BAIAP2 BAI1-associated protein 2 Data Set 3 100 gene model 31528_f_at HIST1H2BM histone 1, H2bm Data Set 3 100 gene model 1929_at ANGPT1 angiopoietin 1 Data Set 3 100 gene model 37917_at FLJ20323 hypothetical protein FLJ20323 Data Set 3 100 gene model 35576_f_at HIST1H2BL histone 1, H2bl Data Set 3 100 gene model 33308_at GUSB glucuronidase, beta Data Set 3 100 gene model 33766_at VIPR1 vasoactive intestinal peptide receptor 1 Data Set 3 100 gene model 34769_at FAAH fatty acid amide hydrolase Data Set 3 100 gene model 35628_at TM7SF2 transmembrane 7 superfamily member 2 Data Set 3 100 gene model 38719_at NSF N-ethylmaleimide-sensitive factor Data Set 3 100 gene model 35770_at ATP6AP1 ATPase, H+ transporting, lysosomal accessory protein 1 Data Set 3 100 gene model 41812_s_at NUP210 nucleoporin 210 kDa Data Set 3 100 gene model 38279_at GNAZ guanine nucleotide binding protein (G protein), alpha z polypeptide Data Set 3 100 gene model 31816_at GAA glucosidase, alpha; acid (Pompe disease, glycogen storage disease type II) Data Set 3 100 gene model 32700_at GBP2 guanylate binding protein 2, interferon-inducible Data Set 3 100 gene model 32151_at RANGAP1 Ran GTPase activating protein 1 Data Set 3 100 gene model 32526_at JAM3 junctional adhesion molecule 3 Data Set 3 100 gene model 41139_at MAGED1 melanoma antigen family D, 1 Data Set 3 100 gene model 40436_g_at SLC25A6 solute carrier family 25 (mitochondrial carrier; adenine nucleotide translocator), member 6 Data Set 3 100 gene model 1980_s_at NME2 non-metastatic cells 2, protein (NM23B) expressed in Data Set 3 100 gene model 770_at GPX3 glutathione peroxidase 3 (plasma) Data Set 3 100 gene model 40069_at SVIL supervillin Data Set 3 100 gene model 37713_at ACY1 aminoacylase 1 Data Set 3 100 gene model 36073_at NDN necdin homolog (mouse) Data Set 3 100 gene model 1519_at ETS2 v-ets erythroblastosis virus E26 oncogene homolog 2 (avian) Data Set 3 100 gene model 33708_at SLC43A1 solute carrier family 43, member 1 Data Set 3 100 gene model 38218_at GCNT1 glucosaminyl (N-acetyl) transferase 1, core 2 (beta-1,6-N-acetyl- glucosaminyltransferase) Data Set 3 100 gene model 39852_at SPG20 spastic paraplegia 20, spartin (Troyer syndrome) Data Set 3 100 gene model 40521_at RGL2 ral guanine nucleotide dissociation stimulator-like 2 Data Set 3 100 gene model 34050_at ACSM1 acyl-CoA synthetase medium-chain
family member 1 Data Set 3 100 gene model 40435_at SLC25A6 solute carrier family 25 (mitochondrial carrier; adenine nucleotide translocator), member 6 Data Set 3 100 gene model 37630_at CHRDL1 chordin-like 1 Data Set 3 100 gene model 2011_s_at BIK BCL2-interacting killer (apoptosis-inducing) Data Set 3 100 gene model 38146_at ST18 suppression of tumorigenicity 18 (breast carcinoma) (zinc finger protein) Data Set 3 100 gene model 39082_at ANXA6 annexin A6 Data Set 3 100 gene model 39243_s_at PSIP1 PC4 and SFRS1 interacting protein 1 Data Set 3 100 gene model 41814_at FUCA1 fucosidase, alpha-L-1, tissue Data Set 3 100 gene model 38044_at FAM107A family with sequence similarity 107, member A Data Set 3 100 gene model 36432_at MCCC2 methylcrotonoyl-Coenzyme A carboxylase 2 (beta) Data Set 3 100 gene model 36160_s_at PTPRN2 protein tyrosine phosphatase, receptor type, N polypeptide 2 Data Set 3 100 gene model 34739_at FNBP1L formin binding protein 1-like Data Set 3 100 gene model 36596_r_at GATM glycine amidinotransferase (L-arginine:glycine amidinotransferase) Data Set 3 100 gene model 31685_at FEV FEV (ETS oncogene family) Data Set 3 100 gene model 1911_s_at GADD45A growth arrest and DNA-damage-inducible, alpha Data Set 3 100 gene model 1424_s_at YWHAH tyrosine 3-monooxygenase/tryptophan 5-monooxygenase activation protein, eta polypeptide Data Set 3 100 gene model 40301_at GPR161 G protein-coupled receptor 161 Data Set 3 100 gene model 39315_at ANGPT1 angiopoietin 1 Data Set 3 100 gene model 34213_at WWC1 WW, C2 and coiled-coil domain containing 1 Data Set 3 100 gene model 38435_at PRDX4 peroxiredoxin 4 Data Set 3 100 gene model 33900_at FSTL3 follistatin-like 3 (secreted glycoprotein) Data Set 3 100 gene model 38791_at DDOST dolichyl-diphosphooligosaccharide-protein glycosyltransferase Data Set 3 100 gene model 1597_at GAS6 growth arrest-specific 6 Data Set 3 100 gene model 41207_at C9orf3 chromosome 9 open reading frame 3 Data Set 3 100 gene model 38262_at -- Clone 23620 mRNA sequence Data Set 3 100 gene model 33611_g_at CLDN8 claudin 8 Data Set 3 100 gene model 37000_at BRP44 brain protein 44 Data Set 3 100 gene model 634_at PRSS8 protease, serine, 8 (prostasin) Data Set 3 250 gene model 1248_at POLR2H polymerase (RNA) II (DNA directed) polypeptide H Data Set 3 250 gene model 36955_at LMAN2 lectin, mannose-binding 2 Data Set 3 250 gene model 33135_at SLC19A1 solute carrier family 19 (folate transporter), member 1 Data Set 3 250 gene model 41804_at FLJ22531 hypothetical protein FLJ22531 Data Set 3 250 gene model 33924_at RAB6IP1 RAB6 interacting protein 1 Data Set 3 250 gene model 40663_at REPS2 RALBP1 associated Eps domain containing 2 Data Set 3 250 gene model 40771_at MSN moesin Data Set 3 250 gene model 37939_at APOBEC3C apolipoprotein B mRNA editing enzyme, catalytic polypeptide-like 3C Data Set 3 250 gene model 36452_at SYNPO synaptopodin Data Set 3 250 gene model 37407_s_at MYH11 myosin, heavy polypeptide 11, smooth muscle Data Set 3 250 gene model 33824_at KRT8 keratin 8 Data Set 3 250 gene model 773_at MYH11 myosin, heavy polypeptide 11, smooth muscle Data Set 3 250 gene model 41137_at PPP1R12B protein phosphatase 1, regulatory (inhibitor) subunit 12B Data Set 3 250 gene model 41281_s_at PEX10 peroxisome biogenesis factor 10 Data Set 3 250 gene model 330_s_at -- -- Data Set 3 250 gene model 39714_at SH3BGRL SH3 domain binding glutamic acid-rich protein like Data Set 3 250 gene model 41788_i_at TSC22D2 TSC22 domain family, member 2 Data Set 3 250 gene model 36761_at OVOL2 ovo-like 2 (Drosophila) Data Set 3 250 gene model 39100_at SPOCK1 Sparc/osteonectin, cwcv and kazal-like domains proteoglycan (testican) 1 Data Set 3 250 gene model 33466_at LOC90355 hypothetical gene supported by AF038182; BC009203 Data Set 3 250 gene model 35630_at LLGL2 lethal giant larvae homolog 2 (Drosophila) Data Set 3 250 gene model 37929_at IGSF4 immunoglobulin superfamily, member 4 Data Set 3 250 gene model 39356_at NEDD4L neural precursor cell expressed, developmentally down-regulated 4-like Data Set 3 250 gene model 297_g_at -- -- Data Set 3 250 gene model 1270_at RAP1GAP RAP1 GTPase activating protein Data Set 3 250 gene model 32435_at RPL19 ribosomal protein L19 Data Set 3 250 gene model 35147_at MCF2L MCF.2 cell line derived transforming sequence-like Data Set 3 250 gene model 39331_at TUBB2A tubulin, beta 2A Data Set 3 250 gene model 1225_g_at PCTK1 PCTAIRE protein kinase 1 Data Set 3 250 gene model 33448_at SPINT1 serine peptidase inhibitor, Kunitz type 1 Data Set 3 250 gene model 41468_at TRGC2 /// TRGV2 T cell receptor gamma constant 2 /// T cell receptor gamma variable 2 /// /// TRGV9 /// T cell receptor gamma variable 9 /// TCR gamma alternate reading frame TARP /// protein /// hypothetical protein LOC642083 LOC642083 Data Set 3 250 gene model 38410_at CETN2 centrin, EF-hand protein, 2 Data Set 3 250 gene model 1693_s_at TIMP1 TIMP metallopeptidase inhibitor 1 Data Set 3 250 gene model 33876_at WWTR1 WW domain containing transcription regulator 1 Data Set 3 250 gene model 40856_at SERPINF1 serpin peptidase inhibitor, clade F (alpha-2 antiplasmin, pigment epithelium derived factor), member 1 Data Set 3 250 gene model 2057_g_at FGFR1 fibroblast growth factor receptor 1 (fms-related tyrosine kinase 2, Pfeiffer syndrome) Data Set 3 250 gene model 37247_at TCF21 transcription factor 21 Data Set 3 250 gene model 39170_at CD59 CD59 molecule, complement regulatory protein Data Set 3 250 gene model 37576_at PCP4 Purkinje cell protein 4 Data Set 3 250 gene model 35871_s_at SLC4A4 solute carrier family 4, sodium bicarbonate cotransporter, member 4 Data Set 3 250 gene model 34955_at ABCC4 ATP-binding cassette, sub-family C (CFTR/MRP), member 4 Data Set 3 250 gene model 31528_f_at HIST1H2BM histone 1, H2bm Data Set 3 250 gene model 36790_at TPM1 tropomyosin 1 (alpha) Data Set 3 250 gene model 36533_at PTGIS prostaglandin I2 (prostacyclin) synthase Data Set 3 250 gene model 40127_at SFXN3 sideroflexin 3 Data Set 3 250 gene model 41504_s_at MAF v-maf musculoaponeurotic fibrosarcoma oncogene homolog (avian) Data Set 3 250 gene model 39544_at DMN desmuslin Data Set 3 250 gene model 501_g_at CYP2J2 cytochrome P450, family 2, subfamily J, polypeptide 2 Data Set 3 250 gene model 34684_at RECQL RecQ protein-like (DNA helicase Q1-like) Data Set 3 250 gene model 718_at HTRA1 HtrA serine peptidase 1 Data Set 3 250 gene model 35285_at SLC4A4 solute carrier family 4, sodium bicarbonate cotransporter, member 4 Data Set 3 250 gene model 39409_at C1R /// complement component 1, r subcomponent /// similar to Complement LOC643676 C1r subcomponent precursor (Complement component 1, r subcomponent) Data Set 3 250 gene model 34091_s_at VIM vimentin Data Set 3 250 gene model 32535_at FBN1 fibrillin 1 Data Set 3 250 gene model 36757_at HIST1H3H histone 1, H3h Data Set 3 250 gene model 39165_at NIFUN NifU-like N-terminal domain containing Data Set 3 250 gene model 35365_at ILK integrin-linked kinase Data Set 3 250 gene model 32553_at MAZ MYC-associated zinc finger protein (purine-binding transcription factor) Data Set 3 250 gene model 32543_at CALR calreticulin Data Set 3 250 gene model 36589_at AKR1B1 aldo-keto reductase family 1, member B1 (aldose reductase) Data Set 3 250 gene model 39697_at HSD11B2 hydroxysteroid (11-beta) dehydrogenase 2 Data Set 3 250 gene model 33710_at OACT5 O-acyltransferase (membrane bound) domain containing 5 Data Set 3 250 gene model 32566_at CHPF chondroitin polymerizing factor Data Set 3 250 gene model 38831_f_at GNB2 guanine nucleotide binding protein (G protein), beta polypeptide 2 Data Set 3 250 gene model 565_at SRD5A2 steroid-5-alpha-reductase, alpha polypeptide 2 (3-oxo-5 alpha-steroid delta 4-dehydrogenase alpha 2) Data Set 3 250 gene model 36204_at PTPRF protein tyrosine phosphatase, receptor type, F Data Set 3 250 gene model 38324_at LSR lipolysis stimulated lipoprotein receptor Data Set 3 250 gene model 40422_at IGFBP2 insulin-like growth factor binding protein 2, 36 kDa Data Set 3 250 gene model 32574_at SMPD1 sphingomyelin phosphodiesterase 1, acid lysosomal (acid sphingomyelinase) Data Set 3 250 gene model 41368_at SLC13A3 solute carrier family 13 (sodium-dependent dicarboxylate transporter), member 3 Data Set 3 250 gene model 868_at TAF10 TAF10 RNA polymerase II, TATA box binding protein (TBP)-associated factor, 30 kDa Data Set 3 250 gene model 34843_at ZNF516 zinc finger protein 516 Data Set 3 250 gene model 35749_at TADA3L transcriptional adaptor 3 (NGG1 homolog, yeast)-like Data Set 3 250 gene model 1243_at DDB2 damage-specific DNA binding protein 2, 48 kDa Data Set 3 250 gene model 38292_at HOMER2 homer homolog 2 (Drosophila) Data Set 3 250 gene model 38425_at HMGCL 3-hydroxymethyl-3-methylglutaryl-Coenzyme A lyase (hydroxymethylglutaricaciduria) Data Set 3 250 gene model 39752_at CYB561D2 cytochrome b-561 domain containing 2 Data Set 3 250 gene model 37016_at ECHS1 enoyl Coenzyme A hydratase, short chain, 1, mitochondrial Data Set 3 250 gene model 40570_at FOXO1A forkhead box O1A (rhabdomyosarcoma) Data Set 3 250 gene model 1135_at GRK5 G protein-coupled receptor kinase 5 Data Set 3 250 gene model 33862_at PPAP2B phosphatidic acid phosphatase type 2B Data Set 3 250 gene model 37704_at BCKDHA branched chain keto acid dehydrogenase E1, alpha polypeptide Data Set 3 250 gene model 1985_s_at NME1 non-metastatic cells 1, protein (NM23A) expressed in Data Set 3 250 gene model 32747_at ALDH2 aldehyde dehydrogenase 2 family (mitochondrial) Data Set 3 250 gene model 38408_at TSPAN7 tetraspanin 7 Data Set 3 250 gene model 36232_at FGF13 fibroblast growth factor 13 Data Set 3 250 gene model 40548_at BICD1 bicaudal D homolog 1 (Drosophila) Data Set 3 250 gene model 40775_at ITM2A integral membrane protein 2A Data Set 3 250 gene model 36690_at NR3C1 nuclear receptor subfamily 3, group C, member 1 (glucocorticoid receptor) Data Set 3 250 gene model 37225_at ANKRD15 ankyrin repeat domain 15 Data Set 3 250 gene model 39366_at PPP1R3C protein phosphatase 1, regulatory (inhibitor) subunit 3C Data Set 3 250 gene model 37343_at ITPR3 inositol 1,4,5-triphosphate receptor, type 3 Data Set 3 250 gene model 34987_s_at HNRPA1 /// heterogeneous nuclear ribonucleoprotein A1 /// hypothetical protein LOC644245 LOC644245 Data Set 3 250 gene model 36676_at RPN2 ribophorin II Data Set 3 250 gene model 33253_at TRIM14 tripartite motif-containing 14 Data Set 3 250 gene model 40300_g_at GPR161 G protein-coupled receptor 161 Data Set 3 250 gene model 34695_at SMARCD2 SWI/SNF related, matrix associated, actin dependent regulator of chromatin, subfamily d, member 2 Data Set 3 250 gene model 36965_at ANK3 ankyrin 3, node of Ranvier (ankyrin G) Data Set 3 250 gene model 36950_at TMED9 transmembrane emp24 protein transport domain containing 9 Data Set 3 250 gene model 33404_at CAP2 CAP, adenylate cyclase-associated protein, 2 (yeast) Data Set 3 250 gene model 38161_at ALG3 asparagine-linked glycosylation 3 homolog (S. cerevisiae, alpha-1,3-' mannosyltransferase) Data Set 3 250 gene model 37930_at ATP7B ATPase, Cu++ transporting, beta polypeptide Data Set 3 250 gene model 37022_at PRELP proline/arginine-rich end leucine-rich repeat protein Data Set 3 250 gene model 32579_at SMARCA4 SWI/SNF related, matrix associated, actin dependent regulator of chromatin, subfamily a, member 4 Data Set 3 250 gene model 32246_g_at METTL3 methyltransferase like 3 Data Set 3 250 gene model 39657_at KRT4 keratin 4 Data Set 3 250 gene model 39925_at COL9A2 collagen, type IX, alpha 2 Data Set 3 250 gene model 914_g_at ERG v-ets erythroblastosis virus E26 oncogene like (avian) Data Set 3 250 gene model 1120_at GSTM3 glutathione S-transferase M3 (brain) Data Set 3 250 gene model 36147_at SSR2 signal sequence receptor, beta (translocon-associated protein beta) Data Set 3 250 gene model 36515_at GNE glucosamine (UDP-N-acetyl)-2-epimerase/N-acetylmannosamine kinase Data Set 3 250 gene model 31575_f_at -- -- Data Set 3 250 gene model 34699_at CD2AP CD2-associated protein Data Set 3 250 gene model 32573_at SFRS9 splicing factor, arginine/serine-rich 9 Data Set 3 250 gene model 36660_at RAB11A RAB11A, member RAS oncogene family
Data Set 3 250 gene model 409_at YWHAQ tyrosine 3-monooxygenase/tryptophan 5-monooxygenase activation protein, theta polypeptide Data Set 3 250 gene model 1798_at SLC39A6 solute carrier family 39 (zinc transporter), member 6 Data Set 3 250 gene model 41750_at PDIA6 protein disulfide isomerase family A, member 6 Data Set 3 250 gene model 38684_at ATP2C1 ATPase, Ca++ transporting, type 2C, member 1 Data Set 3 250 gene model 40881_at ACLY ATP citrate lyase Data Set 3 250 gene model 38041_at GALNT1 UDP-N-acetyl-alpha-D-galactosamine:polypeptide N-acetylgalactosaminyl- transferase 1 (GalNAc-T1) Data Set 3 250 gene model 34823_at DPP4 dipeptidyl-peptidase 4 (CD26, adenosine deaminase complexing protein 2) Data Set 3 250 gene model 254_at H3F3A H3 histone, family 3A Data Set 3 250 gene model 32203_at C20orf18 chromosome 20 open reading frame 18 Data Set 3 250 gene model 32506_at TBC1D1 TBC1 (tre-2/USP6, BUB2, cdc16) domain family, member 1 Data Set 3 250 gene model 39023_at IDH1 isocitrate dehydrogenase 1 (NADP+), soluble Data Set 3 250 gene model 36252_at CTF1 cardiotrophin 1 Data Set 3 250 gene model 36572_r_at ARL6IP ADP-ribosylation factor-like 6 interacting protein Data Set 3 250 gene model 38010_at BNIP3 BCL2/adenovirus E1B 19 kDa interacting protein 3 Data Set 3 250 gene model 153_f_at HIST1H2BJ histone 1, H2bj Data Set 3 250 gene model 38666_at PSCD1 pleckstrin homology, Sec7 and coiled-coil domains 1(cytohesin 1) Data Set 3 250 gene model 39056_at PAICS phosphoribosylaminoimidazole carboxylase, phosphoribosylaminoimidazole succinocarboxamide synthetase Data Set 3 250 gene model 31532_at MDS1 myelodysplasia syndrome 1 Data Set 3 250 gene model 32245_at METTL3 methyltransferase like 3 Data Set 3 250 gene model 32609_at HIST2H2AA /// histone 2, H2aa /// similar to Histone H2A.o (H2A/o) (H2A.2) (H2a-615) LOC653610 /// /// histone H2A/r H2A/R Data Set 3 250 gene model 286_at HIST2H2AA /// histone 2, H2aa /// similar to Histone H2A.o (H2A/o) (H2A.2) (H2a-615) LOC653610 /// /// histone H2A/r H2A/R Data Set 3 250 gene model 40607_at DPYSL2 dihydropyrimidinase-like 2 Data Set 3 250 gene model 37117_at ARHGAP8 /// Rho GTPase activating protein 8 /// PRR5-ARHGAP8 fusion LOC553158 Data Set 3 250 gene model 39236_s_at FAAH fatty acid amide hydrolase Data Set 3 250 gene model 31662_at VPS45A vacuolar protein sorting 45A (yeast) Data Set 3 250 gene model 36894_at CBX7 chromobox homolog 7 Data Set 3 250 gene model 40786_at PPP2R5C protein phosphatase 2, regulatory subunit B (B56), gamma isoform Data Set 3 250 gene model 38354_at CEBPB CCAAT/enhancer binding protein (C/EBP), beta Data Set 3 250 gene model 36591_at TUBA1 tubulin, alpha 1 (testis specific) Data Set 3 250 gene model 1739_at FOLH1 folate hydrolase (prostate-specific membrane antigen) 1 Data Set 3 250 gene model 33358_at PPM1H protein phosphatase 1H (PP2C domain containing) Data Set 3 250 gene model 36963_at PGD phosphogluconate dehydrogenase Data Set 3 250 gene model 1513_at -- -- Data Set 3 250 gene model 1336_s_at PRKCB1 protein kinase C, beta 1 Data Set 3 250 gene model 34835_at NCSTN nicastrin Data Set 3 250 gene model 41585_at KIAA0746 KIAA0746 protein Data Set 3 250 gene model 1514_g_at -- -- Data Set 3 250 gene model 35615_at BOP1 /// block of proliferation 1 /// similar to block of proliferation 1 LOC653119 Data Set 3 250 gene model 38614_s_at OGT O-linked N-acetylglucosamine (GlcNAc) transferase (UDP-N-acetyl- glucosamine:polypeptide-N-acetylglucosaminyl transferase) Data Set 3 250 gene model 41098_at DAAM2 dishevelled associated activator of morphogenesis 2 Data Set 3 250 gene model 34840_at SERINC5 Serine incorporator 5 Data Set 3 250 gene model 36986_at LYPLA2 lysophospholipase II Data Set 3 250 gene model 32224_at FCHSD2 FCH and double SH3 domains 2 Data Set 3 250 gene model 38527_at NONO non-POU domain containing, octamer-binding Data Set 3 250 gene model 41720_r_at FADS1 fatty acid desaturase 1 Data Set 3 250 gene model 41526_at HMG20B high-mobility group 20B Data Set 3 250 gene model 38986_at PDIA3 protein disulfide isomerase family A, member 3 Data Set 3 250 gene model 35146_at TGFB1I1 transforming growth factor beta 1 induced transcript 1 Data Set 3 250 gene model 39063_at ACTC actin, alpha, cardiac muscle Data Set 3 250 gene model 40841_at TACC1 transforming, acidic coiled-coil containing protein 1 Data Set 3 250 gene model 36811_at LOXL1 lysyl oxidase-like 1 Data Set 3 250 gene model 40994_at GRK5 G protein-coupled receptor kinase 5 Data Set 3 250 gene model 37573_at ANGPTL2 angiopoietin-like 2 Data Set 3 250 gene model 36937_s_at PDLIM1 PDZ and LIM domain 1 (elfin) Data Set 3 250 gene model 37211_at BDH1 3-hydroxybutyrate dehydrogenase, type 1 Data Set 3 250 gene model 31816_at GAA glucosidase, alpha; acid (Pompe disease, glycogen storage disease type II) Data Set 3 250 gene model 36126_at COASY Coenzyme A synthase Data Set 3 250 gene model 32798_at GSTM3 glutathione S-transferase M3 (brain) Data Set 3 250 gene model 33863_at HYOU1 hypoxia up-regulated 1 Data Set 3 250 gene model 37956_at ALDH3B2 aldehyde dehydrogenase 3 family, member B2 Data Set 3 250 gene model 39521_at SLC12A4 solute carrier family 12 (potassium/chloride transporters), member 4 Data Set 3 250 gene model 1020_s_at CIB1 calcium and integrin binding 1 (calmyrin) Data Set 3 250 gene model 34291_at FARSLA phenylalanine-tRNA synthetase-like, alpha subunit Data Set 3 250 gene model 38151_at LOH11CR2A loss of heterozygosity, 11, chromosomal region 2, gene A Data Set 3 250 gene model 40666_at ENTPD5 ectonucleoside triphosphate diphosphohydrolase 5 Data Set 3 250 gene model 1121_g_at GSTM3 glutathione S-transferase M3 (brain) Data Set 3 250 gene model 518_at NR1H2 nuclear receptor subfamily 1, group H, member 2 Data Set 3 250 gene model 35631_at POLR2H polymerase (RNA) II (DNA directed) polypeptide H Data Set 3 250 gene model 212_at ROR2 receptor tyrosine kinase-like orphan receptor 2 Data Set 3 250 gene model 37761_at BAIAP2 BAI1-associated protein 2 Data Set 3 250 gene model 37582_at KRT15 keratin 15 Data Set 3 250 gene model 32108_at SPR sepiapterin reductase (7,8-dihydrobiopterin:NADP+ oxidoreductase) Data Set 3 250 gene model 35127_at HIST1H2AE histone 1, H2ae Data Set 3 250 gene model 33362_at CDC42EP3 CDC42 effector protein (Rho GTPase binding) 3 Data Set 3 250 gene model 32544_s_at RSU1 Ras suppressor protein 1 Data Set 3 250 gene model 39781_at IGFBP4 insulin-like growth factor binding protein 4 Data Set 3 250 gene model 41870_at PDPN podoplanin Data Set 3 250 gene model 31791_at TP73L tumor protein p73-like Data Set 3 250 gene model 39753_at ITGA5 integrin, alpha 5 (fibronectin receptor, alpha polypeptide) Data Set 3 250 gene model 39123_s_at TRPC1 transient receptor potential cation channel, subfamily C, member 1 Data Set 3 250 gene model 1740_g_at FOLH1 /// folate hydrolase (prostate-specific membrane antigen) 1 /// growth- PSMAL inhibiting protein 26 Data Set 3 250 gene model 31527_at RPS2 ribosomal protein S2 Data Set 3 250 gene model 35711_at GLS2 glutaminase 2 (liver, mitochondrial) Data Set 3 250 gene model 1931_at ABCC4 ATP-binding cassette, sub-family C (CFTR/MRP), member 4 Data Set 3 250 gene model 41139_at MAGED1 melanoma antigen family D, 1 Data Set 3 250 gene model 32260_at PEA15 phosphoprotein enriched in astrocytes 15 Data Set 3 250 gene model 36093_at FLJ30092 AF-1 specific protein phosphatase Data Set 3 250 gene model 38087_s_at S100A4 S100 calcium binding protein A4 (calcium protein, calvasculin, metastasin, murine placental homolog) Data Set 3 250 gene model 37743_at FEZ1 fasciculation and elongation protein zeta 1 (zygin I) Data Set 3 250 gene model 296_at -- -- Data Set 3 250 gene model 35783_at VAMP3 vesicle-associated membrane protein 3 (cellubrevin) Data Set 3 250 gene model 38653_at PMP22 peripheral myelin protein 22 Data Set 3 250 gene model 37827_r_at DOPEY2 dopey family member 2 Data Set 3 250 gene model 37043_at ID3 inhibitor of DNA binding 3, dominant negative helix-loop-helix protein Data Set 3 250 gene model 39124_r_at TRPC1 transient receptor potential cation channel, subfamily C, member 1 Data Set 3 250 gene model 40414_at VARS valyl-tRNA synthetase Data Set 3 250 gene model 32533_s_at VAMP5 vesicle-associated membrane protein 5 (myobrevin) Data Set 3 250 gene model 33883_at EFS embryonal Fyn-associated substrate Data Set 3 250 gene model 1815_g_at TGFBR2 transforming growth factor, beta receptor II (70/80 kDa) Data Set 3 250 gene model 1585_at ERBB3 v-erb-b2 erythroblastic leukemia viral oncogene homolog 3 (avian) Data Set 3 250 gene model 1470_at POLD2 polymerase (DNA directed), delta 2, regulatory subunit 50 kDa Data Set 3 250 gene model 41223_at COX5A cytochrome c oxidase subunit Va Data Set 3 250 gene model 39396_at LYPLA1 lysophospholipase I Data Set 3 250 gene model 37680_at AKAP12 A kinase (PRKA) anchor protein (gravin) 12 Data Set 3 250 gene model 36677_at COPB2 coatomer protein complex, subunit beta 2 (beta prime) Data Set 3 250 gene model 31693_f_at HIST1H2AD /// histone 1, H2ad /// histone 1, H3d HIST1H3D Data Set 3 250 gene model 36618_g_at ID1 inhibitor of DNA binding 1, dominant negative helix-loop-helix protein Data Set 3 250 gene model 34162_at RBPMS RNA binding protein with multiple splicing Data Set 3 250 gene model 924_s_at PPP2CB protein phosphatase 2 (formerly 2A), catalytic subunit, beta isoform Data Set 3 250 gene model 38780_at AKR1A1 aldo-keto reductase family 1, member A1 (aldehyde reductase) Data Set 3 250 gene model 38635_at SSR4 signal sequence receptor, delta (translocon-associated protein delta) Data Set 3 250 gene model 31524_f_at HIST1H2BI histone 1, H2bi Data Set 3 250 gene model 31684_at ANXA2P1 annexin A2 pseudogene 1 Data Set 3 250 gene model 1452_at LMO4 LIM domain only 4 Data Set 3 250 gene model 41225_at DUSP3 dual specificity phosphatase 3 (vaccinia virus phosphatase VH1-related) Data Set 3 250 gene model 40327_at HOXB13 homeobox B13 Data Set 3 250 gene model 37599_at AOX1 aldehyde oxidase 1 Data Set 3 250 gene model 33610_at CLDN8 claudin 8 Data Set 3 250 gene model 41289_at NCAM1 neural cell adhesion molecule 1 Data Set 3 250 gene model 33709_at PDE9A phosphodiesterase 9A Data Set 3 250 gene model 38396_at -- 3'UTR of hypothetical protein (ORF1) Data Set 3 250 gene model 36521_at DZIP1 DAZ interacting protein 1 Data Set 3 250 gene model 38429_at FASN fatty acid synthase Data Set 3 250 gene model 33630_s_at SPTBN2 spectrin, beta, non-erythrocytic 2 Data Set 3 250 gene model 40093_at BCAM basal cell adhesion molecule (Lutheran blood group) Data Set 3 250 gene model 844_at PPP1R1A protein phosphatase 1, regulatory (inhibitor) subunit 1A Data Set 3 250 gene model 38183_at FOXF1 forkhead box F1 Data Set 3 250 gene model 34264_at RUSC1 RUN and SH3 domain containing 1 Data Set 3 250 gene model 38326_at G0S2 G0/G1switch 2 Data Set 3 250 gene model 39351_at CD59 CD59 molecule, complement regulatory protein Data Set 3 250 gene model 38921_at PDE1B phosphodiesterase 1B, calmodulin-dependent Data Set 3 250 gene model 33932_at GSPT1 G1 to S phase transition 1 Data Set 3 250 gene model 38642_at ALCAM activated leukocyte cell adhesion molecule Data Set 3 250 gene model 35742_at C16orf45 chromosome 16 open reading frame 45 Data Set 3 250 gene model 39169_at SEC61G Sec61 gamma subunit Data Set 4 5 gene model AKAP2 Data Set 4 5 gene model CAV1 Data Set 4 5 gene model TACSTD1 Data Set 4 5 gene model HPN_var1 Data Set 4 5 gene model CAMKK2 Data Set 4 10 gene model rap1GAP Data Set 4 10 gene model RAB3B Data Set 4 10 gene model TACSTD1 Data Set 4 10 gene model EXT1 Data Set 4 10 gene model TGFB3 Data Set 4 10 gene model LOC129642 Data Set 4 10 gene model SYNE1 Data Set 4 10 gene model GI_10437016 Data Set 4 10 gene model AKAP2 Data Set 4 10 gene model ITGB3 Data Set 4 20 gene model MLCK Data Set 4 20 gene model IFI27 Data Set 4 20 gene model MLP Data Set 4 20 gene model GNAZ Data Set 4 20 gene model STOM Data Set 4 20 gene model TACSTD1 Data Set 4 20 gene model KIP2 Data Set 4 20 gene model RRAS Data Set 4 20 gene model TIMP2
Data Set 4 20 gene model ILK Data Set 4 20 gene model XLKD1 Data Set 4 20 gene model EXT1 Data Set 4 20 gene model STEAP Data Set 4 20 gene model PYCR1 Data Set 4 20 gene model GSTP1 Data Set 4 20 gene model MEIS2 Data Set 4 20 gene model CDH1 Data Set 4 20 gene model RAB3B Data Set 4 20 gene model SYNE1 Data Set 4 20 gene model GI_10437016 Data Set 4 50 gene model SIAT1 Data Set 4 50 gene model GI_4884218 Data Set 4 50 gene model LIM Data Set 4 50 gene model CCK Data Set 4 50 gene model NBL1 Data Set 4 50 gene model PAICS Data Set 4 50 gene model NKX3-1 Data Set 4 50 gene model BMPR1B Data Set 4 50 gene model REPS2 Data Set 4 50 gene model IFI27 Data Set 4 50 gene model ARFIP2 Data Set 4 50 gene model D-PCa-2_mRNA Data Set 4 50 gene model ATP2C1 Data Set 4 50 gene model EDNRB Data Set 4 50 gene model BCL2_beta Data Set 4 50 gene model GI_3360414 Data Set 4 50 gene model P1 Data Set 4 50 gene model MKI67 Data Set 4 50 gene model CLU Data Set 4 50 gene model MMP2 Data Set 4 50 gene model PLS3 Data Set 4 50 gene model GALNT3 Data Set 4 50 gene model LSAMP Data Set 4 50 gene model ERBB3 Data Set 4 50 gene model LTBP4 Data Set 4 50 gene model SPARCL1 Data Set 4 50 gene model TGFB2_cds Data Set 4 50 gene model HPN_var2 Data Set 4 50 gene model KIAK0002 Data Set 4 50 gene model TNFSF10 Data Set 4 50 gene model KIAA0172 Data Set 4 50 gene model memD Data Set 4 50 gene model DNAH5 Data Set 4 50 gene model PDLIM7 Data Set 4 50 gene model SIM2 Data Set 4 50 gene model KIP2 Data Set 4 50 gene model STRA13 Data Set 4 50 gene model TGFBR3 Data Set 4 50 gene model HNF-3-alpha Data Set 4 50 gene model GNAZ Data Set 4 50 gene model EXT1 Data Set 4 50 gene model STAC Data Set 4 50 gene model MEIS2 Data Set 4 50 gene model MLP Data Set 4 50 gene model MLCK Data Set 4 50 gene model TACSTD1 Data Set 4 50 gene model XLKD1 Data Set 4 50 gene model PYCR1 Data Set 4 50 gene model STEAP Data Set 4 50 gene model CDH1 Data Set 4 100 gene model TRAF5 Data Set 4 100 gene model LIPH Data Set 4 100 gene model TP73 Data Set 4 100 gene model CALM1 Data Set 4 100 gene model TSPAN-1 Data Set 4 100 gene model SEC14L2 Data Set 4 100 gene model CD38 Data Set 4 100 gene model ROBO1 Data Set 4 100 gene model GSTM3 Data Set 4 100 gene model SLC39A6 Data Set 4 100 gene model ALDH1A2 Data Set 4 100 gene model TU3A Data Set 4 100 gene model RGS10 Data Set 4 100 gene model UB1 Data Set 4 100 gene model TRIM29 Data Set 4 100 gene model KAI1 Data Set 4 100 gene model DCC Data Set 4 100 gene model ECT2 Data Set 4 100 gene model NKX3-1 Data Set 4 100 gene model NTN1 Data Set 4 100 gene model GSTM5 Data Set 4 100 gene model IFI27 Data Set 4 100 gene model EZH2 Data Set 4 100 gene model PROK1 Data Set 4 100 gene model TRPM8 Data Set 4 100 gene model CLUL1 Data Set 4 100 gene model ZABC1 Data Set 4 100 gene model MOAT-B Data Set 4 100 gene model LIM Data Set 4 100 gene model MET Data Set 4 100 gene model NY-REN-41 Data Set 4 100 gene model KIAA0389 Data Set 4 100 gene model RPL13A Data Set 4 100 gene model PCGEM1 Data Set 4 100 gene model MAL Data Set 4 100 gene model ITPR1 Data Set 4 100 gene model GAS1 Data Set 4 100 gene model DHCR24 Data Set 4 100 gene model SPDEF Data Set 4 100 gene model SIAT1 Data Set 4 100 gene model PTTG1 Data Set 4 100 gene model MYBL2 Data Set 4 100 gene model PPP1R12A Data Set 4 100 gene model ANGPTL2 Data Set 4 100 gene model PRSS8 Data Set 4 100 gene model TGFB2 Data Set 4 100 gene model CCK Data Set 4 100 gene model HNMP-1 Data Set 4 100 gene model XBP1 Data Set 4 100 gene model SRD5A2 Data Set 4 100 gene model ANXA2 Data Set 4 100 gene model D-PCa-2_mRNA Data Set 4 100 gene model KIAA0003 Data Set 4 100 gene model SLC14A1 Data Set 4 100 gene model GDF15 Data Set 4 100 gene model HSD17B4 Data Set 4 100 gene model PAICS Data Set 4 100 gene model COL5A2 Data Set 4 100 gene model REPS2 Data Set 4 100 gene model NBL1 Data Set 4 100 gene model ARFIP2 Data Set 4 100 gene model BMPR1B Data Set 4 100 gene model D-PCa-2_var1 Data Set 4 100 gene model GJA1 Data Set 4 100 gene model DF Data Set 4 100 gene model GALNT3 Data Set 4 100 gene model PLS3 Data Set 4 100 gene model P1 Data Set 4 100 gene model HOXC6 Data Set 4 100 gene model EDNRB Data Set 4 100 gene model ZAKI-4 Data Set 4 100 gene model SYT7 Data Set 4 100 gene model TBXA2R Data Set 4 100 gene model MMP2 Data Set 4 100 gene model FBP1 Data Set 4 100 gene model AMACR Data Set 4 100 gene model SLIT3 Data Set 4 100 gene model BC008967 Data Set 4 100 gene model CNN1 Data Set 4 100 gene model KIAA0869 Data Set 4 100 gene model BIK Data Set 4 100 gene model XLKD1 Data Set 4 100 gene model CRYAB Data Set 4 100 gene model AKAP2 Data Set 4 100 gene model TMSNB Data Set 4 100 gene model HPN_var1 Data Set 4 100 gene model CAV1 Data Set 4 100 gene model ILK Data Set 4 100 gene model ITGB3 Data Set 4 100 gene model TGFB3 Data Set 4 100 gene model CAMKK2 Data Set 4 100 gene model LOC129642 Data Set 4 100 gene model PYCR1 Data Set 4 100 gene model rap1GAP Data Set 4 100 gene model ITGA5 Data Set 4 100 gene model STOM Data Set 4 100 gene model CDH1 Data Set 4 100 gene model TACSTD1 Data Set 4 100 gene model GSTP1 Data Set 4 100 gene model DNAH5 Data Set 4 250 gene model ESM1 Data Set 4 250 gene model MT3 Data Set 4 250 gene model RIG Data Set 4 250 gene model PEX5 Data Set 4 250 gene model SERPINB5 Data Set 4 250 gene model KLK2 Data Set 4 250 gene model KLK3 Data Set 4 250 gene model RET_var2 Data Set 4 250 gene model RBP1 Data Set 4 250 gene model CKTSF1B1 Data Set 4 250 gene model ODC1 Data Set 4 250 gene model BMP5 Data Set 4 250 gene model PPFIA3 Data Set 4 250 gene model HSA250839 Data Set 4 250 gene model ERBB2 Data Set 4 250 gene model SLC2A3 Data Set 4 250 gene model TRAP1 Data Set 4 250 gene model HUEL Data Set 4 250 gene model OXCT Data Set 4 250 gene model OSBPL8 Data Set 4 250 gene model PMI1 Data Set 4 250 gene model CDC42BPA Data Set 4 250 gene model BC-2 Data Set 4 250 gene model PTGDR Data Set 4 250 gene model THBS1 Data Set 4 250 gene model MMP7 Data Set 4 250 gene model CPXM Data Set 4 250 gene model NDUFA2 Data Set 4 250 gene model ITGA1 Data Set 4 250 gene model NGFB Data Set 4 250 gene model DDR1 Data Set 4 250 gene model PTOV1 Data Set 4 250 gene model LOC283431 Data Set 4 250 gene model ADAMTS1 Data Set 4 250 gene model GI_2094528 Data Set 4 250 gene model GUCY1A3 Data Set 4 250 gene model KIAA1946 Data Set 4 250 gene model HGF Data Set 4 250 gene model SPARC Data Set 4 250 gene model AKR1C3 Data Set 4 250 gene model HLTF Data Set 4 250 gene model TROAP Data Set 4 250 gene model TNFRSF6 Data Set 4 250 gene model LOX Data Set 4 250 gene model ITGB1 Data Set 4 250 gene model MAP2K1IP1 Data Set 4 250 gene model GALNT1 Data Set 4 250 gene model SND1 Data Set 4 250 gene model HNRPAB Data Set 4 250 gene model GI_1178507 Data Set 4 250 gene model D-PCa-2_var2 Data Set 4 250 gene model MMP9 Data Set 4 250 gene model PTEN Data Set 4 250 gene model MCM2 Data Set 4 250 gene model BTG2 Data Set 4 250 gene model CD44 Data Set 4 250 gene model CST3 Data Set 4 250 gene model COL1A1 Data Set 4 250 gene model PRC1 Data Set 4 250 gene model ALG-2 Data Set 4 250 gene model PGM3 Data Set 4 250 gene model C7 Data Set 4 250 gene model JUNB Data Set 4 250 gene model NIPA2 Data Set 4 250 gene model SULF1 Data Set 4 250 gene model COBLL1 Data Set 4 250 gene model PIM1 Data Set 4 250 gene model BCL2_alpha Data Set 4 250 gene model ERG_var1 Data Set 4 250 gene model CCNE2 Data Set 4 250 gene model RGS11 Data Set 4 250 gene model SFN Data Set 4 250 gene model CDH11 Data Set 4 250 gene model MME Data Set 4 250 gene model RGS5 Data Set 4 250 gene model G6PD Data Set 4 250 gene model ITSN Data Set 4 250 gene model LUM Data Set 4 250 gene model NRIP1 Data Set 4 250 gene model GI_839562 Data Set 4 250 gene model ID2 Data Set 4 250 gene model FGF18 Data Set 4 250 gene model ALDH4A1 Data Set 4 250 gene model LIPH Data Set 4 250 gene model NSP Data Set 4 250 gene model CALD1 Data Set 4 250 gene model IMPDH2 Data Set 4 250 gene model KIP Data Set 4 250 gene model DKFZp434C0931 Data Set 4 250 gene model CTHRC1
Data Set 4 250 gene model CRISP3 Data Set 4 250 gene model UCHL5 Data Set 4 250 gene model FBP1 Data Set 4 250 gene model BC008967 Data Set 4 250 gene model CRYAB Data Set 4 250 gene model AMACR Data Set 4 250 gene model KIAA0869 Data Set 4 250 gene model CNN1 Data Set 4 250 gene model AKAP2 Data Set 4 250 gene model BIK Data Set 4 250 gene model CAV1 Data Set 4 250 gene model SLIT3 Data Set 4 250 gene model TMSNB Data Set 4 250 gene model ITGB3 Data Set 4 250 gene model MEIS2 Data Set 4 250 gene model HPN_var1 Data Set 4 250 gene model XLKD1 Data Set 4 250 gene model rap1GAP Data Set 4 250 gene model MLP Data Set 4 250 gene model CAMKK2 Data Set 4 250 gene model CAV2 Data Set 4 250 gene model TGFB3 Data Set 4 250 gene model CDH1 Data Set 4 250 gene model TACSTD1 Data Set 4 250 gene model RAB3B Data Set 4 250 gene model NTRK3 Data Set 4 250 gene model KIP2 Data Set 4 250 gene model RRAS Data Set 4 250 gene model ITGA5 Data Set 4 250 gene model STEAP Data Set 4 250 gene model ILK Data Set 4 250 gene model KIAA0172 Data Set 4 250 gene model SYNE1 Data Set 4 250 gene model GNAZ Data Set 4 250 gene model PYCR1 Data Set 4 250 gene model LOC129642 Data Set 4 250 gene model MMP2 Data Set 4 250 gene model EXT1 Data Set 4 250 gene model GSTP1 Data Set 4 250 gene model ERBB3 Data Set 4 250 gene model GI_10437016 Data Set 4 250 gene model STOM Data Set 4 250 gene model STAC Data Set 4 250 gene model FOLH1 Data Set 4 250 gene model DNAH5 Data Set 4 250 gene model TIMP2 Data Set 4 250 gene model PDLIM7 Data Set 4 250 gene model TGFBR3 Data Set 4 250 gene model HNF-3-alpha Data Set 4 250 gene model SIM2 Data Set 4 250 gene model MLCK Data Set 4 250 gene model memD Data Set 4 250 gene model TNFSF10 Data Set 4 250 gene model KIAK0002 Data Set 4 250 gene model MAL Data Set 4 250 gene model STRA13 Data Set 4 250 gene model ARFIP2 Data Set 4 250 gene model MKI67 Data Set 4 250 gene model TBXA2R Data Set 4 250 gene model ZAKI-4 Data Set 4 250 gene model BCL2_beta Data Set 4 250 gene model CLU Data Set 4 250 gene model P1 Data Set 4 250 gene model GALNT3 Data Set 4 250 gene model GAS1 Data Set 4 250 gene model COL5A2 Data Set 4 250 gene model LTBP4 Data Set 4 250 gene model PLS3 Data Set 4 250 gene model GI_4884218 Data Set 4 250 gene model SYT7 Data Set 4 250 gene model HPN_var2 Data Set 4 250 gene model TGFB2_cds Data Set 4 250 gene model HOXC6 Data Set 4 250 gene model PAICS Data Set 4 250 gene model LSAMP Data Set 4 250 gene model NBL1 Data Set 4 250 gene model GDF15 Data Set 4 250 gene model ITPR1 Data Set 4 250 gene model REPS2 Data Set 4 250 gene model ANGPTL2 Data Set 4 250 gene model BMPR1B Data Set 4 250 gene model GI_3360414 Data Set 4 250 gene model ATP2C1 Data Set 4 250 gene model RPL13A Data Set 4 250 gene model SPARCL1 Data Set 4 250 gene model PRSS8 Data Set 4 250 gene model SLC14A1 Data Set 4 250 gene model DF Data Set 4 250 gene model D-PCa-2_mRNA Data Set 4 250 gene model EDNRB Data Set 4 250 gene model SIAT1 Data Set 4 250 gene model D-PCa-2_var1 Data Set 4 250 gene model XBP1 Data Set 4 250 gene model KIAA0003 Data Set 4 250 gene model VCL Data Set 4 250 gene model KIAA0389 Data Set 4 250 gene model HNMP-1 Data Set 4 250 gene model MOAT-B Data Set 4 250 gene model SRD5A2 Data Set 4 250 gene model PPP1R12A Data Set 4 250 gene model IFI27 Data Set 4 250 gene model PCGEM1 Data Set 4 250 gene model ZABC1 Data Set 4 250 gene model HSD17B4 Data Set 4 250 gene model PPAP2B Data Set 4 250 gene model SPDEF Data Set 4 250 gene model TP73 Data Set 4 250 gene model RGS10 Data Set 4 250 gene model ANXA2 Data Set 4 250 gene model DHCR24 Data Set 4 250 gene model CCK Data Set 4 250 gene model NY-REN-41 Data Set 4 250 gene model MYBL2 Data Set 4 250 gene model NTN1 Data Set 4 250 gene model NKX3-1 Data Set 4 250 gene model TGFB2 Data Set 4 250 gene model GJA1 Data Set 4 250 gene model MET Data Set 4 250 gene model EZH2 Data Set 4 250 gene model PTTG1 Data Set 4 250 gene model FZD7 Data Set 4 250 gene model TRPM8 Data Set 4 250 gene model DCC Data Set 4 250 gene model UB1 Data Set 4 250 gene model CLUL1 Data Set 4 250 gene model LIM Data Set 4 250 gene model SCUBE2 Data Set 4 250 gene model tom1-like Data Set 4 250 gene model TSPAN-1 Data Set 4 250 gene model SEC14L2 Data Set 4 250 gene model SERPINF1 Data Set 4 250 gene model GSTM5 Data Set 4 250 gene model CALM1 Data Set 4 250 gene model DAT1 Data Set 4 250 gene model MCCC2 Data Set 4 250 gene model BNIP3 Data Set 4 250 gene model TFAP2C Data Set 4 250 gene model KAI1 Data Set 4 250 gene model TGFB1 Data Set 4 250 gene model NEFH Data Set 4 250 gene model ALDH1A2 Data Set 4 250 gene model ECT2 Data Set 4 250 gene model COL4A2 Data Set 4 250 gene model TU3A Data Set 4 250 gene model CHAF1A Data Set 4 250 gene model CD38 Data Set 4 250 gene model CES1 Data Set 4 250 gene model DKFZP564B167 Data Set 4 250 gene model STEAP2 Data Set 4 250 gene model COL4A1 Data Set 4 250 gene model SLC39A6 Data Set 4 250 gene model UNC5C Data Set 4 250 gene model TMEPAI Data Set 4 250 gene model GI_2056367 Data Set 4 250 gene model Prostein Data Set 4 250 gene model GPR43 Data Set 4 250 gene model GI_22761402 Data Set 4 250 gene model PROK1 Data Set 4 250 gene model TRIM29 Data Set 4 250 gene model ANTXR1
TABLE-US-00021 TABLE 19 In silico tissue components (tumor/stroma) prediction discrepancies (%) and correlation coefficients compared to pathologist's estimates across data sets. Test Set\Training Set Data Set 1 Data Set 2 Data Set 3 Data Set 4 Data Set 1 NA 11.6/11.8(0.82/0.73) 23.7/27(0.86/0.74) 13.3/18.8(0.82/0.75) Data Set 2 11/16.7(0.89/0.76) NA 22.1/38.2(0.84/0.63) 28.6/25.8(0.79/0.72) Data Set 3 14.5/15.1(0.76/0.64 13.7/22.3(0.75/0.59) NA 17.4/14.7(0.71/0.59) Data Set 4 12.1/24.5(0.76/0.62) 12.7/23.7(0.73/0.62) 12.8/19.9(0.72/0.61) NA
Example 4
Identification of Tissue Specific Genes in Prostate Cancer
[0324] Genes specifically expressed in different cell types (tumor, stroma, BPH and atrophic gland) of prostate tissue were identified.
Tissue Content Prediction Using Gene Expression Profile
[0325] Using linear models based on a small list of tissue specific genes, the tissue components of samples hybridized to the array is predictable. These genes are listed in Table 20.
Tissue Specific Relapse Related Genes
[0326] Some tissue specific genes showed significant expression level changes between relapse and non-relapse samples. The gene list is shown in Table 8 above.
TABLE-US-00022 TABLE 20 Tissue specific genes for tissue prediction. Tissue Type Gene RefSeq Rep. UniGene Predicted U133A ID Gene Title Symbol Transcript ID Public ID ID Tumor 211194_s_at tumor protein p73- TP73L NM_003722 AB010153 Hs. 137569 like Tumor 202310_s_at collagen, type I, COL1A NM_000088 K01228 Hs. 172928 alpha 1 1 Tumor 216062_at CD44 molecule CD44 NM_000610 /// AW851559 Hs. 502328 (Indian blood NM_001001389 group) /// NM_001001390 /// NM_001001391 /// NM_001001392 Tumor 211872_s_at regulator of G- RGS11 NM_003834 /// AB016929 Hs. 65756 protein signalling NM_183337 11 Tumor 215240_at integrin, beta 3 ITGB3 NM_000212 AI189839 Hs. 218040 (platelet glycoprotein IIIa, antigen CD61) Tumor 204748_at prostaglandin- PTGS2 NM_000963 NM_000963 Hs. 196384 endoperoxide synthase 2 (prostaglandin G/H synthase and cyclooxygenase) Tumor 204926_at inhibin, beta A INHBA NM_002192 NM_002192 Hs. 583348 (activin A, activin AB alpha polypeptide) Tumor 205042_at glucosamine GNE NM_005476 NM_005476 Hs. 5920 (UDP-N-acetyl)-2- epimerase/N- acetylmannosamine kinase Tumor 222043_at clusterin CLU NM_001831 /// AI982754 Hs. 436657 NM_203339 Tumor 212984_at activating ATF2 NM_001880 BE786164 Hs. 591614 transcription factor 2 Tumor 215775_at Thrombospondin 1 THBS1 NM_003246 BF084105 Hs. 164226 Tumor 204742_s_at androgen-induced APRIN NM_015032 NM_015032 Hs. 567425 proliferation inhibitor Tumor 203698_s_at frizzled-related FRZB NM_001463 NM_001463 Hs. 128453 protein Tumor 209771_x_at CD24 molecule CD24 NM_013230 AA761181 Hs. 632285 Tumor 201839_s_at tumor-associated TACST NM_002354 NM_002354 Hs. 542050 calcium signal D1 transducer 1 Tumor 205834_s_at Prostate androgen- PART1 -- NM_016590 Hs. 146312 regulated transcript 1 Tumor 209935_at ATPase, Ca++ ATP2C NM_001001485 AF225981 Hs. 584884 transporting, type 1 /// 2C, member 1 NM_001001486 /// NM_001001487 /// NM_014382 Tumor 211834_s_at tumor protein p73- TP73L NM_003722 AB042841 Hs. 137569 like Tumor 210930_s_at v-erb-b2 ERBB2 NM_001005862 AF177761 Hs. 446352 erythroblastic /// NM_004448 leukemia viral oncogene homolog 2, neuro/glioblastoma derived oncogene homolog (avian) Tumor 212230_at phosphatidic acid PPAP2 NM_003713 /// AV725664 Hs. 405156 phosphatase type B NM_177414 2B Tumor 202089_s_at solute carrier SLC39 NM_012319 NM_012319 Hs. 79136 family 39 (zinc A6 transporter), member 6 Tumor 201409_s_at protein PPP1C NM_002709 /// NM_002709 Hs. 591571 phosphatase 1, B NM_206876 /// catalytic subunit, NM_206877 beta isoform Tumor 201555_at MCM3 MCM3 NM_002388 NM_002388 Hs. 179565 minichromosome maintenance deficient 3 (S. cerevisiae) Tumor 217487_x_at folate hydrolase FOLH1 NM_001014986 AF254357 Hs. 380325 (prostate-specific /// NM_004476 membrane antigen) 1 Tumor 201744_s_at lumican LUM NM_002345 NM_002345 Hs. 406475 Tumor 201215_at plastin 3 (T PLS3 NM_005032 NM_005032 Hs. 496622 isoform) Tumor 211748_x_at prostaglandin D2 PTGDS NM_000954 BC005939 Hs. 446429 synthase 21 kDa (brain) /// prostaglandin D2 synthase 21 kDa (brain) Tumor 221788_at Phosphoglucomutase PGM3 NM_015599 AV727934 Hs. 598312 3 Tumor 215564_at Amphiregulin AREG NM_001657 AV652031 Hs. 270833 (schwannoma- derived growth factor) Tumor 211964_at collagen, type IV, COL4A NM_001846 X05610 Hs. 508716 alpha 2 2 Tumor 201739_at serum/glucocorticoid SGK NM_005627 NM_005627 Hs. 510078 regulated kinase Tumor 209854_s_at kallikrein 2, KLK2 NM_001002231 AA595465 Hs. 515560 prostatic /// NM_001002232 /// NM_005551 Tumor 33322_i_at stratifin SFN NM_006142 X57348 Hs. 523718 Tumor 205780_at BCL2-interacting BIK NM_001197 NM_001197 Hs. 475055 killer (apoptosis- inducing) Tumor 201577_at non-metastatic NME1 NM_000269 /// NM_000269 Hs. 463456 cells 1, protein NM_198175 (NM23A) expressed in Tumor 209706_at NK3 transcription NKX3- NM_006167 AF247704 Hs. 55999 factor related, 1 locus 1 (Drosophila) Tumor 200931_s_at vinculin VCL NM_003373 /// NM_014000 Hs. 500101 NM_014000 Tumor 202436_s_at cytochrome P450, CYP1B NM_000104 AU144855 Hs. 154654 family 1, 1 subfamily B, polypeptide 1 Tumor 209283_at crystallin, alpha B CRYA NM_001885 AF007162 Hs. 408767 B Tumor 202088_at solute carrier SLC39 NM_012319 AI635449 Hs. 79136 family 39 (zinc A6 transporter), member 6 Tumor 215350_at spectrin repeat SYNE1 NM_015293 /// AB033088 Hs. 12967 containing, nuclear NM_033071 /// envelope 1 NM_133650 /// NM_182961 Stroma 202088_at solute carrier SLC39 NM_012319 AI635449 Hs. 79136 family 39 (zinc A6 transporter), member 6 Stroma 200931_s_at vinculin VCL NM_003373 /// NM_014000 Hs. 500101 NM_014000 Stroma 209854_s_at kallikrein 2, KLK2 NM_001002231 AA595465 Hs. 515560 prostatic /// NM_001002232 /// NM_005551 Stroma 205780_at BCL2-interacting BIK NM_001197 NM_001197 Hs. 475055 killer (apoptosis- inducing) Stroma 217487_x_at folate hydrolase FOLH1 NM_001014986 AF254357 Hs. 380325 (prostate-specific /// NM_004476 membrane antigen) 1 Stroma 221788_at Phosphoglucomutase PGM3 NM_015599 AV727934 Hs. 598312 3 Stroma 202089_s_at solute carrier SLC39 NM_012319 NM_012319 Hs. 79136 family 39 (zinc A6 transporter), member 6 Stroma 211194_s_at tumor protein p73- TP73L NM_003722 AB010153 Hs. 137569 like BPH 205659_at histone deacetylase HDAC9 NM_014707 /// NM_014707 Hs. 196054 9 NM_058176 /// NM_058177 /// NM_178423 /// NM_178425 BPH 215350_at spectrin repeat SYNE1 NM_015293 /// AB033088 Hs. 12967 containing, nuclear NM_033071 /// envelope 1 NM_133650 /// NM_182961 BPH 201577_at non-metastatic NME1 NM_000269 /// NM_000269 Hs. 463456 cells 1, protein NM_198175 (NM23A) expressed in BPH 215564_at Amphiregulin AREG NM_001657 AV652031 Hs. 270833 (schwannoma- derived growth factor) BPH 210984_x_at epidermal growth EGFR NM_005228 /// U95089 Hs. 488293 factor receptor NM_201282 /// (erythroblastic NM_201283 /// leukemia viral (v- NM_201284 erb-b) oncogene homolog, avian) BPH 33322_i_at stratifin SFN NM_006142 X57348 Hs. 523718 BPH 202312_s_at collagen, type I, COL1A NM_000088 NM_000088 Hs. 172928 alpha 1 1 BPH 211834_s_at tumor protein p73- TP73L NM_003722 AB042841 Hs. 137569 like BPH 204777_s_at mal, T-cell MAL NM_002371 /// NM_002371 Hs. 80395 differentiation NM_022438 /// protein NM_022439 /// NM_022440 BPH 201667_at gap junction GJA1 NM_000165 NM_000165 Hs. 74471 protein, alpha 1, 43 kDa (connexin 43) BPH 202436_s_at cytochrome P450, CYP1B NM_000104 AU144855 Hs. 154654 family 1, 1 subfamily B, polypeptide 1 BPH 210930_s_at v-erb-b2 ERBB2 NM_001005862 AF177761 Hs. 446352 erythroblastic /// NM_004448 leukemia viral oncogene homolog 2, neuro/glioblastoma derived oncogene homolog (avian) BPH 214403_x_at SAM pointed SPDEF NM_012391 AI307915 Hs. 485158 domain containing ets transcription factor BPH 212230_at phosphatidic acid PPAP2 NM_003713 /// AV725664 Hs. 405156 phosphatase type B NM_177414 2B BPH 33767_at neurofilament, NEFH NM_021076 X15306 Hs. 198760 heavy polypeptide 200 kDa BPH 200931_s_at vinculin VCL NM_003373 /// NM_014000 Hs. 500101 NM_014000 BPH 217995_at sulfide quinone SQRDL NM_021199 NM_021199 Hs. 511251 reductase-like (yeast) BPH 204734_at keratin 15 KRT15 NM_002275 NM_002275 -- BPH 209706_at NK3 transcription NKX3- NM_006167 AF247704 Hs. 55999 factor related, 1 locus 1 (Drosophila) BPH 214399_s_at Keratin 8 KRT8 NM_002273 BF588953 Hs. 533782 BPH 211964_at collagen, type IV, COL4A NM_001846 X05610 Hs. 508716 alpha 2 2 BPH 203372_s_at suppressor of SOCS2 NM_003877 AB004903 Hs. 485572 cytokine signaling 2 BPH 211156_at cyclin-dependent CDKN2 NM_000077 /// AF115544 Hs. 512599 kinase inhibitor 2A A NM_058195 /// (melanoma, p16, NM_058197
inhibits CDK4) BPH 205780_at BCL2-interacting BIK NM_001197 NM_001197 Hs. 475055 killer (apoptosis- inducing) BPH 212142_at MCM4 MCM4 NM_005914 /// AI936566 Hs. 460184 minichromosome NM 182746 maintenance deficient 4 (S. cerevisiae) BPH 201130_s_at cadherin 1, type 1, CDH1 NM_004360 L08599 Hs. 461086 E-cadherin (epithelial) BPH 201109_s_at thrombospondin 1 THBS1 NM_003246 AV726673 Hs. 164226 BPH 215775_at Thrombospondin 1 THBS1 NM_003246 BF084105 Hs. 164226 BPH 201262_s_at biglycan BGN NM_001711 NM_001711 Hs. 821 BPH 204625_s_at integrin, beta 3 ITGB3 NM_000212 BF115658 Hs. 218040 (platelet glycoprotein IIIa, antigen CD61) BPH 216062_at CD44 molecule CD44 NM_000610 /// AW851559 Hs. 502328 (Indian blood NM_001001389 group) /// NM_001001390 /// NM_ 001001391 /// NM_001001392 BPH 222043_at clusterin CLU NM_001831 /// AI982754 Hs. 436657 NM_203339 BPH 204748_at prostaglandin- PTGS2 NM_000963 NM_000963 Hs. 196384 endoperoxide synthase 2 (prostaglandin G/H synthase and cyclooxygenase) BPH 215240_at integrin, beta 3 ITGB3 NM_000212 AI189839 Hs. 218040 (platelet glycoprotein IIIa, antigen CD61) BPH 219197_s_at signal peptide, SCUBE NM_020974 AI424243 Hs. 523468 CUB domain, 2 EGF-like 2 BPH 211194_s_at tumor protein p73- TP73L NM_003722 AB010153 Hs. 137569 like Tumor 214460_at limbic system- LSAMP NM_002338 NM_002338 Hs. 26479 associated membrane protein Tumor 201394_s_at RNA binding RBM5 NM_005778 U23946 Hs. 439480 motif protein 5 Tumor 202525_at protease, serine, 8 PRSS8 NM_002773 NM_002773 Hs. 75799 (prostasin) Tumor 201577_at non-metastatic NME1 NM_000269 /// NM_000269 Hs. 463456 cells 1, protein NM_198175 (NM23A) expressed in Tumor 205645_at RALBP1 REPS2 NM_004726 NM_004726 Hs. 186810 associated Eps domain containing 2 Tumor 203425_s_at insulin-like growth IGFBP5 NM_000599 NM_000599 Hs. 369982 factor binding protein 5 Tumor 202404_s_at collagen, type I, COL1A NM_000089 NM_000089 Hs. 489142 alpha 2 2 Tumor 200795_at SPARC-like 1 SPARC NM_004684 NM_004684 Hs. 62886 (mast9, hevin) L1 Tumor 214800_x_at basic transcription BTF3 NM_001037637 R83000 Hs. 591768 factor 3 /// NM_001207 Tumor 207169_x_at discoidin domain DDR1 NM_001954 /// NM_001954 Hs. 631988 receptor family, NM_013993 /// member 1 NM_013994 Tumor 209854_s_at kallikrein 2, KLK2 NM_001002231 AA595465 Hs. 515560 prostatic /// NM_001002232 /// NM_005551 Stroma 209854_s_at kallikrein 2, KLK2 NM_001002231 AA595465 Hs. 515560 prostatic /// NM_001002232 /// NM_005551 Stroma 200795_at SPARC-like 1 SPARC NM_004684 NM_004684 Hs. 62886 (mast9, hevin) L1 Stroma 207169_x_at discoidin domain DDR1 NM_001954 /// NM_001954 Hs. 631988 receptor family, NM_013993 /// member 1 NM_013994 Stroma 212647_at related RAS viral RRAS NM_006270 NM_006270 Hs. 515536 (r-ras) oncogene homolog Stroma 201131_s_at cadherin 1, type 1, CDH1 NM_004360 NM_004360 Hs. 461086 E-cadherin (epithelial) Stroma 214800_x_at basic transcription BTF3 NM_001037637 R83000 Hs. 591768 factor 3 /// NM_001207 Stroma 202404_s_at collagen, type I, COL1A NM_000089 NM_000089 Hs. 489142 alpha 2 2 Stroma 219960_s_at ubiquitin carboxyl- UCHL5 NM_015984 NM_015984 Hs. 591458 terminal hydrolase L5 Stroma 201615_x_at caldesmon 1 CALD1 NM_004342 /// AI685060 Hs. 490203 NM_033138 /// NM_033139 /// NM_033140 /// NM_033157 Stroma 205541_s_at G1 to S phase GSPT2 NM_018094 NM_018094 Hs. 59523 transition 2 /// G1 to S phase transition 2 Stroma 203084_at transforming TGFB1 NM_000660 NM_000660 Hs. 155218 growth factor, beta 1 (Camurati- Engelmann disease) Stroma 207956_x_at androgen-induced APRIN NM_015032 NM_015928 Hs. 567425 proliferation inhibitor Stroma 201995_at exostoses EXT1 NM_000127 NM_000127 Hs. 492618 (multiple) 1 Stroma 205645_at RALBP1 REPS2 NM_004726 NM 004726 Hs. 186810 associated Eps domain containing 2 Stroma 201577_at non-metastatic NME1 NM_000269 /// NM_000269 Hs. 463456 cells 1, protein NM_198175 (NM23A) expressed in Stroma 201394_s_at RNA binding RBMS NM_005778 U23946 Hs. 439480 motif protein 5 Stroma 202525_at protease, serine, 8 PRSS8 NM_002773 NM_002773 Hs. 75799 (prostasin) Stroma 214460_at limbic system- LSAMP NM_002338 NM_002338 Hs. 26479 associated membrane protein BPH 201109_s_at thrombospondin 1 THBS1 NM_003246 AV726673 Hs. 164226 BPH 202786_at serine threonine STK39 NM_013233 NM_013233 Hs. 276271 kinase 39 (STE20/SPS1 homolog, yeast) BPH 203323_at caveolin 2 CAV2 NM_001233 /// BF197655 Hs. 212332 NM_198212 BPH 211945_s_at integrin, beta 1 ITGB1 NM_002211 /// BG500301 Hs. 429052 (fibronectin NM_033666 /// receptor, beta NM_033667 /// polypeptide, NM_033668 /// antigen CD29 NM_033669 /// includes MDF2, NM_133376 MSK12) BPH 204470_at chemokine (C-X-C CXCL1 NM_001511 NM_001511 Hs. 789 motif) ligand 1 (melanoma growth stimulating activity, alpha)
Example 5
Development of Predictive Biomarkers of Prostate Cancer
[0327] Cancer gene expression profiling studies often measure bulk tumor samples that contain a wide range of mixtures of multiple cell types. The differences in tissue components add noise to any measurement of expression in tumor cells. Such noise would be reduced by taking tissue percentages into account. However, such information does not exist for most available datasets.
[0328] Linear models for predicting tissue components (tumor, stroma, and benign prostatic hyperplasia) using two large public prostate cancer expression microarray datasets whose tissue components were estimated by pathologists (datasets 1 and 2) were developed. Mutual in silico predictions of tissue percentages between datasets 1 and 2 correlated with pathologists' estimates for tumor, stroma and BPH (pairwise comparisons for each tissue p<0.0001). The model from dataset 2 was used to predict tissue percentages of a third large public dataset, for which tissue percentages were unknown. Then datasets 1 and 3 were used to identify candidate recurrence-related genes. The number of concordant recurrence-related markers significantly increased when the predicted tissue components were used. The most significant candidates are listed herein. This is the first known endeavor that finds genes predicative of outcome in two or more independent prostate cancer datasets. Given that tumors are highly heterogeneous and include many irrelevant changes, some markers in adjacent stroma or epithelial tissues could be reliable alternative sensors for recurrent versus non-recurrent cancers. The candidate biomarkers associated with recurrence after prostatectomy are included here.
[0329] Previously, a modification of the linear combination model of Stuart et al. 2004 was demonstrated and validated. This method is then employed to correct the independent data to that expected based on cell composition. The corrected data is used to validate genes discovered by analysis of the data to exhibit significant differential expression between non-recurrent and recurrent (aggressive) prostate cancer. The biomarkers of this and previous approaches are compared.
[0330] Herein, the result of further manipulation of the data is presented in Table form. A list of genes is provided that cross validate across the U01/SPECS dataset (dataset 1, which has tissue percentage estimated) and the dataset of Stephenson et al. (supra), dataset 3 where tissue percentages are estimated by applying a model based on tissue percentages in Bibilova et al. (supra).
[0331] Previous reports summarized efforts toward the development of enhanced methods and specification of genes for the prediction of the outcome of prostate cancer. The current report summarizes continued development of predictive biomarkers of Prostate Cancer.
[0332] The goals of this study are to continue development of predicative biomarkers of prostate cancer. In particular the goal of the work summarized here is to use independent datasets to validate genes deduced as predictive based on studies of dataset 1 (infra vide). Here "dataset" refers to the array-based RNA expression data of all cases of a given set together with the clinical data defining whether a given case recurred or remained disease free, a censored quantity. Only the categorical value, recurrent or non recurrent, is used in the analyses described here.
[0333] For the purposes of the present work, recurrent prostate cancer is taken as a surrogate of aggressive disease while a non-recurrent patient is taken as indolent disease with a variable degree of indolence that is directly proportional to the disease-free survival time. The dataset 1 contains 26 non-recurrent patients, 29 recurrent patients, the dataset 2 contains 63 non-recurrent patients, 18 recurrent patients, and the dataset 3 contains 29 non-recurrent patients and 42 recurrent patients. The data used for this analysis are subsets of previous datasets. Only samples containing more than 0% tumor and follow-up times longer than 2 years for non-recurrent and 4 years for recurrent cases were included for this particular analysis. The first two datasets' samples have various amount of different tissue and cell types, including tumor cells, stroma cells (a collective term for fibroblasts, myofibroblasts, smooth muscle, and small amounts of nerve and vascular elements), BPH (epithelial cells of benign prostate hypertrophy) and dilated cystic glands (AKA "atrophic" cystic glands), as estimated by four pathologists (Stuart et al., supra) for dataset 1 and one pathologist for dataset 2. Dataset 3 samples were tumor-enriched samples, as claimed by the authors (a coauthor of that study, Steven Goodison, is also a coauthor of Stuart et al. PNAS 2004). In this study, published datasets 2 and 3 were used for the purpose of validation only. A major goal of this study is to use "external" published datasets to validate the properties deduced for genes based on analysis of the dataset 1.
[0334] Linear regression analysis was performed on the SPECS (dataset 1) and Goodison (dataset 3) arrays, separately. Estimates of significance of association with recurrence were determined as described in previous updates. The accompanying table filters this data as follows. First, genes associated with recurrence with p<0.1 in any tissue in either dataset were retained. Those genes that showed expression changes that were concordant between datasets were retained. However, the confidence in tissue assignment is not great because stroma and tumor tissue percentages are naturally anti-correlated. Thus, the data was also filtered for genes with p<0.1 which appeared to move in opposite directions in these two tissues across datasets as these are about as likely to be real changes and concordant changes in one tissue across datasets. In addition, genes that had a p<0.01 in one tissue in one dataset were also retained even if the other dataset did not show a significant change, if the fold change in either stroma or tumor was consistent across datasets and there was at least a two-fold change in both datasets. Following these procedures and criteria we observed the results listed in Table 21.
[0335] This is the first known endeavor that finds genes predicative of outcome in two or more independent prostate cancer datasets. In addition, some of the identified prognosticators are likely to occur in stroma or in BPH rather than in tumor. Such markers in stroma or BPH may be more easily observed as these tissues are more prevalent and more genetically homogeneous than tumor cells.
TABLE-US-00023 TABLE 21 Prognosticators for prostate cancer recurrence after prostatectomy. (A) Genes predicted to be down regulated in prostate tumor cells or up regulated in prostate stroma cells in patients in which prostate cancer will recur after prostatectomy. (A1) Genes predicted to have expression changes greater than 2-fold in the current datasets. 201042_at 203932_at 211573_x_at 201169_s_at 203973_s_at 211635_x_at 201170_s_at 204070_at 211637_x_at 201288_at 204135_at 211644_x_at 201465_s_at 204670_x_at 211650_x_at 201531_at 206332_s_at 211798_x_at 201566_x_at 206360_s_at 213541_s_at 201720_s_at 206392_s_at 214669_x_at 201721_s_at 208966_x_at 214768_x_at 202269_x_at 209138_x_at 214777_at 202531_at 209457_at 214836_x_at 202627_s_at 209823_x_at 214916_x_at 202628_s_at 210915_x_at 215121_x_at 202643_s_at 211003_x_at 215193_x_at 203290_at 211430_s_at (A2) Genes predicted to have expression changes less than 2-fold in the current datasets. 179_at 203028_s_at 204438_at 200748_s_at 203052_at 204446_s_at 200795_at 203269_at 204561_x_at 201367_s_at 203416_at 204789_at 201496_x_at 203591_s_at 204790_at 201539_s_at 203640_at 204820_s_at 201540_at 203748_x_at 204890_s_at 201645_at 203758_at 204940_at 201650_at 203760_s_at 205375_at 202205_at 203851_at 205459_s_at 202283_at 203923_s_at 205476_at 202574_s_at 204116_at 205508_at 202637_s_at 204192_at 205582_s_at 202748_at 204265_s_at 206366_x_at 207201_s_at 211633_x_at 216984_x_at 207334_s_at 211639_x_at 217227_x_at 207629_s_at 211649_x_at 217236_x_at 208110_x_at 211835_at 217239_x_at 208146_s_at 212016_s_at 217326_x_at 208278_s_at 212230_at 217360_x_at 208461_at 212613_at 217384_x_at 208734_x_at 212860_at 217478_s_at 208889_s_at 212938_at 217691_x_at 209182_s_at 213095_x_at 217883_at 209320_at 213176_s_at 218047_at 209346_s_at 213193_x_at 218087_s_at 209402_s_at 213293_s_at 218232_at 209447_at 213422_s_at 218301_at 209685_s_at 213497_at 218368_s_at 209873_s_at 213556_at 218718_at 209880_s_at 213958_at 218965_s_at 210051_at 214040_s_at 219202_at 210166_at 214219_x_at 219256_s_at 210190_at 214252_s_at 219541_at 210225_x_at 214326_x_at 219677_at 210298_x_at 214450_at 221237_s_at 210299_s_at 214551_s_at 221293_s_at 210785_s_at 214567_s_at 221667_s_at 210845_s_at 215116_s_at 221882_s_at 210933_s_at 215388_s_at 222079_at 211230_s_at 216224_s_at 222100_at 211628_x_at 216248_s_at 222210_at (B) Genes predicted to be up regulated in prostate tumor cells or down regulated in prostate stroma cells in patients in which prostate cancer will recur after prostatectomy. (B1) Genes predicted to have expression changes greater than 2-fold in the current datasets. 201660_at 213510_x_at 218518_at 201661_s_at 214109_at 218519_at 201824_at 215363_x_at 218930_s_at 203791_at 217483_at 219368_at 205311_at 217487_x_at 219685_at 205489_at 217566_s_at 220724_at 205860_x_at 217894_at 221802_s_at 211303_x_at 217900_at 213331_s_at 218224_at (B2) Genes predicted to have expression changes less than 2-fold in the current datasets. 201782_s_at 202322_s_at 202592_at 202053_s_at 202337_at 202596_at 202056_at 202352_s_at 202892_at 202070_s_at 202538_s_at 202903_at 202919_at 207769_s_at 218260_at 202959_at 208281_x_at 218291_at 203207_s_at 208839_s_at 218296_x_at 203359_s_at 208873_s_at 218333_at 203503_s_at 208942_s_at 218344_s_at 203531_at 209111_at 218373_at 203538_at 209162_s_at 218403_at 203667_at 209274_s_at 218499_at 203814_s_at 209585_s_at 218510_x_at 203869_at 209662_at 218521_s_at 204045_at 209817_at 218532_s_at 204159_at 210988_s_at 218583_s_at 204173_at 212208_at 218633_x_at 204496_at 212530_at 218896_s_at 204554_at 212652_s_at 218962_s_at 205005_s_at 213026_at 219007_at 205055_at 213031_s_at 219038_at 205107_s_at 213217_at 219174_at 205160_at 213555_at 219206_x_at 205161_s_at 213701_at 219451_at 205303_at 213794_s_at 219467_at 205371_s_at 213893_x_at 219833_s_at 205565_s_at 214455_at 219997_s_at 205609_at 214527_s_at 220094_s_at 205830_at 214811_at 220606_s_at 205953_at 215412_x_at 221265_s_at 205955_at 216105_x_at 221559_s_at 206571_s_at 216308_x_at 221826_at 206587_at 217645_at 222011_s_at 206920_s_at 217775_s_at 222081_at 206973_at 218009_s_at 47530_at 207071_s_at 218085_at 207628_s_at 218197_s_at 207747_s_at 218230_at (C) Genes predicted to be down regulated in benign prostatic hyperplasia in patients in which prostate cancer will recur after prostatectomy. (C1) Genes predicted to have expression changes greater than 2-fold in the current datasets. 204282_s_at 207769_s_at 200924_s_at 204775_at 208141_s_at 201418_s_at 206328_at 210128_s_at 202415_s_at 206866_at 210678_s_at 203421_at 206894_at 211512_s_at 203577_at 206964_at 212389_at 203590_at 207631_at 214311_at 214316_x_at 218372_at 220562_at 214819_at 218778_x_at 221141_x_at 216397_s_at 218965_s_at 222080_s_at 217264_s_at 219082_at 217660_at 220388_at (C2) Genes predicted to have expression changes less than 2-fold in the current datasets. 200051_at 208906_at 218144_s_at 201640_x_at 209202_s_at 218744_s_at 202159_at 209927_s_at 219111_s_at 203128_at 212127_at 219379_x_at 203162_s_at 212292_at 219986_s_at 203321_s_at 212456_at 221418_s_at 206109_at 212931_at 221525_at 207484_s_at 213057_at 221800_s_at 207896_s_at 214778_at 34260_at 208110_x_at 216199_s_at 208278_s_at 217468_at (D) Genes predicted to be up regulated in benign prostatic hyperplasia in patients in which prostate cancer will recur after prostatectomy. (D1) Genes predicted to have expression changes greater than 2-fold in the current datasets. 200795_at 209274_s_at 201304_at 209362_at 201435_s_at 209406_at 201554_x_at 210299_s_at 201617_x_at 210986_s_at 201745_at 210987_x_at 202118_s_at 211562_s_at 202437_s_at 211749_s_at 202538_s_at 212698_s_at 203065_s_at 213325_at 203224_at 214455_at 203640_at 216304_x_at 204045_at 218718_at 204438_at 218730_s_at 204725_s_at 218962_s_at 204940_at 219410_at 205105_at 219685_at 205549_at 219902_at 205609_at 222150_s_at 206434_at 222209_s_at 208800_at 208839_s_at 208884_s_at 208924_at (D2) Genes predicted to have expression changes less than 2-fold in the current datasets. 201133_s_at 201447_at 201448_at 201865_x_at 202056_at 202265_at 202442_at 202666_s_at 202918_s_at 202919_at 203225_s_at 203544_s_at 203562_at 204496_at 205140_at 205659_at 207483_s_at 208290_s_at 208767_s_at 208925_at 209821_at 209882_at 210371_s_at 211727_s_at 211760_s_at 212112_s_at 212397_at 212408_at 212530_at 212607_at 212652_s_at 213102_at 213168_at 213374_x_at 213988_s_at 214686_at 215171_s_at 216115_at 217900_at 218209_s_at 218583_s_at 218729_at 218989_x_at 219230_at 219292_at 221553_at
Example 6
Development of Predictive Biomarkers of Prostate Cancer
[0336] Datasets Used in this Study
[0337] The two datasets used for this study include 1) 148 Affymetrix U133A arrays from 91 patients we acquired (publicly available in the GEO database as accession no. GSE8218, not otherwise published, also referred to as "our data") which is the principal data set utilized in previous studies; 2) Illumina (of Illumina Inc., San Diego) beads arrays data from 103 patients as analyzed on 115 arrays, a published data set (Bibikova et al., supra);
[0338] The two datasets samples have various amount of different tissue and cell types, including tumor cells, stroma cells (a collective term for fibroblasts, myofibroblasts, smooth muscle, and small amounts of nerve and vascular elements), BPH (epithelial cells of benign prostate hypertrophy) and dilated cystic glands (AKA "atrophic" cystic glands), as estimated by four pathologists (Stuart et al., supra) for dataset 1 and one pathologist for dataset 2.
Determination of Cell Specific Gene Expression in Prostate Cancer
[0339] Linear models (Model 1˜3, below) were applied to microarray data from prostate tissues with various amounts of different cell types as estimated by a team of four pathologists. We identified genes specifically expressed in different cell types (tumor, stroma, BPH and dilated cystic glands) of prostate tissue following our published methods (Stuart et al. 2003).
Model 1˜3:
[0340] Cell composition can also be considered as two different cell types; one specific cell type versus all the other cell types, grouped together.
Gi=(βtumorPtumor+βnon-tumorPnon-tumor- )i
Gi=(βstromaPstroma+βnon-stromaPnon-st- roma)i
Gi=(βBPHPBPH+βnon-BPHPnon-BPH)i
[0341] The correlation (between probe hybridization intensity and tissue percentages) parameters, such as intercept, slope, probability, standard error, was developed for all the genes on the array from model 1, 2 and 3 using dataset 1 and dataset 2.
A New Method for the Determination of Cell Type Composition Prediction Using Gene Expression Profiles
[0342] Using linear models 1-3, the approximate percents of cell types in samples hybridized to the array may be estimated using only the microarray data based on a sub-list of genes on the array. For example, each gene employed in Model 1 provides an estimate of percent tumor cell composition. We used the median of the predictions based on multiple genes for each tissue type. In our case, only a very limited number of the best tissue-specific genes (5-41 genes) were used for the prediction. Even fewer genes might be sufficient.
[0343] In order to validate the method of tumor or stroma percent composition determination, we utilized the known percent composition figures of data set 1 to predict the tumor cell and stroma cell compositions for data set 2 with known cell composition. For example, the number of genes used for cell type (tumor epithelial cells, stroma cells or BPH epithelial cells) prediction between dataset 1 and dataset 2 ranges from 5 to 41 non-redundant genes, which are listed in Table 20 herein. The Pearson correlation coefficient between predicted cell type percentage (tumor epithelial cells, stroma cells or BPH epithelial cells) and pathologist estimated percentage ranges from 0.45˜0.87.
[0344] Since dataset 1 and dataset 2 data were based on different array platforms, the cross-platform normalization were applied using median rank scores (MRS) method (Warnat et al., supra).
[0345] The method of deducing cell type percentage from array data of whole prostate tissue as illustrated here is claimed as novel. FIGS. 8A, 4B and 4C illustrate the use of the parameters of data set 1 to predict the cell composition of data set 2. The Pearson correlation coefficients for the correlation of the observed and calculated cell type compositions is 0.74, 0.70 and 0.45 respectively. The converse calculations of utilizing the parameters of data set 2 to calculate the tumor and stroma cell percent compositions of data set 1 are shown in FIGS. 8D, 4E and 4F respectively, The Pearson Correlation Coefficients are 0.87, 0.78 and 0.57 respectively. The range of Pearson coefficients among four pathologist for composition estimates of the same samples in dataset 1 are 0.92, 0.77 and 0.73 for tumor, stroma and BPH cells respectively (Stuart et al. supra). Thus, the in silico estimates have a correlation that is almost completely subsumed in variation among pathologist, indicating that the in silico estimates are at least similar in performance to a pathologist and leaving open the possibility that the in silico estimates are more accurate than the pathologists.
Example 7
Evaluation of Predictive Signatures of Prostate Cancer
[0346] Dietary factors have long been considered major factors influencing the development and progression of prostate cancer and Dr. Gordon Saxe of UCSD has published small scale clinical trials showing that diet and life style alterations have a significant impact on the progression of relapsed prostate cancer (Nguyen, Major et al. 2006); (Saxe, Major et al. 2006)). The UCI SPECS study has accepted a "piggy back" project funded by a subcontract from UCSD (G. Saxe, P I) for carrying out a computerized survey of dietary habits of all patients recruited into the SPECS trial at UCI and UCSD. The questionnaire is self administered by providing a laptop computer to postoperative patients and is directly transmitted to Viocare (world wide web at viocare.com), the developers for the questionnaire, where the results are evaluated and provided with comparative statistics for study use. Blood samples are obtained and assessed for carotenoid carotenoids, vitamin D, and other dietary markers (as a validation of reported habits), as well as sex steroid hormones, IG-1, IGFBP-3, and cytokines. Body mass and BMI is measured by standard anthropometry and dexascanning will be introduced shortly to enable more precise evaluation of body composition. The information will be used to independently model diet/nutrition--disease outcome associations and also correlated with our gene expression results to examine diet-gene interactions.
[0347] Bioinformatics Identification and Technical Validation of Expression Biomarkers Using Independent Test Sets of Prostate Cancer Cases.
[0348] This is focused on the technical and experimental validation of candidate genes that have been identified as differentially expressed in relapsed (aggressive) and non-relapsed (indolent, good prognosis) prostate cancer. Efforts utilized standard approaches such as recursive partitioning (Koziol 2008)PAM, and VSM to identify potential biomarkers. These efforts showed that genes could be defined that preferentially identified cases that relapse early, within two years of prostatectomy, but were not general. This may be due to the heterogeneity of expression in prostate cancer and the need to identify different signatures for different subclasses of prostate cancer, i.e. the development of a true classifier drawn from the appropriate signatures. Efforts have led to significant progress toward this goal. Two factors are particularly significant. First we have made extensive use of multiple linear regression (MLR) analysis first developed by us for analysis of expression of prostate cancer during the predecessor "Director's Challenge" project (Stuart 2004). Second, we have utilized our data set of 147 U133 arrays together with five additional independent data sets of expression data (Table 22). The data sets of Table 22 are a unique resource for validation. The extended MLR approach provides for determining cell-type specific gene expression for four cell types in non-relapsed prostate cancer cases and for the determination of significant changes in expression for the four cell types for relapsed cases, i.e. significantly differentially expressed genes by cell-type in high risk cases. This model is summarized in equation 1:
Gi=β'tumor,iPtumor+β'stroma,iPstroma+- β'BPH,iPBPH+β'dilcys gland,iPdilcys gland+rs(γtumor,iPtumor+γstroma,iPstroma+- γBPH,iPBPH+γdilcys gland,iPodilcys gland) (eqn. 1)
where Gi is the observed Affymetrix total Gene expression, the β are the cell-type specific expression coefficients, the P's are the percent of each cell type of the samples applied to the arrays, and the γ's are the differentially expressed component of gene expression for the relapsed cases. When rs=0, no relapse cases are included and the equation is that for gene expression by nonrelapse cases only. The percentages, P, may be determined by examination of H and E slides of the tissue used for RNA preparation by a team of four experienced pathologists. Only two of the six data sets (our cases and those of the Illumina data set, Table 22) have had P's determined by pathologists. Therefore it was first necessary to estimate the percent cell type distribution in all cases of the other four data sets. This was done by using profiles of 40-80 genes for each cell type identified as described (Stuart 2004) that do not vary whether a case is relapse or nonrelapse and are independent of Gleason etc. This method was validated by predicting the percent tumor and stroma cell content of the cases of the Illumina data set which confirmed that the method was accurate (Wang 2007; Wang 2008).
[0349] We then applied equation one to our data to identify genes with significant (p<0.01) differential expression in relapsed cases. To validate these genes the process was repeated with each of the five data sets. For each data set we considered a gene as validated if (1) the γ again exhibited p<0.01, (2) were represented by identical Affymetrix probe sets or mapped probe set, and (3) exhibited the same direction change in differential expression. For the tumor cells and stroma cell probe sets, the magnitude of differential expression (the γ) of the two data sets are highly correlated (rpearson>0.7). Approximately 1000 probe sets were identified that were validated in our data set and one other data set. The number of genes validated in this way is highly significantly greater than the number that may be expected to meet the validation criteria for two data sets by chance. These probe sets represent approximately 693 unique genes owing to a number of genes that were validated in two or more pairs of data sets. Numerous genes correspond to those previously reported by others as related to outcome in prostate cancer and these and many others are functionally related to processes thought important in the progression of prostate cancer. For example several members of the Wnt signal transduction pathway are apparent and are being examined using the TMA.
[0350] Discussion. The statistical and biochemical properties of many of these genes support the conclusion that an important signature of outcome for prostate cancer has been obtained. We believe that this is the first use of multiple independent data sets for the validation of signatures of outcome for prostate cancer. Not all validated genes exhibit significant differential expression on all data sets. This provides a picture of the diversity of expression of genes as they appear in independent data sets. Thus, it is possible to construct a true classifier that represents the diversity of all six data sets and this effort is underway. The recognition of diversity among published data sets by a consistent set of criteria provides an explanation for the difficulty of finding a signature based on analyses of one or two data sets.
[0351] Experimental Validation.
[0352] As originally proposed, archived prostate cancer cases of the predecessor "Director's Challenge" program that have not been examined by expression analysis are being measured using the U133 plus 2 platform. These cases were recruited in the period 2000-2004. Approximately 25% of these cases have exhibited evidence of relapse. Thus, these cases provide additional valuable material for validating the predictive properties of the recently developed classifiers. The candidate biomarker genes and their ability to function in classifiers identified above will be tested by comparison of the categorization of these new cases with observed survival results. Approximately 300 fresh frozen prostate cancer cases with clinical follow-up have been characterized with respect to tumor content and approximately 80 have sufficient tumor content for analysis. The percent cell-type distribution has been determined by one pathologist and will be refined by use of the four pathologist analysis. Nearly all cases analyzed have yielded excellent RNA and to date 63 cases have been applied to U133 plus 2 arrays and 27 of these cases also have been applied to EXON arrays. Purified RNA and DNA have been banked from all of these cases and may be used, for example, for PCR validation. The analyzed cases were chosen to (2) maximize tumor content and (2) to be approximately equally divided among relapse and nonrelapse cases in order to maximize statistical power for the testing of differential expression. Owing to these criteria, only 15-20 additional cases from the set of 300 will be useful.
[0353] The goal of this set of studies is to identify SNP variations and to determine whether particular SNPs correlate with gene expression changes. The potential significance of this study is that SNP sequence maybe determined for any patient from somatic cells such a blood cells or buccal smears. Thus SNP changes that are found to correlate with predictive expression changes may provide to a much more versatile predictive assay. Moreover this information may provide an understanding of the basis of the of the differential expression changes in terms of the properties of location of the correlated SNP.
[0354] The platform that is being utilized by D. Duggan is the Illumina one million SNP array and technology. This is the largest coverage array available and provides for sampling of >1 million SNP sequences. The arrays focus on SNP sites near known genes. Over half of all sampled SNPs are within 10 Kb of a gene.
[0355] Twenty one nontumor samples from tumor-bearing prostates have been provided and have now been examined on the Illumina platform. These samples are taken from the same 300-case validation set being analyzed by U133 plus 2 and Exon arrays. Approximately equal numbers of know relapse and nonrelapse cases have been provided. All cases have been used to prepare both RNA and DNA. The RNA is archived while the DNA has been applied to the Illumina platform. All cases analyzed have yielded over 90% present calls indicating excellent DNA qc. The data from these first 42 samples will be used for an interim analysis. Owing to the open ended nature of correlating all differentially expressed genes with multiple SNPs, power of the analysis increases with sample numbers and the current plan is to utilize all samples provided to U133 plus 2 arrays to the SNP analysis included relapse and nonrelapse cases.
[0356] Tissue Microarray Development.
[0357] The goal is to fabricate prostate cancer TMAs to (1) validate newly identified biomarkers, (2) to validate cell-type specific express on the protein level, and (3) to identify antibody reagents for prognostic assay development. To date 494 prostate cancer cases have been provided and 254 have been used for TMA fabrication (Table 23). The major criterion for the selection of cases is that >5 years of survival data be available (except for normal prostate controls) and most of the cases from UCI and LBVA (Long Beach Veterans Administration Medical Center, an associated hospital of the UCI SOM) have 10-19 years of survival data. The original clinical slides of all cases are examined by two pathologists (P. Carpenter and J. Wang-Rodriquez) who regrade Gleason scores and color-encircle zones for core punching. Cores are taken to represent tumor, BPH, tumor-adjacent stroma, far stroma, dilated cystic glands and, where applicable, PIN. TMA fabrication is carried out at the Burnham Institute for Medical Research (S. Krajewski and J. Reed), All chosen fields are represented by two cores. Thus typically each case is represented by 5×2=10 cores. To date 254 cases array contains ˜1000 cores. The four cell types are placed on separate slide arrays so that specialized studies of one cell type do not needlessly consume material. The 494 cases that have been collected for the TMA are entirely independent of all other cases of this study. For approximately two dozen "Director's Challenge" cases that have been used for U133 plus 2 expression analysis there is FFPE tissue which will be applied to the TMA as a means of directly comparing RNA expression and IHC results.
[0358] In addition to multiple cell types, several unique features are being developed. Normal prostate control tissue is being incorporated to represent the same cell types as for the cancer cases. These are provided by Sun Health Research Institute (T. Beach and J. Rodgers) based on their rapid autopsy program. These cases are carefully vetted by two pathologists (P. Carpenter and J. Wang-Rodriquez). In addition the time from death to freezing for all cases is recorded and averages 4.25 h for all 65 cases acquired so far but 3.9 h for the cases of the last year. As a further assessment of quality, RNA has been assessed using the Agilent Bioanalyzer for 38 cases (Y. Wang and H. Yao) which indicates intact RNA in 80% of cases and degraded RNA in 10% of cases. Thus, these normal prostates promise to provide an extensive and approximately age-appropriate control panel. A small number of cases contain prostate cancer and may provide an opportunity to determine protein expression differences between clinical and occult disease.
[0359] Another unique feature of the TMAs is the collaborative development of quantization being carried out between the BIMR and Aperio Biotechnologies of San Marcos, Calif. This system provides very high resolution line scanning which is stored on a devoted server at BIMR. Specialized software allows retrieval of high power images of any field for remote viewing by participating pathologists via a secure web-based portal (Scancope). Thus finished TMAs are being examined by two pathologists to determine that selected cores indeed represent the Gleason pattern and cell type intended. Moreover, the software provides a database for the survival data associated with each case. Algorithms have been developed by Allen Olson and colleagues of Aperio for the separation of two colors of TMAs labeled with two antibodies developed with different chromagens. In this method a standard antibody that identifies tumor such a AMACR is used for IHC in parallel with a test antibody (second color). Only pixels of the test antibody labeling that colocalizes with AMACR are then selected for correlation with survival data. An example of two color separation using our TMA was published recently (Krajewska, Olson et al. 2007). Quantification is in advanced stages of development.
[0360] Numerous antibodies have been screened for use on FFPE sections and 36 have been optimized, applied to one or more of the TMA slides, and digitized as summarized in Table 24. Several antibodies with known behavior in prostate cancer (anti-PSMA, AMACR, E-Cadherin, beta-Catenin, etc.) have been chosen to characterize the arrays while others (anti-Frzd7. SFRP1, PAP, ANX2, etc.) correspond to predicative biomarkers of this study. A number of apoptosis related biomarkers have be identified and the use of BCL-B as a biomarker in prostate and other epithelial tumors has been published recently (Krajewska 2008; Krajewska 2008b).
[0361] It is planned to (1) emphasize visual and electronic scoring of the IHC-labeled TMA, (2) validate electronic scoring and (3) evaluate the relationship of antibody labeling and outcome parameters using the Cox-proportional hazard analysis of Kaplan-Meier plots. A second priority will be to continue to expand the TMA to the full 594 case array.
[0362] Prognostic Test of Predicative Gene Profiles.
[0363] The goal is to recruit new prostate cancer cases and utilize fresh surgical specimens and biopsies to assess outcome using the current predictive gene profile and to prospectively compare the predicted outcome to observed outcome during year five and as a follow-on long term project. Cases for this study are being recruited in four centers: NWU, UCI, UCSD (SDVA and Thornton Hospitals), and SKCC (Kaiser Permanent Hospital, San Diego). In addition, plans are underway to add the UCI-associated hospital in Long Beach, LBVA. The total number of cases recruited over the past year and from the inception of the study is summarized in Table 25 and associated Demographic, Grading, and Staging data is summarized in Tables 26 and 27. Nearly 1500 cases have been recruited by informed consent to date, over 1300 frozen tissues obtained of which approximately 520 contain tumor. The original goal is to validate selected biomarkers by PCR. Should array costs continue to decrease it may be possible to carryout complete pangenomic expression analysis. By present RNA requirements, conservatively 260 samples would support this effort. Many of these cases have provided blood and post-DRE urine specimens (Table 25) as a further basis for the determination of biomarker expression in more accessible fluids. Shadow charts with baseline data and follow-up data are being developed for all cases.
[0364] Diet SPECS Study.
[0365] Patients being recruited for the prostate cancer prospective are being consented to participate in the "piggy back" SPECS diet survey study. To date 27 cases have been consented of which 21 have had blood drawn and provided to the NIH-sponsored General Clinical Research Centers of USCD and UCI (Table 28). In addition 8 patients have completed the computerized questionnaire (Table 28). It is the planned to extend the UCI study to include a second clinic of Dr. D. Ornstein at UCI in addition to the present clinic of A. Ahlering and to continue to enroll all future patients that will be recruited for the prospective study at UCI and UCSD over the coming year. A longer range goal of this study is to utilize the present observational study as a proof of principle that sample acquisition and data base resources are available for the development of a potential phase II trial in which relapsed patients may be offered participation in a randomized intervention trial to test the efficacy of diet and life style change to modify the subsequent course of disease. This initiative will require the development of a new proposal for follow-on funding to the SPECS study.
REFERENCES
[0366] Bibikova, M., E. Chudin, et al. (2007). "Expression signatures that correlated with Gleason score and relapse in prostate cancer." Genomics 89(6): 666-72.
[0367] Koziol, J., Jia, Zhenyu, and Mercola, Dan (2008). "The Wisdom of the Commons: Ensemble Tree Classifiers for Prostate Cancer Prognosis." Biofinformatics (in revision).
[0368] Krajewska, M., Jane N. Winter, Daina Variakojis, Alan Lichtenstein, Dayong Zhai, Michael Cuddy, Xianshu Huang, Frederic Luciano, Cheryl H. Baker, Hoguen Kim, Eunah Shin, Susan Kennedy, Allen H. Olson, Andrzej Badzio, Jacek Jassem, Ivo Meinhold-Heerlein, Michael J. Duffy, Aaron D. Schimmer, Ming Tsao, Ewan Brown, Dan Mercola, Stan Krajewski, John C. Reed. (2008). "Bcl-B expression in human epithelial and non-epithelial malignancies." Proceedings of the 99th Annual Meeting of the American Association for Cancer Research; 2008 Apr. 12-16; San Diego, Calif. (abstract no. 2180.).
[0369] Krajewska, M., A. H. Olson, et al. (2007). "Claudin-1 immunohistochemistry for distinguishing malignant from benign epithelial lesions of prostate." Prostate 67(9): 907-10.
[0370] Krajewska, M., Shinichi Kitada, Jane N. Winter, Daina Variakojis, Alan Lichtenstein, Dayong Zhai, Michael Cuddy, Xianshu Huang, Frederic Luciano, Cheryl H. Baker, Hoguen Kim6, Eunah Shin, Susan Kennedy, Allen H. Olson, Andrzej Badzio, Jacek Jassem, Ivo Meinhold-Heerlein, Michael J. Duffy, Aaron D. Schimmer, Ming Tsao3, Ewan Brown, Anne Sawyers, Michael Andreeff, Dan Mercola, Stan Krajewski and John C. (2008b). Reed. Bcl-B Expression in Human Epithelial and Nonepithelial Malignancies Clinical Cancer Research 14, 14: 3011-3021.
[0371] LaTulippe, E., J. Satagopan, et al. (2002). "Comprehensive gene expression analysis of prostate cancer reveals distinct transcriptional programs associated with metastatic disease." Cancer Res 62(15): 4499-506.
[0372] Nguyen, J. Y., J. M. Major, et al. (2006). "Adoption of a plant-based diet by patients with recurrent prostate cancer." Integr Cancer Ther 5(3): 214-23.
[0373] Saxe, G. A., J. M. Major, et al. (2006). "Potential attenuation of disease progression in recurrent prostate cancer with plant-based diet and stress reduction." Integr Cancer Ther 5(3): 206-13.
[0374] Singh, D., P. G. Febbo, et al. (2002). "Gene expression correlates of clinical prostate cancer behavior." Cancer Cell 1(2): 203-9.
[0375] Stephenson, A. J., A. Smith, et al. (2005). "Integration of gene expression profiling and clinical variables to predict prostate carcinoma recurrence after radical prostatectomy." Cancer 104(2): 290-8.
[0376] Stuart, R. 0., W. Wachsman, et al. (2004). "In silico dissection of cell-type-associated patterns of gene expression in prostate cancer." Proc Natl Acad Sci USA 101(2): 615-20.
[0377] Wang, Y., Zhenyu Jia, Michael McClelland, and Dan Mercola. (2008). "In silico estimates of tissue percentage improve cross-validation of potential relapse biomarkers in prostate cancer and adjacent stroma." Proceedings of the 99th Annual Meeting of the American Association for Cancer Research; 2008 Apr. 12-16; San Diego, Calif. (abstract no. 999.).
[0378] Wang, Y. K., James; Goodison, Steve; JainJua, Yu, Mercola, Dan, McClelland, Michael. (2007). "Toward the development of a predicative signature of prostate cancer." Proceedings of the American Association of Cancer Research, Annual Meeting 2007.
[0379] Yu, Y. P., D. Landsittel, et al. (2004). "Gene expression alterations in prostate cancer predicting tumor aggression and preceding development of malignancy." J Clin Oncol 22(14): 2790-9.
[0380] The goal of these studies remains the development of a multigene profile that identifies at the time of diagnosis, prostate cancer patients with poor prognosis and good prognosis. Biomarkers have been identified that are validated in at least one independent data set of six data sets available. Moreover the biomarkers represent the diversity of expression among independent data sets. Thus, a true classifier may be formed for the prognosis of prostate cancer.
[0381] Current biomarker information is be utilized to develop a test based on the use of FFPE patient tissue, a widely available resource, that may provide improved guidance for prostate cancer patients.
[0382] A 254-case TMA is being used to validate selected biomarkers at the protein expression level. The TMA is composed of cases that are independent of the cases utilized to define the biomarkers. Antibodies that perform well may be useful reagents for the development of an IHC-based assay for determining outcome using FFPE prostatectomy tissue or using preoperative biopsy tissue.
[0383] Pangenomic expression data has been collected on 60 cases archived from the "Director's Challenge" program and 25 of these cases have also been profiled on the Illumina million SNP chip. This analysis will continue and when suitable numbers are available, SNP alterations that correlate with expression changes will be determined in order that blood cells may provide a means to determine susceptibility to expression of genes associated with behavior to define SNPs with predictive properties. SNPs can be assessed from any tissue, buccal smears or prostate cancer. Patients that are reliably recognized as belonging to either of these groups will be provided with increased knowledge of the likely outcome of their disease and, therefore, may opt for a wider and more appropriate spectrum of treatment.
[0384] Patients are being recruited for prospective testing. In addition, certain dietary features are being determined by questionnaire and blood analysis. Patient of this cohort that relapse but do not seek immediate hormonal or radiation therapy may be offered a diet-life style intervention trial. In particular, the over use of radical prostatectomy may be reduced at considerably decreased morbidity, anguish, and expense.
[0385] A variety of efforts have been initiated to translate the results into practical tests. High throughput gene expression analysis will allow us to use all 1000 probe sets that we have determined have predictive value to assess risk and compare the assessment to the clinical indicators of risk such as preop PSA, Gleason, and stage and well as outcome over the next few years. Strong indications of predictive value will indicate that biopsy samples should routinely be made available in the fresh state for RNA analysis and provide preoperative information about patients at high risk of disease that may not be cured by surgery and may provide guidance of who would profit from adjuvant therapy. Finally, patients that relapse following surgery commonly have slowly rising PSA values (low PSA doubling time) and many specialists do not immediately recommend hormone or radiation treatment. Such cases may be offered a diet regimen. Our current "piggy back" observational diet study may set the frame work for evaluating the role of diet. In addition the gene signature of such patients will be known and correlations may be carried out to assess whether there is a signature predictive of response. Similarly, by correlating the response to treatment with the known gene expression results, other signatures predictive of response-to-therapy may be determined. These possibilities require that our prospective cohort be examined by expression analysis which requires a large number of arrays not provided for in the original proposal. Thus, work with the prospective cohort will require additional funding for continuation of the translation of the SPECS studies and planning needs to focus on this issue.
TABLE-US-00024 TABLE 22 Data Sets Utilized for Identification and Validation of Biomarkers of Relapse of Prostate Cancer Following Prostatectomy Time to Non- Relapse Data Array Relapse Relapse data preOP- TNM Sets platform Targetsd (total) (total) available? PSA Gleason stage Ref. .sup. 1a,b U133A2 22,283 85 57 yes yes yes yes yes 1 .sup. 2a Illumina 511 25 84 partial no yes yes no 2 (only for relapse samples) .sup. 3c U133A 22,283 37 42 no yes yes yes no 3 4 U95Av2 12,626 8 13 no no no no no 4 U95Av2, B, C 5 37,891 23 25 yes yes yes yes no 5 6 U95Av2 12,626 9 14 no yes yes yes no 6 aContains data on tissue percentages. bThese data sets contain information on follow-up time. Relapse was defined as PSA reaches detectable level after prostatectomy within the first four years. All non-relapse cases were cases followed-up over two years and showed no sign of relapse. cThese data sets contain information on follow-up time. Relapse was defined as three consecutive PSA increases >0.1 ng/ml within the first four years. All non-relapse cases were cases followed-up over two years and showed no sign of relapse. dNumber of target transcripts represented on the array. Ref. 1, (Stuart, Wachsman et al. 2004) Ref. 2, (Bibikova, Chudin et al. 2007) Ref. 3, (Stephenson, Smith et al. 2005) Ref. 4, (Singh, Febbo et al. 2002) Ref. 5, (Yu, Landsittel et al. 2004) Ref. 6, (LaTulippe, Satagopan et al. 2002)
TABLE-US-00025 TABLE 23 UCI SPECS Tissue Microarray (TMA) Development Status Characteristic Since Inception of Study year 2 Prostate Cases on the Array 254 as of May 1, 2008 (~1000 cores) Prostate Cases by Source on or 494 219 available for the Array 1. UCI Medical Center Cases 203 95 2. Long Beach VA Medical 165 90 Center Cases 3. SKCC 66 4. Sun Health Res. Inst 60 34 Grade and Stage Distribution (UCI/LBVA) Gleason 4-7 159 135 Gleason 8-10 26 50 High Grade Prostate 95 161 Intraepithelial Neoplasia (PIN) Lymph Node Metastasis 9 2
TABLE-US-00026 TABLE 24 Antibodies applied to the SPECS TMA Digitized Digitized Standardization Virtual Virtual Antibody Type Antibody Array ID# slide Block AMACR Rb- DAKO#M3616 TMA# 83-84; yes TMA# 83- E-Cadhedrin MAB BD#610181 TMA# 83-84; yes TMA# 83; 95 PSA MAB DAKO TMA# 83-84; yes TMA# 83- PSMA no antibody TMA #83-84; no Beta-Catenin MAB BD TMA# 83-84; yes TMA# 83- Transduction 94-97 84; 95 Lab; #610154 Prostate-Acid Rb polyclonal Sigma# P56641 TMA# 83-84; yes TMA# 83- SFRP1 Rb polyclonal Novus; NB600- TMA #83-84; yes no 499 TMA 94-97 FRZD7 Rb GenWay 18- TMA #83-84; yes no polyclonal/Aff 141-10554 TMA 94-97 pure 18-003-42797 Annexin 2 TMA #83 yes no IL-6 Mouse GenWay 20- TMA #83-84; yes no Bnip3 Rb polyclonal BIMR/AR-46 TMA #83-84; yes no 14-3-3 zeta, Rb polyclonal Abcam 18706 TMA #83- yes no CD46 Goat antihu R&D: AF2005 TMA #83- yes no PED/PEA 15 Rb polyconal Novus ab 1832 TMA #83- yes no Phosphospecific R&D AF 0225 84/sub PAR4 (R- Rb polyconal SC-1807 TMA #83- yes no Cart. Rat ABD Serotec; TMA #83- yes no Matrix Prot antihuman MCA 1455 84/sub HIF1-alpha MAB Novus, 100123 TMA #83-84 yes no Siah2 (SR) MAB Sigma; (Ronai TMA #83-84 yes no Sip- Rat (Ronai Collab) TMA #83-84 yes no Rab BIMR/AR-75 TMA #83-84 yes no BIMR/AR-75 TMA #83-84 yes no PHD3 MAB (Ronai Collab) TMA #83- yes no Claudin 1 Rb-poly Zymed#: 51- TMA# 83-84; yes no BclG Rb polyconal BIMR AR-120; - TMA# 83-84; yes yes 121 94-97 BclB Rb polyconal BIMR/AR-49 TMA #83-84 yes yes PDGF-c Rb polyconal Santa Cruz; (c- TMA #83 yes no DDR1 Rb polyconal Collab-China TMA#83; 94- yes No ER-beta MAB GeneTex TMA #83 yes Yes BFL1 Rb BIMR/BR-50 TMA #83-84 yes Yes Pending ELF3 Mouse 20-372-60074 Not tested no No ANNEXIN 1 Not tested no No Double Staining Claudin + Amacr Rb poly/Mono TMA #83-84 yes Yes AR&PSA Rb poly/MAB Santa Cruz: TMA# 94-97 yes TMA#; 95 BCL2/TR3 Rb/MAB AR- TMA#83; 94- yes TMA# 95 01/R&D#: 97 BAX/HIF1alpha Rb/MAB AR-02/Novus: TMA#83; 94- yes TMA# 95 NB100-123 97 indicates data missing or illegible when filed
TABLE-US-00027 TABLE 25 Summary of samples collected for prospective study during the current funding period and since the inception of the study. SKCC UCSD/VAMC- Characteristic (KPH) SD UCI Interval Summary of Consented SPECS Patients since 7-1-07 NWU Consented Cases 45 335 295 85 BPH 9 47 Prostate Cancer 339 100 Tissues Obtained (frozen) 40 267 147 Samples with Tumor 45% 34 (13%) 53 (62%) Samples without Tumor 55% unknown 32 (48%) Sample Review Pending 238 0 Mean Sample Tumor % 16% Banked Plasma 40 78 215 55 Banked Urine 40 78 238 (94 postDRE) 39 Consented SPECS Patients since inception of the study (Sep. 30, 2005) NWU1 Consented (TOTAL 1489) 59 711 404 304 Mean Age 60.5 62.4 64 (41-85) 62 BPH 0 10 81 Mean PSA (ng/ml) unknown 2.8 (<0.15-30.8) 6.66 overall av Prostate Cancer 59 274 175 213 Mean PSA (ng/ml) 5.6 ± 3.6 7.53 (0.22-77.8) 6.66 overall av Tissues Obtained (frozen) 59 572 210 420 Samples with Tumor 127 30% 213 (51%) Samples without Tumor Unknown 30% 145 (49%) Sample Review Pending 466 40% 0 Mean Sample Tumor % 12.2% 53% Banked Plasma 59 176 317 209 Banked Urine 59 174 339 (94postDRE) 174 (postDRE) Number/percent NED since surg 75% Number/percent chemical 3% 0 relapse (PSA > 0.2 ng/ml) Number/percent neg postop 74% 150 PSA Number/percent pos postop PSA 8% 3 Number pending PSA 18%
TABLE-US-00028 TABLE 26 Ethnicity of Consented Cases for Prospective Analysis UCSD UCI NWU SKCC n = 181 UCSD UCSD n = 302 n = 711 n = 59 Consented n = 140 n = 41 Consented Consented Consented Characteristic Pts PCA BPH Pts Pts Pts. Mean age at 64 62 66 62 62.4 60.5 enrollment ( 41-85) (47-73) Median age at 63 61 64 62 60.0 enrollment (41-85) (41-84) (54-85) (47-73) Ethnicity 181 140 41 59 African-American 19 17 2 2 39 2 (10%) (12%) (5%) (0.7%) (0.5%) (3%) Asian/Pacific 2 2 0 14 4 1 Islander (1%) (1%) (4.7%) (.05%) (2%) Caucasian 139 105 35 184 579 19 (77%) (75%) (87%) (61%) (81%) (32%) Filipino 5 5 0 0 unknown (3%) (3.5%) Native American 1 1 0 0 unknown (<1%) (<1%) Hispanic 8 5 3 1 13 5 (4%) (3.5%) (7.5%) (0.03%) (1.8%) (8%) Hawaiian 1 1 0 0 n/a (<1%) (<1%) Other Ethnicity 2 1 1 45 n/a (1%) (<1%) (2.5%) (15%) Not 4 4 0 56 76 32 Reported/unknown (2%) (3%) (19%) (11%) (54%) Subtotals 181 140 41 302 711 59 Totals 1434
TABLE-US-00029 TABLE 27 Gleason Score Distribution and Stage Distribution for Consented Cases for Prospective Analysis GLEASON UCSD NWU UCI SKCC 2 + 3 = 5 1 0 1 0 3 + 2 = 5 2 0 1 0 2 + 4 = 6 1 0 0 0 3 + 3 = 6 47 145 80 19 3 + 4 = 7 37 108 123 23 4 + 3 = 7 13 21 49 3 3 + 5 = 8 2 0 2 1 5 + 3 = 8 1 1 0 0 4 + 4 = 8 12 6 7 0 4 + 5 = 9 10 7 13 0 5 + 4 = 9 5 3 0 0 5 + 5 = 10 1 0 0 1 132 291 276 59 No PCA on Path 4 na 2 13 Pathology Pending 7 na 0 na 143 291 278 59 STAGE pT0 2 na 2 0 pT2a 14 na 27 3 pT2b 6 na 0 0 pT2c 88 na 170 35 pT3a 10 na 54 5 pT3b 9 na 5 3 pt3(a + b) na na 10 0 pT2 na na 2 pT3 na na 4 pT4 na na 4 129 278 43 Channel TURP 4 na 0 Missing Path Stage 4 na 13 Pathology Pending 7 na 0 144 291 278 59
TABLE-US-00030 TABLE 28 Summary of cases consented for the observational diet SPECS study Scheduled Blood to Questionnaire for home Site Start Consented GCRC completed completion UCSD 12/07 23 18 7 2 UCI 4/08 18 17 11 7 Total 41 35 18 9
[0386] The Challenge of Developing Predictive Signatures for the Outcome of Newly Diagnosed Prostate Cancer Based on Expression Analysis and Genetic Changes of Tumor and Non-Tumor Cells
[0387] Linear regression analysis was used to determine the average gene expression profile of four cell types, including tumor and stroma cells, in a set of 88 prostatectomy samples (1). By combining these cases with 55 additional cases with Affymetrix U133A gene expression data, we were able to select 63 cases in which disease relapsed over a period of three or more years following prostatectomy. Linear regression analysis of the non-relapse and relapse sets revealed changes in hundreds of gene expression values, including genes primarily expressed in stroma cells that were associated with the relapse status. These genes were used to generate classifiers using two other independent Affymetrix expression datasets generated from enriched prostate tumors. One dataset of 79 samples (37 relapse, Affymetrix U133A array; training-set) was used as the training set (2), and one dataset of 48 samples (23 relapse, Affymetrix U95Av2/U95B/U95C array was used as the test-set (3). Probe sets across platforms were mapped using the Affymetrix array comparison spreadsheet and normalized using quantile discretization (4). Classifier genes were determined by use of recursive partitioning (RP) in which a handful of genes are used sequentially for classification (5), as well as Prediction Analysis of Microarrays (PAM)(6), in which case outcomes were predicted via a nearest shrunken centroid method from gene expression data (1). RP classification trees using up to five genes, and sometimes including pre-operative PSA, routinely classified each independent dataset into three survival groups, non-relapse, early relapse, and late relapse with p<0.005. Classifiers generated by PAM using tumor specific genes predicted by linear regression as input was as good (accuracy, sensitivity, specificity) as the best classifiers using all of the expression data, indicating an enrichment for relevant genes by the linear regression method (SVM was dropped from here since it did not perform better than PAM). However classifier performance decreased with increased disease-free survival of the cases. A 59-gene classifier determined by PAM using all cases of the training set with times-to-relapse of <2 years yielded a specificity of 75.9% and a sensitivity of 88.0% with an overall accuracy of 73.4% when tested with the second independent data set for cases of the same time period. All three performance values decreased continuously upon inclusion of longer time periods to <4 y. No reliable PAM classifiers could be generated for late relapse cases. RP consistently yielded a major group of nonrelapse cases and two classes of relapse cases, one of which consists of very early relapse cases with disease-free survival of <2 years. The distinction of late relapse cases from nonrelapse cases using PAM remains a challenge and may reflect the similarity of gene expression profiles of nonrelapse cases from those destined to relapse relatively late after diagnosis. Prediction of early relapse at the time of diagnosis may be a realistic goal. 1. Stuart, R., et al. PNAS 2004; 201:615-20; 2. Stephenson et al. Cancer. 2005; 104:290-8. 3. Yu Y., et al. J. Clin. Oncol. 2004; 22:1790.4. Warnat, P., et al. BMC Bioinformatics. 2005; 6:265. 5. Koziol, J., et al. Cancer Res. 2003; 9:5120-6. 6. Tibshirani, R. et al. PNAS 2002; 99:6567-72.
A New Bi-Model Approach for the Development of a Classifier for Predicting Outcomes of Prostate Cancer Patients
[0388] Prostate cancer is the most common malignancy of males. However, the majority of cases are "indolent" and may not threaten lives. In order to improve disease management, reliable molecular indicators are needed to distinguish the indolent cancer from the cancer that will progress. Statistical methods, such as hierarchical clustering, PAM and SVM, have been widely used for classifier development for various cancers. However, those methods can not be immediately applied to prostate cancer research because the tissue samples collected from patients are very heterogeneous in cell composition. The observed expression level of any gene for a given sample is not solely for tumor cells; rather, it is the sum of contributions from all types of cells within that sample. In current study, we propose a novel method where the expression level of any gene is illustrated with a linear model considering the contributions from different types of cells and their interactions with aggression phases (relapse or non-relapse). ANOVA is used to identify cell specific relapse associated genes that possess discriminative power. The expression patterns of those selected genes may be described using two Gaussian models on the basis of disease phases; thus they can be used for predicting outcomes of newly diagnosed. The new method is compared to other conventional methods based on simulated data. A predictive classifier is created by training a real dataset generated for prostate cancer research. The performance of the new classifier is compared to the nomogram and other clinical parameters with predictive value.
In Silico Estimates of Tissue Percentage Improve Cross-Validation of Potential Relapse Biomarkers in Prostate Cancer and Adjacent Stroma
[0389] Differences in RNA levels that correlated with relapse versus non-relapse were calculated for two public expression microarray data sets using two models. One model did not take into account tumor and stroma tissue percentages in each sample, and the other used these percentages in a linear model. The latter model led to a highly significant increase in the number of candidate relapse-associated biomarkers cross-validated between both data sets. Many of these relapse-associated changes in transcript levels occurred in adjacent stroma. Estimates of tissue percentages based on expression data applied between data sets correlated almost as well as multiple pathologists correlated with each other within a data set. This in silico model to predict tissue percentage was applied to a third public data set, for which no tissue percentages exist. Cross-validation of relapse-associated genes between data sets was again highly significantly improved using the linear model, and included changes in stroma. The third data set was heavily skewed towards a previously unrecognized higher tumor percentage in relapse versus non-relapse cases, a bias that is taken into account by the linear model. In summary, the use of tissue percentages determined by a pathologist or inferred from in silico data increased the power to detect concordant changes associated with a clinical parameter in separate data sets, and assigned these changes to different tissue compartments. The strategy should be applicable for biomarkers other than RNA and for samples from any type of disease that contains measurable mixed tissues.
Improved Identification of RNA Prognostic Biomarkers for Prostate Cancer Using in Silico Tissue Percentage Estimates
[0390] Although many studies of detecting RNA-based prognosticators for prostate cancer have been performed, they have limited agreement with each other. One contributing factor may be the variations in the proportion of tissue components in prostate tissue samples, which leads to considerable noise and even misleading results in mining microarrays data.
[0391] We assembled six microarray data sets for RNA expression in prostate cancer samples with associated relapse information, including two large data sets of our own. Our two datasets, and one other, included estimates of tissue percentages made by pathologists. These data sets were used to identify genes that were then used to build a simple linear model for tissue percentage prediction. Estimates of tissue percentages based on expression data applied between data sets correlated almost as well as multiple pathologists correlated with each other within a data set.
[0392] Using a multiple linear regression (MLR) model which integrates tissue component percentages, we identified a list of tumor- and reactive stroma-associated prognostic RNA biomarkers in all six data sets. The level of each RNA is expressed as a linear model of contributions from the different cell types and their interactions with relapse status
g = b 0 + j = 1 C b j p j + RS × j = 1 C γ j p j + e , ##EQU00015##
where g is expression intensity, C is the number of cell types, RS is relapse status indicator, e is random error, and b's and γ's are regression coefficients. ANOVA is used to identify cell specific genes that are differentially expressed between relapsed and non-relapsed cases, i.e., the genes with significant γ's. Markers were then cross-validated between the six different microarray data sets. There were 185 genes that occurred in more than one data set, and 152 of 185 (82.2%) showed the same direction of change in differential expression between relapse and non-relapse patient samples (p<10-18). Most of these prognostic markers were not previously identified by other studies and some were potentially differentially expressed in stroma.
[0393] In summary, the use of tissue percentages determined by a pathologist or inferred from in silico data increased the power to detect differential expressed genes associated with a clinical parameter and assigned these changes to different tissue compartments. The strategy should be applicable for biomarkers other than RNA and for samples from any type of disease that contains measurable mixed tissues. A Bi-Model Classifier that Allows RNA Expression in Mixed Tissues to Be Used in Prostate Cancer Prognosis
[0394] Introduction:
[0395] Reliable molecular indicators are needed to distinguish indolent prostate cancer from cancer that will progress. Statistical methods, such as hierarchical clustering, PAM and SVM, have been widely used to develop classifiers of prognostic molecular markers that estimate risk. However, one barrier to the efficient use of classifiers in prostate cancer is the variable mixture of different cell types in most clinical samples. The observed level of any marker for a given sample is due to the sum of contributions from all types of cells within the tumor. Elsewhere [1], we propose a novel classification method in which the expression level of any gene is expressed as a linear model of contributions from the different cell types and their interactions with relapse status. While this method provides biomarkers with greater confidence by deconvoluting the effect of tissue percentages in each sample, the problem of how to construct a classifier for mixed populations remains.
Methods:
[0396] We propose that the expression patterns of prognostic RNAs may be described using either of two Gaussian models, one for relapsed cases and the other one for non-relapsed cases, both of which include calculation with cell constitute information. A likelihood-ratio statistic (LR) can be developed by contrasting the probability of being risk free to the probability of undergoing relapse based on fitting expression values of selected biomarkers and the cell composition data of each sample to these two differential models. A patient is diagnosed as having high risk of relapse if LR≧k1, or is diagnosed as being of low risk if LR≦k2, where k1 and k2 are pre-selected cutoffs with k1>1>k2.
Results:
[0397] In a simulation study, the new method outperformed the conventional classification methods PAM and SVM. A prognostic classifier was then created by training an expression dataset generated from Affymetrix U133P2 arrays from prostatectomies with known tissue compostion, which yielded a 50 gene classifier with an accuracy of 94% following cross validation. When the predictive classifier was applied to an independent "test" data set based on 35 Affymetrix U133A arrays, an accuracy of 80% was achieved
Conclusion:
[0398] This novel classifier may be useful for assessing risk of relapse at the time of diagnosis in clinical samples with variable amounts of cancer tissue.
REFERENCE
[0399] [1] Wang, Y., et al., Proc. 100th Annual meeting of the AACR. [abstract].
[0400] The prostate tumor microenvironment exhibits numerous differentially expressed genes useful for diagnosis
Introduction:
[0401] There are over one million prostate biopsies performed in the U.S. annually. Pathology examination misses the tumor entirely in a few percent of cases. In an additional 10-20% of cases the biopsies are not definitive due to atypical foci, PIN, or other caveats, often leading to a "repeat biopsy" in 6-12 months. We observed that the microenvironment of prostate tumor cells exhibits numerous differential gene expression changes compared to remote stroma tissue of the same cases. Such changes could be useful to form a classifier for the diagnosis of prostate cancer when tumor is present in very low amounts or is barely missed by a biopsy.
Methods:
[0402] A training set of 105 prostate cancer cases was created with known cell type composition for the three major cell types of tumor tissue (tumor epithelial cells, epithelial cells of BPH and stroma cells) as assessed by four pathologists. RNA expression was measured on U133plus2 GeneChips. A linear model defined the total signal as the sum of expression values of the three cell types each weighted by its percent composition figure for a given case:
Gi=βtumor Ptumor+Pstroma Pstroma+βBPHPBPH
where Gi is the fluorescence intensity for a gene of a case, Pi are the percents of the indicated cell type and βi are cell-specific expression coefficients (signal/percent cell type). The model was applied separately to tumor-bearing tissues and tumor-free remote stroma tissues. Differential gene expression was derived by subtraction of the values for the two series.
Results:
[0403] The ˜200 most significant differences were used as input to PAM. Tenfold cross-validation dichotomized the training set into tumor-bearing and remote stroma tissues, yielding a classifier of 36 genes that had a 94% accuracy. This classifier was then tested using an independent set of 82 cases, as well as 13 control normal prostate stroma tissues. The classifier had an accuracy of 83% on the test set. Correct classification was also achieved for five of six biopsies from normal males and all seven cases from the rapid autopsy. Several genes such as myosin VI, collagen IX, and destrin, known to be highly expressed in mesenchymal derivatives, are preferentially expressed in tumor-adjacent stroma.
Conclusions:
[0404] The differential gene expression changes observed here most likely represent differences in expression between tumor-adjacent stroma and remote stroma. These differences may be due to paracrine or "field effect" mechanisms involving interaction with the tumor adjacent to the affected stroma. The reaction of stroma to nearby prostate cancer is well-known but, as observed here, involves many more gene changes than previously recognized. These changes can be exploited to develop a classifier that accurately categorizes tumor-bearing tissues, remote tissues of the same cases and normal tissues. Such a classifier could enhance diagnosis from false negative and equivocal biopsy results.
TABLE-US-00031 TABLE 29 125 Genes generated by one of the two methods for identifying reactive stroma genes Probe.Set.ID Gene.Title Gene.Symbol 204934_s_at hepsin (transmembrane protease, serine 1) HPN 209426_s_at alpha-methylacyl-CoA racemase /// C1q and tumor AMACR /// C1QTNF3 necrosis factor related protein 3 64486_at coronin, actin binding protein, 1B CORO1B 203755_at BUB1 budding uninhibited by benzimidazoles 1 BUB1B homolog beta (yeast) 203317_at pleckstrin and Sec7 domain containing 4 PSD4 211576_s_at solute carrier family 19 (folate transporter), member 1 SLC19A1 202148_s_at pyrroline-5-carboxylate reductase 1 PYCR1 205339_at SCL/TAL1 interrupting locus STIL 211984_at calmodulin 1 (phosphorylase kinase, delta) /// CALM1 /// CALM2 /// calmodulin 2 (phosphorylase kinase, delta) /// CALM3 calmodulin 3 (phosphorylase kinase, delta) 217912_at dihydrouridine synthase 1-like (S. cerevisiae) DUS1L 218275_at solute carrier family 25 (mitochondrial carrier; SLC25A10 dicarboxylate transporter), member 10 202645_s_at multiple endocrine neoplasia I MEN1 209424_s_at alpha-methylacyl-CoA racemase /// C1q and tumor AMACR /// C1QTNF3 necrosis factor related protein 3 206558_at single-minded homolog 2 (Drosophila) SIM2 219360_s_at transient receptor potential cation channel, subfamily TRPM4 M, member 4 220584_at hypothetical protein FLJ22184 FLJ22184 201420_s_at WD repeat domain 77 WDR77 218683_at polypyrimidine tract binding protein 2 PTBP2 208190_s_at lipolysis stimulated lipoprotein receptor LSR 219809_at WD repeat domain 55 WDR55 219395_at RNA binding motif protein 35B RBM35B 207239_s_at PCTAIRE protein kinase 1 PCTK1 218180_s_at EPS8-like 2 EPS8L2 203287_at ladinin 1 LAD1 33814_at p21(CDKN1A)-activated kinase 4 PAK4 218365_s_at aspartyl-tRNA synthetase 2, mitochondrial DARS2 208824_x_at PCTAIRE protein kinase 1 PCTK1 219148_at PDZ binding kinase PBK 201819_at scavenger receptor class B, member 1 SCARB1 218874_s_at chromosome 6 open reading frame 134 C6orf134 204532_x_at UDP glucuronosyltransferase 1 family, polypeptide UGT1A1 /// A10 /// UDP glucuronosyltransferase 1 family, UGT1A10 /// polypeptide A8 /// UDP glucuronosyltransferase 1 UGT1A4 /// UGT1A6 family, polypeptide A6 /// UDP /// UGT1A8 /// glucuronosyltransferase 1 family, polypeptide A9 /// UGT1A9 UDP glucuronosyltransferase 1 family, polypeptide A4 /// UDP glucuronosyltransferase 1 family, polypeptide A1 217099_s_at gem (nuclear organelle) associated protein 4 GEMIN4 214393_at Rho family GTPase 2 RND2 204714_s_at coagulation factor V (proaccelerin, labile factor) F5 209972_s_at JTV1 gene JTV1 213464_at SHC (Src homology 2 domain containing) SHC2 transforming protein 2 221665_s_at EPS8-like 1 EPS8L1 202740_at aminoacylase 1 ACY1 209015_s_at DnaJ (Hsp40) homolog, subfamily B, member 6 DNAJB6 200678_x_at granulin GRN 210480_s_at myosin VI MYO6 220354_at similar to hCG1774568 LOC100134018 210627_s_at glucosidase I GCS1 218130_at chromosome 17 open reading frame 62 C17orf62 217736_s_at eukaryotic translation initiation factor 2-alpha kinase 1 EIF2AK1 209709_s_at hyaluronan-mediated motility receptor (RHAMM) HMMR 204927_at Ras association (RalGDS/AF-6) domain family (N- RASSF7 terminal) member 7 213945_s_at Nucleoporin 210 kDa NUP210 202178_at protein kinase C, zeta PRKCZ 212886_at coiled-coil domain containing 69 CCDC69 215931_s_at ADP-ribosylation factor guanine nucleotide- ARFGEF2 exchange factor 2 (brefeldin A-inhibited) 205527_s_at gem (nuclear organelle) associated protein 4 GEMIN4 212431_at KIAA0194 protein KIAA0194 220564_at chromosome 10 open reading frame 59 C10orf59 207414_s_at proprotein convertase subtilisin/kexin type 6 PCSK6 201022_s_at destrin (actin depolymerizing factor) DSTN 201613_s_at adaptor-related protein complex 1, gamma 2 subunit AP1G2 213947_s_at nucleoporin 210 kDa NUP210 206094_x_at UDP glucuronosyltransferase 1 family, polypeptide UGT1A1 /// A10 /// UDP glucuronosyltransferase 1 family, UGT1A10 /// polypeptide A8 /// UDP glucuronosyltransferase 1 UGT1A3 /// UGT1A4 family, polypeptide A7 /// UDP /// UGT1A5 /// glucuronosyltransferase 1 family, polypeptide A6 /// UGT1A6 /// UGT1A7 UDP glucuronosyltransferase 1 family, polypeptide /// UGT1A8 /// A5 /// UDP glucuronosyltransferase 1 family, UGT1A9 polypeptide A9 /// UDP glucuronosyltransferase 1 family, polypeptide A4 /// UDP glucuronosyltransferase 1 family, polypeptide A1 /// UDP glucuronosyltransferase 1 family, polypeptide A3 218073_s_at transmembrane protein 48 TMEM48 202329_at c-src tyrosine kinase CSK 206723_s_at lysophosphatidic acid receptor 2 LPAR2 40359_at Ras association (RalGDS/AF-6) domain family (N- RASSF7 terminal) member 7 218115_at ASF1 anti-silencing function 1 homolog B (S. cerevisiae) ASF1B 207416_s_at nuclear factor of activated T-cells, cytoplasmic, NFATC3 calcineurin-dependent 3 204503_at envoplakin EVPL 215125_s_at UDP glucuronosyltransferase 1 family, polypeptide UGT1A1 /// A10 /// UDP glucuronosyltransferase 1 family, UGT1A10 /// polypeptide A8 /// UDP glucuronosyltransferase 1 UGT1A3 /// UGT1A4 family, polypeptide A7 /// UDP /// UGT1A5 /// glucuronosyltransferase 1 family, polypeptide A6 /// UGT1A6 /// UGT1A7 UDP glucuronosyltransferase 1 family, polypeptide /// UGT1A8 /// A5 /// UDP glucuronosyltransferase 1 family, UGT1A9 polypeptide A9 /// UDP glucuronosyltransferase 1 family, polypeptide A4 /// UDP glucuronosyltransferase 1 family, polypeptide A1 /// UDP glucuronosyltransferase 1 family, polypeptide A3 219935_at ADAM metallopeptidase with thrombospondin type ADAMTS5 1 motif, 5 (aggrecanase-2) 219874_at solute carrier family 12 (potassium/chloride SLC12A8 transporters), member 8 203573_s_at Rab geranylgeranyltransferase, alpha subunit RABGGTA 213442_x_at SAM pointed domain containing ets transcription SPDEF factor 209425_at alpha-methylacyl-CoA racemase /// C1q and tumor AMACR /// C1QTNF3 necrosis factor related protein 3 218295_s_at nucleoporin 50 kDa NUP50 204765_at Rho guanine nucleotide exchange factor (GEF) 5 ARHGEF5 203154_s_at p21(CDKN1A)-activated kinase 4 PAK4 213441_x_at SAM pointed domain containing ets transcription SPDEF factor 205309_at sphingomyelin phosphodiesterase, acid-like 3B SMPDL3B 218931_at RAB17, member RAS oncogene family RAB17 203148_s_at tripartite motif-containing 14 TRIM14 214779_s_at small G protein signaling modulator 3 SGSM3 202364_at MAX interactor 1 MXI1 211952_at importin 5 IPO5 218518_at chromosome 5 open reading frame 5 C5orf5 205423_at adaptor-related protein complex 1, beta 1 subunit AP1B1 219188_s_at MACRO domain containing 1 MACROD1 211985_s_at calmodulin 1 (phosphorylase kinase, delta) /// CALM1 /// CALM2 /// calmodulin 2 (phosphorylase kinase, delta) /// CALM3 calmodulin 3 (phosphorylase kinase, delta) 203215_s_at myosin VI MYO6 203214_x_at cell division cycle 2, G1 to S and G2 to M CDC2 50965_at RAB26, member RAS oncogene family RAB26 218387_s_at 6-phosphogluconolactonase PGLS 212307_s_at O-linked N-acetylglucosamine (GlcNAc) transferase OGT (UDP-N-acetylglucosamine:polypeptide-N- acetylglucosaminyl transferase) 212436_at tripartite motif-containing 33 TRIM33 218780_at hook homolog 2 (Drosophila) HOOK2 46142_at lipase maturation factor 1 LMF1 213622_at collagen, type IX, alpha 2 COL9A2 207901_at interleukin 12B (natural killer cell stimulatory factor IL12B 2, cytotoxic lymphocyte maturation factor 2, p40) 221592_at TBC1 domain family, member 8 (with GRAM TBC1D8 domain) 209379_s_at KIAA1128 KIAA1128 217551_at similar to olfactory receptor, family 7, subfamily A, LOC441453 member 17 207165_at hyaluronan-mediated motility receptor (RHAMM) HMMR 215249_at ribosomal protein L35a RPL35A 205938_at protein phosphatase 1E (PP2C domain containing) PPM1E 205231_s_at epilepsy, progressive myoclonus type 2A, Lafora EPM2A disease (laforin) 207833_s_at holocarboxylase synthetase (biotin-(proprionyl- HLCS Coenzyme A-carboxylase (ATP-hydrolysing)) ligase) 212070_at G protein-coupled receptor 56 GPR56 210181_s_at calcium binding protein 1 CABP1 214403_x_at SAM pointed domain containing ets transcription SPDEF factor 209367_at syntaxin binding protein 2 STXBP2 218779_x_at EPS8-like 1 EPS8L1 209624_s_at methylcrotonoyl-Coenzyme A carboxylase 2 (beta) MCCC2 212218_s_at fatty acid synthase FASN 218248_at family with sequence similarity 111, member A FAM111A 203431_s_at Rho GTPase-activating protein RICS 208430_s_at dystrobrevin, alpha DTNA 202721_s_at glutamine-fructose-6-phosphate transaminase 1 GFPT1 202605_at glucuronidase, beta GUSB 200637_s_at protein tyrosine phosphatase, receptor type, F PTPRF 210026_s_at caspase recruitment domain family, member 10 CARD10 200873_s_at chaperonin containing TCP1, subunit 8 (theta) CCT8 201021_s_at destrin (actin depolymerizing factor) DSTN 91826_at EPS8-like 1 EPS8L1 216338_s_at Yip1 domain family, member 3 YIPF3 201189_s_at inositol 1,4,5-triphosphate receptor, type 3 ITPR3 219259_at sema domain, immunoglobulin domain (Ig), SEMA4A transmembrane domain (TM) and short cytoplasmic domain, (semaphorin) 4A
TABLE-US-00032 TABLE 30 36 Genes generated by one of the two methods for identifying reactive stroma genes Probe.Set.ID Gene.Title Gene.Symbol 204934_s_at hepsin (transmembrane protease, serine 1) HPN 209426_s_at alpha-methylacyl-CoA racemase /// C1q and tumor AMACR /// necrosis factor related protein 3 C1QTNF3 64486_at coronin, actin binding protein, 1B CORO1B 203755_at BUB1 budding uninhibited by benzimidazoles 1 BUB1B homolog beta (yeast) 203317_at pleckstrin and Sec7 domain containing 4 PSD4 211576_s_at solute carrier family 19 (folate transporter), member 1 SLC19A1 202148_s_at pyrroline-5-carboxylate reductase 1 PYCR1 205339_at SCL/TAL1 interrupting locus STIL 211984_at calmodulin 1 (phosphorylase kinase, delta) /// CALM1 /// CALM2 calmodulin 2 (phosphorylase kinase, delta) /// /// CALM3 calmodulin 3 (phosphorylase kinase, delta) 217912_at dihydrouridine synthase 1-like (S. cerevisiae) DUS1L 218275_at solute carrier family 25 (mitochondrial carrier; SLC25A10 dicarboxylate transporter), member 10 202645_s_at multiple endocrine neoplasia I MEN1 209424_s_at alpha-methylacyl-CoA racemase /// C1q and tumor AMACR /// necrosis factor related protein 3 C1QTNF3 206558_at single-minded homolog 2 (Drosophila) SIM2 219360_s_at transient receptor potential cation channel, subfamily TRPM4 M, member 4 220584_at hypothetical protein FLJ22184 FLJ22184 201420_s_at WD repeat domain 77 WDR77 218683_at polypyrimidine tract binding protein 2 PTBP2 208190_s_at lipolysis stimulated lipoprotein receptor LSR 219809_at WD repeat domain 55 WDR55 219395_at RNA binding motif protein 35B RBM35B 207239_s_at PCTAIRE protein kinase 1 PCTK1 218180_s_at EPS8-like 2 EPS8L2 203287_at ladinin 1 LAD1 33814_at p21(CDKN1A)-activated kinase 4 PAK4 218365_s_at aspartyl-tRNA synthetase 2, mitochondrial DARS2 208824_x_at PCTAIRE protein kinase 1 PCTK1 219148_at PDZ binding kinase PBK 201819_at scavenger receptor class B, member 1 SCARB1 218874_s_at chromosome 6 open reading frame 134 C6orf134 204532_x_at UDP glucuronosyltransferase 1 family, polypeptide UGT1A1 /// A10 /// UDP glucuronosyltransferase 1 family, UGT1A10 /// polypeptide A8 /// UDP glucuronosyltransferase 1 UGT1A4 /// family, polypeptide A6 /// UDP UGT1A6 /// glucuronosyltransferase 1 family, polypeptide A9 /// UGT1A8 /// UDP glucuronosyltransferase 1 family, polypeptide UGT1A9 A4 /// UDP glucuronosyltransferase 1 family, polypeptide A1 217099_s_at gem (nuclear organelle) associated protein 4 GEMIN4 214393_at Rho family GTPase 2 RND2 204714_s_at coagulation factor V (proaccelerin, labile factor) F5 209972_s_at JTV1 gene JTV1
Example 8
Quantitative Tissue Imaging For Clinical Diagnosis and Prognosis of Prostate Cancer
Specific Aims
[0405] Projects that use antibodies for clinical diagnosis or prognosis must take into account the huge biological differences that occur between patients and between clinical samples. One way to minimize the clinical variation is to use a panel of diagnostic or prognostic antibodies, each of which are known to capture relevant information in a subset of patients or a subset of clinical samples. However, there are also technical challenges that cause difference in staining within and between samples. One way to minimize the impact of technical variation would be to multiplex diagnostic and prognostic markers together with "reference" antibodies that that identify within tissues particular cell type rather than outcomes. These reference antibodies, under the same technical influences and in the same tissue section, can then be used to identify the signals observed for the diagnostic and prognostic antibodies of the relevant cell types which can then be quantified far more accurately than would be possible using separate hybridizations. In the case of prostate cancer, where diagnostic and prognostic antibodies are likely to be relevant in a highly variable and often rare fraction of the cancer cells or adjacent stroma cells in a patient or clinical sample, and where changes from normal tissue may often be subtle rather than "all-or-nothing", it is likely that only the inclusion of reference antibodies in the same visualization will make it possible to identify the distinct clinically relevant regions with any confidence.
[0406] Fortunately, the technology that would be able to perform multiplex antibody staining of individual samples exists with the use of fluorescent dyes. The overall goal over this two phase project is to develop an automated quantitative image-based assay of the expression level of a panel of 5-10 diagnostic and 5-10 prognostic antibody biomarkers in Prostate cancer. Quantification of each antibody biomarker will be carried for specific cell types by utilizing colocalization of each test antibody biomarker of the panel with a reference antibody that is known to specifically identify total epithelium or tumor epithelial cells or tumor-adjacent stroma cells.
[0407] In Phase 1 of this project we will focus on the identification and characterization of the reference antibodies that reliably identify total epithelium or tumor epithelium or tumor adjacent stroma in both formalin-fixed and paraffin-embedded (FFPE) and frozen tissue sections. It is likely that a set of reference markers that distinguish different types of epithelial/tumor and fibroblast/smooth muscle stroma, could be useful for automated screening of samples for diagnosis. Phase II will then build on this reference set with additional markers of diagnostic and prognostic use.
[0408] In phase I, whole frozen and FFPE sections as well as prostate cancer tissue microarrays (TMAs) will be used to survey candidate reference antibodies and the reproducibility, variability, and accuracy of labeling will be determined for all cases of the TMA as well as by comparison to standard cell lines and normal prostate tissue specimens. This aim is non-trivial as antibodies can have optima for immunohistochemistry that differ markedly from each other. Optimizing a multiplex application may require examining may different types of antibody for each marker as well as a variety of conditions in order to uncover a standard conditions and a standard set of antibodies. Reproducibility, variability, and accuracy of the intensity data will be carefully assessed using positive and negative controls, TMA statistics, and repeated hybridizations on different days for adjacent slices of tissue, including the TMAs. Data storage consistent with the DICOM standard will take place by porting our data to a freeware database and visualization system (ConQuest).
[0409] The quantitative properties of the multiplex antibody system will be generated automatically using the proprietary scanning microcytometer developed by Vala Sciences Inc. using multiple fluorphores and validated by comparison to direct visual assessment of the binding location and intensity of representative candidate antibody biomarkers. Each section used for quantitative immunofluorescence (IF) will then be used to prepare DAB (bisdiazobenzidene) chromagen labeled version with hematoxyl counter stain and provided to a panel of four pathologists for estimation of labeling intensity and percent positively labeled epithelial cells or tumor epithelial cells or tumor-adjacent stroma cells. Visual scores for DAB and for fluorescence labeled sections will by quantitative compared to the automated output of the Vala system, using a linear model of the relationship between automated intensity and visual intensity. There is no strict necessity for an antibody to map exactly to a tissue type as assessed by a pathologist, but the scorings should be consistently different for any particular sample, in order to be confident that the antibody is measuring something slightly different, consistently. Zones of authentic tumor and stroma will be defined and the coincidence with colocalized pixels or cells will be quantitatively evaluated.
[0410] Workflow will be streamlined and then an SOP created to allow automatic image analysis to be completed with 4-5 days.
B. Background and Significance
Overview
[0411] Despite advances in our understanding of cancer and the development of new therapeutics, cancer remains the number two killer in the US with mortality rates of many cancers remaining relatively unchanged for decades. Prostate cancer is the most common cancer and second leading cause of cancer-related death among males of Western countries [1-3]. While PSA screening has been a valuable marker increasing early detection of prostate cancer, PSA testing currently suffers from several limitations including lack of specificity and inability to accurately predict disease progression [1, 2, 4-8]. There is a critical unmet need to identify reliable novel biomarkers to assist in early detection of prostate cancer, and, most critically, to determine risk of prostate cancer rercurrence following initial therapy such as prostatectomy. Currently the major treatment modality for newly diagnosed prostate cancer remains radical prostatectomy. Radical prostatectomy provides an excellent outcome for organ-confined disease. However, 15%-20% or more of all surgical patients ultimately experience rercurrence indicating the presence of residual disease, local invasion and/or metastatic deposits at the time of surgery [7-11]. Traditional clinical parameters including tumor staging, Gleason score, and PSA levels, stage or their combinations based on preoperative values have not adequately predicted the patient risk of rercurrence [11, 12]. It is now recognized that prostate cancer exhibits hundreds of altered gene expression changes many of which may represent genes that directly influence outcome [13-19]. However a recent consensus statement by a panel of prostate SPORE leaders (the Inter-SPORE Prostate Biomarkers Study and NBN Pilot group) has tersely summarized that few or none have proven reliable enough to advance to clinical use (http://prostatenbnpilot.nci.nih.gov/aboutpilot_ipbs.asp).
[0412] We are developing a new test using novel methods that identify cell-specific biomarkers that can be applied at the time of diagnosis to determine whether the tumor has the potential to recur after surgery. The development of a clinical test capable of distinguishing indolent and aggressive forms of the disease at the time of diagnosis will provide crucial guidance. First, this information will provide guidance as to who needs treatment thereby providing the option of avoiding surgery and the associated morbidity for those patients with a high risk of recurrence. Second, this information will also provide guidance as to who may profit from postsurgery or immediate adjuvant therapy thereby utilizing a period of many months or years during which recurrence otherwise could develop unopposed. Moreover, integration of gene expression signatures with clinical data has recently been shown to improve the accuracy of predicting progression, and metastasis [13, 14, 20]. One purpose of this proposal is the translation of a prostate cancer gene expression classifier into an antibody panel capable of rapid and reliable prediction of disease recurrence using (a) generally available clinical material such as biopsy specimens or, (b) as a guide to adjuvant therapy and patient counseling using post prostatectomy surgical pathology blocks. A crucial advantage of protein markers over RNA markers is that the protein markers provide spatial resolution of cell types and can detect cell-type-localized co-expression of markers, information that is lost in bulk RNA samples.
[0413] Moreover there remain critical challenges to diagnosis by biopsy. Over one million prostate biopsies are carried out per year in the U.S. Most are negative. Approximately 20% of these negative biopsies are judged insufficient for a definitive diagnosis owing to small foci or read as "atypical glands" only seen or other ambiguities, i.e. ˜100,000 such cases per year. The microenvironment of these sites contains potential information for diagnosis. We have observed that the tumor adjacent stroma of prostate cancer exhibits hundreds of altered mRNA expression changes and have derived a gene list that accurately identifies tumor adjacent stroma tissue. Thus, antibodies of selected gene products may be potentially useful to assist in diagnosis of traditionally nondiagnositic biopsies.
Importance of Identifying Diagnostic and Prognostic Prostate Biomarkers.
[0414] To date, only a limited number of diagnostic biomarkers that are differentially regulated in prostate carcinoma have been identified such as prostate-specific antigen [2, 5, 6, 23-25], prostate specific membrane antigen [26, 27], and human glandular kallikrein 2 [10, 28-32], and PCA3. While these antigens have been useful in the development of early diagnostics and for the directed delivery of therapeutics to prostate cancer in preclinical models [33, 34] these markers do not address the need to identify biomarkers that characterize early or advanced stages of prostate carcinogenesis and metastasis. Recent studies have identified circulating urokinase-like plasminogen activator receptor forms that may be used alone or in combination with other prostate cancer biomarkers (hK2,PSA) to predict the presence of prostate cancer [35]. Other potential prognostic markers include early prostate cancer antigen (EPCA), AMACR, human kallikrein 11, macrophage inhibitory cytokine 1 (MIC-1), PCA3, and prostate cancer specific autoantibodies [5, 36-42].
[0415] The search for novel prostate cancer biomarkers has turned to the use of global genomic and proteomic profiling to facilitate the discovery of multiple markers with both diagnostic and prognostic significance [5, 18, 36-42]. Gene-expression profiling comparing gene expression from normal prostate tissue, BPH tissue, and prostate cancer tissue has identified many potential genes that are differentially regulated in prostate cancer [14, 15]. These include hepsin, a serine protease, alpha-methylacyl-CoA racemase (AMACR), macrophage inhibitory cytokine (MIC-1), and insulin-like growth factor binding protein 3 (IGFBP3) [40], TGF131, IL-6, and many others. Validation of these markers at the protein level from patient tissue or serum samples and clinical validation of these markers as true diagnostic and prognostic tools are necessary. While some of these candidates have appeared in meta analyses (e.g., Rhodes, 2002), as noted, the recent consensus statement of the InterSPORE study has noted that none have proven sufficiently reliable for clinical use and none have been used to form a panel that predicts outcome of multiple independent case sets.
[0416] Current clinical parameters including Gleason score, PSA, and tumor staging have been inadequate in predicting patient outcome. Combinations of clinical criteria have been assembled into predictive nomograms in attempts to improve diagnosis of indolent vs. advanced disease [11, 12]. While these studies suggest improved diagnostic and prognostic capabilities, those based solely on preoperative clinical values perform less well and they await widespread clinical validation. One major challenge has been that the majority of prostate cancers share similar histological features (Gleason score) or clinical markers (PSA) but exhibit widely different clinical outcomes. Recently multigene profiles of biomarkers that are predictive of the outcome of prostate cancer at the time of diagnosis have been developed [14, 20, 44-46]. Singh identified a 5-gene classifier capable of predicting prostate cancer recurrence better than clinical parameters of preop PSA or tumor stage [46]. Stephenson identified a set of 10 genes highly correlative with prostate cancer recurrence. An analysis combining clinical variables with the 10-gene classifier greatly improved prediction of clinical outcome [20]. Henshall identified >200 genes that correlate with prostate cancer recurrence better than preoperative PSA [14]. From these studies it is clear that molecular correlates have the potential to provide a considerable increase in information related to outcome than current clinical parameters. In addition to prediction of outcome, it is likely that several of these unique biomarkers are functional and therefore provide intervention opportunities. The proper identification of the molecular determinants predictive of prostate cancer rercurrence, their validation at the protein level, and the translation of the data into a robust clinical test is the challenge addressed in our current proposal. We have developed improvements in both the identification and validation of candidate genes that will enable a rapid and robust transition to a clinical test.
Improved Gene Lists
[0417] We have developed new methods that have helped in the development of gene signatures for the diagnosis and for prognosis based on expression values of tissue obtained at about the time of the original diagnosis. First, as described herein, we have used a linear combination model together with knowledge of cell composition as determined by a panel of four pathologist to determine gene expression by cell type [18]. These studies revealed cohorts of genes that are differentially expressed by tumor epithelium compared to epithelium of PBH or dilated cystic glands or stroma [18]. This observation has important practical considerations. While most global genome studies have looked at differences between normal and cancerous prostate epithelial cells, considering the contribution of stromal cells as "contamination", we have found that stroma exhibit dozens of significantly differential gene expression changes between tumor-adjacent stroma and stroma remote from tumor sites [18] and dozens of differential expression changes between tumor-adjacent stroma of recurrent PCa cases compared to nonrecurrent cases [43]; [44]. We have identified two separate subsets of genes. The first consists of tumor epithelium specific and stroma cells specific genes that are differentially expressed between recurrent PCa ("aggressive" cancer, relapsed PCa) and nonrecurrent PCa ("indolent" cancer, nonrelapsed PCa). Since nearly all PCa tissue specimens contain stroma or reactive stroma in the immediate microenvironment of tumor, the proper inclusion of antibodies sensitive to stromal change provides an important ingredient of a "classifier" for prognostic use. These expression changes may be used to predict outcome ([43] [44]).
[0418] Second, we have identified a separate subset of tumor-adjacent stroma specific genes. These genes are differentially expressed between tumor-adjacent stroma and remote stroma. These expression changes may be used to detect tumor-adjacent stroma at foci of "nondiagnostic" or "atypical" tumor in biopsies of equivocal cases thereby potentially converting "nondiagnostic" cases to a definitive determination. We propose to use these gene lists as the starting point for the development of panels of 5-10 antibodies for application to biopsy or postoperative FFPE tissue specimens that are routinely available for all patients with a confirmed or suspected diagnosis of prostate cancer. While RNA may be retrieved from these samples, the preservation of a particular set of transcripts with the crucial information in all cases and in proportion to the amounts in fresh tissue is problematic. In contrast, antibody based diagnosis from FFPE is well established. In Phase II we plan to utilize a high throughput scanning microscope to identify the best antibodies for inclusion in the panels. TMAs consisting of 254 prostate cancer cases, normal prostate tissue and defined cell lines will be used for the survey. The TMAs to be used here have been constructed to contain cores especially rich in tumor-adjacent stroma and remote stroma. These cores will allow us to evaluate whether the differential expression observed between relapsed and nonrelpased cases may be observed in adjacent nontumor tissue or even in remote nontumor tissue and to confirm that diagnosis based on tumor-adjacent stroma is reliable. Additional potential applications include the detection of tumor-adjacent stroma in "negative" biopsies that may have narrowly "missed" frank tumor. This possibility is of considerable significance given that most of the million biopsies performed each year are "negative".
Biomarker Validation Using Tissue Microarrays (TMAs).
[0419] The heterogeneous nature of DNA changes in prostate cancer makes it unlikely that a single biomarker will be adequate for proper determination of prostate cancer severity and risk of rercurrence. What is needed is the identification of a panel of biomarkers that can be shown to correlate with different aspects of disease progression and risk of rercurrence in the population of cancer patients. The screening of tissue by use of microarrays (TMAs) is ideal for identification of markers that statistically correlate with disease progression and outcome [45-48]. Screening of TMAs is a powerful tool for validation of the microarray results, for extension of the RNA expression results to protein expression and for the identification of antibodies of biomarkers that are widely expressed and readily available from samples routinely taken at time of diagnosis. TMAs are constructed using hundreds of different patient samples that span the entire range of clinical pathology and outcome. Furthermore, it requires only small amounts of tissue that can be collected at the time of diagnosis such as biopsy samples and is amendable to high throughput analysis using multiple antibody probes. TMAs may be made from selected archived cases with clinical annotation spanning many years detailing survival and other parameters, such as treatment history.
[0420] Numerous studies have used TMAs to identify or validate prostate cancer biomarkers associated with disease progression, response to therapy, rercurrence, and metastasis [45-48, 49, 50]. TMA analysis was used to validate a seven antibody panel derived from a 48 gene expression signature enabling more accurate classification between Gleason grade 3 and 4 tumors [47]. Multiple TMA studies have identified several markers indicative of prostate cancer progression including Amacr (alpha-methyl acyl racemase) AMACR, AR, Bcl-2, CD10, ECAD, Ki67, and p53 [45]. TMA analysis has identified 13 genes associated with prostate cancer rercurrence. These include AKT, quadrature-catenin, NFκB, Stat-3, hMSH2, Hepsin, PIM1, syndecan-1, Bcl-2, Ki67, and ECAD [45]. Few have been formed into a coherent predictive panel and evaluated as a panel. Therefore, the performance of a panel compared to individual antibodies and the potential of combinations to overcome the diversity of prostate cancer is unknown. Nearly all studies ignore the stroma although smooth muscle alpha actin has been examined by Rowley and coworkers [51]. Others suffer the caveats noted by interSPORE group. Several, such as AMACR are utilized as an aid to diagnosis in surgical pathology but are not used routinely in risk assessment. We propose the systematic evaluation of over 50 predicted prognostic biomarkers (Phase I and Phase II) taken from a predictive panel of known performance at the RNA level.
High Throughput Analysis and Quantification.
[0421] The current study will address several obstacles that have precluded the development of a rapid and reliable biomarker panel ready for clinical testing. While TMAs contain a wealth of potential data, the ability to properly identify and quantify the cell-specific staining patterns of antibodies currently relies on manual identification or pattern recognition programs that are both time consuming and subject to bias and error. Therefore we will utilize an automated digitizing scanning system developed by Vala Sciences Inc. (http://www.valasciences.com/). This system can rapidly record histological sections labeled with up to 10 distinct fluorophores with pixel level subcellular resolution including for TMAs and display each color separately. The system has been acquired by Beckman Coulter Instruments Inc. (Fullerton, Calif.) (http://www.beckmancoulter.com/hr/pressroom/oc_pressReleases_detail.asp?K- ey=4764&Date1=Dec. 11, 2003) and developed as the Beckman-Coulter IC 100 system. Our application requires only two colors. The reference antibody will be applied to locate all epithelial cells or the subset of epithelial tumor cells or stroma cells and a test antibody will be applied in with a second fluorophore and the pixels of colocalization of test antibody with bona fide epithelia or tumor or stroma will be determined as well as the pixels of not colocalized with target cells. The intensity of antibody labeling at target sites will then be integrated, normalized and compared to nonlocalized binding or to the known clinical outcome. Thus specificity, sensitivity, and accuracy may be determined by existing technology and software. As a gold standard, Phase I will establish the utility of the reference antibodies in comparison to the visual results of a panel of pathologists.
Phase II Studies
[0422] Development of clinical studies. Phase II will involve forming and validating the multiplex application of antibodies as prognostic panel and as a diagnostic panel in clinical trials. The diagnostic and clinical performance of candidate antibodies will be determined. Teo pandel will be formed composed of antibodies with (1) maximum performance by the criteria of intensity, specificity, and sensitivity and (2) superior accuracy with subsets of cases not equally achieved by other antibodies.
[0423] Acquisition and tests of monoclonal versions of panel members. All polyconal antibodies will be converted to monoclonal counterparts by commercial license from existin vendors or commission using sources that can provide GMP product. GMP manufacture of the predictive antibody will be initiated and a clinical protocol developed for recruitment and testing on prostate cancer patients in a CLIA setting.
[0424] Expansion of biomarker discovery/validation platform; In Phase II we will continue to validate novel prostate cancer gene classifiers on an expanding set of TMAs. We will also examine whether circulating protein biomarkers have predictive value.
C. Preliminary Data
C.1. Derivation of Diagnostic and Predictive Genes Signatures.
[0425] While the importance of the tumor microenvironment on tumor progression and metastasis has been well documented [19, 40, 49, 51-54], very few studies such as Tuxhorn et al. (2002) [51] and [55] have identified genetic markers of reactive stroma. We have utilized linear regression to define expression profiles of the four major cell types contained within prostate tissue samples including tumor cells, stromal cells, and two additional normal epithelial components [18]. In the linear model, the observed expression of any gene (the expression array result for that gene) in a complex piece of dissected prostate tissue used for RNA preparation and Affymetrix analysis is considered to be due to the sum of contributions from the principal cell types in the sample. Each contribution is in turn due to the proportion or percent of each cell type in the sample and the characteristic expression coefficient for the particular gene in a particular cell type:
Gi=β'tumor,iPtumor+β'stroma,iPstroma+- β'BPH,iPBPH+β'dilcys gland,iPdilcys gland. (egn. 1)
where Gi is the observed Affymetrix total Gene expression, β' are the cell-type specific expression coefficients, and the P's are the percent of each cell type of the sample used for the array. The percentages, P, may be determined by examination of H and E slides of the tissue used for RNA preparation by a team of four experienced pathologists. The expression coefficients are determined by multiple linear regression (MLR) analysis. For grossly microdissected tissue enriched in tumor, there are four major cell types as expressed in eqn. 1. We showed that there is very high and statistically significant agreement both between and amongst the four pathologists for the determination of cell-type percentages [18]. In this initial study we sought to determine genes that were consistently expressed predominately by one cell type or another without regard to outcome, i.e. genes that were characteristic of cell type in prostate cancer specimens. We observed 3384 genes were statistically significantly expressed predominately by one cell type. For example, 1096 were consistently expressed by tumor epithelial cells while 496 genes were significantly associated with BPH epithelial cells. Cell type specific expression has been validated by comparison to the literature, by quantitative PCR of LCM samples, and by immunohistochemistry [18].
[0426] C.1.A. Diagnostic multigene signature. These initial studies indicate that numerous, perhaps hundreds, of genes may be differentially expressed in the microenvironment of tumor cells which may be useful in diagnosis in supplement to or even in the absence of data from the tumor cell component [18]. Three methods have employed to identify such genes. We adopted the model that it is mainly tumor-adjacent stroma that exhibits the most and largest differential expression changes between the microenvironment around tumor cells and normal or remote stroma. We also assumed that stroma remote from tumor sites of PCa-bearing prostate glands could be used to approximate the expression of normal stroma. We utilized publicly available expression data from 91 cases applied to 148 U133A Affymetrix GeneChips (GEO accession number GSE8218). These cases were the same as those previously studied on the U95av platform [18] plus additional cases. The percent cell composition determined exactly as described [18]. The goal is to find the genes that have altered expression levels between normal stroma cells and the stroma cells close to the tumor cells. We divided U133A samples into two subgroups: 91 tumor-bearing cases and 57 non-tumor-bearing portions of tissue from the same cases. These portions are largely remote stroma. We then applied eqn. 1 to each set thereby determining two β values for stroma: tumor-adjacent stroma and tumor-remote stroma. Note that neither recurrence status or any other clinical parameter such as the Gleason score indicating differences among the tumor bearing portions was considered. Thus only β characteristic of stroma were determined together with a least-squares estimate of error for each β value. Note also that β which are large relative to error must be uniformly or characteristic of tumor-adjacent stroma or remote stroma, i.e. independent of clinical values such as Gleason scores that might indicate differences in aggressiveness. Such β favor high T values in significance tests. The significant differences between the β values for tumor-adjacent stroma and remote stroma were determined. This method produced 208 genes. These significant genes are candidate genes as specifically differentially expressed in the tumor-adjacent microenvironment.
[0427] In a second method eqn 1 was extended to include a cross-product:
G i = β tumor , i ' P tumor + β stroma , i ' P stroma + β BPH , i ' P PBH + β dilcys glad , i ' P dilcys gland + β stroma , i ( P stroma * P tumor ) , Eqn 2 ##EQU00016##
The cross-product term is used for modeling the interaction between tumor and stroma cells. The significant interaction can be treated as the altered expression trait of stroma caused by the adjacent tumor cells. Egn 2 was applied to the U133A plus data set thereby 1820 significant cross-product terms (˜8% of the probe sets). Finally a third gene list was determined by application of Egn. 2 to and independent set of 91 cases measured on the pangenomic Affymetrix U133A plus2 GeneChips (unpublished data, D. Mercola). This third data set could be used as a test set for the genes determined using the U133A arrays however the differences in platform means that testing can not be applied without cross platform normalization, a process that introduces additional error. Therefore we applied eqn. 2 to the third data set ab initio and sought genes that met the same significance criterion yielding 4533 significant cross-product terms (also ˜8% of probe sets).
[0428] Finally we asked which of these genes were common with to all three determinations (the maximum intersect is 208 genes). This three-way intersect yielded 90 genes, i.e. 90 genes which appeared on all three calculations using the two different case sets. These genes may be used to diagnosis the presence of tumor-adjacent gene changes entirely from stroma tissue in the absence of tumor cells.
[0429] To test the consistency of these genes PAM (Prediction Analysis for Microarrays) was employed using all 90 genes as a classifier to distinguish tumor and nontumor tissues of the U133A and the U133 plus2 data sets. This method does not utilize information of percent cell type composition.
[0430] First, we extracted relevant expression values for these 90 genes from U133plus2 data as a training set. Then we used PAM to analyze these extracted expression data, with tumor/non-tumor as relevant classification variable. Via cross validation, PAM identified 21 genes out of 90 as the best predictor for classification variable. The classifier was tested on the U133A data which yielded a specificity of 100% and a sensitivity of 94.4% (accuracy >94.4%).
[0431] Conclusions.
[0432] The observations indicate that it is possible to diagnosis the presence of prostate cancer in a large proportion of cases solely from an analysis of the expression of tumor-adjacent tissue, i.e. in the absence of tumor cells. This has a very important potential application to the understanding of patient biopsy material. Moreover, by repeating the above analysis by applying egns. 1 and 2 only to U133A, (two list input in forming the intersect) the final analysis would be free of any input from the test set and stringently objective. We plan to the 21 gene set in this way and to use the resulting list as the starting point for the identification of antibodies suitable for formation of a diagnosis panel for Phase II.
[0433] C.1.B. Prognostic Multigene Signature.
[0434] MLR may be extended to identify genes differentially expressed by a given cell type between indolent and aggressive tumor cases where "aggression" is defined by chemical recurrence. In the simplest application of this method, eqn. 1 is applied separately to each class of cases--indolent or aggressive cases--and significant differences in β for these two classes of cases for each cell type are determined. Using these methods for a series of 91 patients examined on 131 U133A GeneChips, we observed 1212 genes were significantly and differentially expressed by tumor cells (p<0.05).
[0435] In order to validate these differential expression changes, the process was then repeated using the independent 86 cases assessed on the U133A plus2 platform. Again, no cross platform normalization is required. 1373 significantly differentially expressed (p<0.05) genes were identified. "Validated" genes were then defined by four criteria: (i) two or more probe sets of each platform mapped to the same gene; (ii) where multiple probe sets for the same gene were present, all probe sets for the same gene met criteria (iii) and (iv); (iii) differential expression changes for each case set were significant with p<0.05, (iv) the differential expression of identified genes are in the same direction for each case set. We observed that 18 tumor cell specific genes and 19 stroma cell specific gene met these criteria. The chances that that 37 genes could appear to meet the significance criteria for both case sets and be of the same sign by chance is a vanishingly small p<zx indicating supporting that the validated gene list is specific. Moreover, the magnitude of differential express of these genes for the two cases sets is positively and significantly correlated (FIG. 9) further demonstrating the relatedness of the validated genes. None of the genes are the same as those determined for the diagnostic multigene signature.
[0436] Conclusions.
[0437] These preliminary calculations indicate that it is readily possible to identify multigene signatures that exhibit reproducible differential expression changes that discriminate indolent for aggressive disease. These calculations account for the cell type heterogeneity that is an essential part of the structure of prostate cancer and leads to the heterogeneity of sample collections assessed by others. Therefore our approach may overcome a major problem plaguing the development of a reliable prognostic classifier. In addition we employed two independent data sets. As a result of accounting for percent cell type composition, we have observed separate gene signatures for tumor epithelial cells and for tumor-adjacent stroma cells. Thus, it may be possible to utilize tissue with sparse tumor content to enhance the prognostic value of the specimens. We plan to use the 38 identified genes as a starting point for the identification and screen of antibodies for our antibody panel in Phase II. This study with TMAs will further validate the prognostic properties of our signature. Numerous additional studies are in progress. We need to test our classifier on published independent data sets by calculation of operating characteristics. We plan to use PAM to further refine our gene list and assess the accuracy by as for the diagnostic profile. These and other refinements are in progress.
[0438] C.2. Fully Automated Fluorescence and Absorption Microscopy Analyses.
[0439] The scanning microscopy and separate image representation from multiple color labeled slides to be used here has been developed by Vala Sciences Inc. of San Diego by J. Price, President and CEO, and coworkers and has been utilized for a variety of publications (61-84). This system, known as the Q3DM Eidaq® 100 robotic microscopy instrument runs on the Beckman Coulter's CytoShop® version 2.0. This instrument includes a Nikon (Melville, N.Y.) Eclipse microscope with an automated stage interfaced to a fluorescence light source and filter wheel of up to 10 narrow band base optical filters in the range 413 nm-663 nm. Numerous supporting software packages has been developed. The system is supported by a variety of antibody-based kits prepared by Vala. Each product contains staining reagents that are targeted towards particular proteins of interest along with a software program (Thora®) that can be used on virtually any computer system. The original instrumentation was developed by a predecessor company, Q3DM Inc. by J. Price focused on the development of high throughput microscopy instrumentation oriented primarily toward automated fluorescence image cytometry (61-84). This instrumentation was designed with accurate image segmentation (81, 83, 84), fluorescent excitation arc lamp stabilization (68, 82), and autofocus for producing fluorescence imaging (69). This system was sold to Beckman Coulter and developed as the Beckman-Coulter IC 100. The current instrumentation is a further generation scanning microcytomer and includes a slide holder hotel for automated scanning of 100 prepared slides.
[0440] Two modes, immunofluorescence (IF) with fluorophore-labeled antibodies and immunohistochemistry using absorption chromophores will be employed in the present study. For both methods spectral separation of multiple labeled sections is achieved by capturing multiple images using multiple fixed band pass filters. Up to ten fixed band pass filters are automatically rotated into the optical path of the light either in front of the light source or in front of the camera. Therefore up to 10 images per section are recorded on a monochrome CCD camera creating a "spectral stack". Spectral unmixing from the data of the spectral stack is sensitive to errors in registration of images of the spectral stack to chromatic aberration. Multiple precautions have been included in the software correct for effects.
[0441] For IF the narrow emission of fluorophores of different colors are resolved directly by the appropriate filter of the spectral stack and the corresponding image may be used for pixel-level analysis (for examples see Progozhina et al 2007).
[0442] For IHC the broad absorption bands of typical chromophores such as DAB (bisdiazobenzidene), hematoxyln, and others require analysis of multiple images of the spectral stack as previously developed (3). Briefly, spectral unmixing of the observed intensity is based on a model expressed in matrix notation as a linear combination of chromophores where each chromophore contribution is the product of amount of binding and fluorescence intensity or absorption in a given wavelength range. Emission and absorption spectra for all chromophores to be used here are known and the desired unknown are relative amounts of each chromaphore contributing to a given pixel intensity. These are determined by the method of Non-negative Matrix Factorization (NMF) (Rabinovitch et al. unpublished). Effective multicolor separation of tissue images usually requires knowledge of the individual chromophores interacting with the tissue. Based on NMF, the Vala system is the first system capable of performing this color decomposition in a fully automated manner without reference to individual chromaphore-tissue absorption or fluorescence spectra. Instrumentation and software implementing these methods have been developed, characterized and validated on TMAs using objective standards and expert visual scoring and the results are described in reference (Rabinovitch et al. unpublished, Rabinovich et al. 2006).
[0443] Supportive additional features of imaging technology and software include: (i) the ability to regroup broken core images which are common in TMA fabrication. None of the currently available software other than that of Vala has addressed this to our knowledge. This problem solved this problem by using the K-means clustering algorithm (53, 54), which provides an automatic method for grouping objects (e.g., pixels) based on distance. Details can be found in the Vala TMA software "framework" article (Rabinovich et al. 2006). (ii) Online viewing, computerized entry of TMA Scoring and Storage is implemented. The tissue microarray core images are organized by software for viewing, interactive entry of expression scores and storing of the data in an organized format. The user can click on any of these thumbnails to view an enlarged image of the entire core and/or a full magnification subfield of the image of the core. Data can then be entered by selecting the data entry pop-up window. The storage format for the images is standard TIF or BMP. Further details can be found in reference (Rabinovich et al. 2006). (iii) Fully Automated Densitometry IF- or IHC-labeled TMAs using Unsupervised Multispectral Unmixing has been developed and implemented (Rabinovich et al. 2006). FIG. 11 summarizes major steps in data acquisition and analysis.
[0444] We propose to utilize reference antibodies in one color to identify particular cell types and double label the same section in a second color to localize a candidate or test antibody binding. The amount of test antibody binding to target cells such as tumor cells will be determined by colocalization: determination of the pixels of test antibody binding at the site (pixels) of reference antibody labeling. The integrated pixel values of non-colocalized test antibody also will be determined as a measure of lack of specificity.
[0445] Two separate uses of colocalization are planned. For routine high throughput screening of candidate antibodies (Phase II), IF will be used as IF has is more sensitive, enjoys greater dynamic range and more amenable to the application of multiple proven antibodies to patient material. For characterization of reference antibodies (Phase I) by comparison to the gold standard of visual score by an expert panel of pathologist, IHC will used in order to provide slides that can be directly assessed by pathologists and compared to the results of colocalization by spectral deconvolution.
[0446] C.3. Accuracy of Spectral Unmixing of IHC Labeled TMAs: Comparison to Single Labeling and to Visual Scoring.
[0447] Cell type specific labeling of candidate biomarkers in an automated fashion proposed here relies on colocalization of candidate antibodies with the cell of interest as identified by a reference antibody using a second color. The resolution of separate fluorophore labeling patterns from multiple labeled tissue section may be obtained directly from images of multiple narrow band base filters. However absorption/transmission based images of IHC are more challenging and require spectral separation using nonmatrix factorization (NMF). We have evaluated this approach by using double labeled TMAs by the following procedure. Using a set of 97 cores, we first applied the DAB stain and captured 437 multispectral image stacks 9), an average of 4.5 fields of view per core. We then added the hematoxylin stain and acquired a second image stack. The second stack served as the input to our algorithm and the resulting decomposition, which estimated the DAB staining, was compared with the first stack, which serves as the ground truth. We then experimentally evaluated the use of NMF for the color decomposition problem. While reconstruction error represents a quantitative measure, it does not provide a standard for judging how accurately the estimated components represent the dye concentrations. We quantified the performance by comparing the ground truth single-stained image to the corresponding automatically extracted component of the doubly-stained tissue sample as proposed by Rabinovich et al. (Rabinovitch et al. unpublished).
[0448] Using this procedure the average decomposition error over all samples was 6.73% with standard deviation of 1.81%. This therefore provides one objective assessment of the accuracy of spectral devolution in comparison to the single chromophore labeled section.
[0449] With the accuracy of densitometry via multispectral unmixing established, we asked how this quantitative measurement compares with the subjective scoring of a human expert. A panel of four trained pathologists (M. Krajewska, S. Krajewski, D. Mercola, A. Shabaik) evaluated the 97 tissue biopsies for the expression of antibody protein (DAB). The scoring was performed according to pathology conventions and each tissue section was graded on a scale from 0.0 to 3.0 in increments of 0.5. For correlation of the visual and analytical results, we analyzed the performance of a linear model y=mx+c, where x is the score reported by NMF decomposition, y is the pathologist's score, m is the slope and c is the y-intercept. Linear regression was used to fit the model. The fitting error for regression may be an indication of the prediction error of the model. However, depending on the complexity of the model and the amount of data available, the regression error can be significantly different from the true prediction error of the model. Thus, an effort was made to estimate the prediction error and report it instead of the fitting error. The simplest and most widely used method for reporting prediction error when the data is scarce is cross-validation (86). Ten-fold cross validation resulted in a mean squared error of 0.02 with a standard deviation of 0.01. This is equivalent to a root mean squared (RMS) error of 0.163, which also translates to an average of 5.4% error on the pathologist's scale. A major result of the validation study is that the 5.4% error is considerably larger than the corresponding signal: noise ratio of the camera detector. Thus the validation makes available a greatly increased dynamic range of electronic signal detection of the camera-based microscope over the visual system with a "noise" value of ˜3×5.4%=16.2% vs. <1% for the camera. The increased dynamic range for quantified antibody binding overcome a major limitation of antibody labeling using visual or IHC methods and greatly increases the ability to identify antibodies that correlate with survival data and other important clinical co variants. This advantage is extended many times for fluorescence-based antibody labeling.
[0450] Another decomposition of the form A=BC that is widely used is Independent Component Analysis (ICA) (Hyvarinen, J., Karhunen, and E. Oja, Independent Component. Analysis, John Wiley & Sons, 2001). ICA is based on the assumption that the matrix A is the result of the superposition of a number of stochastically independent processes. This is a more reasonable description of the staining process where each stain can be assumed to be independent of the other stain. Classically, however, ICA algorithms do not enforce non-negativity and that makes them unsuited for stain recovery as well. We experimentally evaluated the use of NMF and ICA for the color decomposition problem. While reconstruction error represents a simple quantitative measure, it does not provide a standard for judging how accurately the estimated components represent the dye concentrations. We quantify the performance by comparing the ground truth single-stained DAB image to the corresponding automatically extracted component of the doubly-stained DAB/hematoxyln tissue sample. Quantitatively, the overall for four images sets was 50% larger for ICA compared to NMF (the images are available at hppt://vision.ucsd.edu/). Both NMF and ICA provide good results however there is an observable increase in fidelity to ground truth for the NMF analysis. We propose to utilize NMF for the studies proposed here.
[0451] Conclusions. 1. These Studies Provide Support for the Ability to Successfully Decompose Multicolor Labeled TMAs to Component Images.
[0452] The application proposed here is simpler as separate 2D images are unnecessary. We plan to extract a subset of pixel intensities, those of chromaphore A that are co-localized with the pixels of chromaphore B where chromaphore A predominately binds to cells of interest such as tumor or epithelial cells or stroma cells. We have not completed this task however only minor modifications to existing software, pixel integration, is required and is proposed as a milestone of Phase I. The data of co-localized chromaphore B, the test chromaphore, would then be analyzed by Cox-regression and ANOVA analysis with covariates of disease progression currently available for the cases of the PCa TMA. 2, The automated ability to scan TMAs and extract quantified data will greatly facilitate antibody screening.
[0453] C. 4. Multicolor IF Separation at the Subcellualar Level.
[0454] The design goal of the Vala scanning robotic microscope is subcellular segmentation using pixel level resolution. It is important to note, therefore, that this capability exceeds the needs of cellular resolution required here which is well within current level of the instrumentation development. This was insured by the successful development of an automated membrane algorithm of the Thora package (Prigozhina 2007). For example mouse skin tumors were labeled with three fluorophores, two to identify proteins of interest, the membrane binding E-cadherin and the epithelial localizing antibody anti-K-14, and a cell localizing label for nuclei, DAPI. In this context, K14 is a putative marker for tumorigenic epidermal cells that invade the deeper skin layers. Cells exhibiting K14 signal (high red channel fluorescence) were clustered within the tumor loci. Areas of the section that stained brightly for K14 stained relatively dimly for cadherins, whereas surrounding tissue stained poorly for K14 and brightly for cadherins. To quantify K14 and cadherins, Thora separated the three primary cellular compartments (membrane, nucleus, and cytosol) from the dualcolor image of pan-cadherin and nuclear fluorescence. Thora estimated the cell boundaries in both the normal cells bordering the tumor where the cadherin signal was strong and in the tumor where it was relatively weak. To measure cadherin reduction in K14-positive cells, TMIs (total membrane intensity by pixel integration by boundary recognition) in the cadherin channel were collated for K14 cells with ACT (average cytoplasmic intensity) of 30 (the ACT range was 0 ACT 255 for the 8-bit images). By visual inspection and comparison of the intensity measurements of different cellular regions, ACT values below 30 arose from background staining that was not cell-specific. The mean pan-cadherin TMI for K14-positive cells was just 34% of that for K14-negative cells, and this difference was highly significant (P<0.01). Thus, the K14-positive cells representing invading tumor exhibited quantifiably reduced cadherin expression relative to the surrounding cells. Other examples and details of the development have been described in detail (Prizozina 2007).
[0455] For the applications proposed in this SBIR project membrane boundary recognition is less crucial as it is only necessary to identify zones of tumor epithelial cells and zones of nonepithelial stroma and those subareas of test antibody labeling that colocalize with either tumor or, for nonspecific labeling nontumor labeling. It is of course important to recognize that colocalized tumor labeling may only be increased on average compared to non tumor labeling and, like cadherin, this may be readily quantified.
C. 5. TMA Construction.
[0456] The Prostate cancer TMAs to be used here have been fabricated as part of the NIH-supported UCI SPECS (Strategic Partners for the Evaluation of Cancer Signatures) consortium at the Burnham Institute of Medical Research, a consortium member of the UCI SPECS program and are available here as an NIH resource of NIH-sponsored projects. The TMAs have been specifically fabricated to validate the cell-specificity of candidate biomarkers of prostate cancer. 272 cases with known clinical outcome have been included to date. FFPE blocks and clinical follow-up were retrieved from two participating institutes of the SPECS consortium according to an IRB-approved and HIPPA-compliant protocol and consist of cases provided by SKCC (60 cancer cases, 12 normal cases) with the rest of the cases drawn from UCI that have 10-19 years of clinical follow-up with clinical characteristics as previously described in T. Ahlering and coworkers [75]. All cases have been re-examined by two clinical pathologists who confirmed the Gleason score and defined areas of tumor, BPH, stroma adjacent to tumor, stroma away from tumor, and epithelium of dilated cystic glands and PIN cores. In order to validate cell-specific binding properties of candidate biomarker antibodies, each case on the TMAs is represented by 4-5 cores from 4-5 zones of pure cell types as defined by two pathologists. Duplicate cores from the chosen zones were used for array fabrication so that all zones are represented in duplicate. Thus these TMAs are unusual in that they have 4-5×2 cores per case on the array. The TMAs are under continuous construction with the next phase to include 100 additional UCI cases so that the arrays available for the proposed study will exceed the present 272 case set. The prototype array at the 66 case stage have been utilized for the evaluation of several potential antibody by markers including Claudin I and Bcl-B (Krajewska et al. 2007; Krajewska et al. 2008).
C. 6. Colocalization.
[0457] The studies of Krajewska et al. (Krajewska 2007;Krajewska 2008) utilized double antibody labeling of the same TMA section using anti-Claudin I and anti-cytokeratin in the double chromagen mode. For colocalization the two color were separated using a segmentation program developed by Aperio Technologies and represented individually and provide clear indication of the epithelial binding pattern of anti-Claudin-I. Pixel count and quantification of colocalization as well as nonlocalized binding is readily possible although non specific binding for anti-Claudin-I is negligible in this example. The method is less easily generalized to three or more colors or to IF as yet and therefore is less versatile than the Thora system of Vala preferred for this application however it provides further illustration of our early experience in the methods proposed here.
[0458] Conclusions.
[0459] Candidate gene expression levels for diagnosis and prognosis have been derived. Methods for the high throughput and quantitative assessment of labeling by corresponding antibodies are available. The wedding of this methods promises to provide the means of developing reference and assessment antibodies for new ICON-compliant clinical assays which solve significant unmet needs.
[0460] Phase I.
[0461] Here we focus on attaining milestones that support the goal of demonstrating that reference antibodies and methods are available for the reliable and quantitative identification of cells of interest for use in Phase II, the systematic assessment of candidate biomarker antibodies for the development of panels for the multiplex determination of diagnosis and prognosis
[0462] Milestone 1.
[0463] Develop an automated optimized imaging assay and SOP for prostate stroma and epithelial/tumor cells using three or more antibodies for immunohistochemistry and immunofluorescence.
[0464] Unstained sections of formalin-fixed paraffin-embedded prostate tumors, unstained sections of our prostate cancer TMAs and frozen sections of frozen prostate carcinoma-bearing tissues will be utilized. FFPE blocks will be taken from the extensive collection used for construction of the TMAs. Frozen tissues are available from the UCI SPECS program. Antibodies for the labeling of all epithelial structures, just tumor epithelium, and the fibroblast/myofibroblasts component of stroma will be optimized separately for all three tissue preparations. Screening studies will be carried out using chromagen labeling by indirect IHC using DAB for ease of visual monitoring and optimization will be extended to indirect IF.
[0465] Panepithelial labeling.
[0466] Panepithelial labeling will be used as a reference to define candidate antibody biomarker labeling that colocalizes with bona fide epithelium in prostate cancer sections and therefore to derive a ratio of epithelial:nonepithelial labeling as a measure of specificity. Panepithelial labeling will be optimized for two antibodies and the best one of these used for all subsequent studies. Anti-high molecular cytokeratin (anti-HMW keratin; Dako clone 34βE12 mouse monoclonal anticytokeratin) will be used at the starting conditions that we have previously employed for the prostate cancer TMAs (Krajewski 2007). The antibody labels squamous, ductal and complex epithelia containing cytokeratins 1, 5, 10, and 14 (68, 58, 56.5' and 50 kDa proteins).
[0467] A second anti-panepithelial antibody is AE3/AE4 (Dako AE3/AE4 MNF116 mouse monoclonal antihuman) which is in standard clinical use in the Pathology Department at UCI for the identification of epithelial components especially in the investigation of metastatic spread of carcinomas in distant tissues. The antibody labels multiple cytokeratins (65-67, 64, 59, 58, 56.5, 56, 54, 52, 50, 48 and 40 kDa cytokeratins) in either FFPE or frozen tissue.
[0468] Tumor Epithelial Cell Labeling.
[0469] Tumor epithelial cell labeling will be used as a reference to define the colocalization of labeling by candidate antibody biomarkers with bona fide tumor cells and therefore to derive the ratio tumor cell labling:non tumor cell labeling as a measure of specificity. Prostate cancer tumor epithelial cell labeling provides a more specific reference site for co-localization studies to be carried out in Phase II but is a challenging reference target owing to the limited number of antigens accepted as expressed in prostate cancer epithelial cells independent of the degree of differentiation or other histological properties such as Gleason score. We previously examined the expression pattern at the RNA level for a series of 55 tumors where expression could be resolved to the principal cells types (tumor epithelial cells, BPH epithelial cells, dilated cystic gland lining epithelium and stroma) which revealed that several classically expressed antigens such as PSMA (prostate specific membrane antigen), PAP (prostate acid phosphatase), and AMACR (α-methyl acyl CoA racemase) where significantly expressed at the RNA in nearly all tumor cells independent of grade and stage (Stuart et al. 2004). In this study we validated the protein expression was specific in seven representative cases (Stuart et al. 2004) using IHC.
[0470] Anti-AMACR is now in widespread clinical use for the identification of metastatic prostate cancer and has been reviewed extensively (e.g. Rubin 2004). In an analysis of anti-AMACR labeling of a prostate cancer TMA of 70 cases including "foamy" cell carcinoma with low expression of AMACR, labeling was detected in 91% percent of cases (Rubin 2004). Specificity and sensitivity were examined by quantitative receiver operator characteristic which yields an AUC was 0.9 (p<0.00001). These values are highly encouraging for the approach proposed here. It is not necessary to identify all prostate cancer cells but rather label a statistically valid sampling in order to assess, on this sample, the colocalization properties of candidate antibody biomarkers. Thus, a 91% labeling efficiency is very acceptable. We will employ the same commercial antibody and procedures as for Rubin et al. (Rubin 2004): mouse monoclonal anti-AMACR p504s (Zeta Corp., Sierra Madre, Calif.) at a starting dilution for optimization (see below) of 1:25. The optimization protocol to be used here encompasses the conditions of Rubin et al. (Rubin 2004). A major potential advantage of anti-AMACR is that the weak or absent labeling of normal epithelial components will facilitate quantification of nonspecific labeling ("noncolocalized labeling") by candidate biomarker antibodies to be developed in Phase II.
[0471] Other potential tumor epithelial cell antibodies include anti-PSMA, anti-PSA, and anti-PAP. Antibodies to these products react with epithelium of normal and malignant cells. Anti-PSMA is extensively studied, is FDA approved (clone 7E11) for radiological detection of PCa metastases, labels nearly 100% of tumors in histological sections, and consistently label tumors at greater intensity that benign prostate epithelium (Chang 2004). We will optimize the labeling of FFPE, TMAs, and frozen sections test with our quantitative IF methods can exploit this property to distinguish tumor from benign labeling in comparison to anti-AMACR and visual scoring. We will utilize a mouse monoclonal anti-human PSMA (Dako clone 3E6).
[0472] Stroma Cell Labeling.
[0473] "Stroma" as used here is a collective term consistent largely of fibroblasts, myofibroblasts and less proportion of vascular, neural, and other elements. Fibroblast and myofibroblasts labeling will be used as a reference to identify colocalization of stroma-binding candidate biomarker antibodies and to derive the ration of stroma:nonstroma labeling by the candidate antibodies. Widely accepted markers that may make suitable reference antibodies consist of anti-desmin, anti-vimentin, and smooth type α-actin and others (Castellucci 1996; Tuxhorn 2002; Ayala 2003; Tomas 2004: Ao 2006; Jiang 2007). We have previously utilized anti-desmin for the IHC analysis of prostate cancer (Stuart 2004). Considerable literature has accumulated indicating that Vimentin and smooth muscle type α-alpha vary in expression in PCa depending on the extent of epithelial-mesenchymal transformation and reactive stroma formation, two processes that correlate with aggression (Tuxhorn 2002; Ayala 2003; Hyanagisawa 2007; Yang 2008)). These phenomena appear to be proximal to the site of PCa. These markers therefore have the potential to delimit the "field" effects that are associated with differential gene expression of tumor-adjacent stroma. These observation correlate well with our observations that tumor-adjacent stroma contain numerous differentially expressed genes useful for diagnosis and for prognosis. Indeed, as noted, the mRNA levels of desmin and vimentin are significantly increased in stroma of our PCa samples compared to the epithelial components (Stuart et al. 2004). We plane, therefore, to optimize all three antibodies and determine their suitability as reference antibodies for stroma in general and tumor-adjacent stroma in particular. Previously characterized stroma reference antibodies include: anti-desmin mouse monoclonal antibody Dako clone D33 (Stuart 2004); anti-vimentin goat polyclonal sera cat. No. AB1620 from Chemicon (Temecula, Calif.) (Tuxhorn 2002); and anti-smooth muscle α-actin Dako clone IA4 (Tuxhorn 2002). For the development of stable renewable reagent sources it is highly desirable to work with monoclonal antibodies where source licensing can be organized. Therefore for anti-vimentin we will also examin mouse monoclona antibody from Dako, clone V9.
[0474] Optimization and SOP Development.
[0475] The primary antibodies will be applied using an automated immunostainer (DAKO Universal Staining System) and employing the Envision-Plus-horseradish peroxidase system (DakoCytomation, Inc.) secondary labeling system for DAB. FFPE sections will be deparaffinized by xylene overnight followed by microwave treatment and 0.4 power for 30 min. in a 6.0-pH citrate buffer. No enzymes or other "antigen retrieval" processes will be applied here or any of the labeling conditions considered here in order to minimize the variables required in developing panels of multiple antibodies with compatible protocols (Phase II). Sections will be pre-treated with normal mouse serum for 40 min. and washed in PBS with automated stirring three times. For optimization, primary antibodies will be applied at room temperature for 40 min in two-fold serial dilution from 1:30 through 1:960 or higher dilutions if practical. The optimal titre (as well as the preceding and following titre value) as judged by visual appearance (D. Mercola, F.C.A.P.) of specific labeling intensity to background labeling intensity will be re-tested on sections with increased deparaffinization steps (see IF procedure) including an over night baking step and reduced as well as extended microwaving to check for an improvement in signal to background labeling intensity. Finally, the time and temperature of application of the primary antibody will be optimized by comparing exposure to primary antibodies for 2 h and 24 h at room temperature and 24 at 4 deg. C.
[0476] These steps will be applied to both FFPE and frozen sections of fresh tissue. In the case of fresh tissue, we will utilize samples that have been cryopreserved in liquid nitrogen from the time of initial freezing. All samples for the UCI SPECS project are obtained directly from the O.R. and processed by an expedited surgical pathology grossing procedure. Sample for research are taken from tissue adjacent to the grossly identified tumor site or, for "remote" tissue control samples, taken from the contralateral prostate. Tracking sheets are maintained on all samples giving the elapsed time from the O.R. to freezing. Representative samples are used for RNA q.c. as an indication of preservation by analysis of total RNA using an Agilent Bioanalyzer which indicates high levels of preservation in over 95% of samples. Frozen sections will be prepared from these tissues directly from the frozen state without thawing. The sections will be fixed for 60 sec. in 95% methanol or 100% acetone or 70% EtOH all at -22 deg. C., air-dried, and used directly for antibody optimization.
[0477] TMA Confirmation.
[0478] Optimized labeling protocols developed on FFPE sections will be tested by application to our TMA with 272 cases including cores of tumor-adjacent and remote stroma. Labeling of the TMAs will provide information of the generality of labeling across cases and the reproducibility of specific labeling for tumor and stroma. To insure that optimization has been achieved for the TMAs, the last steps of the optimization procedure will be repeated using the TMA sections, i.e. the application of primary antibody using the three best titre values and the following steps. Progress will be monitored by visual inspection of the DAB labeled slides (D. Mercola, F.C.A.P). Optimal conditions will be judged by the most cases of the TMA that reflect the desired criteria of the greatest differential expression between target cell type with "background" intensity. All informative slides will be stored in a temperature controlled laboratory for scanning and quantitative assessment of variability, accuracy, and reproducibility assessment of Milestones 3 and 4.
[0479] Immunofluorescence.
[0480] Immunofluorescence is the intended method of choice owing to the much higher dynamic range and sensitivity of antigen detection. Indeed, we anticipate that primary antibodies can be extended to high titres by factors of 10× or more. The major challenge is selection of conditions that minimize "background" or "autofluorescence". Background fluorescence can be minimize by using fluorophores with long wavelength emission (>500 nm), use of sections with rigorous deparaffinization procedures (i.e. the overnight deparaffinzation xylene treatment and used of prolong baking of unstained FFPE sections, above), use of pretested acid washed slides and coverslipping reagents, and use of a configuration of the robotic microscope with optical filter wheel located before the monochrome CCD camera. These methods have been optimized previously (Rabinovich 2006). The characterized fluorophore-conjugated secondary antibodies to be used previously that will be applied here are: Texas Red-labeled goat anti-mouse (catalog number 115-075-146, Jackson Laboratories, Bar Harbor, Me.) and Alexa Fluor 488-labeled goat anti-mouse (catalog number A21121, Molecular Probes, Eugene, Oreg.). These reagents can be used at dilutions in the range 1:1,000 to 1:10,000. The optimum concentration will be determined for sections of our TMAs.
[0481] Visual assessment of optimum conditions require counter staining. Sections will be stained with DAPI (Molecular Probes, Eugene, Oreg.) at 75 ng/ml (in 10 mM TRIS, 10 mM EDTA, 100 mM NaCl) for 45 min prior to sealing with coverslips. Visual assessment will be carried out by J. Price and D. Mercola.
[0482] Milestone 2.
[0483] Storage and visualization will utilize exiting technology of the Vala Sciences Inc. system. All data will also be placed in a free database that is DICOM compliant.
[0484] In this project the bulk of data collection, storage, and analysis will be by the Vala Science robotic scanning microscope and associated software and storage capacity. As reviewed here (Preliminary Studies), Throra and associated software for data acquisition, analysis and storage are advanced. These are most completely described in the specialty publications of Rabinovich et al. (Rabinovich 2006) and Prignoshima et al. (Prigoshina 2007). Moreover Proveri Inc. and Vala Sciences Inc. are committed to the development of completely DICOM complaint storage and data sharing (http://www.sph.sc.edu/comd/rorden/dicom.html). The primary data of the assay proposed here, a multiplexed antibody assay utilizing indirect IF, will consist of a spectral stack of multiple color images of histological section of biopsies or postprostatectomy tissue sections together with standard hematoxylin and eosin stained sections of the same section used for IF labeling. Such images represent a novel data set for diagnosis and prognosis without direct precedent in the DICOM standard. Since Phase II is focused on product development for diagnosis and prognosis in the CLIA reference lab setting, Vala Science Inc. is very interested in developing a DICOM-compatible format for the storage and transmission of primary tissue images. It is planned to develop a demonstration format using DICOM heading and other features in analogy of other imaging systems.
Milestone 3.
[0485] SOPs Will be Developed for Specimen Collection, Processing, and Stability of the Cell Types in the Imaging Assay.
[0486] SOPs for the acquisition of tissues and blocks have been developed by the UCI SPECS program and are maintained as date pdf files and in an SOP workbook. These SOPs describe procedure for informed-consent based patient recruitment at all participating sides and methods of tissue collection at O.R rooms, expedited processing and storage together with diagrammatic illustrations of dissection procedures and additional tracking forms for each specimen. All procedures are UC11RB-approved and HIPPA-compliant. In addition the UCI SPECS program maintains "shadow charts" for all recruited patients including the signed witness informed consent, tracking sheets, and CRFs of baseline clinical data together with source documentation of all values recorded in the SPECS data base. The data base is maintained on a devoted server hosted by a participating institute, the Sidney Kimmel Cancer Center of San Diego, in a locked server room under the control of the SKCC IT department. The server is accessed remotely via a password protected web-based portal by approved clinical coordinators and the data base manager. All personnel are UCI employees. The SOPs will be incorporated into the SOPs generated for phase I of this project.
[0487] SOPs describing the optimized procedures and reagents of Milestone 1 will be developed as final conditions are determined. The methods for the fabrication of the TMAs will be included. These will include methods for periodic testing to insure stability of the labeling results. The current TMAs contain cores of fixed cultured prostate cells including standard tumor cells (LnCAP, PC3, DU145, M12) and normal immortalized cells (RWPE1, p69) will will be used to record quantified labeling intensity. Upon the completion of Milestone 1, multiple section of the TMA block containing cell cores will be prepared as a master lot for periodic qc and for standardizing new lots of renewable reagents. These procedures will be included in the SOPs.
[0488] It is a major goal of phase II to initiate a prospective validation program using newly recruited clinical patients and UCI and applying the multiplex panel to research biopsies and post surgery tissue specimens in the CLIA lab of the molecular pathology core of the UCI Department of Pathology and Laboratory Medicine. In anticipation of this study, All SOPs, master lot preparations, and DICOM-compatible image storage will be coordinated with CLIA requirements of this laboratory.
Specific Aim 1: Generation and Initial Characterization of Predictive Antibodies.
[0489] 1. Acquisition of 25 candidate antibodies against antigens identified as predictive of prostate cancer progression or recurrence based upon the preliminary studies (Section C).
[0490] 2. Western analysis and IHC analysis of 25 candidate antibodies in order to confirm cell-specific expression and specificity.
[0491] 3. Prioritize antibodies for testing on TMAs (Aim 2) based upon the intensity of cell-specific tissue labeling, the specificity as judged by the observation of predominate binding to a protein of the predicted molecular weight in Western analysis, and sensitivity as judged by percent of cells of the expected type in IHC labeled tissue sections.
Specific Aim 2: Validation of Prostate Cancer Predictive Antibodies on Tissue Microarrays (TMAs).
[0491]
[0492] 1. IHC analysis of 6-10 prioritized candidate antibodies on TMAs constructed from 254 annotated clinical prostate cancer cases. Analysis will consist of the determination of manual "immunoscores" by three pathologists.
[0493] 2. Kaplan-Meier analysis comparison of immunoscores with clinical outcomes for 5-8 candidate antibodies.
[0494] 3. Prioritize antibodies for clinical development based upon sensitivity, specificity, and accuracy as determined from the Kaplan-Meier analysis of Aim 2-2 and the magnitude of the differential expression between non-recurrent and recurrent cases. Antibodies also will be prioritized by their ability to contribute to a classifier" panel of antibodies, i.e. the minimum number of antibodies that encompass the "diversity" of the 254 cases. The measure of "encompassing diversity" will be the number of cases whose survival category is uniquely recognized by that antibody. These criteria insure the development of the smallest antibody panel necessary. Since the TMAs are fabricated from cases entirely independent of those used for MLR, confirmation of differential express here extends the generality of the biomarker antibodies and, ipso facto, extends the biomarkers to the protein level. The panel of antibodies successful at this level will represent both significant changes in tumor cell expression between recurrent and nonrecurrent cases and will include tumor microenvironment changes in between recurrent and nonrecurrent cases, a key ingredient in building a robust classifier.
Specific Aim 3: Automated and Improved Quantification of TMA Readout.
[0494]
[0495] 1. Quantify and validate the two-color separation method by (i) quantification of pixel intensity of test antibodies only at the locus pixels of specific cell types such as all epithelium or all prostate cancer as defined by cell-specific markers such as anti-cytokeratin or anti-Amacr (Aim 2-1) and (ii) validate the quantification approach by correlation with visual immunoscores. Pearson and Spearman correlation coefficients will be determined, together with probabilities of the correlation coefficients as well as the degree of relatedness (slope) of visual and quantified scores.
D. Methods
Specific Aim 1: Generation and Initial Characterization of Predictive Antibodies to Epithelial and Stroma Tumor Antigens.
[0496] Antibodies against known prostate cancer antigens and against putative prostate cancer biomarkers identified by gene expression analysis will be obtained from commercial sources and characterized using Western blotting and immunohistochemistry. Candidate antibodies that demonstrate the ability to detect discrete proteins on Western Blots prepared from fresh prostate tissue samples (stroma or tumor) and the ability to differentially label cell types in paraffin-embedded prostate cancer tissue sections will identified. Their ability to predict clinical outcome will be tested in specific aim 2.
D.1.a. Description of Antibodies
[0497] Commercial antibodies will be purchased, if available. Other antibodies will be generated (Lampire Biologicals, San Diego, Calif.). Numerous antibodies used in our separate projects have been developed in cooperation with Lampire Biologicals [50, 68-74].
Three Classes of Antibodies Will be Tested:
[0498] 1. Antibodies that label prostate tumor cells, normal epithelium, or stromal cells to be used as internal standards will be used to identify specific cell-types within prostate tissue samples. Those on hand of particular importance for the identification of epithelial components include anti-high molecular weight cytokeratin (HMW cytokeratin), anti-PSA, anti-PAP, anti-PSMA, and anti-Amacr. Those intended for the identification of stroma include anti-Desmin and anti-smooth muscle alpha actin (Anti-ACTA). We have optimized all of these for use with FFPE tissue sections and described results in previous studies [18, 67]. 2. Antibodies against potential prognostic markers identified by gene expression analysis. Twelve commercially available antibodies against predicted antigens have been obtained and screened using standard sections of FFPE prostate cancer tissue blocks. Five of these antibodies are very promising for detailed characterization as proposed here. Antibodies that are not available or exhibit poor labeling or background properties in screening will be commissioned de novo as described below. 3. The selection and screening of additional antibodies will be prioritized by starting with antibodies to gene products that exhibit the largest differential labeling (largest difference in immunoscore or normalized pixel intensity) between nonrecurrent and recurrent prostate cancer cases. As noted above, approximately half of the antibodies screened so far do exhibit excellent signal to background properties on test sections of FFPE prostate cancer. D.1.b. Criteria for Inclusion of Antibodies for TMA Analysis Will Include: Path to Monoclonal Antibody Production. 1. Antibodies are suggested by the results of MLR (Preliminary Data, Section C1). Candidate antibodies first will be vetted by Western analysis to test for the detection of antigen of correct molecular weight in prostate tumor tissue extracts or alternative molecular weights previously reported as prostate cancer-variants. Previous experience [18] has revealed that an important factor in meeting these criteria is knowledge of the origin of the antigen. The linear regression results identify probe sets of Affymetrix GeneChips which correspond to precise genes and introns of genes. Commercial antibodies against recombinant proteins or large fragments of proteins likely correspond to the identified gene product and so are useful for testing whether genes of probe sets are expressed at the protein level. Similarly, commercial antibodies against highly pure native proteins of a carefully characterized molecular weight that agrees with that expected value on the basis of the Affymetrix-predicted gene product also may be expected to be confirmed by Western analysis. However, antibodies produced against proteins purified from natural sources may contain alternative spliced products and/or other gene family member proteins as well as closely related proteins or fragments that are difficult to separate during purification may lead to antibodies reactive to a range of molecular weights with an unclear relationship to the gene product corresponding to the Affymetrix probe set. Monoclonal antibodies against recombinant or synthetic peptides more often meet the need for single gene product specificity and will be preferred. In addition monoclonal (mouse, rat) define a potentially renewable resource that may be contracted as a stable supplier of test kit reagents. Therefore, all polyclonal antibodies characterized here for inclusion on the final antibody classifier will replicated by the commissioned preparation of the corresponding monoclonal antibody as part of phase II. 2. Consistent and robust IHC signal of antigens from formalin-fixed and paraffin-embedded (FFPE) tissue. TMAs provide a major advantage in that the fraction of cases exhibiting increased or decreased IHC signal may be quantified readily. In order to develop an assay with maximum reproducibility, methods that minimize reliance on "antigen retrieval" strategies will be adopted. This will select for robust antibodies capable of recognizing antigens on archived samples. 3. Consistent and robust IHC signal of antigens from archived (>10 years) FFPE tissue. IHC labeling intensity for each antibody will be correlated with the age of the sample on the TMA. An advantage of our TMAs is the presence of cases from 2 to 19 years old. 4. Cell-specific labeling. Cell identity (normal epithelium, stroma, BPH) will be determined by manual inspection or staining with cell-specific antibodies. IHC intensity for each antibody will be immunoscored for staining intensity and cell specificity as described below (Sections D.2.c. or D.3.b.) D.1.b. Tissue Source for Western Blotting.
[0499] Tissues will be obtained from the UCI SPECS prostate project tissue bank. This is a resource of the NIH-supported UCI SPECS prostate project. Prostate samples were obtained from patients (UCI) that were preoperatively staged as having organ-confined prostate cancer. Institutional Review Board-approved informed consent for participation in this project was obtained from all patients. Tissue samples were collected in the operating room, and specimens were immediately transported to institutional pathologists who provided fresh portions of grossly identifiable or suspected tumor tissue and separate portions of uninvolved tissues that were excess to patient care needs (surgical pathology staging and confirmatory diagnosis). All excess tissue was snap frozen upon receipt and maintained in liquid nitrogen until used for frozen section preparation at -22° C. Fifty five percent of all cases collected in this series contained histologically confirmed tumor tissue. Portions of frozen samples enriched for tumor, stroma, BPH, and dilated cystic glands are identified by examination of frozen sections. When suitable tissues are identified, thick frozen sections of 20 microns are collected in separate Eppendorf tubes for lysis and Western analysis.
[0500] Additionally, the ability of antibodies to visualize antigens of correct MW on Western blots from tissue extracts established from a panel of human prostate cell lines will be determined. This panel will include androgen resistant prostate cancer cells (PC3, DU145), androgen sensitive prostate cancer cells (LnCAP), primary immortalized RWPE-1 epithelial cells. Cancer cells of alternative derivation (lung, breast, colon), and several normal cell lines (fibroblasts, myoblasts) (ATCC) (these cells have also been applied to the TMAs as sections of formalin-fixed cell pellets).
D.1.c. Western blotting
[0501] Tissues or cultured cells will be lysed in either 1× Laemmli solution lacking bromophenol blue or in RIPA buffer (0.15 mM NaCl/0.05 mM TrisHCl, pH 7.2/1% Triton X-100/1% sodium deoxycholate/0.1% sodium dodecyl sulfate) containing protease inhibitors including the caspase inhibitors 100 μM Z-Asp-2,6-dichlorobenzoyloxymethyl-ketone (Bachem) and Z-Val-Ala-Asp-fmk (Calbiochem). Total protein content will be quantified by either the Bradford or bicinchoninic acid methods (Pierce). SDS/PAGE and immunoblotting with enhanced chemiluminescence-based detection (Amersham Pharmacia) will be performed [50, 69-71].
[0502] Antibody reactivity will be semiquantified by comparison of reaction intensity of tissue and cellular extracts with extracts of prostate cancer cells (PC3, LNCaP) and negative control cells (bacterial cultures and female normal breast epithelial cells, MCF10A) of known total protein mass.
D.1.d Immunohistochemistry.
[0503] Our methods for optimization and detection of antibody labeling have been described extensively [50, 68-74]. Briefly, the cell specificity of the identified antibody for normal and malignant prostate tissue will be tested by comparing the binding patterns on a series of normal and malignant prostate tissue specimens. FFPE tissue sections (5 μm) will be deparaffinized, microwave-heated, and immunolabeled by indirect staining using either a conjugated secondary antibody for avidin-biotin complex formation with horseradish peroxidase (HRP) using the Vecta labeling reagents (Vector Laboratories) followed by addition of diaminobenzidine (DAB) for colorimetric detection or the Envision-Plus-HRP system (Dako) with a Dako Universal Staining System. A range of antibody concentrations will be tested to optimize signal detection and specificity. For all tissues examined, the immunostaining procedure will be performed in parallel by using either preimmune serum (polyclonals) to verify specificity, or the antiserum reabsorbed with 5-10 μg/ml of synthetic peptide or recombinant protein immunogen where available. Positive controls for cell-type specificity will be determined by staining sections with a "cocktail" of antibodies directed against pan-cytokeratin (Sigma) to identify epithelial cells and antibodies against Desmin, alpha-smooth muscle actin, or prolyl-4-hydroxylase to identify stromal cells
Specific Aim 2: Validation of Prostate Cancer Predictive Antibodies on Tissue Microarrays (TMAs).
[0504] Our TMAs have been constructed from archived prostate tissue samples with known clinical outcomes from SKCC and UCI. IHC staining will be performed using antibodies developed in Specific Aim 1. IHC staining levels will be immunoscored (below) and compared to clinical outcomes by Kaplan-Meier analysis. Significance of discrimination of survival groups will be determined by the Cox Proportional Hazards model.
[0505] Visual determination is carried out by three pathologists (SK, MK, and DAM) and averaged. Candidate antibodies demonstrating the greatest sensitivity, specificity, and accuracy for the prediction of clinical outcome by the Kaplan-Meier criterion will be selected for the antibody panel for prognostic validation of clinical samples in Phase II.
[0506] D2.b. Immunohistochemistry on TMAs.
[0507] Immunohistochemistry on TMAs will be performed as described previously [50, 69-71] and above (Section D.1.d.)
D.2.c. Immunoscoring of TMA Readouts
[0508] Immunoscores are determined visually and are formed as a product of the percent of a given cell type that is positive 1-100 percent) times the intensity on a three point scale yielding a range of values from 1-300 [68-70, 72, 73]. For the three-point scale intensity is j judged as 0, negative; 1+, weak; 2+, moderate; and 3+, strong [70]. Samples will be additionally scored for percentage of immunopositive malignant cells, estimating the percentage in increments of 10% (0%, 10%, 20%, 30%, and so on) from a minimum of five representative medium-power fields. The scoring will then be based on the percentage of immunopositive cells (0 to 100) multiplied by staining intensity score (0/1/2/3), yielding scores of 0 to 300. Scoring is conducted in a joint session of the three pathologists utilizing the original glass slides and a multihead microscrope in order to insure identical viewing times and field exposures. The reproducibility and agreement among pathologists following this format has been assessed [18] and immunoscoring using the above scales has been used in several studies [50, 69-71].
D.1.d. Statistical Analysis
[0509] Data will be analyzed using the JMP Statistics software package (SAS Institute, Cary, N.C.), and STATISTICA Software (StatSoft, Tulsa, Okla.). Comparisons of antibody immunostaining data with patient survival will be made using the Cox proportional hazards model and the comparison of Kaplan-Meier survival curves. An unpaired t test method was used for correlation of immunoscores with the available patient data. All statistical methods will be supervised by our biostatistician, Zhenyu Jia, consultant for Phases I and II of this project (see Biosketch, Z. Jia and letter).
[0510] Antibody performance will be judged by conventional operating characteristics (accuracy, sensitivity, and specificity) but also by criteria that produce the smallest panels that maximizes the percent of cases of the TMA accurately discriminated as aggressive or nonagressive by survival and other criteria. This is an important consideration, as a true classifier panel should contain biomarkers effective with cases that other biomarkers may be insensitive to, i.e. cover the diversity of prostate cancer. Thus, individual antibodies will be scored by the number of cases unique classified with very large or very small odds ratios that other antibodies fail to distinguish (i.e. the number of unique cases accurately classified). These criteria further insure that the minimum number of antibodies to discriminate all amendable cases of the TMA will be formed.
Specific Aim 3: Automation and Improved Quantification of TMA Readout.
[0511] The discriminatory power and the rate of characterization of the prognostic antibodies identified in Specific Aim 2 may be improved using image analysis that provides for quantitative determination of antibody labeling intensity. Rapid scanning, digitization, and the use of a newly developed algorithm for two-color separation are established at the BIMR largely as the developmental work of one of the applicants (SK). Digitized IHC labeled prostate TMA are maintain on a server located at the BIMR and accessible by all participants via a secure portal (https://scanscope.burnham.org/Login.php). This greatly facilitates the monitoring of IHC results and planning of next steps and immunoscoring sessions. UCI SPECS pathologists utilize high resolution line scanned H and E and IHC images of this site for immunoscoring of other projects and confirmed the histological features of the TMAs such as Gleason scores, presence of PIN, etc. This technology allows for automated quantification of cell-specific antibody staining of TMA samples without reliance on "shape recognition" or manual inspection to determine cell-type. This technology will be tested using the panel of prognostic antibodies developed in the first two specific aims.
Specific Aim 3: Automation and Improved Quantification of TMA Readout.
[0512] D.3.a. Double Labeling.
[0513] Double labeling places constraints on the combination of standard (anti-PSMA, anti-AMACR, and anti-cytokeratin) and candidate antibody combinations owing to the need to use secondary antibodies for the development of two different chromagens. The methods that we have previously used for double labeling (Krajewski 2007; Krajewska 2008) will be followed closely. In general candidate antibodies will be derived from rabbit sera. Indirect IHC using biotin labeled anti-rabbit IgG will be applied for development of DAB (3,3 -diaminobenzidine chromagen, DAKOCytomation; brown). Mouse monoclonal antibodies to AMACR, PSMA, or cytokeratin will be identified by addition of biotin-labeled anti-mouse for development of the black SG precipitate (Serotec; SG chromagen, Vector Lab., Inc.; black). No or very light counter staining with Nuclear Red (DAKOCytomation) will be applied
D.3.b. Validation of Prostate Cancer Predictive Antibodies on Tissue Microarrays (TMAs).
[0514] Color unmixing has been validated for sections labeled with hematoxyln and DAB (Preliminary Data). As noted, actual isolation of subsets of pixels that co-localize with epithelial or tumor cells is a milestone of Phase I. Validation will be extended to DAB and SG double labeled sections and to colocalized integrated and normalize pixel values. For this purpose it is important to note that visual scores are traditional obtained as the product of the intensity of labeling (on a 0 to 3+ scale) times the percent of tumor or epithelial cells that exhibit positive labeling. Here both factors will be used to validate co-localization. A test system utilizing a polyclonal anti-AMACR (DAB) and monoclonal anti-cytokeratin (SG) alone and in combination will be applied to both the tumor TMA and to the BPH TMA. First, analogous to the hematoxyln-DAB system, deconvolution results (reconstructed DAB image and reconstructed SG image) for the combination labeling will be compared to individual labeling (ground truth). These tests will define the accuracy as percent error +/-standard deviation for each chromagen. Second, colocalized pixel sums for AMACR labeling as a "standard" for binding to a high percentage of tumor cells will be determined. This is the sum of pixel intensity for DAB at pixels positive for SG. The pixel sum for DAB will be normalized to SG for all cases to correct for the variable amount of total epithelium on each core. The normalized sums are expected to be maximal for tumor sections where AMACR expression is commonly positive in most cells of most tumors but to exhibit minimum overlap in cases of BPH. Indeed simple thresholding may succeed defining a single value that best separates average tumor from average BPH. This may be expected since AMACR labeling will be applied based on optimization of tumor sections. Third, visual score by two pathologists (S. Krajewski and D. Mercola) will be acquired for all the single-antibody (DAB or SG) labeled TMAs. The results of spectral unmixing for DAB and SG will be compared to visual scoring for these chromagens as for the previous studies. Finally, the normalized DAB pixel sum is expected accurately correlate with the percent tumor cell component determined by the pathology and especially to correlate with the ration of percent DAB positive tumor cells over percent positive SG cytokeratin cells Thus, globally we predict:
Case average co - localization pixel sum for AMACR ( DAB ) AMACR Case average pixel sum for Cytokeratin ( SG ) Cytokeratin ~ Case average vis . % positive Case average vis . % positive ##EQU00017##
[0515] On a case by case basis plots of normalize DAB/SG vs. percent DAB positive/percent SG are predicted to have a high Pearson correlation with a slope ˜1 and error similar to the preliminary Results of <10%. Validation of spectral unmizing for this chromaphore system will provide a major milestone of Phase I and means of automated antibody biomarker screening of Phase II.
[0516] Candidate stroma biomarker antibodies will be treated in a converse fashion. Mutually exclusive pixel sums (all pixels other than cytokeratin-positive pixels) will be integrated. This guarantees that epithelial components. These values will be normalized to the nonepithelial pixel sum intensity for a trichrome stain of the TMA using a second spectral unmixing calculation to identify connective tissue component (blue).
Antibodies
[0517] We are aware that the quantification method being developed here has numerous additional standardization issues. It is entirely dependent on the properties of reference antibodies to define "cell-type". Antiamacr is in wide clinical use for the identification of prostate tumor cells in non prostate tissue in the presence of other components including glands. Nevertheless it is not unchallenged and "negative" results have been noted to occur for up to 30% of prostate cancer cells [76-81]. Thus pixels identified by these criteria may only "sample" a large proportion of tumor cells. This may be acceptable unless particular classes of tumor cells such as those expressing genes correlating with, say, rercurrence, are preferentially negative. It will be important to utilize other criteria such as visual inspection by trained pathologist and the use of other faithful tumor cell markers reveal significant bias. We have identified a large panel of genes that are preferentially expressed by prostate tumor cells [18]. In addition, standard alternatives such as antiPSA and antiPSMA may be compared to determine labeling deficiency by antiAmacr.
[0518] We have chosen to concentrate on the use of monoclonal antibodies for these studies as they generally display higher specificity and consistency compared to polyclonals and are therefore better adapted to commercialization into clinical development. Polyclonal antibodies are commercially available and might prove to be more sensitive in FFPE tissues, and therefore may be explored. Commissioned monoclonal antibodies are amenable to clear definition of ownership and path to market.
[0519] Many antibodies against prostate cancer tissues are commercially available. However, antibodies against important biomarkers that are not currently commercially available or that fail to meet quality control specified in specific aim 1 will be made using peptide antigens (Lampire Biologicals, San Diego, Calif.) as for previous studies [50, 68-74].
[0520] Finally an important challenge in Phase II will be the combining of multiple antibodies with possible individual optimization protocols to a single tissue section. If this can not be achieved conveniently, i.e. without serial application, the panel will be applied on multiple slides using 2-3 different antibodies of the panel per slide. Although less convenient, the use of two or possible three serial sections of patient biopsy tissue does materially effect the ability to derive prognosis from our predictive antibody panel.
E. BIBLIOGRAPHY
[0521] 1. Flaig, T. W., et al., Conference report and review: current status of biomarkers potentially associated with prostate cancer outcomes. J Urol, 2007. 177(4): p. 1229-37.
[0522] 2. Steuber, T., P. Helo, and H. Lilja, Circulating biomarkers for prostate cancer. World Urol, 2007. 25(2): p. 111-9.
[0523] 3. Reynolds, M. A., et al., Molecular markers for prostate cancer. Cancer Lett, 2007. 249(1): p. 5-13.
[0524] 4. Lilja, H., D. Ulmert, and A.J. Vickers, Prostate-specific antigen and prostate cancer: prediction, detection and monitoring. Nat Rev Cancer, 2008. 8(4): p. 268-78.
[0525] 5. Stephan, C., et al., PSA and new biomarkers within multivariate models to improve early detection of prostate cancer. Cancer Lett, 2007. 249(1): p. 18-29.
[0526] 6. Loeb, S, and W. J. Catalona, Prostate-specific antigen in clinical practice. Cancer Lett, 2007. 249(1): p. 30-9.
[0527] 7. Loeb, S, and W. J. Catalona, Early versus delayed intervention for prostate cancer: the case for early intervention. Nat Clin Pract Urol, 2007. 4(7): p. 348-9.
[0528] 8. Graif, T., et al., Under diagnosis and over diagnosis of prostate cancer. J Urol, 2007. 178(1): p. 88-92.
[0529] 9. Loeb, S., et al., Risk of prostate cancer for young men with a prostate specific antigen less than their age specific median. J Urol, 2007. 177(5): p. 1745-8.
[0530] 10. Steuber, T., et al., Risk assessment for biochemical rercurrence prior to radical prostatectomy: significant enhancement contributed by human glandular kallikrein 2 (hK2) and free prostate specific antigen (PSA) in men with moderate PSA-elevation in serum. Int J Cancer, 2006. 118(5): p. 1234-40.
[0531] 11. Nam, R. K., et al., Assessing individual risk for prostate cancer. J Clin Oncol, 2007. 25(24): p. 3582-8.
[0532] 12. May, M., et al., Validity of the CAPRA score to predict biochemical rercurrence-free survival after radical prostatectomy. Results from a european multicenter survey of 1,296 patients. J Urol, 2007. 178(5): p. 1957-62; discussion 1962.
[0533] 13. Bibikova, M., et al., Expression signatures that correlated with Gleason score and relapse in prostate cancer. Genomics, 2007. 89(6): p. 666-72.
[0534] 14. Henshall, S. M., et al., Survival analysis of genome-wide gene expression profiles of prostate cancers identifies new prognostic targets of disease relapse. Cancer Res, 2003. 63(14): p. 4196-203.
[0535] 15. Quinn, D. I., S. M. Henshall, and R. L. Sutherland, Molecular markers of prostate cancer outcome. Eur J Cancer, 2005. 41(6): p. 858-87.
[0536] 16. Henshall, S. M., et al., Zinc-alpha2-glycoprotein expression as a predictor of metastatic prostate cancer following radical prostatectomy. J Natl Cancer Inst, 2006. 98(19): p. 1420-4.
[0537] 17. Stephenson, R. A., et al., Metastatic model for human prostate cancer using orthotopic implantation in nude mice. Journal of the National Cancer Inst, 1992. 84: p. 951-957.
[0538] 18. Stuart, R. O., et al., In silico dissection of cell-type-associated patterns of gene expression in prostate cancer. Proc Natl Acad Sci USA, 2004. 101(2): p. 615-20.
[0539] 19. Richardson, A. M., et al., Global expression analysis of prostate cancer-associated stroma and epithelia. Diagn Mol Pathol, 2007. 16(4): p. 189-97.
[0540] 20. Stephenson, A. J., et al., Integration of gene expression profiling and clinical variables to predict prostate carcinoma rercurrence after radical prostatectomy. Cancer, 2005. 104(2): p. 290-8.
[0541] 21. Denmeade, S. R., et al., Dissociation between androgen responsiveness for malignant growth vs. expression of prostate specific differentiation markers PSA, hK2, and PSMA in human prostate cancer models. Prostate, 2003. 54(4): p. 249-57.
[0542] 22. de la Taille, A., et al., Hormone-refractory prostate cancer: a multistep and multi-event process. Prostate Cancer and Prostatic Diseases, 2001. 4: p. 204-212.
[0543] 23. Yu, X., et al., The association between total prostate specific antigen concentration and prostate specific antigen velocity. J Urol, 2007e. 177(4): p. 1298-302; discussion 1301-2.
[0544] 24. Loeb, S., et al., Use of prostate-specific antigen velocity to follow up patients with isolated high-grade prostatic intraepithelial neoplasia on prostate biopsy. Urology, 2007. 69(1): p. 108-12.
[0545] 25. Loeb, S., et al., Prostate specific antigen velocity threshold for predicting prostate cancer in young men. J Urol, 2007. 177(3): p. 899-902.
[0546] 26. Gong, M. C., et al., Prostate-specific membrane antigen (PSMA)-specific monoclonal antibodies in the treatment of prostate and other cancers. Cancer Metastasis Rev, 1999. 18(4): p. 483-90.
[0547] 27. Elgamal, A. A., et al., Prostate-specific membrane antigen (PSMA): current benefits and future value. Semin Surg Oncol, 2000. 18(1): p. 10-6.
[0548] 28. Recker, F., et al., Human glandular kallikrein as a tool to improve discrimination of poorly differentiated and non-organ-confined prostate cancer compared with prostate-specific antigen. Urology, 2000. 55(4): p. 481-5.
[0549] 29. Raaijmakers, R., et al., hK2 and Free PSA, a Prognostic Combination in Predicting Minimal Prostate Cancer in Screen-Detected Men within the PSA Range 4-10 ng/ml. Eur Urol, 2007.
[0550] 30. Paliouras, M., C. Borgono, and E. P. Diamandis, Human tissue kallikreins: the cancer biomarker family. Cancer Lett, 2007. 249(1): p. 61-79.
[0551] 31. Nam, R. K., et al., Variants of the hK2 protein gene (KLK2) are associated with serum hK2 levels and predict the presence of prostate cancer at biopsy. Clin Cancer Res, 2006. 12(21): p. 6452-8.
[0552] 32. Diamandis, E. P. and G. M. Yourself, Human tissue kallikreins: a family of new cancer biomarkers. Clin Chem, 2002. 48(8): p. 1198-205.
[0553] 33. Perambakam, S., et al., Induction of Tc2 cells with specificity for prostate-specific antigen from patients with hormone-refractory prostate cancer. Cancer Immunol Immunother, 2002. 51(5): p. 263-70.
[0554] 34. McDevitt, M. R., et al., An alpha-particle emitting antibody ([213Bi]J591) for radioimmunotherapy of prostate cancer. Cancer Res, 2000. 60(21): p. 6095-100.
[0555] 35. Steuber, T., et al., Free PSA isoforms and intact and cleaved forms of urokinase plasminogen activator receptor in serum improve selection of patients for prostate cancer biopsy. Int J Cancer, 2007. 120(7): p. 1499-504.
[0556] 36. Wang, X., et al., Autoantibody signatures in prostate cancer. N Engl J Med, 2005. 353(12): p. 1224-35.
[0557] 37. Stephan, C., et al., Three new serum markers for prostate cancer detection within a percent free PSA-based artificial neural network. Prostate, 2006. 66(6): p. 651-9.
[0558] 38. Miyake, H., I. Hara, and H. Eto, Prediction of the extent of prostate cancer by the combined use of systematic biopsy and serum level of cathepsin D. Int J Urol, 2003. 10(4): p. 196-200.
[0559] 39. Leman, E. S., et al., EPCA-2: a highly specific serum marker for prostate cancer. Urology, 2007. 69(4): p. 714-20.
[0560] 40. Jiang, Z., et al., Discovery and clinical application of a novel prostate cancer marker: alpha-methylacyl CoA racemase (P504S). Am J Clin Pathol, 2004. 122(2): p. 275-89.
[0561] 41. Hara, I., et al., Serum cathepsin D and its density in men with prostate cancer as new predictors of disease progression. Oncol Rep, 2002. 9(6): p. 1379-83.
[0562] 42. Bradford, T. J., X. Wang, and A. M. Chinnaiyan, Cancer immunomics: using autoantibody signatures in the early detection of prostate cancer. Urol Oncol, 2006. 24(3): p. 237-42.
[0563] 43. Wang, Y., et al., The challenge of developing predictive signatures for the outcome of newly diagnosed prostate cancer based on expression analysis and genetic changes of tumro and non-tumor cells, in 2007 American Association for Cancer Research Annual Meeting. 2007: Los Angeles, Calif.
[0564] 44. Koziol, J. A., et al., The Wisdom of the Commons: Ensemble Tree Classifiers for Prostate Cancer Prognosis. Bioinformatics, 2008.
[0565] 45. Datta, M. W., et al., The role of tissue microarrays in prostate cancer biomarker discovery. Adv Anat Pathol, 2007. 14(6): p. 408-18.
[0566] 46. Diallo, J. S., et al., NOXA and PUMA expression add to clinical markers in predicting biochemical rercurrence of prostate cancer patients in a survival tree model. Clin Cancer Res, 2007. 13(23): p. 7044-52.
[0567] 47. McDonnell, T. J., et al., Biomarker expression patterns that correlate with high grade features in treatment naive, organ-confined prostate cancer. BMC Med Genomics, 2008. 1: p. 1.
[0568] 48. Prowatke, I., et al., Expression analysis of imbalanced genes in prostate carcinoma using tissue microarrays. Br J Cancer, 2007. 96(1): p. 82-8.
[0569] 49. Ayala, G. E., et al., Stromal antiapoptotic paracrine loop in perineural invasion of prostatic carcinoma. Cancer Res, 2006. 66(10): p. 5159-64.
[0570] 50. Krajewska, M., et al., Claudin-1 immunohistochemistry for distinguishing malignant from benign epithelial lesions of prostate. Prostate, 2007. 67(9): p. 907-10.
[0571] 51. Tuxhorn, J. A., et al., Reactive stroma in human prostate cancer: induction of myofibroblast phenotype and extracellular matrix remodeling. Clin Cancer Res, 2002. 8(9): p. 2912-23.
[0572] 52. Rowley, D. R., What might a stromal response mean to prostate cancer progression?Cancer Metastasis Rev, 1998. 17(4): p. 411-9.
[0573] 53. Wang, Y., et al., Sex hormone-induced carcinogenesis in Rb-deficient prostate tissue. Cancer Res, 2000. 60(21): p. 6008-17.
[0574] 54. Tuxhorn, J. A., G. E. Ayala, and D. R. Rowley, Reactive stroma in prostate cancer progression. J Urol, 2001. 166(6): p. 2472-83.
[0575] 55. van der Heul-Nieuwenhuijsen, L., et al., Gene expression profiling of the human prostate zones. BJU Int, 2006. 98(4): p. 886-97.
[0576] 56. Pflug, B. R., R. E. Reiter, and J. B. Nelson, Caveolin expression is decreased following androgen deprivation in human prostate cancer cell lines. Prostate, 1999. 40(4): p. 269-73.
[0577] 57. Xin, W., et al., Dysregulation of the annexin family protein family is associated with prostate cancer progression. Am J Pathol, 2003. 162(1): p. 255-61.
[0578] 58. Haywood-Reid, P. L., D. R. Zipf, and W.R. Springer, Quantification of integrin subunits on human prostatic cell lines--comparison of nontumorigenic and tumorigenic lines. Prostate, 1997. 31(1): p. 1-8.
[0579] 59. Bae, I., et al., BRCA1 regulates gene expression for orderly mitotic progression. Cell Cycle, 2005. 4(11): p. 1641-66.
[0580] 60. Sahadevan, K., et al., Selective over-expression of fibroblast growth factor receptors 1 and 4 in clinical prostate cancer. J Pathol, 2007. 213(1): p. 82-90.
[0581] 61. Rhodes, D. R., et al., Meta-analysis of microarrays: interstudy validation of gene expression profiles reveals pathway dysregulation in prostate cancer. Cancer Res, 2002. 62(15): p. 4427-33.
[0582] 62. Warnat, P., R. Eils, and B. Brors, Cross-platform analysis of cancer microarray data improves gene expression based classification of phenotypes. BMC Bioinformatics, 2005. 6: p. 265.
[0583] 63. Yang, H. P., et al., Genetic variation in interleukin 8 and its receptor genes and its influence on the risk and prognosis of prostate cancer among Finnish men in a large cancer prevention trial. Eur J Cancer Prey, 2006. 15(3): p. 249-53.
[0584] 64. DeConde, R. P., et al., Combining results of microarray experiments: a rank aggregation approach. Stat Appl Genet Mol Biol, 2006. 5: p. Article 15.
[0585] 65. Rodriguez-Canales, J., et al., Identification of a unique epigenetic sub-microenvironment in prostate cancer. J Pathol, 2007. 211(4): p. 410-9.
[0586] 66. Ruifrok, A. C. and D. A. Johnston, Quantification of histochemical staining by color deconvolution. Anal Quant Cytol Histol, 2001. 23(4): p. 291-9.
[0587] 67. Krajewska, M., Shinichi Kitada, Jane N. Winter, Daina Variakojis, Alan Lichtenstein, Dayong Zhai, Michael Cuddy, Xianshu Huang, Frederic Luciano, Cheryl H. Baker, Hoguen Kim6, Eunah Shin7, Susan Kennedy, Allen H. Olson, Andrzej Badzio, Jacek Jassem, Ivo Meinhold-Heerlein, Michael J. Duffy, Aaron D. Schimmer, Ming Tsao3, Ewan Brown, Anne Sawyers, Michael Andreeff1, Dan Mercola, Stan Krajewski and John C. Reed., Bcl-B Expression in Human Epithelial and Nonepithelial Malignancies Clinical Cancer Research, 2008. 14: p. 3011-3021.
[0588] 68. Krajewska, M., et al., Analysis of apoptosis protein expression in early-stage colorectal cancer suggests opportunities for new prognostic biomarkers. Clin Cancer Res, 2005b 11(15): p. 5451-61.
[0589] 69. Krajewska, M., et al., Tumor-associated alterations in caspase-14 expression in epithelial malignancies. Clin Cancer Res, 2005a. 11(15): p. 5462-71.
[0590] 70. Turner, B. C., et al., BAG-1: a novel biomarker predicting long-term survival in early-stage breast cancer. J Clin Oncol, 2001. 19(4): p. 992-1000.
[0591] 71. Krajewski, S., et al., Release of caspase-9 from mitochondria during neuronal apoptosis and cerebral ischemia. Proc Natl Acad Sci USA, 1999. 96(10): p. 5752-7.
[0592] 72. Rabinovich, A., et al., Framework for parsing, visualizing and scoring tissue microarray images. IEEE Trans Inf Technol Biomed, 2006. 10(2): p. 209-19.
[0593] 73. Krajewska, M., et al., Expression of BAG-1 protein correlates with aggressive behavior of prostate cancers. Prostate, 2006. 66(8): p. 801-10.
[0594] 74. Meinhold-Heerlein, I., et al., Expression and potential role of Fas-associated phosphatase-1 in ovarian cancer. Am J Pathol, 2001. 158(4): p. 1335-44.
[0595] 75. Ahlering, T. E. and D. W. Skarecky, Long-term outcome of detectable PSA levels after radical prostatectomy. Prostate Cancer Prostatic Dis, 2005. 8(2): p. 163-6.
[0596] 76. Adley, B. P. and X. J. Yang, Application of alpha-methylacyl coenzyme A racemase immunohistochemistry in the diagnosis of prostate cancer: a review. Anal Quant Cytol Histol, 2006. 28(1): p. 1-13.
[0597] 77. Hameed, O., J. Sublett, and P. A. Humphrey, Immunohistochemical stains for p63 and alpha-methylacyl-CoA racemase, versus a cocktail comprising both, in the diagnosis of prostatic carcinoma: a comparison of the immunohistochemical staining of 430 foci in radical prostatectomy and needle biopsy tissues. Am J Surg Pathol, 2005. 29(5): p. 579-87.
[0598] 78. Herawi, M. and J. I. Epstein, Specialized stromal tumors of the prostate: a clinicopathologic study of 50 cases. Am J Surg Pathol, 2006. 30(6): p. 694-704.
[0599] 79. Epstein, J. I. and M. Herawi, Prostate needle biopsies containing prostatic intraepithelial neoplasia or atypical foci suspicious for carcinoma: implications for patient care. J Urol, 2006. 175(3 Pt 1): p. 820-34.
[0600] 80. Gonzalgo, M. L., et al., Relationship between primary Gleason pattern on needle biopsy and clinicopathologic outcomes among men with Gleason score 7 adenocarcinoma of the prostate. Urology, 2006. 67(1): p. 115-9.
[0601] 81. Varma, M. and B. Jasani, Diagnostic utility of immunohistochemistry in morphologically difficult prostate cancer: review of current literature. Histopathology, 2005. 47(1): p. 1-16.
[0602] 82. Rimm, D. L., et al., Tissue microarray: a new technology for amplification of tissue resources
. Cancer J, 2001. 7(1): p. 24-31.
[0603] 83. Camp, R. L., G. G. Chung, and D. L. Rimm, Automated subcellular localization and quantification of protein expression in tissue microarrays. Nat Med, 2002. 8(11): p. 1323-7.
[0604] 84. Rubin, M. A., et al., Quantitative determination of expression of the prostate cancer protein alpha-methylacyl-CoA racemase using automated quantitative analysis (AQUA): a novel paradigm for automated and continuous biomarker measurements. Am J Pathol, 2004. 164(3): p. 831-40.
[0605] 85. Prigozhina, N. L., et al., Plasma membrane assays and three-compartment image cytometry for high content screening. Assay Drug Dev Technol, 2007. 5(1): p. 29-48.
[0606] 86. Mikic, I., et al., A live cell, image-based approach to understanding the enzymology and pharmacology of 2-bromopalmitate and palmitoylation. Methods Enzymol, 2006. 414: p. 150-87.
Example 9
Conversion of a Novel RNA-Based Prognostic Test for Prostate Cancer into a Clinical Assay
[0607] A. Specific Aims.
[0608] Nomograms are sets of clinical parameters that are used to estimate the risk of prostate cancer recurrence [1, 2]. We propose to improve on the current nomograms by including predictions based on gene expression.
[0609] We have used a novel strategy to identify and validate genes whose expression correlates with prostate cancer progression in either tumor tissue or in stroma near to tumor, across multiple independent microarray datasets. We will convert this set of expression differences into a clinical assay. Our proposed strategy involves monitoring a panel of RNAs, including some RNAs that predict the risk of disease recurrence, some RNAs for housekeeping genes (internal controls), and some RNAs that are used to determine the tissue composition of a prostate sample (tumor, stroma, BPH). The inclusion of RNAs to monitor tissue percentage allows only suitable prognostic markers to be monitored in each sample; those prognostic markers that are directed towards the primary tissue in that particular sample.
[0610] We will use an RNA detection strategy (QuantiGene Plex 2.0) that works on both fresh frozen and FFPE samples, and that can accurately monitor up to 36 different RNAs, simultaneously. The assay runs on the FDA-approved Luminex platform, already used in clinical labs. We will first screen our candidate RNAs for those that perform well on this platform using RNA from fresh frozen samples with known microarray expression patterns. Panels will then be applied to 150 tumor-enriched FFPE samples and 150 stroma-enriched (near to tumor), from prostate cancer patients, with up to two decades of clinical history. The best performing subset of genes will be assembled into two panels for clinical use, one for use in stroma-enriched samples, and the other to be used in tumor-enriched samples.
[0611] The long-term goal is to validate the classifiers in a prospective study on newly recruited prostatectomy samples.
[0612] B. Background and Significance.
[0613] Cancer and the Need for Prognostic Markers.
[0614] Prostate cancer is the most common malignancy of males in the United States [3]. Patients newly diagnosed with advanced prostate cancer that do not yet have evidence of metastases are generally advised to submit to invasive therapies such as radical prostatectomy or radiation treatment. However, the majority of prostate cancers are a slow growing indolent form with a low risk of mortality. Patients with early stage disease and extremely favorable nomogram scores, suggesting indolence of the cancer, can instead opt for intensive vigilance. We propose the development of a gene-expression-based clinical test that makes a differential prognostic prediction between indolent and aggressive forms of prostate cancer. This test would provide an additional key aid to prostate cancer patients, and doctors, in making their treatment decisions, and will be particularly useful for those patients that are not at the extremes of the current nomogram scoring systems [1, 2].
[0615] While other studies to detect RNA-based prognosticators for prostate cancer have been performed, they have limited agreement with each other, and very limited overlap with prognosticators found by other methods [4-7]. We have developed a different method that identifies prognostic markers and we have cross-validated them across different data sets (detailed below). We now propose to convert a panel of these prognosticators into a useful clinical assay. We will use the QuantiGene Plex 2.0 Assay (Panomics, Inc., Fremont, Calif.), which is as sensitive as real time PCR but can be much more extensively multiplexed [8, 9]. The assay can detect up to 36 targets per well. The assay is based on the branched DNA (bDNA) technology, which amplifies signal directly from captured target RNA without purification or reverse transcription. RNA quantitation is performed directly from fresh frozen tissue or from formalin-fixed, paraffin-embedded (FFPE) tissue homogenates, and is relatively insensitive to RNA degradation and to chemical modifications introduced by formalin-fixation [10, 11]. The method is already in the FDA-approved clinical diagnostic VERSANT 3.0 assays for HIV, HCV and HBV viral load [12] and has been used in biomarker discovery, secondary screening, microarray validation, quantification of RNAi knockdowns and predictive toxicology [11, 13-15].
[0616] C. Preliminary Studies.
[0617] The key to this project is the set of genes that we will put into the prognostic assay. We describe how we obtained these genes in some detail here.
[0618] We previously developed methods to determine the genes preferentially expressed by the three major cell types of tumor-bearing prostate tissue: tumor epithelial cells, benign epithelial cells (BPH) and stromal cells [16]. We have now extended this method so that we can now identify transcription changes that correlate with early cancer recurrence in one or more of these three cell types. In addition to transcription changes in tumor cells that correlate with recurrence, we find that prognostic changes also occur in stroma near to tumor but not in BPH. We have validated a subset of these new recurrence-related genes using independent publicly available microarray data sets. Table 31 summarizes the data sets we have analyzed from various sources, including our own prostatectomy samples.
TABLE-US-00033 TABLE 31 Prostate cancer expression microarray data sets Data Array Non- Sets platform Targets Recurrent Recurrent Reference 1 U133Plus2 54,675 27 38 Our unpublished data 2 U133A 22,283 30 26 Our unpublished data 3 Illumina 511 18 63 [4] 4 U133A 22,283 29 42 [7] 5 U95Av2 12,626 8 13 [6] 6 U95Av2 12,626 9 14 [5]
[0619] Identification of Cell-Specific Genes.
[0620] Most previous experiments to determine expression profiles of solid tumors using microarrays involved "enriched" tumor fractions. There are three limitations of this strategy. First, samples vary in purity, introducing an error due to various amounts of accompanying tissue types. Second, the change in gene expression of other cell types is subsumed in a single number, obscuring the unique profiles of these accompanying cell types. Third, substantial amounts of stroma are intrinsic to the structure of nearly all prostate tumors. We devised a method for the deconvolution of average cell-specific gene expression from a set of samples containing different mixtures of cell types [16]. Estimates of the amount of three major cell types were made: tumor epithelial cells (tumor, T), epithelium of benign prostatic hyperplasia (BPH, B), and stromal cells (S, including pooled smooth muscle, connective tissue, infiltrating immune cells, and vascular elements). The amount of mRNA (Affymetrix signal intensity, Gij) from a given gene is the sum of the amount of each cell type multiplied by the intrinsic expression, A, of that gene by the given cell type:
Gij=βBPH,jxBPH,i+βT,jxT,i+βS,jxS,i+εij (1)
where Xi is the proportion of each cell type and ε is the error. The model identified hundreds of genes significantly more expressed in only one tissue and examples were validated by laser capture micro-dissection and immunohistochemistry [16].
[0621] In Silico Estimates of Tissue Percentages.
[0622] Estimates of tissue percentages made by pathologists for all the samples in data set 1, 2 and 3 allowed identification of individual transcript levels that correlated best with tissue percentage. The expression levels of each of these overlapping genes were fitted to a simple linear model for each tissue type and were ranked by their correlation coefficient. A subset of the top genes from one data set was subsequently used to predict tissue percentage in the other data set. The Pearson correlation coefficients between predicted cell type percentage (tumor, stroma and BPH cells) and pathologist's estimates for all pairwise predictions of the three data sets range from 0.45-0.87 (p<0.001 in all comparisons).
[0623] Estimation of cell type percentage proved to be highly relevant. In data set 4, recurrent cases had a systematically higher percentage of tumor tissue than non-recurrent cases. Unless recognized and taken into account, this skew would generate false expression-derived estimates regarding recurrence.
[0624] Identification of Cell-Specific Biomarkers of Aggressive Prostate Cancer.
[0625] We have now extended equation 1 to identify genes specific to cell-type and aggression, for cases with known follow-up history. To obtain cell-specific gene expression for both recurrent and non-recurrent cases, the summation of equation 1 is simply segregated to reserve terms with βj coefficients for non-recurrent cases and denoting recurrent cases (rs) at the end with a separate coefficient, γ
Gij=(βBPH,jxBPH,i+βT,jxT,i+β.sub- .S,jxS,i)+rs(γBPH,jxBPH,i+γT,jxT,i+.g- amma.S,jxS,i)+εij (2)
[0626] Multiple linear regression (MLR) analysis was carried out leading to the calculation of all βj, all γj, and their associated t-statistic values. Thus, estimates of the intrinsic expression of three cell types (T, S and BPH) for non-recurrent and recurrent prostate cancer were derived.
[0627] In data set 1 (U133Plus2.0 array), for example, 928 differentially regulated genes were identified in early recurrent cancer types at an adjusted p value of less than 0.05, including 405 tumor- and 561 stroma-related prognostic genes. In both data sets 1 and 2, the most significant changes were observed in the stromal tissue portion of specimens that were from near tumor (reactive stroma). The ability to look for changes in expression in stroma during recurrence is one of the major advantages of our approach.
[0628] Confirmation of Prognostic Genes using Independent Data Sets (Cross-Validation).
[0629] The six available expression microarray data sets with information on prostate cancer recurrence (Table 31) allowed identification of that subset of candidate prognosticators that could be validated. We filtered all sets for γ with p<0.05; then mapped identical Affymetrix probes (data set 1, 2, 4, 5 and 6) or gene symbol (data set 2). Finally, we identified genes that occurred in both compared data sets, and showed the same direction of change in differential expression between recurrent and non-recurring samples. Overall, 152 of 185 (82.2%) genes were concordant across pairs of data sets (p<10-18). About one third of the 152 concordant genes correspond to those previously reported by others as related to outcome in prostate cancer. About a quarter may be in error (false discovery rate given that 31 of 185 were not concordant). Some sets of genes are functionally related to biological processes considered important in the progression of prostate cancer, exemplified by several members of the Wnt signal transduction pathway.
[0630] The enormous tissue percentage diversity among published data sets (all "tumor enriched" sets had some samples with less than 30% tumor, according to our in silico analysis) and a frequent bias in tumor percentages between recurrent and non-recurrent cases (leading to any tumor-specific gene being erroneously associated with recurrence) provides two explanations for the previous struggle of the community to find a valid recurrence-specific signature in any one data set.
[0631] Gene Expression Quantification Using the QuantiGene Plex 2.0 Assay.
[0632] We have tested the sensitivity and the technical and biological accuracy of the assay using a panel of genes in a 10-Plex. The ten-gene panel included two housekeeping genes and eight genes with cell type percentage predictive power for prostate tumor, stroma, and BPH. The assay was performed on 12 fresh frozen prostate cancer samples and 9 FPEE samples with various amounts of tumor, stroma, and BPH.
[0633] A standard curve for the housekeeping gene ribosomal protein S20 proved that the Plex 2.0 assay is highly reproducible and sensitive with a wide dynamic range (not shown).
[0634] Transcripts for all ten genes were accurately measured over a wide dynamic range when the template amount was over 33 ng. The gene expression levels for all eight tissue-specific genes detected by either the P1ex 2.0 assay, or the Affymetrix U133P2 array using the same RNA samples, had correlation coefficients ranging from 0.64 to 0.89. Moreover, all eight tissue-enriched genes showed good correlations with their respective cell type percentages in FFPE samples. These preliminary experiments demonstrate that the Plex 2.0 assay is a very sensitive and reproducible method, consistent with microarray data.
[0635] D. Research Design and Methods.
[0636] The thousands of tissue specific genes and over 150 candidate prognostic genes that we have identified will vary in their practical usefulness. Furthermore, not all of these genes will translate to a particular assay platform, due to circumstances such as splicing variants that may not behave identically. This project will find a subset of high performance genes for our chosen assay strategy, gleaned from among the many high-confidence candidate genes we have identified.
[0637] We will convert the gene markers into an assay that can be easily adapted in a clinical lab, using the Plex 2.0 assay on FFPE samples (no RNA extraction or reverse transcription required). For probe validation, assays will be performed on 24 total RNA samples which already have previously reported microarray data. Probes that correlate best with the microarray data will be used to analyze 150 FFPE samples with annotated recurrence status (over a decade of post-surgery follow-up in most cases). A classifier that can distinguish indolent and/or aggressive cases will be developed and outcome prediction accuracy will be estimated by cross-validation.
[0638] Step 1. Select Candidate Genes for Further Validation.
[0639] We have selected a list of gene biomarkers for further analysis, including 75 prognostic marker genes from our studies and 25 that are found in at least one of our datasets and in the literature, 30 tissue component prediction genes, and 4 housekeeping genes which represent relatively low, medium and high expression levels.
[0640] Step 2. QuantiGene Plex Assay Probe Design and Validation.
[0641] Frozen Tissue Samples.
[0642] 24 total RNA samples that already have Affymetrix gene expression data will be used in the Plex 2.0 assay. The RNA samples will be selected to encompass a wide range of tissue percentages and equal numbers of non-recurrent and recurrent cases. Probes of the Plex 2.0 assay will be designed by Panomics. Each panel of the Plex 2.0 assay will contain up to 36 genes. We will test four panels, totaling 130 or more candidate genes. The assay will be performed using our Bio-Plex system which relies on FACS sorting of fluorescently encoded beads.
[0643] Selection of Genes for Future Use.
[0644] Genes that show significant correlation between the Plex assay and Affymetrix assay will be kept for further analysis. Genes with very low signal or low variance in these assays will be eliminated from further analysis. We will combine the top performing genes into three panels (36 genes per panel) for further study. If necessary, more potentially useful prognostic or tissue-enriched transcripts will be screened.
[0645] Step 3. Develop Classifiers for Recurrence Prediction.
[0646] FFPE Samples.
[0647] We will acquire a set of 150 archived prostate cancer samples from the SPECS study for validation. Two samples will be selected from each block. One will be tumor-enriched (>70% tumor cells) and the other stroma-enriched (>70% stroma cells near to tumor: "Reactive stroma") as estimated by pathologists. These blocks have 8-20 years of associated clinical data and represent a range of overall survival and time to recurrence. Gleason scores range from 5-8. Samples will be coded for blind analysis. Plex 2.0 Assays will be performed on the three panels of above selected genes.
[0648] Outcome Prediction.
[0649] We will first use a subset of the samples with the pathologists' estimates of cell type percentages to develop linear models of cell type component prediction. Cell type percentages of the remaining samples will be estimated using these linear models and the most predictive markers will be identified to be retained in the ultimate clinical assay.
[0650] Samples will be divided into tumor-enriched samples, stroma-enriched samples. Those samples that prove not to be suitably enriched will be set aside. We will use the appropriate tissue-enriched samples to develop classifiers that distinguish aggressive and indolent cancers using Prediction Analysis for Microarrays (PAM) [17] and Support Vector Machine (SVM) [18, 19] approaches. Misclassification error will be estimated by the 10-fold cross-validation or the leave one out strategy. These tools will be implemented in R (http://www.r-project.org/). Two classifiers will be developed, one for tumor-enriched samples and one for stroma-enriched samples.
[0651] We will also attempt in silico correction of transcript levels based on the tissue percentage markers present in each multiplex. We will attempt to adjust signals to reflect the tissue percentages by simple linear regression and determine if this variable improves disease outcome prediction.
[0652] Pre- and post operation PSA, pathology T stage, and Gleason scores are available for all cases. Thus, using these parameters plus our RNA-based classifier, the nomogram-predicted disease free survival can be calculated.
[0653] Final Predictive Set.
[0654] The initial four panels of up to 36 genes, each, will be reduced to three panels after initial screening. Then these three panels used in the FFPE study will be further condensed into just two panels that contain only useful genes for tissue percentage estimation and for prognosis: one panel for stroma-enriched samples and one for tumor-enriched samples. Both panels will measure up to 10 RNAs for estimating tissue percentage, 25 RNAs for prognosis, and 3 or more housekeeping controls.
[0655] Further Studies.
[0656] Application to Biopsies.
[0657] We have found biopsies to be an excellent source of RNA. If any stroma biomarkers are associated with recurrence, we will test the Plex 2.0 assay on 10 of our hundreds of snap frozen biopsy samples to determine technical feasibility. It is possible that biopsies that are negative for cancer may still have regions that are close enough to the missed tumor that they show "reactive" gene changes. This would revolutionize the assessment of patients that are negative for cancer upon biopsy.
[0658] More Sophisticated Class Prediction Algorithms.
[0659] In this project, we propose to use in silico cell type composition prediction to estimate tumor percentages only for sample quality control. However, knowledge of tissue composition opens up opportunities for many intellectual advances in data analysis. We are developing a new classification method which takes advantage of cell composition information without rejecting any high quality data, and results in better performance than PAM and SVM-based predictions [20].
[0660] Signaling Pathway Analysis for Understanding Prostate Cancer Progression.
[0661] Our preliminary study on pathway analysis shows that our newly identified predictive markers for recurrence are significantly enriched for elements involved in cancer related pathways, exemplified by the Wnt signaling pathway. One of our long term goals is to explore the mechanisms of cancer-related pathways that are cross-validated in multiple data sets using tools such as DAVID (The Database for Annotation, Visualization and Integrated Discovery) [21, 22]. These pathways are potential targets for novel therapeutic treatment.
[0662] 1. Unique in Silico Tissue Composition Prediction Strategy Based on Gene Expression Profiling.
[0663] Large variations in the proportion of tissue components in prostate cancer tissue samples lead to considerable noise and even misleading results in mining microarrays data for prognosticators. We have generated and validated linear models for tissue component estimations based on gene expression levels. Lists of 10˜20 genes that define tumor, stroma and BPH tissue, allow the proportion of each of these tissues to be determined from gene expression profiles, alone. This novel approach of in silico tissue component prediction will be used for quality control by determining the major cell components in each clinical RNA sample.
[0664] 2. Unique Prognostic Gene Biomarkers.
[0665] Using a multiple linear regression model which integrates tissue component percentages, we have identified a list of tumor- and reactive stroma-associated prognostic biomarkers, which can distinguish indolent and aggressive prostate cancer. Markers were then cross-validated between different microarray data sets produced by different research groups. Most of these prognostic markers were not previously identified by other studies. This is a simple and yet novel approach to find better, more precise, prognosticators for disease progression.
[0666] 3. Accurate and Sensitive Multiple Gene Expression Quantitation.
[0667] A single prostate cancer prognostic marker is unlikely to be able to classify patients. Instead, a group of markers will be needed to account for the genetic variability of patients and the variability in cancer progression. The QuantiGene Plex 2.0 assay (Panomics, Inc) allows simultaneous quantification of multiple RNA targets directly from tissue homogenates. The assay does not require RNA purification, reverse transcription, or target amplification, because it combines branched DNA (bDNA) signal amplification technology and xMAP® (multi-analyte profiling) beads. The assay uses the FDA approved Luminex system already found in clinical labs.
[0668] Our data prove the accuracy and sensitivity of the assay, and the ability to predict tissue proportions in FFPE samples. We will convert a large number of previously identified and successfully cross-validated prognostic genes into the QuantiGene assay system that can then be easily adopted by clinical labs. The QuantiGene assay gene panel will be tested on our large collection of FFPE samples that have up to decades of patient data after surgery.
REFERENCES
[0669] 1. Han, W. D., et al., Up-regulation of LRP16 mRNA by 17beta-estradiol through activation of estrogen receptor alpha (ERalpha), but not ERbeta, and promotion of human breast cancer MCF-7 cell proliferation: a preliminary report. Endocr Relat Cancer, 2003. 10(2): p. 217-24.
[0670] 2. Kattan, M. W., T. M. Wheeler, and P. T. Scardino, Postoperative nomogram for disease recurrence after radical prostatectomy for prostate cancer. J Clin Oncol, 1999. 17(5): p. 1499-507.
[0671] 3. Reis, L., Eisner, M., Kosary, C., Hankey, B., Miller, B., Clegg, L., Edwards, B., SEER Cancer Statistics Review, 1973-1999. book, National Institutes of Health, Betheda, Md., 2002 (2002).
[0672] 4. Bibikova, M., et al., Expression signatures that correlated with Gleason score and relapse in prostate cancer. Genomics, 2007. 89(6): p. 666-72.
[0673] 5. LaTulippe, E., et al., Comprehensive gene expression analysis of prostate cancer reveals distinct transcriptional programs associated with metastatic disease. Cancer Res, 2002. 62(15): p. 4499-506.
[0674] 6. Singh, D., et al., Gene expression correlates of clinical prostate cancer behavior. Cancer Cell, 2002. 1(2): p. 203-9.
[0675] 7. Stephenson, A. J., et al., Integration of gene expression profiling and clinical variables to predict prostate carcinoma recurrence after radical prostatectomy. Cancer, 2005. 104(2): p. 290-8.
[0676] 8. Arikawa, E., et al., Cross-platform comparison of SYBR Green real-time PCR with TaqMan PCR, microarrays and other gene expression measurement technologies evaluated in the MicroArray Quality Control (MAQC) study. BMC Genomics, 2008. 9: p. 328.
[0677] 9. Canales, R. D., et al., Evaluation of DNA microarray results with quantitative gene expression platforms. Nat Biotechnol, 2006. 24(9): p. 1115-22.
[0678] 10. Beer, D. G., et al., Gene-expression profiles predict survival of patients with lung adenocarcinoma. Nat Med, 2002. 8(8): p. 816-24.
[0679] 11. Knudsen, B. S., et al., Evaluation of the branched-chain DNA assay for measurement of RNA in formalin-fixed tissues. J Mol Diagn, 2008. 10(2): p. 169-76.
[0680] 12. Elbeik, T., et al., Multicenter evaluation of the performance characteristics of the bayer VERSANT HCV RNA 3.0 assay (bDNA). J Clin Microbiol, 2004. 42(2): p. 563-9.
[0681] 13. Calcagno, A. M., et al., Single-step doxorubicin-selected cancer cells overexpress the ABCG2 drug transporter through epigenetic changes. Br J Cancer, 2008. 98(9): p. 1515-24.
[0682] 14. John, M., et al., Effective RNAi-mediated gene silencing without interruption of the endogenous microRNA pathway. Nature, 2007. 449(7163): p. 745-7.
[0683] 15. Yang, W., et al., Direct quantification of gene expression in homogenates of formalin-fixed, paraffin-embedded tissues. Biotechniques, 2006. 40(4): p. 481-6.
[0684] 16. Stuart, R. O., Wachsman William, Berry Charles C., Arden Karen, Goodison Steven, Klacansky Igor, McClelland Michael, Wang-Rodriquez Jessica, Wasserman Linda, Sawyers, Ann, Yipeng, Wang, Kalcheva, Iveata, Tarin David, Mercola Dan., In silico dissection of cell-type associated patterns of gene expression in prostate cancer. Proceeding of the National Academy of Sciences U.S.A., 2004. 101: p. 615-620.
[0685] 17. Tibshirani, R., et al., Diagnosis of multiple cancer types by shrunken centroids of gene expression. Proc Natl Acad Sci USA, 2002. 99(10): p. 6567-72.
[0686] 18. Ramaswamy, S., et al., Multiclass cancer diagnosis using tumor gene expression signatures. Proc Natl Acad Sci USA, 2001. 98(26): p. 15149-54.
[0687] 19. Su, A. I., et al., Molecular classification of human carcinomas by use of gene expression signatures. Cancer Res, 2001. 61(20): p. 7388-93.
[0688] 20. Wang, Y., et al., A New Bi-Model Classifier for Predicting Outcomes of Prostate Cancer Patients. JSM Proceedings, 2008.
[0689] 21. Dennis, G., Jr., et al., DAVID: Database for Annotation, Visualization, and Integrated Discovery. Genome Biol, 2003. 4(5): p. P3.
[0690] 22. Huang da, W., et al., DAVID Bioinformatics Resources: expanded annotation database and novel algorithms to better extract biology from large gene lists. Nucleic Acids Res, 2007. 35(Web Server issue): p. W169-75.
Example 10
Increasing Sample Size Does Not Boost Power If Confounding Factors Are Not Controlled--A Study of Prostate Cancer with Microarray
Analysis of Prostate Cancer Data
[0691] We recently published a dataset for prostate cancer study (publicly available at GEO database with access number GSE8218) [3]. This dataset consists of 136 samples from 82 patients who went through prostatectomy. Of these 82 patients, 45 underwent disease relapse, 33 did not and the remaining 4 were unknown. Here we used the 130 samples with definitive relapse status for this study. In some cases, more than one sample was collected from different regions of prostate of the same patient, for example, from tumor-enriched microdissected tissue and from nontumor tissue from ≧1.5 cm from tumor (usually the contralateral lobe). For each sample which was used for microarray assay, four pathologists independently reviewed the hematoxylin and eosin (H&E) stained sections and estimated the percentages of three major cell components, i.e., tumor, stroma and BPH. The goal of this study is to identify genes that are associated with disease progression in tumor cells or maybe in other types of cells which indicate gene expression changes in the tumor micro-environment [16].
[0692] At first, we did differential analysis on all the 130 samples using the LIMMA package (http://www.bioconductor.org) in R [5]. We identified 602 altered genes between relapse and non-relapse groups by the criterion of B>0, where B represents log-likelihood-ratio of being differentially expressed versus being equivalently expressed. Thus, B>0 indicates that the gene under consideration has altered expression between relapse and non-relapse groups. The same criterion applied to the gene selection in the subsequent analyses. We then randomly selected a subset of 40, 45, . . . , 120, 125 samples from the data and carried out differential expression analysis respectively. If increase of sample size boosts power, we expect to see that more genes are detected when sample size becomes larger and the overlap of the signatures detected at different sample sizes is large, i.e., the circles and squares in FIG. 12 are supposed to stay close to each other and go upward steadily. Nevertheless, as shown in FIG. 12, the number of detected genes fluctuated as sample size increased with maximum detection (666 genes) when 120 randomly selected samples were used (circles). We compared different gene lists identified to the longest gene list of 666 genes in FIG. 12 (squares) which showed only moderate overlap.
[0693] Next, we selected samples by stepwise enriching the tumor or stroma components which are two major types of cells in prostate tissue. Specifically, we used T, k % (k=0, 5, . . . , 70, 75) as cutoff for sample selection, where T stands for the percentage for tumor component. The number of genes identified in each case were summarized in FIG. 13A. The maximum detection (602 genes) occurred when all 130 samples were included in the analysis. However, the overlap between these 602 genes with the gene lists detected at other points were very low (the squares were very much separated from the circles). In particular, the overlap between these 602 genes with the gene lists detected for tumor enriched samples in the right half of the plot was very low, indicating that many of the
[0694] 602 genes were false discoveries due to the diversity in terms of cell composition of samples. This suggested that employing all the 130 samples available is not the optimal strategy. However, there was another peak for the curve indicated by the circles when 40 samples (with tumor component greater than 35%) were used. The overlap between the detected genes at this point (as new reference gene list) with other gene lists near this point (sample size 22 to 49) was plotted in FIG. 13B. The overlaps were high (80%, curves indicated by circles and squares stuck together within this region), suggesting consistent discoveries among these assays (FIG. 13B). We observed that at the right end of the plot the number of detected genes rises at sample size=17 and less but the overlap with the list of 247 genes (identified at sample size=40; Table 33) kept dropping. This odd behavior was ascribed to the tiny sample size, for example, only 4 to 17 samples were included, which diminished power but enlarged chance of incurring false positives.
[0695] A similar phenomenon was observed when we investigate relapse-associated stromal genes. There were two peaks for the genes predicted to associated with recurrence (circles) at sample size 70 and 92 in the right half of the plot (stroma enriched samples). The overlap between the genes identified at these two points and gene lists around these two points (24 to 106) were fairly high (≧76%, see FIGS. 13C and 13D). In the left half of the plot, the detection rates were also high when most samples were included (sample size=128 in FIG. 13E; sample size=130 in FIG. 13F). However, the overlap between the detected genes at those points and gene lists identified at right end of the plot is very low, indicating that many detected genes were false positives if most samples were included. Note that the sample size at the right end of these plots is still reasonably large (34 to 60) compared to that of plots for genes putatively from tumor; therefore, we did not see the bending up of the curve indicated by the circles that occurs in FIGS. 13A-13B which indicated increased false positives. However, owing to the reduced power caused by fewer samples, many interested genes were missed (low detection rate at the right end of the plots compared to the detection rates when sample size=70 to 92).
[0696] The original paper dealt with the heterogeneous samples via using a multiple-linear-regression (MLR) model by which the observed Affymetrix gene expression values are described as linear combination of the contribution from different types of cells [3] [17]. Specifically, the following model was applied to the expression data for each gene,
g = b 0 + j = 1 C b j p j + I ( RS = 1 ) × j = 1 C γ j p j + , ( 1 ) ##EQU00018##
where g is the observed expression for a gene, b0 is the grand mean, C=3 indicating 3 types of cell component, pj is the percentage of cell type j, b1 represent the expression of this gene in cell type j when the case is non-relapse, γj is the extra expression (either up- or down-regulated) in cell type j when the case relapses, and finally I(RS=1) is an indicator variable with I=1 if the case relapses (denoted by RS=1) and I=0 if the case does not recur (denoted by RS=0). We reanalyzed the data with exactly the same method and detected 119 relapse-associated genes in tumor and 247 relapse-associated gene in stroma. These two gene lists have 36 and 169 genes in common respectively with the 247 genes identified for tumor (sample size=40 in FIG. 13B) and 666 genes identified in stroma (sample size=70 in FIG. 13c) by t-test. We considered that the MLR analysis was more desirable than t-test (e.g., LIMMA) because (1) using the percentage data as covariates for regression analysis is more accurate than selecting samples based on the percentage cutoff, and (2) all samples are effectively used for calculation leading to increased power. However, precise percentage estimation data are not commonly available for many studies; in most cases, samples were only roughly classified into either tumor-enriched or stroma-enriched categories. Therefore, t-test still applies prevalently. To compare the results from these two analyses (t-test based on enriched samples and MLR), we added green/gold curve to each plot of FIG. 12 and FIG. 13 denoting the overlap between each identified gene lists by t-test and tumor/stroma genes identified with MLR. Here we assume that cell-type specific genes identified with
[0697] MLR are more reliable based on above reasoning; thus, we try to validate results of t-test by MLR results. For random experiment (FIG. 12), the overlaps were limited and did not demonstrate any visible pattern as sample size increased. However, for stepwise enrichment experiment (FIG. 13), the overlaps were much improved and showed bell-shaped pattern as expected (with maximum at peaks of blue curves FIG. 13B-13D). We presume that these 247 tumor genes and 666 stroma genes identified by t-test were most close to reality because the optimal subset of samples were used by balancing sample size and homogeneity between samples. We also calculated the empirical p-values for the overlap between tumor/stroma gene lists identified with these two approaches as follows.
[0698] Suppose we calculate significance level for overlap of two tumor gene lists, i.e., 119 genes by MLR and 247 genes by t-test. Let count=0. From ˜22,000 genes, we randomly selected two gene lists of length 119 and 247, respectively. Not that 119 and 247 are the lengths of genes identified separately by t-test and MLR. If the overlap of the two randomly selected gene lists is equal or greater than 36 (observed overlap between these two tumor gene lists), we let count increase by 1. We repeated this process 10,000 times and the p-value of the observed overlap of tumor genes is calculated as
p=count/10000.
[0699] By the same means, we calculated the significance level for overlap of two stroma gene lists as well. Both p-values for tumor overlapping genes and stroma overlapping genes were ≦0.0001. This again verified the discoveries by t-test with stepwise enriched samples.
[0700] Simulated Study
[0701] In this section, we generated a dataset consisting of 200 samples each of which is composed of three types of cells. This is to mimic the situation we are facing for prostate cancer study. We randomly assigned the 200 samples into either case group (denoted by 1) or control group (denoted by 0). Here case means aggressive prostate cancers which will progress even after surgical removal prostate gland; while control denotes indolent prostate cancer which will not recur after prostatectomy. For each sample, the percentages of three cell types were simulated as follows. We let cell type 3 (BPH) be the minority cell which takes up to 10% volume in tissues; thus, we first generated the percentage of cell type 3 (x3) from uniform distribution U(0, 0.1). We then generated the percentage of cell type 1 (x1 for tumor) from U(0, 1-x3), and the percentage of cell type 2 (x2 for stroma) is therefore 1-x1-x3. For each sample, we simulated expression data for 1000 gene as follows. We let gene 1 to 60 have altered expression in cell type 1 between case and control. The differences in terms of expression for gene 1 to 20, gene 21 to 40 and gene 41 to 60 are set to 0.5, 1.0 and 2.0, respectively. The same setting was used for generating differentially expressed genes for cell type 2 (gene 61 to 120). Due to the small load for cell type 3, we assume that the difference in cell type 3 between case and control is undetectable, so we did not simulate differentially expressed genes for cell type 3.
[0702] First, we randomly selected a subset of 40, 50, . . . , 190, 200 samples from the data and carried out differential expression analysis using LIMMA. The sensitivity, specificity and false discovery rate had been logged in each situation. Such analysis was repeated 100 times and the average operating characteristic is summarized in FIG. 14. The sensitivity or power went up as sample size increased, however, the detection rate was limited (maximum 46.7%). Note that the specificity and false discovery rate were steadily satisfactory (very close to 0).
[0703] Considering the heterogeneity in cell composition, we then selected samples by stepwise enriching one type of cell. Specifically, we included samples with x1, k % (k=0, 5, . . . , 85, 90) in expression comparison procedure, and then identified genes that are differentially expressed in cell type 1 between case and control. With varying cutoff, the number of samples included in analysis and the sensitivity or power achieved by these samples are summarized in Table 32. Obviously, the maximum sensitivity or power is 73.3% which is much higher than any figures attained by randomly selected sample in FIG. 14. In addition, the maximum sensitivity or power achieved when x1, 65%, neither too small nor too large in terms of the content of cell type 1 (or the number of samples included in the calculation). If the selected cutoff is too small, most samples will be included. This is like what we observed in previous assay when sample size is close to upper limit (see FIG. 14). In this case, the variation caused by mixed tissue is likely to impair detection power. However, if the selected cutoff is too large, too few samples will be included in the analysis, leading to a reduced power. For example, if we use x1, 90% for sample selection, only 9 samples (5 controls and 4 cases) were selected. The sensitivity or power in this situation is only 43%. This is very similar to the observation in prostate cancer data analysis which showed a bending-down detection curve when sample size is near 0 (FIG. 13A-13B). There is a trade off between size and level of homogeneity of samples. Both factors positively contribute to power but never benefit from each other as if type I and type II errors in statistical hypothesis test. This lesson tells us that carefully selecting samples from resource is superior to utilizing all available samples indiscriminately.
[0704] Finally, we applied MLR to the simulated data and the results were much improved compared to the regular t-test with enriched samples (Table 32). This is what we expected and attested plausibility of validating results of t-test by using results of MLR analysis.
TABLE-US-00034 TABLE 32 Operating characteristics for MLR analysis. Sensitivity Specificity Tumor genes 91.7% 96.0% Stroma genes 96.7% 96.0%
REFERENCES
[0705] 1. Blalock, E. M., Geddes, J. W., Chen, K. C., Porter, N. M., Markesbery, W. R., Landfield, P. W.: Incipient alzheimer's disease: Microarray correlation analyses reveal major transcriptional and tumor suppressor responses. Proceedings of the National Academy of Sciences of the United States of America 101 (2004) 2173-2178
[0706] 2. Schena, M., Shalon, D., Davis, R. W., Brown, P.O.: Quantitative monitoring of gene-expression patterns with a complementary-dna microarray. Science 270(5235) (1995) 467-470
[0707] 3. Stuart, R. O., Wachsman, W., Berry, C. C., Wang-Rodriguez, J., Wasserman, L., Klacansky, I., Masys, D., Arden, K., Goodison, S., McClelland, M., Wang, Y. P., Sawyers, A., Kalcheva, I., Tarin, D., Mercola, D.: In silico dissection of cell-type-associated patterns of gene expression in prostate cancer. Proceedings of the National Academy of Sciences of the United States of America 101(2) (2004) 615-620
[0708] 4. Koziol, J. A., Feng, A. C., Jia, Z. Y., Wang, Y. P., Goodison, S., McClelland, M., Mercola, D.: The wisdom of the commons: ensemble tree classifiers for prostate cancer prognosis. Bioinformatics 25(1) (2009) 54-60
[0709] 5. Smyth, G. K.: Linear models and empirical bayes methods for assessing differential expression in microarray experiments. Statistical Applications in Genetics and Molecular Biology 3 (2004) Article 3
[0710] 6. Tusher, V. G., Tibshirani, R., Chu, G.: Significance analysis of microarrays applied to the ionizing radiation response. Proceedings of the National Academy of Sciences of the United States of America 98 (2001) 5116-5121
[0711] 7. Jia, Z., Xu, S.: Bayesian mixture model analysis for detecting differentially expressed genes. International Journal of Plant Genomics 2008 (2008) Article ID 892927, 12 pages
[0712] 8. Fan, C., Oh, D.S., Wessels, L., Weigelt, B., Nuyten, D. S. A., Nobel, A. B., van't Veer, L. J., Perou, C. M.: Concordance among gene-expression-based predictors for breast cancer. New England Journal of Medicine 355(6) (2006) 560-569
[0713] 9. Chang, H. Y., Sneddon, J. B., Alizadeh, A. A., Sood, R., West, R. B., Montgomery, K., Chi, J. T., van de Rijn, M., Botstein, D., Brown, P.O.: Gene expression signature of fibroblast serum response predicts human cancer progression: Similarities between tumors and wounds. Plos Biology 2(2) (2004) 206-214
[0714] 10. Paik, S., Shak, S., Tang, G., Kim, C., Baker, J., Cronin, M., Baehner, F. L., Walker, M.G., Watson, D., Park, T., Hiller, W., Fisher, E. R., Wickerham, D. L., Bryant, J., Wolmark, N.: A multigene assay to predict recurrence of tamoxifen-treated, node-negative breast cancer. New England Journal of Medicine 351(27) (2004) 2817-2826
[0715] 11. Sorlie, T., Perou, C. M., Tibshirani, R., Aas, T., Geisler, S., Johnsen, H., Hastie, T., Eisen, M. B., van de Rijn, M., Jeffrey, S. S., Thorsen, T., Quist, H., Matese, J. C., Brown, P. O., Botstein, D., Lonning, P. E., Borresen-Dale, A. L.: Gene expression patterns of breast carcinomas distinguish tumor subclasses with clinical implications. Proceedings of the National Academy of Sciences of the United States of America 98(19) (2001) 10869-10874
[0716] 12. Sorlie, T., Tibshirani, R., Parker, J., Hastie, T., Marron, J. S., Nobel, A., Deng, S., Johnsen, H., Pesich, R., Geisler, S., Demeter, J., Perou, C. M., Lonning, P. E., Brown, P.O., Borresen-Dale, A. L., Botstein, D.: Repeated observation of breast tumor subtypes in independent gene expression data sets. Proceedings of the National Academy of Sciences of the United States of America 100(14) (2003) 8418-8423
[0717] 13. Sotiriou, C., Neo, S. Y., McShane, L. M., Korn, E. L., Long, P. M., Jazaeri, A., Martiat, P., Fox, S. B., Harris, A. L., Liu, E. T.: Breast cancer classification and prognosis based on gene expression profiles from a population-based study. Proceedings of the National Academy of Sciences of the United States of America 100(18) (2003) 10393-10398
[0718] 14. van de Vijver, M. J., He, Y. D., van't Veer, L. J., Dai, H., Hart, A. A. M., Voskuil, D. W., Schreiber, G. J., Peterse, J. L., Roberts, C., Marton, M. J., Parrish, M., Atsma, D., Witteveen, A., Glas, A., Delahaye, L., van der Velde, T., Bartelink, H., Rodenhuis, S., Rutgers, E. T., Friend, S. H., Bernards, R.: A gene-expression signature as a predictor of survival in breast cancer. New England Journal of Medicine 347(25) (2002) 1999-2009
[0719] 15. van't Veer, L. J., Dai, H. Y., van de Vijver, M. J., He, Y. D. D., Hart, A. A. M., Mao, M., Peterse, H. L., van der Kooy, K., Marton, M.J., Witteveen, A. T., Schreiber, G. J., Kerkhoven, R. M., Roberts, C., Linsley, P. S., Bernards, R., Friend, S. H.: Gene expression profiling predicts clinical outcome of breast cancer. Nature 415(6871) (2002) 530-536
[0720] 16. Cunha, G. R., Hayward, S. W., Wang, Y. Z., Ricke, W. A.: Role of the stromal microenvironment in carcinogenesis of the prostate. International Journal of Cancer 107(1) (2003) 1-10
[0721] 17. Jia, Z., Wang, Y., Koziol, J., McClelland, M., Mercola, D.: A new bi-model classifier for predicting outcomes of prostate cancer patients. in JSM Proceedings, Biometrics Section. Denver, Colo.: American Statistical Association. (2008)
TABLE-US-00035
[0721] TABLE 33 Prognostic prostate cancer genes (biomarkers) in stroma cells identified by t-test following triage of training cases based on calculated low tumor cell percentage Probe.Set.ID Gene.Title 9212 209724_s_at zinc finger protein 161 homolog (mouse) 8569 209075_s_at iron-sulfur cluster scaffold homolog (E. coli) 5558 206031_s_at ubiquitin specific peptidase 5 (isopeptidase T) 2137 202609_at epidermal growth factor receptor pathway substrate 8 17587 218222_x_at aryl hydrocarbon receptor nuclear translocator 20870 221507_at transportin 2 (importin 3, karyopherin beta 2b) 3319 203792_x_at polycomb group ring finger 2 254 200726_at protein phosphatase 1, catalytic subunit, gamma isoform 687 201159_s_at N-myristoyltransferase 1 18431 219067_s_at non-SMC element 4 homolog A (S. cerevisiae) 9148 209659_s_at cell division cycle 16 homolog (S. cerevisiae) 10469 211023_at pyruvate dehydrogenase (lipoamide) beta 21176 221816_s_at PHD finger protein 11 3636 204109_s_at nuclear transcription factor Y, alpha 11450 212064_x_at MYC-associated zinc finger protein (purine-binding transcription factor) 4295 204768_s_at flap structure-specific endonuclease 1 12711 213330_s_at stress-induced-phosphoprotein 1 (Hsp70/Hsp90-organizing protein) 18080 218716_x_at mitochondrial translation optimization 1 homolog (S. cerevisiae) 728 201200_at cellular repressor of E1A-stimulated genes 1 1825 202297_s_at RER1 retention in endoplasmic reticulum 1 homolog (S. cerevisiae) 18419 219055_at S1 RNA binding domain 1 3811 204284_at protein phosphatase 1, regulatory (inhibitor) subunit 3C 8782 209288_s_at CDC42 effector protein (Rho GTPase binding) 3 12103 212718_at poly(A) polymerase alpha 3791 204264_at carnitine palmitoyltransferase II 17188 217823_s_at ubiquitin-conjugating enzyme E2, J1 (UBC6 homolog, yeast) 21817 34868_at Smg-5 homolog, nonsense mediated mRNA decay factor (C. elegans) 12250 212865_s_at collagen, type XIV, alpha 1 11396 212009_s_at stress-induced-phosphoprotein 1 (Hsp70/Hsp90-organizing protein) 11407 212021_s_at antigen identified by monoclonal antibody Ki-67 21773 32541_at protein phosphatase 3 (formerly 2B), catalytic subunit, gamma isoform 15404 216032_s_at ERGIC and golgi 3 2460 202931_x_at bridging integrator 1 17360 217995_at sulfide quinone reductase-like (yeast) 8725 209231_s_at dynactin 5 (p25) 21295 221935_s_at chromosome 3 open reading frame 64 22178 65517_at adaptor-related protein complex 1, mu 2 subunit 20785 221422_s_at chromosome 9 open reading frame 45 17290 217925_s_at chromosome 6 open reading frame 106 2905 203378_at PCF11, cleavage and polyadenylation factor subunit, homolog (S. cerevisiae) 14114 214738_s_at NIMA (never in mitosis gene a)-related kinase 9 2706 203178_at glycine amidinotransferase (L-arginine:glycine amidinotransferase) 19211 219847_at histone deacetylase 11 17855 218490_s_at zinc finger protein 302 10113 210648_x_at sorting nexin 3 20886 221523_s_at Ras-related GTP binding D 11565 212179_at splicing factor, arginine/serine-rich 18 19134 219770_at glycosyltransferase-like domain containing 1 5199 205672_at xeroderma pigmentosum, complementation group A 3167 203640_at muscleblind-like 2 (Drosophila) 10433 210986_s_at tropomyosin 1 (alpha) 88 200067_x_at sorting nexin 3 13818 214439_x_at bridging integrator 1 2399 202871_at TNF receptor-associated factor 4 11570 212184_s_at mitogen-activated protein kinase kinase kinase 7 interacting protein 2 9418 209932_s_at deoxyuridine triphosphatase 21148 221788_at CDNA FLJ11614 fis, clone HEMBA1004015 12476 213093_at protein kinase C, alpha 13966 214588_s_at Microfibrillar-associated protein 3 2851 203324_s_at caveolin 2 21207 221847_at hypothetical protein LOC100129361 18159 218795_at acid phosphatase 6, lysophosphatidic 11533 212147_at Smg-5 homolog, nonsense mediated mRNA decay factor (C. elegans) 873 201345_s_at ubiquitin-conjugating enzyme E2D 2 (UBC4/5 homolog, yeast) 14634 215260_s_at transcription factor 3 (E2A immunoglobulin enhancer binding factors E12/E47) 16339 216969_s_at kinesin family member 22 12895 213514_s_at diaphanous homolog 1 (Drosophila) 1911 202383_at jumonji, AT rich interactive domain 1C 11497 212111_at syntaxin 12 4074 204547_at RAB40B, member RAS oncogene family 19713 220349_s_at endo-beta-N-acetylglucosaminidase 6528 207002_s_at pleiomorphic adenoma gene-like 1 17271 217906_at kelch domain containing 2 7906 208405_s_at CD164 molecule, sialomucin 9685 210201_x_at bridging integrator 1 12557 213175_s_at small nuclear ribonucleoprotein polypeptides B and B1 5636 206110_at histone cluster 1, H3h 3411 203884_s_at RAB11 family interacting protein 2 (class I) 795 201267_s_at proteasome (prosome, macropain) 26S subunit, ATPase, 3 4490 204963_at sarcospan (Kras oncogene-associated gene) 14375 215000_s_at fasciculation and elongation protein zeta 2 (zygin II) 21934 39549_at neuronal PAS domain protein 2 9513 210028_s_at origin recognition complex, subunit 3-like (yeast) 14256 214881_s_at upstream binding transcription factor, RNA polymerase I 9676 210192_at ATPase, aminophospholipid transporter (APLT), class I, type 8A, member 1 17714 218349_s_at Zwilch, kinetochore associated, homolog (Drosophila) 758 201230_s_at ariadne homolog 2 (Drosophila) 6748 207223_s_at ROD1 regulator of differentiation 1 (S. pombe) 11624 212238_at additional sex combs like 1 (Drosophila) 9009 209516_at SMYD family member 5 9763 210283_x_at poly(A) binding protein interacting protein 1 /// hypothetical LOC645139 /// similar to poly(A) binding protein interacting protein 1 isoform 2347 202819_s_at transcription elongation factor B (SIII), polypeptide 3 (110 kDa, elongin A) 3641 204114_at nidogen 2 (osteonidogen) 17544 218179_s_at chromosome 4 open reading frame 41 2420 202892_at cell division cycle 23 homolog (S. cerevisiae) 17880 218515_at chromosome 21 open reading frame 66 12084 212699_at secretory carrier membrane protein 5 18062 218698_at APAF1 interacting protein 5138 205611_at tumor necrosis factor (ligand) superfamily, member 12 8201 208706_s_at eukaryotic translation initiation factor 5 13554 214175_x_at PDZ and LIM domain 4 4466 204939_s_at phospholamban 8451 208956_x_at deoxyuridine triphosphatase 10085 210620_s_at general transcription factor IIIC, polypeptide 2, beta 110 kDa 17458 218093_s_at ankyrin repeat domain 10 19049 219685_at transmembrane protein 35 20799 221436_s_at cell division cycle associated 3 17196 217831_s_at NSFL1 (p97) cofactor (p47) 8707 209213_at carbonyl reductase 1 11700 212315_s_at nucleoporin 210 kDa 12779 213398_s_at chromosome 14 open reading frame 124 17874 218509_at lipid phosphate phosphatase-related protein type 2 12018 212633_at KIAA0776 11483 212097_at caveolin 1, caveolae protein, 22 kDa 11077 211675_s_at MyoD family inhibitor domain containing 13258 213878_at Pyridine nucleotide-disulphide oxidoreductase domain 1 3045 203518_at lysosomal trafficking regulator 13715 214336_s_at coatomer protein complex, subunit alpha 6056 206530_at RAB30, member RAS oncogene family 21792 33760_at peroxisomal biogenesis factor 14 12821 213440_at RAB1A, member RAS oncogene family 11882 212497_at mitogen-activated protein kinase 1 interacting protein 1-like 2181 202653_s_at membrane-associated ring finger (C3HC4) 7 1361 201833_at histone deacetylase 2 5330 205803_s_at transient receptor potential cation channel, subfamily C, member 1 2493 202964_s_at regulatory factor X, 5 (influences HLA class II expression) 18531 219167_at RAS-like, family 12 14074 214698_at ROD1 regulator of differentiation 1 (S. pombe) 7438 207922_s_at macrophage erythroblast attacher 17412 218047_at oxysterol binding protein-like 9 2057 202529_at phosphoribosyl pyrophosphate synthetase-associated protein 1 2857 203330_s_at syntaxin 5 462 200934_at DEK oncogene (DNA binding) 11200 211804_s_at cyclin-dependent kinase 2 535 201007_at hydroxyacyl-Coenzyme A dehydrogenase/3-ketoacyl-Coenzyme A thiolase/enoyl-Coenzyme A hydratase (trifunctional protein), beta 3466 203939_at 5'-nucleotidase, ecto (CD73) 12354 212971_at cysteinyl-tRNA synthetase 1302 201774_s_at non-SMC condensin I complex, subunit D2 3552 204025_s_at programmed cell death 2 13816 214437_s_at serine hydroxymethyltransferase 2 (mitochondrial) 3313 203786_s_at tumor protein D52-like 1 550 201022_s_at destrin (actin depolymerizing factor) 11942 212557_at zinc finger protein 451 450 200922_at KDEL (Lys-Asp-Glu-Leu) endoplasmic reticulum protein retention receptor 1 20636 221273_s_at ring finger protein 208 /// similar to ring finger protein 208 2546 203017_s_at synovial sarcoma, X breakpoint 2 interacting protein 10425 210978_s_at transgelin 2 20106 220742_s_at N-glycanase 1 6380 206854_s_at mitogen-activated protein kinase kinase kinase 7 12864 213483_at peptidylprolyl isomerase domain and WD repeat containing 1 19458 220094_s_at coiled-coil domain containing 90A 4482 204955_at sushi-repeat-containing protein, X-linked 3927 204400_at embryonal Fyn-associated substrate 20553 221190_s_at chromosome 18 open reading frame 8 14854 215481_s_at peroxisomal biogenesis factor 5 9947 210470_x_at non-POU domain containing, octamer-binding 7458 207943_x_at pleiomorphic adenoma gene-like 1 18479 219115_s_at interleukin 20 receptor, alpha 1794 202266_at TRAF and TNF receptor associated protein 18133 218769_s_at ankyrin repeat, family A (RFXANK-like), 2 7033 207511_s_at chromosome 2 open reading frame 24 11562 212176_at splicing factor, arginine/serine-rich 18 4578 205051_s_at v-kit Hardy-Zuckerman 4 feline sarcoma viral oncogene homolog 1960 202432_at protein phosphatase 3 (formerly 2B), catalytic subunit, beta isoform 7579 208070_s_at REV3-like, catalytic subunit of DNA polymerase zeta (yeast) 1655 202127_at PRP4 pre-mRNA processing factor 4 homolog B (yeast) 14198 214823_at zinc finger protein 204 (pseudogene) 4467 204940_at phospholamban 19299 219935_at ADAM metallopeptidase with thrombospondin type 1 motif, 5 (aggrecanase-2) 12388 213005_s_at KN motif and ankyrin repeat domains 1 3233 203706_s_at frizzled homolog 7 (Drosophila) 16813 217448_s_at TOX high mobility group box family member 4 /// similar to KIAA0737 protein 20865 221502_at karyopherin alpha 3 (importin alpha 4) 11630 212244_at glutamate receptor, ionotropic, N-methyl D-aspartate-like 1A /// GRINL1A combined protein 1593 202065_s_at protein tyrosine phosphatase, receptor type, f polypeptide (PTPRF), interacting protein (liprin), alpha 1 8726 209232_s_at dynactin 5 (p25) 17131 217766_s_at transmembrane protein 50A 3776 204249_s_at LIM domain only 2 (rhombotin-like 1) 7785 208281_x_at deleted in azoospermia 1 /// deleted in azoospermia 3 /// deleted in azoospermia 2 /// deleted in azoospermia 4 /// similar to deleted in a like 17228 217863_at protein inhibitor of activated STAT, 1 14501 215127_s_at RNA binding motif, single stranded interacting protein 1 13906 214527_s_at polyglutamine binding protein 1 12674 213293_s_at tripartite motif-containing 22 6464 206938_at steroid-5-alpha-reductase, alpha polypeptide 2 (3-oxo-5 alpha-steroid delta 4-dehydrogenase alpha 2) 2711 203183_s_at SWI/SNF related, matrix associated, actin dependent regulator of chromatin, subfamily d, member 1 12083 212698_s_at septin 10 9042 209550_at necdin homolog (mouse) 11083 211681_s_at PDZ and LIM domain 5 20841 221478_at BCL2/adenovirus E1B 19 kDa interacting protein 3-like 18981 219617_at chromosome 2 open reading frame 34 13702 214323_s_at UPF3 regulator of nonsense transcripts homolog A (yeast) 8662 209168_at glycoprotein M6B 13151 213771_at interferon regulatory factor 2 binding protein 1 20946 221584_s_at potassium large conductance calcium-activated channel, subfamily M, alpha member 1 1131 201603_at protein phosphatase 1, regulatory (inhibitor) subunit 12A 20510 221147_x_at WW domain containing oxidoreductase 14312 214937_x_at pericentriolar material 1 19162 219798_s_at methylphosphate capping enzyme 20996 221634_at ribosomal protein L23a pseudogene 7 17452 218087_s_at sorbin and SH3 domain containing 1 975 201447_at TIA1 cytotoxic granule-associated RNA binding protein
3991 204464_s_at endothelin receptor type A 4563 205036_at LSM6 homolog, U6 small nuclear RNA associated (S. cerevisiae) 19141 219777_at GTPase, IMAP family member 6 11488 212102_s_at karyopherin alpha 6 (importin alpha 7) 1730 202202_s_at laminin, alpha 4 6437 206911_at tripartite motif-containing 25 15666 216294_s_at KIAA1109 2220 202692_s_at upstream binding transcription factor, RNA polymerase I 8786 209292_at Inhibitor of DNA binding 4, dominant negative helix-loop-helix protein 1846 202318_s_at SUMO1/sentrin specific peptidase 6 12643 213262_at spastic ataxia of Charlevoix-Saguenay (sacsin) 12288 212904_at leucine rich repeat containing 47 5630 206104_at ISL LIM homeobox 1 15760 216389_s_at WD repeat domain 23 3217 203690_at tubulin, gamma complex associated protein 3 1721 202193_at LIM domain kinase 2 12866 213485_s_at ATP-binding cassette, sub-family C (CFTR/MRP), member 10 18742 219378_at NMDA receptor regulated 1-like 15919 216549_s_at TBC1 domain family, member 22B 3932 204405_x_at DIM1 dimethyladenosine transferase 1-like (S. cerevisiae) 12080 212695_at cryptochrome 2 (photolyase-like) 12365 212982_at zinc finger, DHHC-type containing 17 14210 214835_s_at succinate-CoA ligase, GDP-forming, beta subunit 8870 209377_s_at high mobility group nucleosomal binding domain 3 4427 204900_x_at Sin3A-associated protein, 30 kDa 2850 203323_at caveolin 2 3965 204438_at mannose receptor, C type 1 /// mannose receptor, C type 1-like 1 17047 217682_at CDNA FLJ37032 fis, clone BRACE2011265 1661 202133_at WW domain containing transcription regulator 1 17157 217792_at sorting nexin 5 18811 219447_s_at solute carrier family 35, member C2 /// hypothetical protein LOC100128167 1890 202362_at RAP1A, member of RAS oncogene family 10969 211564_s_at PDZ and LIM domain 4 11680 212294_at guanine nucleotide binding protein (G protein), gamma 12 1095 201567_s_at golgi autoantigen, golgin subfamily a, 4 8812 209318_x_at pleiomorphic adenoma gene-like 1 2833 203306_s_at solute carrier family 35 (CMP-sialic acid transporter), member A1 4220 204693_at CDC42 effector protein (Rho GTPase binding) 1 5568 206042_x_at small nuclear ribonucleoprotein polypeptide N /// SNRPN upstream reading frame 20179 220815_at catenin (cadherin-associated protein), alpha 3 279 200751_s_at heterogeneous nuclear ribonucleoprotein C (C1/C2) 12687 213306_at multiple PDZ domain protein 9307 209821_at interleukin 33 18058 218694_at armadillo repeat containing, X-linked 1 1678 202150_s_at neural precursor cell expressed, developmentally down-regulated 9 11506 212120_at ras homolog gene family, member Q indicates data missing or illegible when filed
TABLE-US-00036 TABLE 34 Prognostic prostate cancer genes (biomarkers) in stroma cells identified by t-test following triage of training cases based on calculated low stroma cell percentage Probe.Set.ID Gene.Title Gene.Symbol 4409 204882_at Rho GTPase activating protein 25 ARHGAP25 10218 210757_x_at disabled homolog 2, mitogen-responsive phosphoprotein (Drosophila) DAB2 12214 212829_at phosphatidylinositol-5-phosphate 4-kinase, type II, alpha PIP4K2A 5360 205833_s_at prostate androgen-regulated transcript 1 PART1 597 201069_at matrix metallopeptidase 2 (gelatinase A, 72 kDa gelatinase, 72 kDa MMP2 type IV collagenase) 2486 202957_at hematopoietic cell-specific Lyn substrate 1 HCLS1 747 201219_at C-terminal binding protein 2 CTBP2 4090 204563_at selectin L (lymphocyte adhesion molecule 1) SELL 807 201279_s_at disabled homolog 2, mitogen-responsive phosphoprotein (Drosophila) DAB2 13281 213902_at N-acylsphingosine amidohydrolase (acid ceramidase) 1 ASAH1 2887 203360_s_at c-myc binding protein MYCBP 17122 217757_at alpha-2-macroglobulin A2M 4389 204862_s_at non-metastatic cells 3, protein expressed in NME3 18011 218647_s_at yrdC domain containing (E. coli) YRDC 12983 213603_s_at ras-related C3 botulinum toxin substrate 2 (rho family, small GTP RAC2 binding protein Rac2) 17155 217790_s_at signal sequence receptor, gamma (translocon-associated protein SSR3 gamma) 4797 205270_s_at lymphocyte cytosolic protein 2 (SH2 domain containing leukocyte LCP2 protein of 76 kDa) 12129 212744_at Bardet-Biedl syndrome 4 BBS4 19941 220577_at GTPase, very large interferon inducible 1 GVIN1 2193 202665_s_at WAS/WASL interacting protein family, member 1 WIPF1 11688 212302_at Rtf1, Paf1/RNA polymerase II complex component, homolog (S. cerevisiae) RTF1 6383 206857_s_at FK506 binding protein 1B, 12.6 kDa FKBP1B 2859 203332_s_at inositol polyphosphate-5-phosphatase, 145 kDa INPP5D 514 200986_at serpin peptidase inhibitor, clade G (C1 inhibitor), member 1, SERPING1 (angioedema, hereditary) 18285 218921_at single immunoglobulin and toll-interleukin 1 receptor (TIR) domain SIGIRR 2957 203430_at heme binding protein 2 HEBP2 20298 220934_s_at hypothetical protein MGC3196 MGC3196 9589 210105_s_at FYN oncogene related to SRC, FGR, YES FYN 4178 204651_at nuclear respiratory factor 1 NRF1 1133 201605_x_at calponin 2 CNN2 9182 209694_at 6-pyruvoyltetrahydropterin synthase PTS 114 200093_s_at histidine triad nucleotide binding protein 1 HINT1 21957 40420_at serine/threonine kinase 10 STK10 4603 205076_s_at myotubularin related protein 11 MTMR11 4818 205291_at interleukin 2 receptor, beta IL2RB 3702 204175_at zinc finger protein 593 ZNF593 128 200600_at moesin MSN 2717 203189_s_at NADH dehydrogenase (ubiquinone) Fe--S protein 8, 23 kDa (NADH- NDUFS8 coenzyme Q reductase) 12130 212745_s_at Bardet-Biedl syndrome 4 BBS4 15405 216033_s_at FYN oncogene related to SRC, FGR, YES FYN 12384 213001_at angiopoietin-like 2 ANGPTL2 20618 221255_s_at transmembrane protein 93 TMEM93 1249 201721_s_at lysosomal associated multispanning membrane protein 5 LAPTM5 481 200953_s_at cyclin D2 CCND2 3822 204295_at surfeit 1 SURF1 21049 221688_s_at IMP3, U3 small nucleolar ribonucleoprotein, homolog (yeast) IMP3 17527 218162_at olfactomedin-like 3 OLFML3 17449 218084_x_at FXYD domain containing ion transport regulator 5 FXYD5 11705 212320_at tubulin, beta TUBB 9039 209546_s_at apolipoprotein L, 1 APOL1 1955 202427_s_at brain protein 44 BRP44 21014 221653_x_at apolipoprotein L, 2 APOL2 4439 204912_at interleukin 10 receptor, alpha IL10RA 11060 211656_x_at major histocompatibility complex, class II, DQ beta 1 HLA-DQB1 2458 202929_s_at D-dopachrome tautomerase DDT 1824 202296_s_at RER1 retention in endoplasmic reticulum 1 homolog (S. cerevisiae) RER1 9159 209670_at T cell receptor alpha constant TRAC 9247 209759_s_at dodecenoyl-Coenzyme A delta isomerase (3,2 trans-enoyl-Coenzyme DCI A isomerase) 6394 206868_at StAR-related lipid transfer (START) domain containing 8 STARD8 3190 203663_s_at cytochrome c oxidase subunit Va COX5A 5676 206150_at CD27 molecule CD27 3846 204319_s_at regulator of G-protein signaling 10 RGS10 12542 213159_at pecanex homolog (Drosophila) PCNX 3724 204197_s_at runt-related transcription factor 3 RUNX3 18737 219373_at dolichyl-phosphate mannosyltransferase polypeptide 3 DPM3 3213 203686_at N-methylpurine-DNA glycosylase MPG 21576 222216_s_at mitochondrial ribosomal protein L17 MRPL17 2576 203047_at serine/threonine kinase 10 STK10 451 200923_at lectin, galactoside-binding, soluble, 3 binding protein LGALS3BP 1353 201825_s_at saccharopine dehydrogenase (putative) SCCPDH 2331 202803_s_at integrin, beta 2 (complement component 3 receptor 3 and 4 subunit) ITGB2 21927 38964_r_at Wiskott-Aldrich syndrome (eczema-thrombocytopenia) WAS 10103 210638_s_at F-box protein 9 FBXO9 510 200982_s_at annexin A6 ANXA6 12098 212713_at microfibrillar-associated protein 4 MFAP4 9109 209619_at CD74 molecule, major histocompatibility complex, class II invariant CD74 chain 19176 219812_at poliovirus receptor related immunoglobulin domain containing PVRIG 10245 210785_s_at chromosome 1 open reading frame 38 C1orf38 1194 201666_at TIMP metallopeptidase inhibitor 1 TIMP1 11431 212045_at golgi apparatus protein 1 GLG1 21908 38149_at Rho GTPase activating protein 25 ARHGAP25 4322 204795_at proline rich 3 PRR3 11729 212344_at sulfatase 1 SULF1 17946 218581_at abhydrolase domain containing 4 ABHD4 13115 213735_s_at cytochrome c oxidase subunit Vb COX5B 1286 201758_at tumor susceptibility gene 101 TSG101 69 200048_s_at jumping translocation breakpoint JTB 12936 213555_at RWD domain containing 2A RWDD2A 12175 212790_x_at ribosomal protein L13a RPL13A 374 200846_s_at protein phosphatase 1, catalytic subunit, alpha isoform PPP1CA 4627 205100_at glutamine-fructose-6-phosphate transaminase 2 GFPT2 19796 220432_s_at cytochrome P450, family 39, subfamily A, polypeptide 1 CYP39A1 12270 212885_at M-phase phosphoprotein 10 (U3 small nucleolar ribonucleoprotein) MPHOSPH10 8321 208826_x_at histidine triad nucleotide binding protein 1 HINT1 19040 219676_at zinc finger and SCAN domain containing 16 ZSCAN16 3913 204386_s_at mitochondrial ribosomal protein 63 MRP63 3739 204212_at acyl-CoA thioesterase 8 ACOT8 9791 210312_s_at intraflagellar transport 20 homolog (Chlamydomonas) IFT20 222 200694_s_at DEAD (Asp-Glu-Ala-Asp) box polypeptide 24 DDX24 22079 52169_at protein kinase LYK5 LYK5 20810 221447_s_at glycosyltransferase 8 domain containing 2 GLT8D2 8975 209482_at processing of precursor 7, ribonuclease P/MRP subunit (S. cerevisiae) POP7 2633 203104_at colony stimulating factor 1 receptor, formerly McDonough feline CSF1R sarcoma viral (v-fms) oncogene homolog 2895 203368_at cysteine-rich with EGF-like domains 1 CRELD1 12961 213581_at programmed cell death 2 PDCD2 4450 204923_at SAM and SH3 domain containing 3 SASH3 4703 205176_s_at integrin beta 3 binding protein (beta3-endonexin) ITGB3BP 17623 218258_at polymerase (RNA) I polypeptide D, 16 kDa POLR1D 954 201426_s_at vimentin VIM 4538 205011_at loss of heterozygosity, 11, chromosomal region 2, gene A LOH11CR2A 1248 201720_s_at lysosomal associated multispanning membrane protein 5 LAPTM5 2617 203088_at fibulin 5 FBLN5 5085 205558_at TNF receptor-associated factor 6 TRAF6 9115 209625_at phosphatidylinositol glycan anchor biosynthesis, class H PIGH 9095 209605_at thiosulfate sulfurtransferase (rhodanese) TST 1096 201568_at ubiquinol-cytochrome c reductase, complex III subunit VII, 9.5 kDa UQCRQ 2799 203272_s_at tumor suppressor candidate 2 TUSC2 17368 218003_s_at FK506 binding protein 3, 25 kDa FKBP3 13622 214243_s_at serine hydrolase-like /// serine hydrolase-like 2 SERHL /// SERHL2 7068 207547_s_at family with sequence similarity 107, member A FAM107A 3000 203473_at solute carrier organic anion transporter family, member 2B1 SLCO2B1 5592 206066_s_at RAD51 homolog C (S. cerevisiae) RAD51C 7810 208306_x_at Major histocompatibility complex, class II, DR beta 3 HLA-DRB1 17928 218563_at NADH dehydrogenase (ubiquinone) 1 alpha subcomplex, 3, 9 kDa NDUFA3 3701 204174_at arachidonate 5-lipoxygenase-activating protein ALOX5AP 20998 221637_s_at chromosome 11 open reading frame 48 C11orf48 5303 205776_at flavin containing monooxygenase 5 FMO5 16727 217362_x_at major histocompatibility complex, class II, DR beta 6 (pseudogene) HLA-DRB6 3005 203478_at NADH dehydrogenase (ubiquinone) 1, subcomplex unknown, 1, NDUFC1 6 kDa 329 200801_x_at actin, beta ACTB 13476 214097_at ribosomal protein S21 RPS21 4521 204994_at myxovirus (influenza virus) resistance 2 (mouse) MX2 3837 204310_s_at natriuretic peptide receptor B/guanylate cyclase B (atrionatriuretic NPR2 peptide receptor B) 2052 202524_s_at sparc/osteonectin, cwcv and kazal-like domains proteoglycan SPOCK2 (testican) 2 8796 209302_at polymerase (RNA) II (DNA directed) polypeptide H POLR2H 18643 219279_at dedicator of cytokinesis 10 DOCK10 8695 209201_x_at chemokine (C--X--C motif) receptor 4 CXCR4 1931 202403_s_at collagen, type I, alpha 2 COL1A2 1711 202183_s_at kinesin family member 22 KIF22 1481 201953_at calcium and integrin binding 1 (calmyrin) CIB1 453 200925_at cytochrome c oxidase subunit VIa polypeptide 1 COX6A1 17794 218429_s_at hypothetical protein FLJ11286 FLJ11286 3262 203735_x_at PTPRF interacting protein, binding protein 1 (liprin beta 1) PPFIBP1 18482 219118_at FK506 binding protein 11, 19 kDa FKBP11 209 200681_at glyoxalase I GLO1 2832 203305_at coagulation factor XIII, A1 polypeptide F13A1 17945 218580_x_at aurora kinase A interacting protein 1 AURKAIP1 12551 213169_at sema domain, seven thrombospondin repeats (type 1 and type 1-like), SEMA5A transmembrane domain (TM) and short cytoplasmic domain, (semaphorin) 5A 9322 209836_x_at bolA homolog 2 (E. coli) /// bolA homolog 2B (E. coli) BOLA2 /// BOLA2B 988 201460_at mitogen-activated protein kinase-activated protein kinase 2 MAPKAPK2 19126 219762_s_at ribosomal protein L36 RPL36 3380 203853_s_at GRB2-associated binding protein 2 GAB2 3963 204436_at pleckstrin homology domain containing, family O member 2 PLEKHO2 16485 217118_s_at chromosome 22 open reading frame 9 C22orf9 43 200022_at ribosomal protein L18 RPL18 21435 222075_s_at ornithine decarboxylase antizyme 3 OAZ3 9014 209521_s_at angiomotin AMOT 5307 205780_at BCL2-interacting killer (apoptosis-inducing) BIK 9098 209608_s_at acetyl-Coenzyme A acetyltransferase 2 ACAT2 13165 213785_at importin 9 IPO9 18169 218805_at GTPase, IMAP family member 5 GIMAP5 1320 201792_at AE binding protein 1 AEBP1 21338 221978_at major histocompatibility complex, class I, F HLA-F 20797 221434_s_at chromosome 14 open reading frame 156 C14orf156 12496 213113_s_at solute carrier family 43, member 3 SLC43A3 3838 204311_at ATPase, Na+/K+ transporting, beta 2 polypeptide ATP1B2 10333 210879_s_at RAB11 family interacting protein 5 (class I) RAB11FIP5 1268 201740_at NADH dehydrogenase (ubiquinone) Fe--S protein 3, 30 kDa (NADH- NDUFS3 coenzyme Q reductase) 13374 213995_at ATP synthase, H+ transporting, mitochondrial F0 complex, subunit s ATP5S (factor B) 2559 203030_s_at protein tyrosine phosphatase, receptor type, N polypeptide 2 PTPRN2 19115 219751_at SET domain containing 6 SETD6 1811 202283_at serpin peptidase inhibitor, clade F (alpha-2 antiplasmin, pigment SERPINF1 epithelium derived factor), member 1 9721 210241_s_at TP53 activated protein 1 TP53AP1 20821 221458_at 5-hydroxytryptamine (serotonin) receptor 1F HTR1F 570 201042_at transglutaminase 2 (C polypeptide, protein-glutamine-gamma- TGM2
glutamyltransferase) 143 200615_s_at adaptor-related protein complex 2, beta 1 subunit AP2B1 22228 AFFX- actin, beta ACTB HSAC07/ X00351_3_at 11555 212169_at FK506 binding protein 9, 63 kDa FKBP9 2964 203437_at transmembrane protein 11 TMEM11 12381 212998_x_at major histocompatibility complex, class II, DQ beta 1 /// major hCG_1998957 /// HLA-DQB1 /// histocompatibility complex, class II, DQ beta 2 /// major HLA-DQB2 /// HLA-DRB1 /// histocompatibility complex, class II, DR beta 1 /// major HLA-DRB2 /// HLA-DRB3 /// histocompatibility complex, class II, DR beta 2 (pseudogene) /// HLA-DRB4 /// HLA-DRB5 /// major histocompatibility complex, class II, DR beta 3 /// major LOC100133484 /// histocompatibility complex, class II, DR beta 4 /// major LOC100133583 /// histocompatibility complex, class II, DR beta 5 /// ribonuclease, LOC100133661 /// RNase A family, 2 (liver, eosinophil-derived neurotoxin) /// zinc LOC100133811 /// LOC730415 /// finger protein 749 /// hypothetical protein LOC730415 /// similar to RNASE2 /// ZNF749 Major histocompatibility complex, class II, DR beta 4 /// similar to major histocompatibility complex, class II, DQ beta 1 /// similar to HLA class II histocompatibility antigen, DR-W53 beta chain /// similar to hCG1992647 17360 217995_at sulfide quinone reductase-like (yeast) SQRDL 3867 204340_at transmembrane protein 187 TMEM187 10757 211339_s_at IL2-inducible T-cell kinase ITK 3858 204331_s_at mitochondrial ribosomal protein S12 MRPS12 8838 209345_s_at phosphatidylinositol 4-kinase type 2 alpha PI4K2A 3192 203665_at heme oxygenase (decycling) 1 HMOX1 12575 213193_x_at T cell receptor beta constant 1 TRBC1 18505 219141_s_at autophagy/beclin-1 regulator 1 AMBRA1 9864 210386_s_at metaxin 1 MTX1 3035 203508_at tumor necrosis factor receptor superfamily, member 1B TNFRSF1B 2718 203190_at NADH dehydrogenase (ubiquinone) Fe--S protein 8, 23 kDa (NADH- NDUFS8 coenzyme Q reductase) 16614 217249_x_at cytochrome c oxidase subunit VIIa polypeptide 2 (liver) COX7A2 347 200819_s_at ribosomal protein S15 RPS15 647 201119_s_at cytochrome c oxidase subunit 8A (ubiquitous) COX8A 8598 209104_s_at nucleolar protein family A, member 2 (H/ACA small nucleolar RNPs) NOLA2 3832 204305_at mitochondrial intermediate peptidase MIPEP 1083 201555_at minichromosome maintenance complex component 3 MCM3 18261 218897_at transmembrane protein 177 TMEM177 21091 221731_x_at versican VCAN 9912 210434_x_at jumping translocation breakpoint JTB 17597 218232_at complement component 1, q subcomponent, A chain C1QA 290 200762_at dihydropyrimidinase-like 2 DPYSL2 8862 209369_at annexin A3 ANXA3 12835 213454_at apoptosis-inducing, TAF9-like domain 1 APITD1 2327 202799_at ClpP caseinolytic peptidase, ATP-dependent, proteolytic subunit CLPP homolog (E. coli) 18314 218950_at centaurin, delta 3 CENTD3 70 200049_at MYST histone acetyltransferase 2 MYST2 8859 209366_x_at cytochrome b5 type A (microsomal) CYB5A 8144 208647_at farnesyl-diphosphate farnesyltransferase 1 FDFT1 12562 213180_s_at golgi SNAP receptor complex member 2 GOSR2 11893 212508_at modulator of apoptosis 1 MOAP1 16783 217418_x_at membrane-spanning 4-domains, subfamily A, member 1 MS4A1 10423 210976_s_at phosphofructokinase, muscle PFKM 4695 205168_at discoidin domain receptor tyrosine kinase 2 DDR2 1129 201601_x_at interferon induced transmembrane protein 1 (9-27) IFITM1 10109 210644_s_at leukocyte-associated immunoglobulin-like receptor 1 LAIR1 7350 207831_x_at deoxyhypusine synthase DHPS 15680 216308_x_at glyoxylate reductase/hydroxypyruvate reductase GRHPR 20105 220741_s_at pyrophosphatase (inorganic) 2 PPA2 13677 214298_x_at septin 6 6-Sep 1838 202310_s_at collagen, type I, alpha 1 COL1A1 7092 207571_x_at chromosome 1 open reading frame 38 C1orf38 17411 218046_s_at mitochondrial ribosomal protein S16 MRPS16 18734 219370_at reprimo, TP53 dependent G2 arrest mediator candidate RPRM 3432 203905_at poly(A)-specific ribonuclease (deadenylation nuclease) PARN 1376 201848_s_at BCL2/adenovirus E1B 19 kDa interacting protein 3 BNIP3 8813 209320_at adenylate cyclase 3 ADCY3 12178 212793_at dishevelled associated activator of morphogenesis 2 DAAM2 316 200788_s_at phosphoprotein enriched in astrocytes 15 PEA15 19357 219993_at SRY (sex determining region Y)-box 17 SOX17 3778 204251_s_at centrosomal protein 164 kDa CEP164 17500 218135_at ERGIC and golgi 2 ERGIC2 17890 218525_s_at hypoxia-inducible factor 1, alpha subunit inhibitor HIF1AN 10976 211571_s_at versican VCAN 13655 214276_at Kruppel-like factor 12 KLF12 1380 201852_x_at collagen, type III, alpha 1 (Ehlers-Danlos syndrome type IV, COL3A1 autosomal dominant) 193 200665_s_at secreted protein, acidic, cysteine-rich (osteonectin) SPARC 12801 213420_at DEAH (Asp-Glu-Ala-Asp/His) box polypeptide 57 DHX57 18564 219200_at FAST kinase domains 3 FASTKD3 1226 201698_s_at splicing factor, arginine/serine-rich 9 SFRS9 17970 218605_at transcription factor B2, mitochondrial TFB2M 13247 213867_x_at actin, beta ACTB 5528 206001_at neuropeptide Y NPY 9733 210253_at HIV-1 Tat interactive protein 2, 30 kDa HTATIP2 4142 204615_x_at isopentenyl-diphosphate delta isomerase 1 IDI1 1483 201955_at cyclin C CCNC 12276 212891_s_at growth arrest and DNA-damage-inducible, gamma interacting protein 1 GADD45GIP1 8081 208583_x_at histone cluster 1, H2ai /// histone cluster 1, H2ak /// histone cluster 1, HIST1H2AG /// HIST1H2AI /// H2aj /// histone cluster 1, H2al /// histone cluster 1, H2am /// histone HIST1H2AJ /// HIST1H2AK /// cluster 1, H3f /// histone cluster 1, H2ag HIST1H2AL /// HIST1H2AM /// HIST1H3F 22071 51200_at chromosome 19 open reading frame 60 C19orf60 8242 208747_s_at complement component 1, s subcomponent C1S 17782 218417_s_at hypothetical protein FLJ20489 FLJ20489 12535 213152_s_at splicing factor, arginine/serine-rich 2B SFRS2B 2493 202964_s_at regulatory factor X, 5 (influences HLA class II expression) RFX5 12628 213246_at chromosome 14 open reading frame 109 C14orf109 12378 212995_x_at family with sequence similarity 128, member B /// family with FAM128A /// FAM128B sequence similarity 128, member A 4983 205456_at CD3e molecule, epsilon (CD3-TCR complex) CD3E 20800 221437_s_at mitochondrial ribosomal protein S15 MRPS15 17553 218188_s_at translocase of inner mitochondrial membrane 13 homolog (yeast) TIMM13 9284 209796_s_at canopy 2 homolog (zebrafish) CNPY2 3498 203971_at solute carrier family 31 (copper transporters), member 1 SLC31A1 3533 204006_s_at Fc fragment of IgG, low affinity IIIa, receptor (CD16a) /// Fc FCGR3A /// FCGR3B fragment of IgG, low affinity IIIb, receptor (CD16b) 4611 205084_at B-cell receptor-associated protein 29 BCAP29 1618 202090_s_at ubiquinol-cytochrome c reductase, 6.4 kDa subunit UQCR 22086 52940_at single immunoglobulin and toll-interleukin 1 receptor (TIR) domain SIGIRR 12387 213004_at angiopoietin-like 2 ANGPTL2 3759 204232_at Fc fragment of IgE, high affinity I, receptor for; gamma polypeptide FCER1G 2671 203143_s_at KIAA0040 KIAA0040 2470 202941_at NADH dehydrogenase (ubiquinone) flavoprotein 2, 24 kDa NDUFV2 19458 220094_s_at coiled-coil domain containing 90A CCDC90A 8461 208966_x_at interferon, gamma-inducible protein 16 IFI16 12055 212670_at elastin (supravalvular aortic stenosis, Williams-Beuren syndrome) ELN 4315 204788_s_at protoporphyrinogen oxidase PPOX 3709 204182_s_at zinc finger and BTB domain containing 43 ZBTB43 3458 203931_s_at mitochondrial ribosomal protein L12 MRPL12 12370 212987_at F-box protein 9 FBXO9 4079 204552_at CDNA FLJ34214 fis, clone FCBBF3021807 -- 8928 209435_s_at rho/rac guanine nucleotide exchange factor (GEF) 2 ARHGEF2 10362 210915_x_at T cell receptor beta constant 1 TRBC1 14423 215049_x_at CD163 molecule CD163 15622 216250_s_at leupaxin LPXN 8707 209213_at carbonyl reductase 1 CBR1 1210 201682_at peptidase (mitochondrial processing) beta PMPCB 3719 204192_at CD37 molecule CD37 20674 221311_x_at LYR motif containing 2 LYRM2 2029 202501_at microtubule-associated protein, RP/EB family, member 2 MAPRE2 17085 217720_at coiled-coil-helix-coiled-coil-helix domain containing 2 CHCHD2 3051 203524_s_at mercaptopyruvate sulfurtransferase MPST 2482 202953_at complement component 1, q subcomponent, B chain C1QB 20963 221601_s_at Fas apoptotic inhibitory molecule 3 FAIM3 11378 211991_s_at major histocompatibility complex, class II, DP alpha 1 HLA-DPA1 18035 218671_s_at ATPase inhibitory factor 1 ATPIF1 5515 205988_at CD84 molecule CD84 4140 204613_at phospholipase C, gamma 2 (phosphatidylinositol-specific) PLCG2 18709 219345_at bolA homolog 1 (E. coli) BOLA1 8718 209224_s_at NADH dehydrogenase (ubiquinone) 1 alpha subcomplex, 2, 8 kDa NDUFA2 3765 204238_s_at chromosome 6 open reading frame 108 C6orf108 14108 214732_at Sp1 transcription factor SP1 156 200628_s_at tryptophanyl-tRNA synthetase WARS 9204 209716_at colony stimulating factor 1 (macrophage) CSF1 1849 202321_at geranylgeranyl diphosphate synthase 1 GGPS1 5506 205979_at secretoglobin, family 2A, member 1 SCGB2A1 13214 213834_at IQ motif and Sec7 domain 3 /// similar to IQ motif and Sec7 domain 3 IQSEC3 /// LOC100134209 /// /// similar to IQ motif and Sec7 domain-containing protein 3 LOC731035 2524 202995_s_at fibulin 1 FBLN1 432 200904_at major histocompatibility complex, class I, E HLA-E 21200 221840_at protein tyrosine phosphatase, receptor type, E PTPRE 4420 204893_s_at zinc finger, FYVE domain containing 9 ZFYVE9 10252 210792_x_at SIVA1, apoptosis-inducing factor SIVA1 2942 203415_at programmed cell death 6 PDCD6 1871 202343_x_at cytochrome c oxidase subunit Vb COX5B 4564 205037_at RAB, member of RAS oncogene family-like 4 RABL4 348 200820_at proteasome (prosome, macropain) 26S subunit, non-ATPase, 8 PSMD8 7242 207721_x_at histidine triad nucleotide binding protein 1 HINT1 14167 214791_at hypothetical protein BC004921 LOC93349 11453 212067_s_at complement component 1, r subcomponent C1R 9320 209834_at carbohydrate (chondroitin 6) sulfotransferase 3 CHST3 13271 213892_s_at adenine phosphoribosyltransferase APRT 21878 37408_at mannose receptor, C type 2 MRC2 4579 205052_at AU RNA binding protein/enoyl-Coenzyme A hydratase AUH 19285 219921_s_at dedicator of cytokinesis 5 DOCK5 9396 209910_at solute carrier family 25 (mitochondrial carrier; Graves disease SLC25A16 autoantigen), member 16 2756 203228_at platelet-activating factor acetylhydrolase, isoform Ib, gamma subunit PAFAH1B3 29 kDa 3948 204421_s_at fibroblast growth factor 2 (basic) FGF2 2753 203225_s_at riboflavin kinase RFK 19547 220183_s_at nudix (nucleoside diphosphate linked moiety X)-type motif 6 NUDT6 17338 217973_at dicarbonyl/L-xylulose reductase DCXR 19297 219933_at glutaredoxin 2 GLRX2 12655 213274_s_at cathepsin B CTSB 2324 202796_at synaptopodin SYNPO 12353 212970_at MRNA; cDNA DKFZp434E033 (from clone DKFZp434E033) -- 9239 209751_s_at trafficking protein particle complex 2 /// spondyloepiphyseal SEDLP /// TRAPPC2 /// ZNF547 dysplasia, late, pseudogene /// zinc finger protein 547 5356 205829_at hydroxysteroid (17-beta) dehydrogenase 1 HSD17B1 21763 32094_at carbohydrate (chondroitin 6) sulfotransferase 3 CHST3 11912 212527_at family with sequence similarity 152, member B FAM152B 7362 207843_x_at cytochrome b5 type A (microsomal) CYB5A 2166 202638_s_at intercellular adhesion molecule 1 (CD54), human rhinovirus receptor ICAM1 18699 219335_at armadillo repeat containing, X-linked 5 ARMCX5 2214 202686_s_at AXL receptor tyrosine kinase AXL 3146 203619_s_at Fas apoptotic inhibitory molecule 2 FAIM2 10156 210692_s_at solute carrier family 43, member 3 SLC43A3 13921 214542_x_at histone cluster 1, H3f HIST1H3F 17200 217835_x_at chromosome 20 open reading frame 24 C20orf24 3318 203791_at Dmx-like 1 DMXL1 2313 202785_at NADH dehydrogenase (ubiquinone) 1 alpha subcomplex, 7, 14.5 kDa NDUFA7 11873 212488_at collagen, type V, alpha 1 COL5A1 8284 208789_at polymerase I and transcript release factor PTRF 138 200610_s_at nucleolin NCL 18915 219551_at ELL associated factor 2 EAF2 99 200078_s_at ATPase, H+ transporting, lysosomal 21 kDa, V0 subunit b ATP6V0B 18869 219505_at cat eye syndrome chromosome region, candidate 1 CECR1 11466 212080_at Myeloid/lymphoid or mixed-lineage leukemia (trithorax homolog, MLL Drosophila)
21263 221903_s_at cylindromatosis (turban tumor syndrome) CYLD 19396 220032_at chromosome 7 open reading frame 58 C7orf58 577 201049_s_at ribosomal protein S18 /// hypothetical protein LOC100130553 LOC100130553 /// RPS18 17685 218320_s_at NADH dehydrogenase (ubiquinone) 1 beta subcomplex, 11, 17.3 kDa NDUFB11 958 201430_s_at dihydropyrimidinase-like 3 DPYSL3 4932 205405_at sema domain, seven thrombospondin repeats (type 1 and type 1-like), SEMA5A transmembrane domain (TM) and short cytoplasmic domain, (semaphorin) 5A 17488 218123_at chromosome 21 open reading frame 59 C21orf59 19293 219929_s_at zinc finger, FYVE domain containing 21 ZFYVE21 10963 211558_s_at deoxyhypusine synthase DHPS 20929 221566_s_at nucleolar protein 3 (apoptosis repressor with CARD domain) NOL3 5591 206065_s_at dihydropyrimidinase DPYS 3605 204078_at synaptonemal complex protein SC65 SC65 20306 220942_x_at chromosome 3 open reading frame 28 C3orf28 21615 222256_s_at hypothetical protein LOC8681 /// hypothetical protein LOC100137047 /// LOC100137047 LOC100137047-PLA2G4B 21151 221791_s_at coiled-coil domain containing 72 CCDC72 19362 219998_at galectin-related protein HSPC159 18747 219383_at protor-2 FLJ14213 21686 222327_x_at olfactory receptor, family 7, subfamily E, member 156 pseudogene OR7E156P 18018 218654_s_at mitochondrial ribosomal protein S33 MRPS33 8577 209083_at coronin, actin binding protein, 1A CORO1A 1614 202086_at myxovirus (influenza virus) resistance 1, interferon-inducible protein MX1 p78 (mouse) 13276 213897_s_at mitochondrial ribosomal protein L23 MRPL23 1602 202074_s_at optineurin OPTN 1825 202297_s_at RER1 retention in endoplasmic reticulum 1 homolog (S. cerevisiae) RER1 19961 220597_s_at ADP-ribosylation-like factor 6 interacting protein 4 /// 2-oxoglutarate ARL6IP4 /// OGFOD2 and iron-dependent oxygenase domain containing 2 4660 205133_s_at heat shock 10 kDa protein 1 (chaperonin 10) HSPE1 20597 221234_s_at BTB and CNC homology 1, basic leucine zipper transcription factor 2 BACH2 9980 210510_s_at neuropilin 1 NRP1 9539 210054_at chromosome 4 open reading frame 15 C4orf15 3044 203517_at metaxin 2 MTX2 642 201114_x_at proteasome (prosome, macropain) subunit, alpha type, 7 PSMA7 8436 208941_s_at selenophosphate synthetase 1 SEPHS1 663 201135_at enoyl Coenzyme A hydratase, short chain, 1, mitochondrial ECHS1 17571 218206_x_at SCAN domain containing 1 SCAND1 5031 205504_at Bruton agammaglobulinemia tyrosine kinase BTK 7346 207827_x_at synuclein, alpha (non A4 component of amyloid precursor) SNCA 843 201315_x_at interferon induced transmembrane protein 2 (1-8D) IFITM2 6097 206571_s_at mitogen-activated protein kinase kinase kinase kinase 4 MAP4K4 9403 209917_s_at TP53 activated protein 1 TP53AP1 3534 204007_at Fc fragment of IgG, low affinity IIIb, receptor (CD16b) FCGR3B 4569 205042_at glucosamine (UDP-N-acetyl)-2-epimerase/N-acetylmannosamine GNE kinase 11462 212076_at myeloid/lymphoid or mixed-lineage leukemia (trithorax homolog, MLL Drosophila) 3407 203880_at COX17 cytochrome c oxidase assembly homolog (S. cerevisiae) COX17 17307 217942_at mitochondrial ribosomal protein S35 MRPS35 4672 205145_s_at myosin, light chain 5, regulatory /// similar to Superfast myosin LOC649851 /// MYL5 regulatory light chain 2 (MyLC-2) (MYLC2) (Myosin regulatory light chain 5) 5313 205786_s_at integrin, alpha M (complement component 3 receptor 3 subunit) ITGAM 16890 217525_at olfactomedin-like 1 OLFML1 7255 207734_at lymphocyte transmembrane adaptor 1 LAX1 18299 218935_at EH-domain containing 3 EHD3 8716 209222_s_at oxysterol binding protein-like 2 OSBPL2 12207 212822_at HEG homolog 1 (zebrafish) HEG1 2160 202632_at DPH1 homolog (S. cerevisiae) /// candidate tumor suppressor in DPH1 /// OVCA2 ovarian cancer 2 3409 203882_at interferon regulatory factor 9 IRF9 10111 210646_x_at ribosomal protein L13a RPL13A 19017 219653_at LSM14B, SCD6 homolog B (S. cerevisiae) LSM14B 15019 215646_s_at versican VCAN 21485 222125_s_at hypoxia-inducible factor prolyl 4-hydroxylase PH-4 1451 201923_at peroxiredoxin 4 PRDX4 18677 219313_at GRAM domain containing 1C GRAMD1C 17706 218341_at phosphopantothenoylcysteine synthetase PPCS 21854 36830_at mitochondrial intermediate peptidase MIPEP 11328 211940_x_at H3 histone, family 3A /// H3 histone, family 3B (H3.3B) /// H3 H3F3A /// H3F3B /// LOC440926 histone, family 3A pseudogene 1886 202358_s_at sorting nexin 19 SNX19 2481 202952_s_at ADAM metallopeptidase domain 12 (meltrin alpha) ADAM12 6824 207300_s_at coagulation factor VII (serum prothrombin conversion accelerator) F7 21746 31637_s_at thyroid hormone receptor, alpha (erythroblastic leukemia viral (v-erb- NR1D1 /// THRA a) oncogene homolog, avian) /// nuclear receptor subfamily 1, group D, member 1 2917 203390_s_at kinesin family member 3C KIF3C 13901 214522_x_at histone cluster 1, H2ad /// histone cluster 1, H2bn /// histone cluster 1, HIST1H2AD /// HIST1H2BN /// H3a /// histone cluster 1, H3d /// histone cluster 1, H3c /// histone HIST1H3A /// HIST1H3B /// cluster 1, H3e /// histone cluster 1, H3i /// histone cluster 1, H3g /// HIST1H3C /// HIST1H3D /// histone cluster 1, H3j /// histone cluster 1, H3h /// histone cluster 1, HIST1H3E /// HIST1H3F /// H3b /// histone cluster 1, H3f HIST1H3G /// HIST1H3H /// HIST1H3I /// HIST1H3J 13113 213733_at myosin IF MYO1F 12668 213287_s_at keratin 10 (epidermolytic hyperkeratosis; keratosis palmaris et KRT10 plantaris) 20944 221582_at histone cluster 3, H2a HIST3H2A 9096 209606_at pleckstrin homology, Sec7 and coiled-coil domains, binding protein PSCDBP 21187 221827_at RanBP-type and C3HC4-type zinc finger containing 1 RBCK1 13051 213671_s_at methionyl-tRNA synthetase MARS 21839 36030_at intermediate filament family orphan IFFO 8640 209146_at sterol-C4-methyl oxidase-like SC4MOL 17692 218327_s_at synaptosomal-associated protein, 29 kDa SNAP29 4678 205151_s_at KIAA0644 gene product KIAA0644 17189 217824_at ubiquitin-conjugating enzyme E2, J1 (UBC6 homolog, yeast) UBE2J1 17568 218203_at asparagine-linked glycosylation 5 homolog (S. cerevisiae, dolichyl- ALG5 phosphate beta-glucosyltransferase) 17477 218112_at mitochondrial ribosomal protein S34 MRPS34 10354 210907_s_at programmed cell death 10 PDCD10 3440 203913_s_at hydroxyprostaglandin dehydrogenase 15-(NAD) HPGD 22195 78383_at similar to hCG1811779 LOC100129250 8971 209478_at stimulated by retinoic acid 13 homolog (mouse) STRA13 18286 218922_s_at LAG1 homolog, ceramide synthase 4 LASS4 4209 204682_at latent transforming growth factor beta binding protein 2 LTBP2 17765 218400_at 2'-5'-oligoadenylate synthetase 3, 100 kDa OAS3 10374 210927_x_at jumping translocation breakpoint JTB 2525 202996_at polymerase (DNA-directed), delta 4 POLD4 13653 214274_s_at acetyl-Coenzyme A acyltransferase 1 (peroxisomal 3-oxoacyl- ACAA1 Coenzyme A thiolase) 19241 219877_at zinc finger, matrin type 4 ZMAT4 19226 219862_s_at nuclear prelamin A recognition factor NARF 20640 221277_s_at pseudouridylate synthase 3 PUS3 15099 215726_s_at cytochrome b5 type A (microsomal) CYB5A 4691 205164_at glycine C-acetyltransferase (2-amino-3-ketobutyrate coenzyme A GCAT ligase) 8376 208881_x_at isopentenyl-diphosphate delta isomerase 1 IDI1 9365 209879_at selectin P ligand SELPLG 11619 212233_at microtubule-associated protein 1B MAP1B 3016 203489_at SIVA1, apoptosis-inducing factor SIVA1 18647 219283_at C1GALT1-specific chaperone 1 C1GALT1C1 21053 221692_s_at mitochondrial ribosomal protein L34 MRPL34 1707 202179_at bleomycin hydrolase BLMH 11732 212347_x_at MAX dimerization protein 4 MXD4 11576 212190_at serpin peptidase inhibitor, clade E (nexin, plasminogen activator SERPINE2 inhibitor type 1), member 2 17466 218101_s_at NADH dehydrogenase (ubiquinone) 1, subcomplex unknown, 2, NDUFC2 14.5 kDa 11577 212191_x_at ribosomal protein L13 RPL13 9435 209949_at neutrophil cytosolic factor 2 (65 kDa, chronic granulomatous disease, NCF2 autosomal 2) 8806 209312_x_at major histocompatibility complex, class II, DQ beta 1 /// major hCG_1998957 /// HLA-DQB1 /// histocompatibility complex, class II, DQ beta 2 /// major HLA-DQB2 /// HLA-DRB1 /// histocompatibility complex, class II, DR beta 1 /// major HLA-DRB2 /// HLA-DRB3 /// histocompatibility complex, class II, DR beta 2 (pseudogene) /// HLA-DRB4 /// HLA-DRB5 /// major histocompatibility complex, class II, DR beta 3 /// major LOC100133484 /// histocompatibility complex, class II, DR beta 4 /// major LOC100133583 /// histocompatibility complex, class II, DR beta 5 /// ribonuclease, LOC100133661 /// RNase A family, 2 (liver, eosinophil-derived neurotoxin) /// zinc LOC100133811 /// LOC730415 /// finger protein 749 /// hypothetical protein LOC730415 /// similar to RNASE2 /// ZNF749 Major histocompatibility complex, class II, DR beta 4 /// similar to major histocompatibility complex, class II, DQ beta 1 /// similar to HLA class II histocompatibility antigen, DR-W53 beta chain /// similar to hCG1992647 12466 213083_at solute carrier family 35, member D2 SLC35D2 3351 203824_at tetraspanin 8 TSPAN8 13603 214224_s_at protein (peptidylprolyl cis/trans isomerase) NIMA-interacting, 4 PIN4 (parvulin) 6874 207351_s_at SH2 domain protein 2A SH2D2A 17896 218531_at transmembrane protein 134 TMEM134 1421 201893_x_at decorin DCN 21204 221844_x_at CDNA clone IMAGE: 6208446 -- 4012 204485_s_at target of myb1 (chicken)-like 1 TOM1L1 241 200713_s_at microtubule-associated protein, RP/EB family, member 1 MAPRE1 3561 204034_at ethylmalonic encephalopathy 1 ETHE1 10458 211012_s_at promyelocytic leukemia /// hypothetical protein LOC161527 LOC161527 /// PML 11192 211796_s_at T cell receptor beta constant 1 TRBC1 10471 211025_x_at cytochrome c oxidase subunit Vb COX5B 13519 214140_at solute carrier family 25 (mitochondrial carrier; Graves disease SLC25A16 autoantigen), member 16 4395 204868_at immature colon carcinoma transcript 1 ICT1 5278 205751_at SH3-domain GRB2-like 2 SH3GL2 7212 207691_x_at ectonucleoside triphosphate diphosphohydrolase 1 ENTPD1 3969 204442_x_at latent transforming growth factor beta binding protein 4 LTBP4 11486 212100_s_at polymerase (DNA-directed), delta interacting protein 3 POLDIP3 607 201079_at synaptogyrin 2 SYNGR2 15854 216483_s_at chromosome 19 open reading frame 10 C19orf10 18483 219119_at LSM8 homolog, U6 small nuclear RNA associated (S. cerevisiae) LSM8 4132 204605_at cell growth regulator with ring finger domain 1 CGRRF1 4686 205159_at colony stimulating factor 2 receptor, beta, low-affinity (granulocyte- CSF2RB macrophage) 4874 205347_s_at thymosin-like 8 /// thymosin beta15b MGC39900 /// TMSL8 11632 212246_at multiple coagulation factor deficiency 2 MCFD2 18881 219517_at elongation factor RNA polymerase II-like 3 ELL3 9285 209797_at canopy 2 homolog (zebrafish) CNPY2 17263 217898_at chromosome 15 open reading frame 24 C15orf24 3362 203835_at leucine rich repeat containing 32 LRRC32 20972 221610_s_at signal transducing adaptor family member 2 STAP2 1315 201787_at fibulin 1 /// similar to Fibulin 1 FBLN1 /// LOC100133843 12031 212646_at raftlin, lipid raft linker 1 RFTN1 8995 209502_s_at BAI1-associated protein 2 BAIAP2 2385 202857_at canopy 2 homolog (zebrafish) CNPY2 18145 218781_at structural maintenance of chromosomes 6 SMC6 3143 203616_at polymerase (DNA directed), beta POLB 21790 336_at thromboxane A2 receptor TBXA2R 533 201005_at CD9 molecule CD9 17236 217871_s_at macrophage migration inhibitory factor (glycosylation-inhibiting MIF factor) 12631 213249_at F-box and leucine-rich repeat protein 7 FBXL7 21186 221826_at angel homolog 2 (Drosophila) ANGEL2 502 200974_at actin, alpha 2, smooth muscle, aorta ACTA2 17277 217912_at dihydrouridine synthase 1-like (S. cerevisiae) DUS1L 4348 204821_at butyrophilin, subfamily 3, member A3 BTN3A3
6549 207023_x_at keratin 10 (epidermolytic hyperkeratosis; keratosis palmaris et KRT10 plantaris) 8437 208942_s_at SEC62 homolog (S. cerevisiae) SEC62 10502 211058_x_at tubulin, alpha 1b TUBA1B 2499 202970_at dual-specificity tyrosine-(Y)-phosphorylation regulated kinase 2 DYRK2 8424 208929_x_at ribosomal protein L13 RPL13 18333 218969_at mitochondria-associated protein involved in granulocyte-macrophage Magmas colony-stimulating factor signal transduction 4336 204809_at ClpX caseinolytic peptidase X homolog (E. coli) CLPX 3843 204316_at regulator of G-protein signaling 10 RGS10 19859 220495_s_at thioredoxin domain containing 15 TXNDC15 17644 218279_s_at histone cluster 2, H2aa3 HIST2H2AA3 12581 213199_at C2 calcium-dependent domain containing 3 C2CD3 2268 202740_at aminoacylase 1 ACY1 12671 213290_at collagen, type VI, alpha 2 COL6A2 3381 203854_at complement factor I CFI 17662 218297_at chromosome 10 open reading frame 97 C10orf97 19698 220334_at regulator of G-protein signaling 17 RGS17 13343 213964_x_at CDNA FLJ37852 fis, clone BRSSN2014513 -- 3919 204392_at calcium/calmodulin-dependent protein kinase I CAMK1 15667 216295_s_at clathrin, light chain (Lca) CLTA 3174 203647_s_at ferredoxin 1 FDX1 13267 213888_s_at TRAF3 interacting protein 3 /// hypothetical protein LOC100133233 LOC100133233 /// TRAF3IP3 18230 218866_s_at polymerase (RNA) III (DNA directed) polypeptide K, 12.3 kDa POLR3K 18379 219015_s_at asparagine-linked glycosylation 13 homolog (S. cerevisiae) /// ALG13 /// CXorf45 chromosome X open reading frame 45 4092 204565_at thioesterase superfamily member 2 THEM2 8332 208837_at transmembrane emp24 protein transport domain containing 3 TMED3 6644 207118_s_at matrix metallopeptidase 23B /// matrix metallopeptidase 23A MMP23A /// MMP23B (pseudogene) 7131 207610_s_at egf-like module containing, mucin-like, hormone receptor-like 2 EMR2 21448 222088_s_at solute carrier family 2 (facilitated glucose transporter), member 3 /// SLC2A14 /// SLC2A3 solute carrier family 2 (facilitated glucose transporter), member 14 2106 202578_s_at DEAD (Asp-Glu-Ala-As) box polypeptide 19A DDX19A 11917 212532_s_at LSM12 homolog (S. cerevisiae) LSM12 9279 209791_at peptidyl arginine deiminase, type II PADI2 2680 203152_at mitochondrial ribosomal protein L40 MRPL40 9556 210072_at chemokine (C-C motif) ligand 19 CCL19 3725 204198_s_at runt-related transcription factor 3 RUNX3 6059 206533_at cholinergic receptor, nicotinic, alpha 5 CHRNA5 886 201358_s_at coatomer protein complex, subunit beta 1 COPB1 9222 209734_at NCK-associated protein 1-like NCKAP1L 3074 203547_at CD4 molecule CD4 11589 212203_x_at interferon induced transmembrane protein 3 (1-8U) IFITM3 4866 205339_at SCL/TAL1 interrupting locus STIL 20450 221087_s_at apolipoprotein L, 3 APOL3 12424 213041_s_at ATP synthase, H+ transporting, mitochondrial F1 complex, delta ATP5D subunit 13711 214332_s_at Ts translation elongation factor, mitochondrial TSFM 9369 209883_at glycosyltransferase 25 domain containing 2 GLT25D2 1128 201600_at prohibitin 2 PHB2 1484 201956_s_at glyceronephosphate O-acyltransferase GNPAT 215 200687_s_at splicing factor 3b, subunit 3, 130 kDa SF3B3 10831 211421_s_at ret proto-oncogene RET 3449 203922_s_at cytochrome b-245, beta polypeptide (chronic granulomatous disease) CYBB 2943 203416_at CD53 molecule CD53 5126 205599_at TNF receptor-associated factor 1 TRAF1 19082 219718_at FGGY carbohydrate kinase domain containing FGGY 15935 216565_x_at -- -- 11115 211714_x_at tubulin, beta TUBB 9299 209813_x_at TCR gamma alternate reading frame protein TARP 18452 219088_s_at zinc finger protein 576 ZNF576 9072 209582_s_at CD200 molecule CD200 65 200044_at splicing factor, arginine/serine-rich 9 SFRS9 9315 209829_at chromosome 6 open reading frame 32 C6orf32 3791 204264_at carnitine palmitoyltransferase II CPT2 19566 220202_s_at ring finger and CCCH-type zinc finger domains 2 RC3H2 5296 205769_at solute carrier family 27 (fatty acid transporter), member 2 SLC27A2 2165 202637_s_at intercellular adhesion molecule 1 (CD54), human rhinovirus receptor ICAM1 4147 204620_s_at versican VCAN 3193 203666_at chemokine (C--X--C motif) ligand 12 (stromal cell-derived factor 1) CXCL12 5187 205660_at 2'-5'-oligoadenylate synthetase-like OASL 7937 208438_s_at Gardner-Rasheed feline sarcoma viral (v-fgr) oncogene homolog FGR 17633 218268_at TBC1 domain family, member 15 TBC1D15 11307 211919_s_at chemokine (C--X--C motif) receptor 4 CXCR4 14338 214963_at nucleoporin 160 kDa NUP160 9032 209539_at Rac/Cdc42 guanine nucleotide exchange factor (GEF) 6 ARHGEF6 6860 207336_at SRY (sex determining region Y)-box 5 SOX5 4764 205237_at ficolin (collagen/fibrinogen domain containing) 1 FCN1 13842 214463_x_at histone cluster 1, H4j HIST1H4J 18481 219117_s_at FK506 binding protein 11, 19 kDa FKBP11 11641 212255_s_at ATPase, Ca++ transporting, type 2C, member 1 ATP2C1 675 201147_s_at TIMP metallopeptidase inhibitor 3 (Sorsby fundus dystrophy, TIMP3 pseudoinflammatory) 7916 208415_x_at inhibitor of growth family, member 1 ING1 3521 203994_s_at chromosome 21 open reading frame 2 C21orf2 10246 210786_s_at Friend leukemia virus integration 1 FLI1 17805 218440_at methylcrotonoyl-Coenzyme A carboxylase 1 (alpha) MCCC1 13737 214358_at acetyl-Coenzyme A carboxylase alpha ACACA 18440 219076_s_at peroxisomal membrane protein 2, 22 kDa PXMP2 9277 209789_at coronin, actin binding protein, 2B CORO2B 19509 220145_at microtubule-associated protein 9 MAP9 2752 203224_at riboflavin kinase RFK 19335 219971_at interleukin 21 receptor IL21R 13379 214000_s_at Regulator of G-protein signaling 10 RGS10 2843 203316_s_at small nuclear ribonucleoprotein polypeptide E SNRPE 959 201431_s_at dihydropyrimidinase-like 3 DPYSL3 1219 201691_s_at tumor protein D52 TPD52 12131 212746_s_at centrosomal protein 170 kDa CEP170 1837 202309_at methylenetetrahydrofolate dehydrogenase (NADP+ dependent) 1, MTHFD1 methenyltetrahydrofolate cyclohydrolase, formyltetrahydrofolate synthetase 3289 203762_s_at dynein, cytoplasmic 2, light intermediate chain 1 DYNC2LI1 1696 202168_at TAF9 RNA polymerase II, TATA box binding protein (TBP)- TAF9 associated factor, 32 kDa 2367 202839_s_at NADH dehydrogenase (ubiquinone) 1 beta subcomplex, 7, 18 kDa NDUFB7 634 201106_at glutathione peroxidase 4 (phospholipid hydroperoxidase) GPX4 18457 219093_at phosphotyrosine interaction domain containing 1 PID1 19064 219700_at plexin domain containing 1 PLXDC1 4512 204985_s_at trafficking protein particle complex 6A TRAPPC6A 13631 214252_s_at ceroid-lipofuscinosis, neuronal 5 CLN5 20380 221016_s_at transcription factor 7-like 1 (T-cell specific, HMG-box) TCF7L1 3050 203523_at lymphocyte-specific protein 1 LSP1 1666 202138_x_at JTV1 gene JTV1 2915 203388_at arrestin, beta 2 ARRB2 1191 201663_s_at structural maintenance of chromosomes 4 SMC4 2425 202897_at signal-regulatory protein alpha SIRPA 11834 212449_s_at lysophospholipase I LYPLA1 14070 214694_at myosin phosphatase-Rho interacting protein /// similar to Myosin LOC729143 /// M-RIP phosphatase Rho-interacting protein (Rho-interacting protein 3) (M- RIP) (RIP3) (p116Rip) 10128 210663_s_at kynureninase (L-kynurenine hydrolase) KYNU 17957 218592_s_at cat eye syndrome chromosome region, candidate 5 CECR5 2747 203219_s_at adenine phosphoribosyltransferase APRT 4923 205396_at SMAD family member 3 SMAD3 13528 214149_s_at ATPase, H+ transporting, lysosomal 9 kDa, V0 subunit e1 ATP6V0E1 9209 209721_s_at intermediate filament family orphan IFFO 1708 202180_s_at major vault protein MVP 11871 212486_s_at FYN oncogene related to SRC, FGR, YES FYN 10719 211296_x_at ribosomal protein S27a /// ubiquitin B /// ubiquitin C RPS27A /// UBB /// UBC 2625 203096_s_at Rap guanine nucleotide exchange factor (GEF) 2 RAPGEF2 21046 221685_s_at coiled-coil domain containing 99 CCDC99 9080 209590_at bone morphogenetic protein 7 (osteogenic protein 1) BMP7 17132 217767_at complement component 3 C3 16391 217021_at cytochrome b5 type A (microsomal) CYB5A 12705 213324_at v-src sarcoma (Schmidt-Ruppin A-2) viral oncogene homolog (avian) SRC 4937 205410_s_at ATPase, Ca++ transporting, plasma membrane 4 ATP2B4 4005 204478_s_at RAB interacting factor RABIF 2450 202921_s_at ankyrin 2, neuronal ANK2 17587 218222_x_at aryl hydrocarbon receptor nuclear translocator ARNT 11739 212354_at sulfatase 1 SULF1 17563 218198_at DEAH (Asp-Glu-Ala-His) box polypeptide 32 DHX32 2998 203471_s_at pleckstrin PLEK 817 201289_at cysteine-rich, angiogenic inducer, 61 CYR61 13208 213828_x_at H3 histone, family 3A /// H3 histone, family 3B (H3.3B) /// H3 H3F3A /// H3F3B /// LOC440926 histone, family 3A pseudogene 2643 203114_at Sjogren syndrome/scleroderma autoantigen 1 SSSCA1 11155 211755_s_at ATP synthase, H+ transporting, mitochondrial F0 complex, subunit ATP5F1 B1 313 200785_s_at low density lipoprotein-related protein 1 (alpha-2-macroglobulin LOC100134190 /// LRP1 receptor) /// similar to low density lipoprotein-related protein 1 (alpha-2-macroglobulin receptor) 3107 203580_s_at solute carrier family 7 (cationic amino acid transporter, y+ system), SLC7A6 /// TRPV6 member 6 /// transient receptor potential cation channel, subfamily V, member 6 1797 202269_x_at guanylate binding protein 1, interferon-inducible, 67 kDa GBP1 6616 207090_x_at zinc finger protein 30 homolog (mouse) ZFP30 22150 61734_at reticulocalbin 3, EF-hand calcium binding domain RCN3 1605 202077_at NADH dehydrogenase (ubiquinone) 1, alpha/beta subcomplex, 1, NDUFAB1 8 kDa 9392 209906_at complement component 3a receptor 1 C3AR1 11125 211725_s_at BH3 interacting domain death agonist BID 22063 50374_at chromosome 17 open reading frame 90 C17orf90 11116 211715_s_at 3-hydroxybutyrate dehydrogenase, type 1 BDH1 6371 206845_s_at ring finger protein 40 RNF40 3047 203520_s_at zinc finger protein 318 ZNF318 2069 202541_at small inducible cytokine subfamily E, member 1 (endothelial SCYE1 monocyte-activating) 11842 212457_at transcription factor binding to IGHM enhancer 3 TFE3 22172 64942_at G protein-coupled receptor 153 GPR153 4297 204770_at transporter 2, ATP-binding cassette, sub-family B (MDR/TAP) TAP2 3406 203879_at phosphoinositide-3-kinase, catalytic, delta polypeptide PIK3CD 10098 210633_x_at keratin 10 (epidermolytic hyperkeratosis; keratosis palmaris et KRT10 plantaris) 8568 209074_s_at family with sequence similarity 107, member A FAM107A 8970 209477_at emerin (Emery-Dreifuss muscular dystrophy) EMD 12512 213129_s_at glycine cleavage system protein H (aminomethyl carrier) /// similar to GCSH /// LOC730107 Glycine cleavage system H protein, mitochondrial 14534 215160_x_at similar to FRG1 protein (FSHD region gene 1 protein) LOC642236 14490 215116_s_at dynamin 1 DNM1 4994 205467_at caspase 10, apoptosis-related cysteine peptidase CASP10 8941 209448_at HIV-1 Tat interactive protein 2, 30 kDa HTATIP2 10061 210596_at magnesium transporter 1 /// similar to PRO0756 LOC100129513 /// LOC100133276 /// MAGT1 3441 203914_x_at hydroxyprostaglandin dehydrogenase 15-(NAD) HPGD
[0722] The multiple linear regression method was extended to divide tumor cases into those with good outcome (never relapsed following surgery, i.e. appear to be cured) from bad outcome, i.e. in several months or years following surgery their tumor reappeared. The genes that are specifically differentially expressed in the bad outcome cases were identified (the list). These genes or a subset of them may be measure in a new patient to determine whether he matches a good or bad outcome profile. In summary, differences in RNA levels that correlated with relapse versus non-relapse were calculated for four expression microarray data sets (data set 1, 2, 3 and 4) using multiple linear regression models which used these percentages in a linear model. Many of these relapse-associated changes in transcript levels occurred in adjacent stroma. Data set 3 does not have pathologist's estimation of tissue percentage and in silico tissue prediction model was used to predict tissue percentages. The identified genes are listed in Tables 35-42.
TABLE-US-00037 Lengthy table referenced here US20140011861A1-20140109-T00001 Please refer to the end of the specification for access instructions.
Other Embodiments
[0723] It is to be understood that while the invention has been described in conjunction with the detailed description thereof, the foregoing description is intended to illustrate and not limit the scope of the invention, which is defined by the scope of the appended claims. Other aspects, advantages, and modifications are within the scope of the following claims.
TABLE-US-LTS-00001 LENGTHY TABLES The patent application contains a lengthy table section. A copy of the table is available in electronic form from the USPTO web site (http://seqdata.uspto.gov/?pageRequest=docDetail&DocID=US20140011861A1). An electronic copy of the table will also be available from the USPTO upon request and payment of the fee set forth in 37 CFR 1.19(b)(3).
User Contributions:
Comment about this patent or add new information about this topic:
| People who visited this patent also read: | |
| Patent application number | Title |
|---|---|
| 20140045591 | GAME SYSTEM, GAME CONTROL METHOD, AND INFORMATION STORAGE MEDIUM |
| 20140045590 | DRAWING GAME WITH RANDOMIZED DRAWING PROMPTS |
| 20140045589 | DYNAMIC GAMEPLAY ADVERTISEMENTS |
| 20140045588 | PARI-MUTUEL WAGERING SYSTEM AND METHOD |
| 20140045587 | WAGERING GAMES, SYSTEMS, AND METHODS WITH LIMITED PLAY HIGH FREQUENCY OUTCOME ASSOCIATED JACKPOTS |
Images included with this patent application:
 |  |
 |  |
 |  |
 |  |
 |  |
 |  |
 |  |
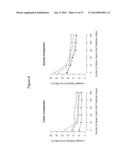 |  |
 |  |
 |  |
 |  |
 |  |
 | 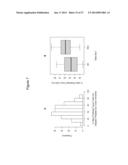 |
 |  |
 |  |
 | 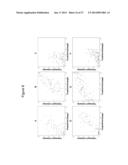 |
 |  |
 |  |
 |  |
 | 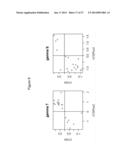 |
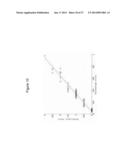 |  |
 | 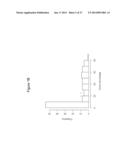 |
 | 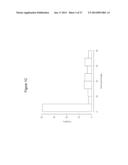 |
 | 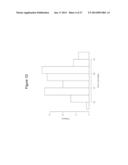 |
 | 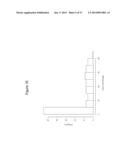 |
 | 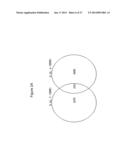 |
 | 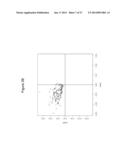 |
 | 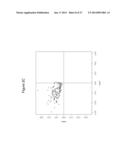 |
 | 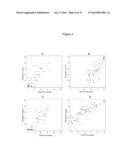 |
 |  |
 |  |
 |  |
 |  |
 |  |
 |  |
 |  |
 |  |
 |  |
 |  |
 | 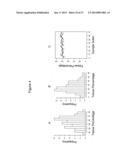 |
 |  |
 |  |
 |  |
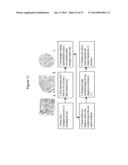 |  |
 |  |
 |  |
 |  |
 | 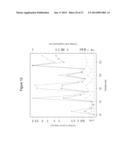 |
 |  |
 |  |
 |  |
 |  |
 |  |
 |  |
 |  |
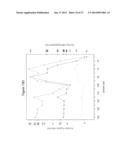 | 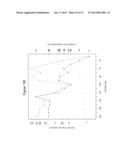 |
 | 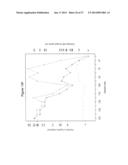 |
 | 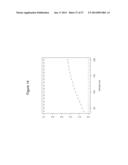 |
 |  |
 |  |
 | 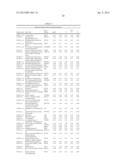 |
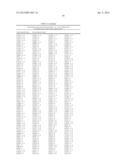 | 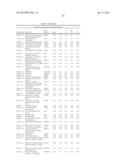 |
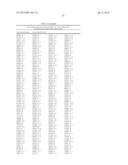 |  |
 |  |
 |  |
 |  |
 |  |
 |  |
 |  |
 |  |
 |  |
 |  |
 |  |
 |  |
 |  |
 |  |
 |  |
| Similar patent applications: | |
| Date | Title |
|---|---|
| 2009-02-12 | Method for making a silica glass crucible |
| 2008-09-25 | Waterproof part |
| 2009-02-12 | Esp motor design |
| 2009-02-12 | Walk and roll robot |
| 2009-02-12 | Portable media player |
| New patent applications in this class: | |
| Date | Title |
|---|---|
| 2022-05-05 | Kit, device, and method for detecting uterine leiomyosarcoma |
| 2022-05-05 | Prevention or treatment of fibrotic disease |
| 2022-05-05 | Compositions for suppressing trim28 and uses thereof |
| 2022-05-05 | Immunostimulatory bacteria engineered to colonize tumors, tumor-resident immune cells, and the tumor microenvironment |
| 2022-05-05 | Anti-mirna carrier conjugated with a peptide binding to a cancer cell surface protein and use thereof |
| New patent applications from these inventors: | |
| Date | Title |
|---|---|
| 2016-05-19 | Stroma biomarkers for the diagnosis of prostate cancer |
| 2015-12-10 | Methods and devices for in situ synthesis of metal oxides in carbon nanotube arrays |
| 2015-08-06 | Biomarkers for prostate cancer prognosis |
| Top Inventors for class "Drug, bio-affecting and body treating compositions" | |
| Rank | Inventor's name |
|---|---|
| 1 | Anthony W. Czarnik |
| 2 | Ulrike Wachendorff-Neumann |
| 3 | Ken Chow |
| 4 | John E. Donello |
| 5 | Rajinder Singh |