Patent application title: METHODS OF DETECTION OF CANCER USING PEPTIDE PROFILES
Inventors:
Paul Tempst (New York, NY, US)
Josep Villanueva (Barcelona, ES)
Assignees:
SLOAN-KETTERING INSTITUTE FOR CANCER RESEARCH
IPC8 Class: AC40B3004FI
USPC Class:
506 9
Class name: Combinatorial chemistry technology: method, library, apparatus method of screening a library by measuring the ability to specifically bind a target molecule (e.g., antibody-antigen binding, receptor-ligand binding, etc.)
Publication date: 2011-12-22
Patent application number: 20110312522
Abstract:
The disclosed methods address the identification and monitoring of cancer
in a subject using serum peptide profiles. Such profiles allow the
detection of the differential presence of certain serum peptide markers
in comparison with controls. The profiles can be determined employing
mass spectrometry.Claims:
1. A method of identifying cancer of the prostate in a subject comprising
detecting an increase in a complement C3f peptide or a fragment thereof,
a ITIH4, clusterin, complement C4-alpha, kininogen or factor XIII peptide
fragment, or any combination thereof in a biological sample obtained from
the subject, thereby identifying cancer of the prostate in the subject.
2. The method of claim 1, further comprising detecting a decrease in fibrinopeptideA peptide or a fragment thereof, or a fibrinogen-alpha peptide fragment, or any combination thereof in a biological sample obtained from the subject.
3. A method of identifying cancer of the bladder in a subject comprising detecting an increase in a complement C3f peptide or a fragment thereof, a ITIH4, clusterin, complement C4-alpha, fibrinogen-alpha, APO A-I, APO A-IV, APO E or kininogen peptide fragment, or any combination thereof in a biological sample obtained from the subject, thereby identifying cancer of the bladder in the subject.
4. The method of claim 3, further comprising detecting a decrease in a fibrinopeptideA peptide, bradykinin peptide, or a fragment thereof, a C4-alpha, ITIH4, or fibrinogen-alpha peptide fragment, or any combination thereof in a biological sample obtained from the subject.
5. A method of identifying cancer of the breast in a subject comprising detecting an increase in a fibrinopeptideA peptide, bradykinin peptide, or a fragment thereof, a ITIH4, complement C4-alpha, fibrinogen-alpha, APO A-IV, factorXIII or transthyretin peptide fragment, or any combination thereof in a biological sample obtained from the subject, thereby identifying cancer of the breast in the subject.
6. The method of claim 5, further comprising detecting a decrease in a fibrinopeptideA peptide, complement C3f peptide, or a fragment thereof, or any combination thereof in a biological sample obtained from the subject.
7. A method of identifying cancer of the prostate in a subject comprising detecting a decrease in a fibrinopeptideA or a fragment thereof and a fibrinogen-alpha peptide fragment and an increase in a complement C3f peptide or a fragment thereof, a ITIH4, clusterin, complement C4-alpha, kininogen and factor XIII peptide fragment in a biological sample obtained from the subject, thereby identifying cancer of the prostate in the subject.
8. A method of identifying cancer of the bladder in a subject comprising detecting a decrease in a fibrinopeptideA peptide, bradykinin peptide, or a fragment thereof, a C4-alpha, ITIH4, and fibrinogen-alpha peptide fragment and an increase in a complement C3f peptide or a fragment thereof, a ITIH4, clusterin, complement C4-alpha, fibrinogen-alpha, APO A-I, APO A-IV, APO E and kininogen peptide fragment in a biological sample obtained from the subject, thereby identifying cancer of the bladder in the subject.
9. A method of identifying cancer of the breast in a subject comprising detecting a decrease in a fibrinopeptideA peptide and complement C3f peptide, or a fragment thereof, and an increase in a fibrinopeptideA peptide, bradykinin peptide, or a fragment thereof, a ITIH4, complement C4-alpha, fibrinogen-alpha, APO A-IV, factor XIII and transthyretin peptide fragment in a biological sample obtained from the subject, thereby identifying cancer of the breast in the subject.
10. The method of claim 7, wherein the fibrinopeptideA peptide fragment is selected from the group consisting of DSGEGDFLAEGGGVR (SEQ ID NO. 1), SGEGDFLAEGGGVR (SEQ ID NO. 2), GEGDFLAEGGGVR (SEQ ID NO. 3), EGDFLAEGGGVR (SEQ ID NO. 4), GDFLAEGGGVR (SEQ ID NO. 5), DFLAEGGGVR (SEQ ID NO. 6) and LAEGGGVR (SEQ ID NO. 25).
11. The method of claim 8, wherein the fibrinopeptideA peptide fragment is selected from the group consisting of DSGEGDFLAEGGGVR (SEQ ID NO. 1), SGEGDFLAEGGGVR (SEQ ID NO. 2), GEGDFLAEGGGVR (SEQ ID NO. 3), EGDFLAEGGGVR (SEQ ID NO. 4), GDFLAEGGGVR (SEQ ID NO. 5), DFLAEGGGVR (SEQ ID NO. 6), FLAEGGGVR (SEQ ID NO. 24) and LAEGGGVR (SEQ ID NO. 25).
12. The method of claim 9, wherein the fibrinopeptideA peptide fragment that is decreased is selected from the group consisting of SGEGDFLAEGGGVR (SEQ ID NO. 2) and GEGDFLAEGGGVR (SEQ ID NO. 3) and the fibrinopeptideA fragment that is increased is FLAEGGGVR (SEQ ID NO. 24).
13. The method of claim 7, wherein the complement C3f peptide fragment is selected from the group consisting of, SSKITHRIHWESASLL (SEQ ID NO. 8), SKITHRIHWESASLL (SEQ ID NO. 9), KITHRIHWESASLL (SEQ ID NO. 10), THRIHWESASLL (SEQ ID NO. 11), and IHWESASLL (SEQ ID NO. 28).
14. The method of claim 8, wherein the complement C3f peptide fragment is selected from the group consisting of SSKITHRIHWESASLL (SEQ ID NO. 8), SKITHRIHWESASLL (SEQ ID NO. 9), KITHRIHWESASLL (SEQ ID NO. 10), THRIHWESASLL (SEQ ID NO. 11), HWESASLL (SEQ ID NO. 12), RIHWESASLL (SEQ ID NO. 27), IHWESASLL (SEQ ID NO. 28) and SSKITHRIHWESASL (SEQ ID NO. 29).
15. The method of claim 9, wherein the complement C3f peptide fragment is selected from the group consisting of SSKITHRIHWESASLL (SEQ ID NO. 8), HWESASLL (SEQ ID NO. 12), and ITHRIHWESASLL (SEQ ID NO. 26).
16. The method of claim 7, wherein the ITIH4 peptide fragment is selected from the group consisting of PGVLSSRQLGLPGPPDVPDHAAYHPF (SEQ ID NO. 13), SRQLGLPGPPDVPDHAAYHPF (SEQ ID NO. 15), HAAYHPFR (SEQ ID NO. 34), QLGLPGPPDVPDHAAYHPFR (SEQ ID NO. 35), HAAYHPF (SEQ ID NO. 39) NVHSGSTFFKYYLQGAKIPKPEASFSPR (SEQ ID NO. 40) and NVHSAGAAGSRMNFRPGVLSS (SEQ ID NO. 41).
17. The method of claim 8, wherein the ITIH4 peptide fragment that is increased is selected from the group consisting of PGVLSSRQLGLPGPPDVPDHAAYHPF (SEQ ID NO. 13), SRQLGLPGPPDVPDHAAYHPF (SEQ ID NO. 15), HAAYHPFR (SEQ ID NO. 34), QAGAAGSRMNFRPGVLSSRQLGLPGPPDVPDHAAYHPF (SEQ ID NO. 36), MNFRPGVLSSRQLGLPGPPDVPDHAAYHPF (SEQ ID NO. 37), NVHSGSTFFKYYLQGAKIPKPEASFSPR (SEQ ID NO. 40) and NVHSAGAAGSRMNFRPGVLSS (SEQ ID NO. 41), and the ITIH4 peptide fragment that is decreased is selected from the group consisting of GVLSSRQLGLPGPPDVPDHAAYHPF (SEQ ID NO. 14) and HAAYHPF (SEQ ID NO. 39).
18. The method of claim 9, wherein the ITIH4 peptide fragment is selected from the group consisting of GLPGPPDVPDHAAYHPF (SEQ ID NO. 16), HAAYHPFR (SEQ ID NO. 34), QLGLPGPPDVPDHAAYHPFR (SEQ ID NO. 35), SSRQLGLPGPPDVPDHAAYHPF (SEQ ID NO. 38) and NVHSAGAAGSRMNFRPGVLSS (SEQ ID NO. 41).
19. The method of claim 7, wherein the clusterin peptide fragment is HFFFPKSRIV (SEQ ID NO. 17).
20. The method of claim 8, wherein the clusterin peptide fragment is selected from the group consisting of HFFFPKSRIV (SEQ ID NO. 17) and HFFFPK (SEQ ID NO. 18).
21. The method of claim 8, wherein the bradykinin peptide fragment is selected from the group consisting of RPPGFSPFR (SEQ ID NO. 19) and RPPGFSPF (SEQ ID NO. 20).
22. The method of claim 7, wherein the complement C4-alpha peptide fragment is GLEEELQFSLGSKINVKVGGNS (SEQ ID NO. 23).
23. The method of claim 8, wherein the complement C4-alpha peptide fragment that is increased is selected from the group consisting of RNGFKSHALQLNNRQI (SEQ ID NO. 21), GLEEELQFSLGSKINVKVGGNS (SEQ ID NO. 23), NGFKSHALQLNNR (SEQ ID NO. 31), and the complement C4-alpha peptide fragment that is decreased is GLEEELQFSLGSKINV (SEQ ID NO. 33).
24. The method of claim 9, wherein the complement C4-alpha peptide fragment is selected from the group consisting of RNGFKSHALQLNNRQI (SEQ ID NO. 21), NGFKSHALQLNNRQI (SEQ ID NO. 22), GLEEELQFSLGSKINVKVGGNS (SEQ ID NO. 23), NGFKSHALQLNNRQ (SEQ ID NO. 30), GLEEELQFSLGSKINVKVGGNSKGTL (SEQ ID NO. 32) and GLEEELQFSLGSKINV (SEQ ID NO. 33).
25. The method of claim 7, wherein the fibrinogen-alpha peptide fragment is selected from the group consisting of SSSYSKQFTSSTSYNRGDSTFESKSYKMA (SEQ ID NO. 55) and SSSYSKQFTSSTSYNRGDSTFESKSYKM (SEQ ID NO. 56).
26. The method of claim 8, wherein the fibrinogen-alpha peptide fragment that is increased is selected from the group consisting of SSSYSKQFTSSTSYNRGDSTFESKSYKMA (SEQ ID NO. 55), SSSYSKQFTSSTSYNRGDSTFESKSYKM (SEQ ID NO. 56), SSSYSKQFTSSTSYNRGDSTFESKSY (SEQ ID NO. 57), SSSYSKQFTSSTSYNRGDSTFESKS (SEQ ID NO. 58), and SSYSKQFTSSTSYNRGDSTFE (SEQ ID NO. 60), and the fibrinogen-alpha peptide fragment that is decreased is GSESGIFTNTKESSSHHPGIAEFPSRG (SEQ ID NO. 61).
27. The method of claim 9, wherein the fibrinogen-alpha peptide fragment is selected from the group consisting of SSYSKQFTSSTSYNRGDSTFE (SEQ ID NO. 60) and DEAGSEADHEGTHSTKRGHAKSRPV (SEQ ID NO. 62).
28. The method of claim 7, wherein the kininogen peptide fragment is NLGHGHKHERDQGHGHQ (SEQ ID NO. 52).
29. The method of claim 8, wherein the kininogen peptide fragment is selected from the group consisting of KHNLGHGHKHERDQGHGHQ (SEQ ID NO. 51) or NLGHGHKHERDQGHGHQ (SEQ ID NO. 52).
30. The method of claim 8, wherein the APO A-I peptide fragment is selected from the group consisting of QGLLPVLESFKVSFLSALEEYTKKLNTQ (SEQ ID NO. 42), VSFLSALEEYTKKLNTQ (SEQ ID NO. 43) and ATEHLSTLSEKAKPALEDL (SEQ ID NO. 44).
31. The method of claim 8, wherein the APO A-IV peptide fragment is selected from the group consisting of GNTEGLQKSLAELGGHLDQQVEEFR (SEQ ID NO. 46), SLAELGGHLDQQVEEFR (SEQ ID NO. 47) and SLAELGGHLDQQVEEF (SEQ ID NO. 48).
32. The method of claim 9, wherein the APO A-IV peptide fragment is ISASAEELRQRLAPLAEDVRGNL (SEQ ID NO. 45).
33. The method of claim 8, wherein the APO E peptide fragment is selected from the group consisting of AATVGSLAGQPLQERAQAWGERLR (SEQ ID NO. 49) and AATVGSLAGQPLQERAQAWGERL (SEQ ID NO. 50).
34. The method of claim 7, wherein the factor XIII peptide fragment is AVPPNNSNAAEDDLPTVELQGVVPR (SEQ ID NO. 53).
35. The method of claim 9, wherein the factor XIII peptide fragment is AVPPNNSNAAEDDLPTVELQGVVPR (SEQ ID NO. 53).
36. The method of claim 9, wherein the transthyretin peptide fragment is ALGISPFHEHAEVVFTANDSGPR (SEQ ID NO. 54).
37. The method of claim 1, wherein the biological sample comprises plasma or serum or a preparation thereof.
38. The method of claim 1, wherein the detecting comprises analyzing the biological sample, or a preparation thereof using mass spectrometry.
39. The method of claim 38, wherein the mass spectrometry is MALDI TOF mass spectrometry.
40. The method of claim 38, wherein the mass spectrometry is Fourier-transform ion cyclotron resonance mass spectrometry.
41. The method of claim 38, wherein the mass spectrometry is electrospray ionization mass spectrometry.
42. The method of claim 1, wherein the detecting comprises analyzing the biological sample or a preparation thereof on a solid support, wherein peptides in the sample bind to the solid support.
43. An isolated or identified peptide profile indicating cancer of the prostate comprising an increased amount of peptides or peptide fragments selected from the group consisting of SSKITHRIHWESASLL (SEQ ID NO. 8), SKITHRIHWESASLL (SEQ ID NO. 9), KITHRIHWESASLL (SEQ ID NO. 10), THRIHWESASLL (SEQ ID NO. 11), PGVLSSRQLGLPGPPDVPDHAAYHPF (SEQ ID NO. 13), SRQLGLPGPPDVPDHAAYHPF (SEQ ID NO. 15), HFFFPKSRIV (SEQ ID NO. 17), and GLEEELQFSLGSKINVKVGGNS (SEQ ID NO. 23), IHWESASLL (SEQ ID NO. 28), HAAYHPFR (SEQ ID NO. 34), QLGLPGPPDVPDHAAYHPFR (SEQ ID NO. 35), HAAYHPF (SEQ ID NO. 39) NVHSGSTFFKYYLQGAKIPKPEASFSPR (SEQ ID NO. 40) NVHSAGAAGSRMNFRPGVLSS (SEQ ID NO. 41), NLGHGHKHERDQGHGHQ (SEQ ID NO. 52), AVPPNNSNAAEDDLPTVELQGWPR (SEQ ID NO. 53) and combinations thereof.
44. (canceled)
45. An isolated or identified peptide profile indicating cancer of the bladder comprising an increased amount of peptides or peptide fragments selected from the group consisting of SSKITHRIHWESASLL (SEQ ID NO. 8), SKITHRIHWESASLL (SEQ ID NO. 9), KITHRIHWESASLL (SEQ ID NO. 10), THRIHWESASLL (SEQ ID NO. 11), HWESASLL (SEQ ID NO. 12), PGVLSSRQLGLPGPPDVPDHAAYHPF (SEQ ID NO. 13), SRQLGLPGPPDVPDHAAYHPF (SEQ ID NO. 15), HFFFPKSRIV (SEQ ID NO. 17), HFFFPK (SEQ ID NO. 18), RNGFKSHALQLNNRQI (SEQ ID NO. 21), GLEEELQFSLGSKINVKVGGNS (SEQ ID NO. 23), (SEQ ID NO. 27), IHWESASLL (SEQ ID NO. 28), SSKITHRIHWESASL (SEQ ID NO. 29), NGFKSHALQLNNR (SEQ ID NO. 31), HAAYHPFR (SEQ ID NO. 34), QAGAAGSRMNFRPGVLSSRQLGLPGPPDVPDHAAYHPF (SEQ ID NO. 36), MNFRPGVLSSRQLGLPGPPDVPDHAAYHPF (SEQ ID NO. 37), NVHSGSTFFKYYLQGAKIPKPEASFSPR (SEQ ID NO. 40), NVHSAGAAGSRMNFRPGVLSS (SEQ ID NO. 41), QGLLPVLESFKVSFLSALEEYTKKLNTQ (SEQ ID NO. 42), VSFLSALEEYTKKLNTQ (SEQ ID NO. 43), ATEHLSTLSEKAKPALEDL (SEQ ID NO. 44), GNTEGLQKSLAELGGHLDQQVEEFR (SEQ ID NO. 46), SLAELGGHLDQQVEEFR (SEQ ID NO. 47), SLAELGGHLDQQVEEF (SEQ ID NO. 48), AATVGSLAGQPLQERAQAWGERLR (SEQ ID NO. 49), AATVGSLAGQPLQERAQAWGERL (SEQ ID NO. 50), KHNLGHGHKHERDQGHGHQ (SEQ ID NO. 51), NLGHGHKHERDQGHGHQ (SEQ ID NO. 52), GSESGIFTNTKESSSHHPGIAEFPSRG (SEQ ID NO. 61) and combinations thereof.
46. (canceled)
47. An isolated or identified peptide profile indicating cancer of the breast comprising an increased amount of peptides or peptide fragments selected from the group consisting of GLPGPPDVPDHAAYHPF (SEQ ID NO. 16), RPPGFSPFR (SEQ ID NO. 19), RPPGFSPF (SEQ ID NO. 20), RNGFKSHALQLNNRQI (SEQ ID NO. 21), NGFKSHALQLNNRQI (SEQ ID NO. 22) GLEEELQFSLGSKINVKVGGNS (SEQ ID NO. 23), FLAEGGGVR (SEQ ID NO. 24), NGFKSHALQLNNRQ (SEQ ID NO. 30), GLEEELQFSLGSKINVKVGGNSKGTL (SEQ ID NO. 32), GLEEELQFSLGSKINV (SEQ ID NO. 33), HAAYHPFR (SEQ ID NO. 34), QLGLPGPPDVPDHAAYHPFR (SEQ ID NO. 35), SSRQLGLPGPPDVPDHAAYHPF (SEQ ID NO. 38), NVHSAGAAGSRMNFRPGVLSS (SEQ ID NO. 41), ISASAEELRQRLAPLAEDVRGNL (SEQ ID NO. 45), AVPPNNSNAAEDDLPTVELQGVVPR (SEQ ID NO. 53), ALGISPFHEHAEVVFTANDSGPR (SEQ ID NO. 54), SSYSKQFTSSTSYNRGDSTFE (SEQ ID NO. 60) DEAGSEADHEGTHSTKRGHAKSRPV (SEQ ID NO. 62) and combinations thereof.
48-50. (canceled)
51. A method of generating a peptide profile of a subject having, or at risk of having, cancer of the prostate, comprising the steps of: i) combining an exogenous peptide selected from the group consisting of a complement C3f, ITIH4, clusterin, complement C4-alpha, fibrinopeptide A kininogen, factor XIII, fibrinogenA peptide and combinations thereof with a biological sample from the subject; and ii) proteolytically digesting a peptide of step i), thereby generating a peptide profile of the subject.
52-71. (canceled)
72. A kit for generating a peptide profile of a subject having, or at risk of having, cancer of the bladder, breast, prostate or thyroid comprising an exogenous peptide or peptide fragment selected form the group consisting of complement C3f peptide, ITIH4 peptide, clusterin peptide, complement C4-alpha peptide, fibrinopeptideA peptide, bradykinin peptide, APO A-I peptide, APOA-IV peptide, APO E peptide, kininogen peptide, factor XIII peptide, transthyretin peptide and fibrinogenA peptide and instructions for use.
73-76. (canceled)
77. An isolated peptide fragment selected from the group consisting of a complement C3f, ITIH4, clusterin, complement C4-alpha, fibrinopeptideA, bradykinin, APO A-I, APOA-IV, APO E, kininogen, factor XIII, transthyretin and fibrinogenA peptide fragment.
78. A method of identifying cancer of the thyroid in a subject comprising detecting an increase in a complement C3f peptide or a fragment thereof, thereby identifying cancer of the thyroid in the subject.
79. The method of claim 78, further comprising detecting a decrease in fibrinopeptideA peptide or a fragment thereof, or a fibrinogen-alpha peptide fragment, or any combination thereof in a biological sample obtained from the subject.
80. The method claim 78, wherein the step of detecting comprises an optical detection method.
81. The method of claim 80, wherein the optical detection method comprises a fluorescence method.
82. The method of claim 81, wherein the fluorescence method comprises a sandwich immunoassay.
Description:
CROSS-REFERENCE TO RELATED APPLICATIONS/PATENTS & INCORPORATION BY
REFERENCE
[0001] This application is a division of U.S. patent application Ser. No. 12/063,968, filed Oct. 20, 2008, now U.S. Pat. No. 7,972,770, which is the U.S. national phase application, pursuant to 35 U.S.C. §371, of PCT international application Ser. No. PCT/US2006/031957, filed Aug. 16, 2006, designating the United States and published in English on Feb. 22, 2007, as publication WO 2007/022248 A2, which claims priority to U.S. provisional application Ser. No. 60/708,676, filed Aug. 16, 2005. The entire contents of the aforementioned patent applications are incorporated herein by this reference.
[0002] Each of the applications and patents cited in this text, as well as each document or reference cited in each of the applications and patents (including during the prosecution of each issued patent; "application cited documents"), and each of the PCT and foreign applications or patents corresponding to and/or paragraphing priority from any of these applications and patents, and each of the documents cited or referenced in each of the application cited documents, are hereby expressly incorporated herein by reference. More generally, documents or references are cited in this text, either in a Reference List before the paragraphs, or in the text itself; and, each of these documents or references ("herein-cited references"), as well as each document or reference cited in each of the herein-cited references (including any manufacturer's specifications, instructions, etc.), is hereby expressly incorporated herein by reference.
SEQUENCE LISTING
[0004] The instant application contains a Sequence Listing which has been submitted in ASCII format via EFS-Web and is hereby incorporated by reference in its entirety. Said ASCII copy, created on Aug. 19, 2011, is named 63115159.txt and is 145,202 bytes in size.
BACKGROUND OF THE INVENTION
[0005] Serum biomarkers are used for diagnosis of disease and for predicting and monitoring response to treatment (Sidransky, D. 2002. Nat Rev Cancer 2:210-219; Bidart, J. M., et al. 1999. Clin Chem 45:1695-1707). Most clinically useful markers, to date, have been plasma proteins that require individual immunoassays for quantitation (Jortani, S. A., et al. 2004. Clin Chem 50:265-278; Watts, N. B. 1999. Clin Chem 45:1359-1368). Human serum also contains smaller peptides that constitute an entity known as the serum `peptidome`. Advances in mass spectrometry (MS) now permit the display of hundreds of small to medium sized peptides from microliter volumes of serum (Koomen, J. M., et al., 2005. J Proteome Res 4:972-981; Villanueva, et al., 2004. Anal Chem 76:1560-1570). Several recent reports have advocated the use of MS-based serum peptide profiling to determine qualitative and quantitative patterns, or `signatures`, that indicate the presence/absence of disease such as cancer (Petricoin, E. F., et al., 2002. Lancet 359:572-577; Adam, B. L., et al., 2002. Cancer Res 62:3609-3614; Li, J., et al., 2002. Clin Chem 48:1296-1304; Ebert, M. P., et al., 2004. J Proteome Res 3:1261-1266; Ornstein, D. K., et al. 2004. J Urol 172:1302-1305; Conrads, T. P., et al., 2004. Endocr Relat Cancer 11:163-178). To date, it has neither been accomplished to independently reproduce entire peptidomic patterns, nor has it been shown that the highly discriminatory peptides have the same amino acid sequences.
[0006] TOF-MS is the most efficient mass analysis technique in terms of detection sensitivity and readily achieves high mass analysis at good mass accuracy (R. J. Cotter, Anal. Chem. 64 (21), 1027 (1992)). It is one of the few analysis techniques that combines high sensitivity, selectivity and specificity with speed of analysis. For example, TOF-MS can record a complete mass spectrum on a microsecond timescale.
[0007] Advances in MS-based serum peptide profiling can have important implications for cancer diagnostics.
SUMMARY OF THE INVENTION
[0008] It has now been determined that distinctive peptide patterns that correlate with clinically relevant outcomes can be established through mass spectrometry (MS). Methods of the present invention employ serum peptide profiles to identify various types of cancer.
[0009] The present invention provides peptide markers that are differentially present in the samples of cancer subjects and in the samples of control subjects. Measurement of these markers, alone or in combination, in patient samples provides information correlating with a probable diagnosis of human cancer or a negative diagnosis (e.g., normal or disease-free). Accordingly, further disclosed are methods and kits that employ these markers in diagnosing and monitoring cancer.
[0010] In one aspect, the present invention provides methods of diagnosing or monitoring cancer in a subject comprising measuring at least one peptide marker in a sample from the subject. The cancer can be cancer of the prostate, bladder, breast or thyroid. Peptide markers of the invention include but are not limited to complement C3f, ITIH4, clusterin, complement C4-alpha, fibrinopeptideA, bradykinin, APO A-I, APOA-IV, APO E, kininogen, factor XIII, transthyretin and fibrinogenA. Preferably, peptide markers for ITIH4, clusterin, complement C4-alpha, APO A-I, APO A-IV, APO E, kininogen, factor XIII, transthyretin and fibrinogenA are present in the serum as peptide fragments.
[0011] In one embodiment, peptide marker levels are detected in a combination of two or more of the aforementioned peptide markers. Thus, the number of individual peptide markers measured in a sample can range from about 2 to 10, 10 to 15, 15 to 20, 20 to 25, 25 to 30, 30 to 35, 35 to 40, 40 to 45, 45 to 50 and greater than about 50. In specific embodiments, at least about 20 of the peptide markers are measured.
[0012] In one embodiment, the invention provides a method of identifying cancer of the prostate in a subject comprising detecting an increase in a complement C3f peptide or a fragment thereof, a ITIH4, clusterin, complement C4-alpha, kininogen or factor XIII peptide fragment, or any combination thereof in a biological sample obtained from the subject, thereby identifying cancer of the prostate in the subject. The method can further comprise detecting a decrease in fibrinopeptideA peptide or a fragment thereof, or a fibrinogen-alpha peptide fragment, or any combination thereof in a biological sample obtained from the subject.
[0013] In another embodiment, the invention provides a method of identifying cancer of the bladder in a subject comprising detecting an increase in a complement C3f peptide or a fragment thereof, a ITIH4, clusterin, complement C4-alpha, fibrinogen-alpha, APO A-I, APO A-IV, APO E or kininogen peptide fragment, or any combination thereof in a biological sample obtained from the subject, thereby identifying cancer of the bladder in the subject. The method can further comprise detecting a decrease in a fibrinopeptideA peptide, bradykinin peptide, or a fragment thereof, a C4-alpha, ITIH4, or fibrinogen-alpha peptide fragment, or any combination thereof in a biological sample obtained from the subject.
[0014] In yet another embodiment, the invention provides a method of identifying cancer of the breast in a subject comprising detecting an increase in a fibrinopeptideA peptide, bradykinin peptide, or a fragment thereof, a ITIH4, complement C4-alpha, fibrinogen-alpha, APO A-IV, factorXIII or transthyretin peptide fragment, or any combination thereof in a biological sample obtained from the subject, thereby identifying cancer of the breast in the subject. The method can further comprise detecting a decrease in a fibrinopeptideA peptide, complement C3f peptide, or a fragment thereof, or any combination thereof in a biological sample obtained from the subject.
[0015] In yet another embodiment, the invention provides a method of identifying cancer of the prostate in a subject comprising detecting a decrease in a fibrinopeptideA peptide or a fragment thereof and a fibrinogen-alpha peptide fragment and an increase in a complement C3f peptide or a fragment thereof, a ITIH4, clusterin, complement C4-alpha, kininogen and factor XIII peptide fragment in a biological sample obtained from the subject, thereby identifying cancer of the prostate in the subject.
[0016] In yet another embodiment, the invention is provides a method of identifying cancer of the bladder in a subject comprising detecting a decrease in a fibrinopeptideA peptide, bradykinin peptide, or a fragment thereof, a C4-alpha, ITIH4, and fibrinogen-alpha peptide fragment and an increase in a complement C3f or a fragment thereof, a ITIH4, clusterin, complement C4-alpha, fibrinogen-alpha, APO A-I, APO A-IV, APO E and kininogen peptide fragment in a biological sample obtained from the subject, thereby identifying cancer of the bladder in the subject.
[0017] In yet another embodiment, the invention provides a method of identifying cancer of the breast in a subject comprising detecting a decrease in a fibrinopeptideA peptide and complement C3f peptide, or a fragment thereof, and an increase in a fibrinopeptideA peptide, bradykinin peptide, or a fragment thereof, a ITIH4, complement C4-alpha, fibrinogen-alpha, APO A-IV, factorXIII and transthyretin peptide fragment in a biological sample obtained from the subject, thereby identifying cancer of the breast in the subject.
[0018] In specific embodiments of the invention concerning cancer of the prostate, the fibrinopeptideA peptide fragment that is decreased includes but is not limited to DSGEGDFLAEGGGVR (SEQ ID NO. 1), SGEGDFLAEGGGVR (SEQ ID NO. 2), GEGDFLAEGGGVR (SEQ ID NO. 3), EGDFLAEGGGVR (SEQ ID NO. 4), GDFLAEGGGVR (SEQ ID NO. 5), DFLAEGGGVR (SEQ ID NO. 6) or LAEGGGVR (SEQ ID NO. 25).
[0019] In other specific embodiments of the invention concerning cancer of the bladder, the fibrinopeptideA peptide fragment that is decreased includes but is not limited to DSGEGDFLAEGGGVR (SEQ ID NO. 1), SGEGDFLAEGGGVR (SEQ ID NO. 2), GEGDFLAEGGGVR (SEQ ID NO. 3), EGDFLAEGGGVR (SEQ ID NO. 4), GDFLAEGGGVR (SEQ ID NO. 5), DFLAEGGGVR (SEQ ID NO. 6), FLAEGGGVR (SEQ ID NO. 24) or LAEGGGVR (SEQ ID NO. 25).
[0020] In other specific embodiments of the invention concerning cancer of the breast, the fibrinopeptideA peptide fragment that is decreased includes but is not limited to SGEGDFLAEGGGVR (SEQ ID NO. 2) or GEGDFLAEGGGVR (SEQ ID NO. 3) and the fibrinopeptideA peptide fragment that is increased is FLAEGGGVR (SEQ ID NO. 24).
[0021] In other specific embodiments of the invention concerning cancer of the prostate, the complement C3f peptide fragment that is increased includes but is not limited to SSKITHRIHWESASLL (SEQ ID NO. 8), SKITHRIHWESASLL (SEQ ID NO. 9), KITHRIHWESASLL (SEQ ID NO. 10), THRIHWESASLL (SEQ ID NO. 11) or IHWESASLL (SEQ ID NO. 28).
[0022] In other specific embodiments of the invention concerning cancer of the bladder, the complement C3f peptide fragment that is increased includes but is not limited to SSKITHRIHWESASLL (SEQ ID NO. 8), SKITHRIHWESASLL (SEQ ID NO. 9), KITHRIHWESASLL (SEQ ID NO. 10), THRIHWESASLL (SEQ ID NO. 11), HWESASLL (SEQ ID NO. 12), RIHWESASLL (SEQ ID NO. 27), IHWESASLL (SEQ ID NO. 28) or SSKITHRIRWESASL (SEQ ID NO. 29).
[0023] In other specific embodiments of the invention concerning cancer of the breast, the complement C3f peptide fragment that is decreased includes but is not limited to SSKITHRIHWESASLL (SEQ ID NO. 8), HWESASLL (SEQ ID NO. 12) or ITHRIHWESASLL (SEQ ID NO. 26).
[0024] In other specific embodiments of the invention concerning cancer of the prostate, ITIH4 peptide fragment that is increased includes but is not limited to PGVLSSRQLGLPGPPDVPDHAAYHPF (SEQ ID NO. 13), SRQLGLPGPPDVPDHAAYHPF (SEQ ID NO. 15), HAAYHPFR (SEQ ID NO. 34), QLGLPGPPDVPDHAAYHPFR (SEQ ID NO. 35), HAAYHPF (SEQ ID NO. 39), NVHSGSTFFKYYLQGAKIPKPEASFSPR (SEQ ID NO. 40) or NVHSAGAAGSRMNFRPGVLSS (SEQ ID NO. 41).
[0025] In other specific embodiments of the invention concerning cancer of the bladder, the ITIH4 peptide fragment that is increased includes but is not limited to PGVLSSRQLGLPGPPDVPDHAAYHPF (SEQ ID NO. 13), SRQLGLPGPPDVPDHAAYHPF (SEQ ID NO. 15), HAAYHPFR (SEQ ID NO. 34), QAGAAGSRMNFRPGVLSSRQLGLPGPPDVPDHAAYHPF (SEQ ID NO. 36), MNFRPGVLSSRQLGLPGPPDVPDHAAYHPF (SEQ ID NO. 37), NVHSGSTFFKYYLQGAKIPKPEASFSPR (SEQ ID NO. 40) or NVHSAGAAGSRMNFRPGVLSS (SEQ ID NO. 41) and the ITIH4 peptide fragment that is decreased includes but is not limited to GVLSSRQLGLPGPPDVPDHAAYHPF (SEQ ID NO. 14) or HAAYHPF (SEQ ID NO. 39).
[0026] In other specific embodiments of the invention concerning cancer of the breast, the ITIH4 peptide fragment that is increased includes but is not limited to GLPGPPDVPDHAAYHPF (SEQ ID NO. 16), HAAYHPFR (SEQ ID NO. 34), QLGLPGPPDVPDHAAYHPFR (SEQ ED NO. 35), SSRQLGLPGPPDVPDHAAYHPF (SEQ ID NO. 38) or NVHSAGAAGSRMNFRPGVLSS (SEQ ID NO. 41).
[0027] In other specific embodiments of the invention concerning cancer of the prostate, the clusterin peptide fragment includes but is not limited to HFFFPKSRIV (SEQ ID NO. 17).
[0028] In other specific embodiments of the invention concerning cancer of the bladder, the clusterin peptide fragment that is increased includes but is not limited to HFFFPKSRIV (SEQ ID NO. 17) or HFFFPK (SEQ ID NO. 18).
[0029] In other specific embodiments of the invention concerning cancer of the bladder, the bradykinin peptide fragment that is decreased includes but is not limited to RPPGFSPFR (SEQ ID NO. 19) or RPPGFSPF (SEQ ID NO. 20).
[0030] In other specific embodiments of the invention concerning cancer of the breast, the bradykinin peptide fragment that is increased includes but is not limited to RPPGFSPFR (SEQ ID NO. 19) or RPPGFSPF (SEQ ID NO. 20).
[0031] In other specific embodiments of the invention concerning cancer of the prostate, the complement C4-alpha peptide fragment that is increased includes but is not limited to GLEEELQFSLGSKINVKVGGNS (SEQ ID NO. 23).
[0032] In other specific embodiments of the invention concerning cancer of the bladder, the complement C4-alpha peptide fragment that is increased includes but is not limited to RNGFKSHALQLNNRQI (SEQ ID NO. 21), GLEEELQFSLGSKINVKVGGNS (SEQ ID NO. 23), or NGFKSHALQLNNR (SEQ ID NO. 31) and the complement C4-alpha peptide fragment that is decreased is GLEEELQFSLGSKINV (SEQ ID NO. 33).
[0033] In other specific embodiments of the invention concerning cancer of the breast, the complement C4-alpha peptide fragment that is increased includes but is not limited to RNGFKSHALQLNNRQI (SEQ ID NO. 21), NGFKSHALQLNNRQI (SEQ ID NO. 22), GLEEELQFSLGSKINVKVGGNS (SEQ ID NO. 23), NGFKSHALQLNNRQ (SEQ ID NO. 30), GLEEELQFSLGSKINVKVGGNSKGTL (SEQ ID NO. 32) or GLEEELQFSLGSKINV (SEQ ID NO. 33).
[0034] In other specific embodiments of the invention concerning cancer of the prostate, the fibrinogen-alpha peptide fragment that is decreased includes but is not limited to SSSYSKQFTSSTSYNRGDSTFESKSYKMA (SEQ NO. 55) or SSSYSKQFTSSTSYNRGDSTFESKSYKM (SEQ ID NO. 56).
[0035] In other specific embodiments of the invention concerning cancer of the bladder, the fibrinogen-alpha peptide fragment that is increased includes but is not limited to SSSYSKQFTSSTSYNRGDSTFESKSYKMA (SEQ ID NO. 55), SSSYSKQFTSSTSYNRGDSTFESKSYKM (SEQ ID NO. 56), SSSYSKQFTSSTSYNRGDSTFESKSY (SEQ ID NO. 57), SSSYSKQFTSSTSYNRGDSTFESKS (SEQ ID NO. 58), or SSYSKQFTSSTSYNRGDSTFE (SEQ ID NO. 60), and the fibrinogen-alpha peptide fragment that is decreased is GSESGIFTNTKESSSHHPGIAEFPSRG (SEQ ID NO. 61).
[0036] In other specific embodiments of the invention concerning cancer of the breast, the fibrinogen-alpha peptide fragment that is increased includes but is not limited to SSYSKQFTSSTSYNRGDSTFE (SEQ ID NO. 60) or DEAGSEADHEGTHSTKRGHAKSRPV (SEQ ID NO. 62).
[0037] In other specific embodiments of the invention concerning cancer of the prostate, the kininogen peptide fragment is NLGHGHKHERDQGHGHQ (SEQ ID NO. 52).
[0038] In other specific embodiments of the invention concerning cancer of the bladder, the kininogen peptide fragment that is increased includes but is not limited to KHNLGHGHKHERDQGHGHQ (SEQ ID NO. 51) or NLGHGHKHERDQGHGHQ (SEQ ID NO. 52).
[0039] In other specific embodiments of the invention concerning cancer of the bladder, the APO A-I peptide fragment that is increased includes but is not limited to QGLLPVLESFKVSFLSALEEYTKKLNTQ (SEQ ID NO. 42), VSFLSALEEYTKKLNTQ (SEQ ID NO. 43) or ATEHLSTLSEKAKPALEDL (SEQ ID NO. 44).
[0040] In other specific embodiments of the invention concerning cancer of the bladder, the APO A-IV peptide fragment that is increased includes but is not limited to GNTEGLQKSLAELGGHLDQQVEEFR (SEQ ID NO. 46), SLAELGGHLDQQVEEFR (SEQ ID NO. 47) or SLAELGGHLDQQVEEF (SEQ ID NO. 48).
[0041] In other specific embodiments of the invention concerning cancer of the breast, the APO A-IV peptide fragment that is increased is ISASAEELRQRLAPLAEDVRGNL (SEQ ID NO. 45).
[0042] In other specific embodiments of the invention concerning cancer of the bladder, the APO E peptide fragment that is increased includes but is not limited to AATVGSLAGQPLQERAQAWGERLR (SEQ ID NO. 49) or AATVGSLAGQPLQERAQAWGERL (SEQ ID NO. 50).
[0043] In other specific embodiments of the invention concerning cancer of the prostate, the factor XIII peptide fragment that is increased is AVPPNNSNAAEDDLPTVELQGVVPR (SEQ ID NO. 53).
[0044] In other specific embodiments of the invention concerning cancer of the breast, the factor XIII peptide fragment that is increased is AVPPNNSNAAEDDLPTVELQGVVPR (SEQ ID NO. 53).
[0045] In other specific embodiments of the invention concerning cancer of the breast, the transthyretin peptide fragment that is increased is ALGISPFHEHAEVVFTANDSGPR (SEQ ID NO. 54).
[0046] In practicing the methods of the invention, the biological sample can comprise plasma or serum or a preparation thereof. Detection can comprise analyzing the biological sample, or a preparation thereof using mass spectrometry. The mass spectrometry can be MALDI TOF, Fourier-transform ion cyclotron resonance, electrospray ionization mass spectrometry, or combinations thereof. In another aspect, detection can comprise analyzing the biological sample, or a preparation thereof on a solid support, wherein peptides in the sample bind to the solid support.
[0047] In another aspect, the invention provides peptide profiles indicative of cancer of the prostate, bladder, and breast.
[0048] In one embodiment, the invention provides an isolated or identified peptide profile indicating cancer of the prostate comprising an increased amount of peptides or peptide fragments of SSKITHRIHWESASLL (SEQ ID NO. 8), SKITHRIEIWESASLL (SEQ ID NO. 9), KITHRIHWESASLL (SEQ ID NO. 10), THRIHWESASLL (SEQ ID NO. 11), PGVLSSRQLGLPGPPDVPDHAAYHPF (SEQ ID NO. 13), SRQLGLPGPPDVPDHAAYHPF (SEQ ID NO. 15), HFFFPKSRIV (SEQ ID NO. 17), GLEEELQFSLGSKINVKVGGNS (SEQ ID NO. 23), IHWESASLL (SEQ ID NO. 28), HAAYHPFR (SEQ ID NO. 34), QLGLPGPPDVPDHAAYHPFR (SEQ ID NO. 35), HAAYHPF (SEQ ID NO. 39), NVHSGSTFFKYYLQGAKIPKPEASFSPR (SEQ ID NO. 40), NVHSAGAAGSRMNFRPGVLSS (SEQ ID NO. 41), NLGHGHKHERDQGHGHQ (SEQ ID NO. 52), AVPPNNSNAAEDDLPTVELQGVVPR (SEQ ID NO. 53), or combinations thereof. In an additional embodiment, the isolated or identified peptide profile indicating cancer of the prostate comprises a decreased amount of peptides or peptide fragments of DSGEGDFLAEGGGVR (SEQ ID NO. 1), SGEGDFLAEGGGVR (SEQ ID NO. 2), GEGDFLAEGGGVR (SEQ ID NO. 3), EGDFLAEGGGVR (SEQ ID NO. 4), GDFLAEGGGVR (SEQ ID NO. 5), DFLAEGGGVR (SEQ ID NO. 6), LAEGGGVR (SEQ ID NO. 25), SSSYSKQFTSSTSYNRGDSTFESKSYKMA (SEQ ID NO. 55), SSSYSKQFTSSTSYNRGDSTFESKSYKM (SEQ ID NO. 56), or combinations thereof.
[0049] In another embodiment, the invention provides an isolated or identified peptide profile indicating cancer of the bladder comprising an increased amount of peptides or peptide fragments of SSKITHRIHWESASLL (SEQ ID NO. 8), SKITHRIHWESASLL (SEQ ID NO. 9), KITHRIHWESASLL (SEQ ID NO. 10), THRIHWESASLL (SEQ ID NO. 11), HWESASLL (SEQ ID NO. 12), PGVLSSRQLGLPGPPDVPDHAAYHPF (SEQ ID NO. 13), SRQLGLPGPPDVPDHAAYHPF (SEQ ID NO. 15), HFFFPKSRIV (SEQ ID NO. 17), HFFFPK (SEQ ID NO. 18), RNGFKSHALQLNNRQI (SEQ ID NO. 21), GLEEELQFSLGSKINVKVGGNS (SEQ ID NO. 23), (SEQ ID NO. 27), IHWESASLL (SEQ ID NO. 28), SSKITHRIHWESASL (SEQ ID NO. 29), NGFKSHALQLNNR (SEQ ID NO. 31), HAAYHPFR (SEQ ID NO. 34), QAGAAGSRMNFRPGVLSSRQLGLPGPPDVPDHAAYHPF (SEQ ID NO. 36), MNFRPGVLSSRQLGLPGPPDVPDHAAYHPF (SEQ ID NO. 37), NVHSGSTFFKYYLQGAKIPKPEASFSPR (SEQ ID NO. 40), NVHSAGAAGSRMNFRPGVLSS (SEQ ID NO. 41), QGLLPVLESFKVSFLSALEEYTKKLNTQ (SEQ ID NO. 42), VSFLSALEEYTKKLNTQ (SEQ ID NO. 43), ATEHLSTLSEKAKPALEDL (SEQ ID NO. 44), GNTEGLQKSLAELGGHLDQQVEEFR (SEQ ID NO. 46), SLAELGGHLDQQVEEFR (SEQ ID NO. 47), SLAELGGHLDQQVEEF (SEQ ID NO. 48), AATVGSLAGQPLQERAQAWGERLR (SEQ ID NO. 49), AATVGSLAGQPLQERAQAWGERL (SEQ ID NO. 50), KHNLGHGHKHERDQGHGHQ (SEQ ID NO. 51), NLGHGHKHERDQGHGHQ (SEQ ID NO. 52), GSESGIFTNTKESSSHHPGIAEFPSRG (SEQ ID NO. 61), or combinations thereof. In an additional embodiment, the isolated or identified peptide profile indicating cancer of the bladder comprises a decreased amount of peptides or peptide fragments of DSGEGDFLAEGGGVR (SEQ ID NO. 1), SGEGDFLAEGGGVR (SEQ ID NO. 2), GEGDFLAEGGGVR (SEQ ID NO. 3), EGDFLAEGGGVR (SEQ ID NO. 4), GDFLAEGGGVR (SEQ ID NO. 5), DFLAEGGGVR (SEQ ID NO. 6), GVLSSRQLGLPGPPDVPDHAAYHPF (SEQ ID NO. 14), RPPGFSPFR (SEQ ID NO. 19), RPPGFSPF (SEQ ID NO. 20), FLAEGGGVR (SEQ ID NO. 24), LAEGGGVR (SEQ ID NO. 25), GLEEELQFSLGSKINV (SEQ ID NO. 33), HAAYHPF (SEQ ID NO. 39), SSSYSKQFTSSTSYNRGDSTFESKSYKMA (SEQ ID NO. 55), SSSYSKQFTSSTSYNRGDSTFESKSYKM (SEQ ID NO. 56), SSSYSKQFTSSTSYNRGDSTFESKSY (SEQ ID NO. 57), SSSYSKQFTSSTSYNRGDSTFESKS (SEQ ID NO. 58), SSYSKQFTSSTSYNRGDSTFE (SEQ ID NO. 60), or combinations thereof.
[0050] In yet another embodiment, the invention provides an isolated or identified peptide profile indicating cancer of the breast comprising an increased amount of peptides or peptide fragments of GLPGPPDVPDHAAYHPF (SEQ ID NO. 16), RPPGFSPFR (SEQ ID NO. 19), RPPGFSPF (SEQ ID NO. 20), RNGFKSHALQLNNRQI (SEQ ID NO. 21), NGFKSHALQLNNRQI (SEQ ID NO. 22), GLEEELQFSLGSKINVKVGGNS (SEQ ID NO. 23), FLAEGGGVR (SEQ ID NO. 24), NGFKSHALQLNNRQ (SEQ ID NO. 30), GLEEELQFSLGSKINVKVGGNSKGTL (SEQ ED NO. 32), GLEEELQFSLGSKINV (SEQ ID NO. 33), HAAYHPFR (SEQ NO. 34), QLGLPGPPDVPDHAAYHPFR (SEQ ID NO. 35), SSRQLGLPGPPDVPDHAAYHPF (SEQ ID NO. 38), NVHSAGAAGSRMNFRPGVLSS (SEQ ID NO. 41), ISASAEELRQRLAPLAEDVRGNL (SEQ ID NO. 45), AVPPNNSNAAEDDLPTVELQGVVPR (SEQ ID NO. 53), ALGISPFHEHAEVVFTANDSGPR (SEQ ID NO. 54), SSYSKQFTSSTSYNRGDSTFE (SEQ ID NO. 60), DEAGSEADHEGTHSTKRGHAKSRPV (SEQ ID NO. 62), or combinations thereof. In an additional embodiment, the isolated or identified peptide profile indicating cancer of the breast comprises a decreased amount of peptides or peptide fragments of SGEGDFLAEGGGVR (SEQ ID NO. 2), GEGDFLAEGGGVR (SEQ NO. 3), SSKITHRIHWESASLL (SEQ ID NO. 8), HWESASLL (SEQ NO. 12), ITHRIHWESASLL (SEQ ID NO. 26), or combinations thereof.
[0051] In one embodiment of the peptide profile of the invention, the profile is present in an isolated biological sample. In another embodiment, the identified profile is stored by electronic means.
[0052] In one aspect, the invention provides a method of generating a peptide profile of a subject having, or at risk of having, cancer of the prostate, comprising the steps of:
[0053] i) combining an exogenous peptide including but not limited to a complement C3f, ITIH4, clusterin, complement C4-alpha, fibrinopeptide A, kininogen, factor XIII, and fibrinogenA peptide or a combination thereof with a biological sample from the subject; and
[0054] ii) proteolytically digesting a peptide of step i),
[0055] thereby generating a peptide profile of the subject.
[0056] In additional embodiments of the invention, the peptide profile indicates that the subject has or is at risk of having cancer of the prostate.
[0057] In one aspect, the invention provides a method of generating a peptide profile of a subject having, or at risk of having, cancer of the bladder, comprising the steps of:
[0058] i) combining an exogenous peptide including but not limited to a complement C3f, ITIH4, clusterin, complement C4-alpha, fibrinopeptide A, bradykinin, APO A-I, APO A-IV, APO E, kininogen, and fibrinogenA peptide or a combination thereof with a biological sample from the subject; and
[0059] ii) proteolytically digesting a peptide of step i),
thereby generating a peptide profile of the subject.
[0060] In an additional embodiment of the invention, the peptide profile indicates that the subject has or is at risk of having cancer of the bladder.
[0061] In one aspect, the invention provides a method of generating a peptide profile of a subject having, or at risk of having, cancer of the breast, comprising the steps of:
[0062] i) combining an exogenous peptide including but not limited to a ITIH4, bradykinin, complement C4-alpha, fibrinopeptide A, complement C3f, APO A-IV, factor XIII, transthyretin and fibrinogenA peptide or a combination thereof with a biological sample from the subject; and
[0063] ii) proteolytically digesting a peptide of step i),
thereby generating a peptide profile of the subject.
[0064] In an additional embodiment of the invention, the peptide profile indicates that the subject has or is at risk of having cancer of the breast.
[0065] In one aspect, the invention is provides a method of generating a peptide profile of a subject having, or at risk of having, cancer of the thyroid, comprising the steps of:
[0066] i) combining an exogenous peptide selected from the group consisting of a fibrinopeptide A, fibrinogenA, complement C3f peptide and combinations thereof with a biological sample from the subject, and
[0067] ii) proteolytically digesting a peptide of step i),
thereby generating a peptide profile of the subject.
[0068] In an additional embodiment of the invention, the peptide profile indicates that the subject has or is at risk of having cancer of the thyroid.
[0069] In further embodiments of the invention, the exogenous peptide is labeled with an isotope. In yet further embodiments of the invention, the biological sample is serum or plasma. In yet further embodiments of the invention, the exogenous peptide is a synthetic peptide. In yet further embodiments of the invention, the exogenous peptide is comprised of D-amino acids. In yet further embodiments of the invention, the proteolytic digest is analyzed, for example, using mass spectrometry.
[0070] Methods of the invention can further comprise the step of obtaining the exogenous peptide.
[0071] In yet another aspect, the invention provides a kit for generating a peptide profile of a subject having, or at risk of having, cancer of the bladder, breast, prostate or thyroid comprising an exogenous peptide or peptide fragment selected from the group consisting of complement C3f peptide, ITIH4 peptide, clusterin peptide, complement C4-alpha peptide, fibrinopeptideA peptide, bradykinin peptide, APO A-I peptide, APOA-IV peptide, APO E peptide, kininogen peptide, factor XIII peptide, transthyretin peptide and fibrinogenA peptide and instructions for use and/or a packaging means thereof.
BRIEF DESCRIPTION OF THE FIGURES
[0072] FIG. 1A shows the color-coding scheme followed in the representation of data collected for the blood samples from healthy volunteers (n=33) and from patients with advanced prostate (n=32), bladder (n=20) and breast (n=21) cancer.
[0073] FIG. 1B shows the results of unsupervised, average-linkage hierarchical clustering performed using standard correlation as a distance metrics (`GeneSpring` program), between each cancer group and the control, in binary format. The entire peak list (651×106) was used. Columns represent samples; rows are m/z-peaks (i.e., peptides). Dendrogram colors follow the color-coding scheme of panel A. The heat map scale of normalized intensities is from 0 (green) to 200 (red), with the midpoint at 100 (yellow).
[0074] FIG. 1C shows the results of hierarchical clustering performed for the three cancer groups plus control (as in 1B, above).
[0075] FIG. 1D shows the results of Principal Component Analysis (PCA) of the three cancer groups plus controls based on the full peak list. Color-coding is as in panel A. The first three principal components, accounting for most of the variance in the original data set are shown.
[0076] FIG. 2A shows pie charts depicting the peak number reduction in three m/z ranges, which illustrates the impact of each filter on peptides of different molecular mass.
[0077] FIG. 2B depicts the Venn-diagrams showing the number of peptides that passed two selection steps. m/z-peaks with higher intensities in one (or more) of the cancer groups as compared to controls are shown in the left panel, while those with lower intensities are shown in the right panel. The numbers shown outside the diagrams indicate the total number of peptides of a specific cancer group that were either up or down.
[0078] FIG. 2C shows heat maps comparing the selected features of the three cancer groups with controls in multi-class and binary formats. Columns represent samples (as indicated per group); rows are peptide m/z-peaks (not in numerical order). The number of peptides used in each binary comparison (i.e., 58, 14, and 14) is the sum of those that were specifically higher and lower in each cancer group; the multi-class heat map contains the total, non-redundant number of peptides (i.e., 68). The `multi-class`, `bladder` and `breast` heat map scales of normalized intensities are from 0 (green) to 500 (red), with the midpoint at 250 (yellow); those of the `prostate` heat map are, respectively, 0, 2,000 and 1,000.
[0079] FIG. 2D depicts overlays of mass spectra obtained from the three binary comparisons (cancer vs. control). Mono-isotopic masses are listed for each peak. Two statistically significant differences in peptide intensities (one higher; one lower) between prostate cancer (blue) and controls (yellow) are shown, as well as one higher-intensity peptide for bladder cancer (green) and one for breast cancer (red).
[0080] FIGS. 3A and 3B show MALDI-TOF mass spectral overlays of selected peaks derived from serum peptide profiling of three groups of cancer patients and healthy controls. Each overlay shows a binary comparison for all spectra from either the bladder cancer (n=20; green), or prostate cancer (n=32; blue) or breast cancer patient group (n=21; red) versus the control group (n=33; yellow). They are arrayed in a way that the same mass range window is shown for each of the three binary comparisons, in which spectral intensities were normalized and scaled to the same size, except for `2021.05`, which is included herein as an example of the vast majority of peptide-ions with intensities not statistically different between any two groups. (A) Overlays of mass spectra of selected peptides of known sequence (see FIG. 3) that showed statistically significant differences between peak intensities in one or more of the three binary comparisons. The mono-isotopic mass (m/z) of the peak is shown for each peptide. (B) Overlays of mass spectra of some as yet unidentified peptides that also showed statistically significant differences between peak intensities in one or more of the three binary comparisons. The bin `name` (a number that is close to the average isotopic mass) is shown for each peptide.
[0081] FIG. 4 shows a fragment ion spectrum for MALDI-TOF/TOF MS/MS identification of serum peptide (SEQ ID NO: 7) 2305.20 as a fragment of complement 4a. b''- and y''-fragment ion series are indicated, together with the limited sequences (above arrows). Note that y''-ions originate at the C-terminus and that the sequence therefore reads backwards (see direction of the arrows).
[0082] FIG. 5A lists the groups ('ladders') of overlapping sequences of the peptides identified by MALDI-TOF/TOF MS/MS. Taken together, 61 peptide-ions on the list have clear peptide-ion marker potential (adjusted p<0.0002; see FIG. 5B, below) for at least one type of cancer and are color-coded in blue (prostate cancer), green (bladder cancer) or red (breast cancer). The resulting `barcodes` for the three cancer types consist of 26 (prostate), 50 (bladder) and 25 (breast) peptide-ions. Color-coded peptides have either higher (no dot) or lower (black dot) differential ion intensities in a particular cohort of cancer samples as compared to controls. Of the 8 non-markers listed here, full-length C3f (m/z=2021.05) and one member of the fibrinogen-alpha cluster (m/z=2553.01) gave comparable ion signals in all patient group and control sera (see FIG. 5B; FIG. 3, `2021`), and, therefore, represent virtual internal standards (yellow-coded). Six peptides (pink-coded) in the clusters were randomly observed in samples of the cancer and control groups and have neither discriminant nor internal control value. Note that the measured m/z values, as listed, are mono-isotopic and, therefore, smaller than the corresponding average isotopic values in FIG. 13a. Amino acids in brackets were not experimentally observed but are shown to either indicate putative full-length sequences of the founders, each resulting from specific proteolyis of precursor proteins, and/or of the positions of the putative `trypsin-like` cleavage sites (Arg/Lys--Xaa). FIG. 5A discloses SEQ ID NOS 116, 1-6, 117-123, 60, 124-127, 8-10, 26, 11, 128, 27, 28, 12, 29, 76-77, 30-31, 78-81, 34-35, 82, 37, 13-14, 38, 15, 83, 16, 39, 84-88, 43, 89-91, 47-48, 92-94, 18-20 and 95-99, respectively, in order of appearance.
[0083] FIG. 5B depicts a table listing additional details of the identified peptides as m/z values, MS-ion intensities, and `barcodes` (blue, green or red--as described above). The actual barcodes (blue, green or red) are composed of entries that showed clear peptide-ion marker potential (adjusted p<0.0002) for at least one type of cancer. Adjusted p-value is the overriding criterion, leading to final barcodes of 26 (prostate), 50 (bladder) and 25 (breast) peptide-ions. The second column lists median intensities of each m/z-peak in the control samples. Peak intensity ratios (columns 3-5) were calculated by dividing the median values of each m/z-peak in each cancer group by the median value of the corresponding peak in the control samples. Ratios (r) for the peptides that are part of one or more barcodes are shaded; dark grey when the median signal was of higher intensity in a particular cancer (r≧0.6), lighter grey when it was lower (r≦0.66). The significance levels (p values) of three different one-way ANOVA Mann-Whitney tests (columns 6-8) and of a multi-class Kluskal-Wallis test (column 9) are given. C3f (coded yellow) has virtually no discriminant value.
[0084] FIG. 6 shows, in bar graph form, the median intensity for each serum peptide in each of the three cancer groups (color-coding as indicated) plotted as the ratio versus the median intensity of the counterpart in the control group (r=case/control). Ratios are plotted on a log scale ranging from 0.1 to 10. Bars pointing to the left (r<1) or right (r>1) indicate, respectively, lower or higher median intensities in a cancer group as in the control group. Peptides that didn't show much difference in median ion intensity between case and control groups map closely to or onto the centerline (r=1). FIG. 6 discloses SEQ ID NOS 116, 1-6, 24-25, 127, 8-10, 26, 11, 27-28, 12, 21-22, 30-31, 59, 100, 33, 36-37, 13-14, 38, 15-16 and 39, respectively, in order of appearance.
[0085] FIG. 7 shows a flow chart-type diagram delineating the approach used for development and validation of (i) the 68-peptide-ion signature and (ii) the prostate cancer barcode consisting of 26 serum peptides with known sequence (blue-coded in FIG. 5). Numbers that are encircled indicate total number of selected peptides at that stage of the study.
[0086] FIG. 8A schematically depicts the independent prostate cancer serum sample groups identified for the validation of the established biomarkers.
[0087] FIGS. 8B and 8C show the results of Hierarchical Cluster (HCA) and Principal Component (PCA) Analyses of all spectra from the Prostate #1 (blue), Prostate #2 (cyan) and control groups (yellow). Two limited sets of peptide-ions were used for the analyses: the 68 combined peptides that had statistically significant differences in intensity for the three binary comparisons (FIG. 2B; FIG. 17) (left), and the 26 sequenced peptides that constitute the prostate cancer barcode (color-coded blue in FIG. 5) (right). The rest of the ˜650 peptide-ions were ignored for the cluster analysis. Dendrogram colors follow the color-coding scheme of panel A. The heat map scale of normalized ion-intensities is from 0 (green) to 2,000 (red), with the midpoint at 1,000 (yellow). For the PCA, the first three principal components, accounting for most of the variance in the original data set, are shown.
[0088] FIG. 8D shows a table listing the results of class prediction analysis of the prostate cancer validation set (Prostate #2) using Support Vector Machine (SVM) and either all 651 m/z-values or the 68-, 26-feature sets described above. Analyses were done using linear kernel. The proportions of correct predictions are listed. The binomial confidence intervals (at 95%) were 87.1-99.9% for 40 correct predictions out of 41, and 91.4-100% for 41/41. The training sets were either Prostate #1 versus control (`binary`) or the 3 cancer groups (Prostate #1, bladder and breast cancer) plus controls (`multi-class`).
[0089] FIG. 9 shows MALDI-TOF MS read-outs of fresh plasma (top panel), indicating very low levels of small peptides, except for bradykinin and desArg-bradykinin, of an aliquot withdrawn immediately (i.e., after 15-20 s) after addition of synthetic C3f (1 pmole/μL plasma) (middle panel, indicating removal of the C-terminal Arg, by a carboxypeptidase, in a matter of seconds), and of an aliquot withdrawn after another 15 minutes at room temperature (lower panel, indicating that C3f is then further degraded by the activity of aminopeptidases to result in a type of sequence ladder as endogenously present in serum).
[0090] FIG. 10 schematically depicts the activity of serum proteases. Amino acids are color-coded to represent sequence clusters of C3f (left) or FPA (right), which are just two examples of all the observed clusters.
[0091] FIG. 11A graphically depicts the distribution of serum peptides. Number of m/z-peaks are plotted as a function of m/z range. The first bin, from m/z=0 to 700, is empty, as no data was collected in that region. No bins are shown in the range >10 kDa.
[0092] FIG. 11B likewise graphically depicts the distribution of serum peptides. Here, however, number of m/z-peaks are plotted as a function of normalized intensity. No bins are shown in the region over 1,000 arbitrary units. The highlighted area indicates the range above the median peak-intensity threshold, used for selecting potential biomarkers (FIG. 17).
[0093] FIG. 12 depicts a histogram that shows, starting with a total of 651 unique m/z-peaks (blue bars) derived from three groups of cancer patients and healthy controls, the number of peptides in each mass range that passed two filters applied during feature selection.
[0094] FIG. 13A shows a table listing averages plus (±) standard deviations and medians (in brackets) of the intensities of each m/z-peak (i.e., serum peptide) within a particular data set derived from each of the three cancer patient groups and of the healthy controls. Intensities refer to normalized units that were calculated for each peak by dividing its raw intensity by the total of all of the intensities in that spectrum (TIC--Total Ion Count). The resultant values were then multiplied by fixed scaling factor (1×10⁷) to convert the data to a `user-friendly` scale (i.e. most values ≧1).
[0095] FIG. 13B shows a table listing ratios calculated by dividing the median normalized intensity of each m/z-peak in each cancer group by the median of the same m/z-peak in the control group. To avoid having to divide by zero, any median value of less than was converted to 1. This was applied to all groups. Data for a second, independent validation set of prostate cancer samples is also listed.
[0096] FIG. 13c shows a table listing the false discovery rate adjusted p-values calculated for each m/z-peak using the Mann-Whitney rank sum test (for binary comparisons) or the Kruskal-Wallis test (for multi-class comparisons). The group of 68 m/z-peaks listed were derived from the original peak list, containing normalized ion intensities (and medians within a group, case/control ratios and adjusted p-values) for each of the 651 m/z-peaks for each of the 106 samples, by applying p-value and median intensity cut-off filters (p<0.00001; median intensity ≧500 `units`). Entries which passed both filters in one or more cancer groups are color-coded: prostate cancer (14; blue), breast cancer (14; red) and bladder cancer (58; green).
[0097] FIG. 14 shows a table listing the total serum peptide sequences, organized per overlapping cluster; with clusters organized per precursor protein (NCBI ID nos. are given). Positions in the precursor proteins are indicated. Residues between brackets were not observed but are listed in the present table to indicate the putative primary cleavage sites by endoproteases. Additional information is given, as for instance the relative position of adjacently located peptides or peptide clusters, identity of previously known serum peptides (e.g., FPA, C3f), position of propeptides, and location of C-termini (C-t). Key: Metox or Mox, oxidized methionine; Prohydroxyl, hydroxylated proline. FIG. 14 discloses SEQ ID NOS 25, 24, 6, 5, 4, 3, 2, 1, 116, 71, 123, 122, 121, 120, 101, 60, 102, 126, 125, 12, 28, 27, 128, 11, 26, 10, 9, 8, 127, 29, 31, 30, 77, 76, 103, 80, 79, 78, 104, 39, 16, 83, 15, 38, 14, 13, 37, 82, 35, 34, 84-85, 89, 88, 43, 87, 86, 90, 48, 105, 91, 47, 106, 107, 93, 92, 18 and 94, respectively, in order of appearance.
[0098] FIG. 15 shows a table listing the locations of sequenced serum peptides in the precursor proteins. NCBI ID nos. are given, as well as the positions of known, processed serum proteins, peptides and propeptides. The peptide sequences obtained herein are shown in bold and are underlined. FIG. 15 discloses SEQ ID NOS 108-115, respectively, in order of appearance.
[0099] FIG. 16A shows, in table form, the data set of 651 unique m/z-peaks derived from MALDI-TOF MS serum peptide profiling of three groups of cancer patients and healthy controls. Presented are the averages plus (1) standard deviations and the median values (in brackets) of the intensities of each m/z-peak (i.e., serum peptide) within a particular data set derived from each of the three cancer patient groups and of the healthy controls; a second, independent validation set of prostate cancer samples is also listed. Intensities refer to normalized units that were calculated for each peak by dividing its raw intensity by the total of all the intensities in that spectrum (TIC--Total Ion Count). The resultant values were then multiplied by fixed scaling factor (1×10⁷) to convert the data to a `user-friendly` scale (i.e. most values ≧1).
[0100] FIG. 16B shows, in table form, the data set of 651 unique m/z-peaks derived from MALDI-TOF MS serum peptide profiling of three groups of cancer patients and healthy controls.
[0101] FIG. 16C shows, in table form, the data set of 651 unique m/z-peaks derived from MALDI-TOF MS serum peptide profiling of three groups of cancer patients and healthy controls.
[0102] FIGS. 17A, 17B, and 17C show, in table form, the data set of 68 putative biomarker m/z-peaks, derived from MALDI-TOF MS serum peptide profiling of three groups of cancer patients and healthy controls. The figures contain (i) means plus (±) standard deviations, and medians (in brackets); (ii) discriminant analysis false positive rates (p-values); and (iii) ratios of the median intensities in a group for all 68 m/z-peaks retained after applying p-value and median intensity cutoff filters (p<0.00001; median intensity ≧500 units). All values were extracted from FIGS. 16A-C, above. Entries which passed both filters in one or more cancer groups are color-coded: prostate cancer (14; blue), breast cancer (14; red) and bladder cancer (58; green).
[0103] FIG. 18 shows SEQ ID NO:63, GENBANK Accession No. AAH00664, C3F protein (Homo sapiens), amino acid residues 1-436.
[0104] FIG. 19 shows SEQ ID NO:64, GENBANK Accession No. Q14624, Inter-alpha-trypsin inhibitor heavy chain H4 precursor (ITI heavy chain H4) (Homo sapiens), amino acid residues 1 to 930, wherein 29-661="70 kDa inter-alpha-trypsin inhibitor heavy chain H4" and 689-930="35 kDa inter-alpha-trypsin inhibitor heavy chain H4."
[0105] FIG. 20 shows SEQ ID NO:65, GENBANK Accession No. AAP88927, clusterin (complement lysis inhibitor (Homo sapiens), amino acid residues 1 to 447.
[0106] FIG. 21 shows SEQ ID NO:66, GENBANK Accession No. AAR89159, C4A (Homo sapiens), amino acid residues 1 to 534.
[0107] FIG. 22 shows SEQ ID NO:67, GENBANK Accession No. NP--068657, fibrinogen, alpha chain isoform alpha preproprotein (Homo sapiens), amino acid residues 1 to 644, wherein 20-35 product="fibrinopeptide A."
[0108] FIG. 23 shows SEQ ID NO:68, GENBANK Accession No. P01042, kininogen precursor (Alpha-2-thiol proteinase inhibitor) (Homo sapiens), amino acid residues 1 to 644, wherein 381-389="Bradykinin."
[0109] FIG. 24 shows SEQ ID NO:69, GENBANK Accession No. NM--021871, Homo sapiens fibrinogen alpha chain (FGA), transcript variant alpha, mRNA.
[0110] FIG. 25 shows SEQ ID NO:70, GENBANK Accession No. NM--000039, Homo sapiens apolipoprotein A-I (APOA1), mRNA.
[0111] FIG. 26 shows SEQ ID NO:71, GENBANK Accession No. NM--000482, Homo sapiens apolipoprotein A-IV (APOA4), mRNA.
[0112] FIG. 27 shows SEQ ID NO:72, GENBANK Accession No. NM 000041, Homo sapiens apolipoprotein E (APOE), mRNA.
[0113] FIG. 28 shows SEQ ID NO:73, GENBANK Accession No. NM--000893, Homo sapiens kininogen (KNG1).
[0114] FIG. 29 shows SEQ ID NO:74, GENBANK Accession No. NM--000129, Homo sapiens coagulation factor XIII, A1 polypeptide (F13A1), mRNA.
[0115] FIG. 30 shows SEQ ID NO:75, GENBANK Accession No. NM--000371, Homo sapiens transthyretin (prealbumin, amyloidosis type I)(TTR), mRNA.
[0116] FIG. 31 shows, in table form, 66 reference peptides. All amino acids are D-stereo-isomers, except for the isotope-containing (L-isomer). Isotope-labeled amino acids: L, 13C(6)-Leu; F, 13C(6-ring)-Phe; V, 13C(5)/15N(1)-Val. (Note: isotope labels result in a molecular mass increase by 6 Da for each peptide). Surrogate marker code: P, prostate cancer; B, breast cancer; BL, bladder cancer; T, thyroid cancer; +, median ion intensity of this particular peptide in MALDI-TOF MS is higher in cancer samples than in controls; -, median ion intensity lower in cancer than controls. FIG. 31 discloses SEQ ID NOS 24-25, 6, 5, 4, 3, 2, 1, 116, 61, 58, 57, 56, 55, 60, 62, 12, 28, 27, 75, 11, 26, 10, 9, 8, 129, 130, 31, 30, 22, 77, 33, 23, 32, 39, 131-132, 16, 83, 15, 38, 14, 13, 133, 35, 34, 40-41, 44, 42-43, 45, 48, 46-47, 50, 49, 18, 17, 134, 20, 19, 52, 51 and 53-54, respectively, in order of appearance.
[0117] FIG. 32 shows the MALDI-based, relative quantitation of serum peptides: A, normalized ion intensities as spectral overlays and B, as a heat plot. C shows the relative quantitation of normalized ion intensities in bar graph form. FIG. 32B discloses SEQ ID NOS 27, 11, 10, 9, 8 and 12, respectively, in order of appearance.
[0118] FIG. 33 shows, in table form, founder peptides. Total 15 syntheses, including 2 (#7 and 11) or more multi-samplings; cleavages, purifications, QC and quantitation. Isotope-labeled amino acids: L, 13C(6)-Leu; F, 13C(6-ring)-Phe; V, 13C(5)/15N(1)-Val; A, 13C(3)/15N(1)-Ala; resulting in molecular mass increase of 12 Da per peptide. FIG. 33 discloses SEQ ID NOS 116, 55, 135, 127, 77, 136, 137-141, 35, 142-143, 43, 47, 17, 134 and 144-145, respectively, in order of appearance.
[0119] FIG. 34A shows median ion intensities in MALDI spectra taken of breast cancer sera vs. control sera. FIG. 34B shows selected views of isotopically resolved or partially resolved peptide-ion peaks; red, breast cancer; black, controls. FIG. 34 discloses SEQ ID NOS 127, 8-10, 26, 11, 27-28, 12 and 146-148, respectively, in order of appearance.
[0120] FIG. 35 shows ten peptide-triplets and plots of the ratios between exogenously derived peptides and reference peptide calculated. Inset is a small section of the MALDI spectrum showing the position of the monoisotopic envelopes for each of the three iso-peptides. FIG. 34 discloses SEQ ID NOS 127, 8-10, 26, 11, 27-28, 12 and 146-148, respectively, in order of appearance.
DETAILED DESCRIPTION OF THE INVENTION
I. Definitions
[0121] Unless defined otherwise, all technical and scientific terms used herein have the meaning commonly understood by a person skilled in the art to which this invention belongs. As used herein, the following terms have the meanings ascribed to them unless specified otherwise.
[0122] A "subject" is a vertebrate, preferably a mammal, more preferably a primate and still more preferably a human. Mammals include, but are not limited to, primates, humans, farm animals, sport animals, and pets.
[0123] As used herein, "serum" refers to the fluid portion of the blood obtained after removal of the fibrin clot and blood cells, distinguished from the plasma in circulating blood. As used herein, "plasma" refers to the fluid, noncellular portion of the blood, distinguished from the serum obtained after coagulation.
[0124] As used herein, "sample" or "biological sample" refers to anything, which may contain an analyte (e.g., peptide) for which an analyte assay is desired. The sample may be a biological sample, such as a biological fluid or a biological tissue. Examples of biological fluids include urine, blood, plasma, serum, saliva, semen, stool, sputum, cerebral spinal fluid, tears, mucus, amniotic fluid or the like. Biological tissues are aggregates of cells, usually of a particular kind including, for example, connective, epithelium, muscle and nerve tissues. Examples of biological tissues also include organs, tumors, lymph nodes, arteries and individual cell(s).
[0125] The term "isolated" refers to one or more compositions obtained from and/or contained in a sample apart from the body.
[0126] The term "identified" as in an "identified peptide" or "peptide profile" refers to one or more compositions or information relating thereto (e.g., a peptide and its amino acid sequence information) obtained under conditions of selection. Such information may optionally be stored by electronic means.
[0127] As used herein, the terms "gene" and "recombinant gene" refer to nucleic acid molecules comprising an open reading frame encoding a marker protein.
[0128] "Gas phase ion spectrometer" refers to an apparatus that detects gas phase ions. Gas phase ion spectrometers include an ion source that supplies gas phase ions. Gas phase ion spectrometers include, for example, mass spectrometers, ion mobility spectrometers, and total ion current measuring devices. "Gas phase ion spectrometry" refers to the use of a gas phase ion spectrometer to detect gas phase ions.
[0129] "Mass spectrometer" refers to a gas phase ion spectrometer that measures a parameter that can be translated into mass-to-charge ratios of gas phase ions. Mass spectrometers generally include an ion source and a mass analyzer. Examples of mass spectrometers are time-of-flight, magnetic sector, quadrupole filter, ion trap, ion cyclotron resonance, electrostatic sector analyzer and hybrids of these. "Mass spectrometry" refers to the use of a mass spectrometer to detect gas phase ions.
[0130] "Laser desorption mass spectrometer" refers to a mass spectrometer that uses laser energy as a means to desorb, volatilize, and ionize an analyte.
[0131] "Tandem mass spectrometer" refers to any mass spectrometer that is capable of performing two successive stages of m/z-based discrimination or measurement of ions, including ions in an ion mixture. The phrase includes mass spectrometers having two mass analyzers that are capable of performing two successive stages of m/z-based discrimination or measurement of ions tandem-in-space. The phrase further includes mass spectrometers having a single mass analyzer that is capable of performing two successive stages of m/z-based discrimination or measurement of ions tandem-in-time. The phrase thus explicitly includes Qq-TOF mass spectrometers, ion trap mass spectrometers, ion trap-TOF mass spectrometers, TOF-TOF mass spectrometers, Fourier transform ion cyclotron resonance mass spectrometers, electrostatic sector--magnetic sector mass spectrometers, and combinations thereof.
[0132] "Mass analyzer" refers to a sub-assembly of a mass spectrometer that comprises means for measuring a parameter that can be translated into mass-to-charge ratios of gas phase ions. In a time-of-flight mass spectrometer the mass analyzer comprises an ion optic assembly, a flight tube and an ion detector.
[0133] The term "MALDI" is used herein to refer to Matrix-Assisted Laser Desorption/Ionization, a process wherein analyte is embedded in a solid or crystalline "matrix" of light-absorbing molecules (e.g., nicotinic, sinapinic, or 3-hydroxypicolinic acid), then desorbed by laser irradiation and ionized from the solid phase into the gaseous or vapor phase, and accelerated as intact molecular ions towards a detector. The "matrix" is typically a small organic acid mixed in solution with the analyte in a 10,000:1 molar ratio of matrix/analyte. The matrix solution can be adjusted to neutral pH before use.
[0134] The term "MALDI-TOF MS" is used herein to refer to Matrix-Assisted Laser Desorption/Ionization Time-of-Flight mass spectrometry.
[0135] The term "MALDI ionization surface" is used herein to refer to a surface for presentation of matrix-embedded analyte into a mass spectrometer for MALDI. In general, the terms "probe" or "probe element" are used interchangeably to refer to a device for presenting analyte into a mass spectrometer for irradiation and desorption. Metals such as gold, copper and stainless steel are typically used to form MALDI ionization surfaces. However, other commercially-available inert materials (e.g., glass, silica, nylon and other synthetic polymers, agarose and other carbohydrate polymers, and plastics) can be used where it is desired to use the surface to actively capture an analyte or as a reaction zone for chemical modification of the analyte.
[0136] "Solid support" refers to a solid material, which can be derivatized with, or otherwise attached to, a capture reagent. Exemplary solid supports include probes, microtiter plates and chromatographic resins.
[0137] "Eluant" or "wash solution" refers to an agent, typically a solution, which is used to affect or modify adsorption of an analyte to an adsorbent surface and/or remove unbound materials from the surface. The elution characteristics of an eluant can depend on, for example, pH, ionic strength, hydrophobicity, degree of chaotropism, detergent strength and temperature.
[0138] "Monitoring" refers to recording changes in a continuously varying parameter (e.g. monitoring progression of a cancer).
[0139] "Biochip" refers to a solid substrate having a generally planar surface to which an adsorbent is attached. Frequently, the surface of the biochip comprises a plurality of addressable locations, each of which location has the adsorbent bound there. Biochips can be adapted to engage a probe interface, and therefore, function as probes.
[0140] "Protein biochip" refers to a biochip adapted for the capture of polypeptides.
[0141] The terms "polypeptide," "peptide" and "protein" are used interchangeably herein to refer to a polymer of amino acid residues. The terms apply to amino acid polymers in which one or more amino acid residue is an analog or mimetic of a corresponding naturally occurring amino acid, as well as to naturally occurring amino acid polymers. Polypeptides can be modified, e.g., by the addition of carbohydrate residues to form glycoproteins. The terms "polypeptide," "peptide" and "protein" include glycoproteins, as well as non-glycoproteins.
[0142] An "exogenous peptide" is a peptide obtained from a biological source that is external to the subject's body or by synthetic means.
[0143] The terms "peptide", "peptide marker", "marker" and "biomarker" are used interchangeably in the context of the present invention and refer to a polypeptide which is differentially present in a sample taken from subjects having human cancer as compared to a comparable sample taken from control subjects (e.g., a person with a negative diagnosis or undetectable cancer, normal or healthy subject). The markers are identified by molecular mass in Daltons, and include the masses centered around the identified molecular masses for each marker.
[0144] The term "detecting" means methods which include identifying the presence or absence of marker(s) in the sample, quantifying the amount of marker(s) in the sample, and/or qualifying the type of biomarker. Detecting includes identifying the presence, absence or amount of the object to be detected (e.g. a serum peptide marker).
[0145] "Diagnostic" means identifying the presence or nature of a pathologic condition, i.e., cancer. While a particular diagnostic method may not provide a definitive diagnosis of a condition, it suffices if the method provides a positive indication that aids in diagnosis.
[0146] As used herein, the term "sensitivity" is the percentage of marker-detected subjects with a particular disease.
[0147] As used herein, the term "specificity" is the percentage of subjects correctly identified as having a particular disease i.e., normal or healthy subjects. For example, the specificity is calculated as the number of subjects with a particular disease as compared to non-cancer subjects (e.g., normal healthy subjects).
[0148] The phrase "differentially present" refers to differences in the quantity and/or the frequency of a marker present in a sample taken from subjects having human cancer as compared to a control subject. For example, serum peptide markers described herein are present at an elevated level in samples of subjects compared to samples from control subjects. In contrast, other markers described herein are present at a decreased level in samples of cancer subjects compared to samples from control subjects. Furthermore, a marker can be a polypeptide, which is detected at a higher frequency or at a lower frequency in samples of human cancer subjects compared to samples of control subjects. A marker can be differentially present in terms of quantity, frequency or both. A polypeptide is differentially present between two samples if the amount of the polypeptide in one sample is statistically significantly different from the amount of the polypeptide in the other sample. Alternatively or additionally, a polypeptide is differentially present between two sets of samples if the frequency of detecting the polypeptide in the cancer subjects' samples is statistically significantly higher or lower than in the control samples.
[0149] "Optional" or "optionally" means that the subsequently described feature or structure may or may not be present in the analysis system or that the subsequently described event or circumstance may or may not occur, and that the description includes instances where said feature or structure is present and instances where the feature or structure is absent, or instances where the event or circumstance occurs and instances where it does not.
[0150] The term "obtaining" as in "obtaining the exogenous peptide" is intended to include purchasing, synthesizing or otherwise acquiring the exogenous (or indicated substance or material).
[0151] The terms "comprises", "comprising", and the like are intended to have the broad meaning ascribed to them in U.S. Patent Law and can mean "includes", "including" and the like.
[0152] It is to be understood that this invention is not limited to the particular component parts of a device described or process steps of the methods described, as such devices and methods may vary. It is also to be understood that the terminology used herein is for purposes of describing particular embodiments only, and is not intended to be limiting. As used in the specification and the appended claims, the singular forms "a", "an", and "the" include plural referents unless the context clearly indicates otherwise. Thus, for example, reference to "an analyte" includes mixtures of analytes, reference to "a MALDI ionization surface" includes two or more such ionization surfaces, reference to "a microchannel" includes more than one such component, and the like. Furthermore, reference to "cancer" may signify cancer in general (i.e., cancer of any type) or cancer of a specific type. Accordingly, the description herein of a subject as having no detectable cancer may signify a subject in which a specific type of cancer (for example, bladder) is not detectable. However, such a description may not necessarily signify that the subject has no type of cancer whatsoever.
[0153] Other definitions appear in context throughout the specification.
II. Methods and Peptide Profiles of the Invention
[0154] The present invention provides peptide markers generated from comparisons of protein profiles from subjects diagnosed with cancer and from subjects without known neoplastic diseases. In particular, the invention provides that these markers, used individually or in combination with other markers, provide a method of diagnosing and monitoring cancer in a subject having cancer of the prostate, of the bladder, or of the breast.
[0155] Markers that are differentially present in samples of cancer subjects and control subjects find application in methods and kits for determining cancer status. Accordingly, methods are provided for identifying cancer of the prostate, bladder, or breast in a subject comprising detecting a differential presence of a biomarker in subjects with cancer of the prostate, bladder, or breast vs. without cancer of the prostate, bladder, or breast in a biological sample obtained from the subject. The amount of one or more biomarkers found in a test sample compared to a control, or the presence or absence of one or more markers in the test sample provides useful information regarding the cancer status of the patient.
[0156] A. Types of Samples
[0157] The markers can be measured in different types of biological samples. The sample is preferably a biological fluid sample. Examples of a biological fluid sample useful in this invention include blood, blood serum, plasma, vaginal secretions, urine, tears, saliva, urine, tissue, cells, organs, seminal fluids, bone marrow, cerebrospinal fluid, nipple aspirate, etc. Blood serum is a preferred sample source for embodiments of the invention.
[0158] If desired, the sample can be prepared to enhance detectability of the markers. For example, to increase the detectability of markers, a blood serum sample from the subject can be preferably fractionated by, e.g., Cibacron blue agarose chromatography and single stranded DNA affinity chromatography, anion exchange chromatography, affinity chromatography (e.g., with antibodies) and the like. The method of fractionation depends on the type of detection method used. Any method that enriches for the protein of interest can be used. Typically, preparation involves fractionation of the sample and collection of fractions determined to contain the biomarkers. Methods of pre-fractionation include, for example, size exclusion chromatography, ion exchange chromatography, heparin chromatography, affinity chromatography, sequential extraction, gel electrophoresis and liquid chromatography. The analytes also may be modified prior to detection. These methods are useful to simplify the sample for further analysis. For example, it can be useful to remove high abundance proteins, such as albumin, from blood before analysis.
[0159] B. Detection of Serum Peptide Markers
[0160] Serum Peptide Marker Modification
[0161] A marker can be modified before analysis to improve its resolution or to determine its identity. For example, the markers may be subject to proteolytic digestion before analysis. Any protease can be used. Proteases, such as trypsin, that are likely to cleave the markers into a discrete number of fragments are particularly useful. The fragments that result from digestion function as a fingerprint for the markers, thereby enabling their detection indirectly. This is particularly useful where there are markers with similar molecular masses that might be confused for the marker in question. Also, proteolytic fragmentation is useful for high molecular weight markers because smaller markers are more easily resolved by mass spectrometry. In specific embodiments, the proteases occur or naturally exist in the biological sample.
[0162] To improve detection resolution of the markers, neuraminidase can, for instance, be used to remove terminal sialic acid residues from glycoproteins to improve binding to an anionic adsorbent (e.g., cationic exchange ProteinChip® arrays) and to improve detection resolution. In another example, the markers can be modified by the attachment of a tag of particular molecular weight that specifically bind to molecular markers, further distinguishing them. Optionally, after detecting such modified markers, the identity of the markers can be further determined by matching the physical and chemical characteristics of the modified markers in a protein database (e.g., SwissProt).
[0163] It has been found that proteins frequently exist in a sample in a plurality of different forms characterized by a detectably different mass. These forms can result from either, or both, of pre- and post-translational modification. Pre-translational modified forms include allelic variants, slice variants and RNA editing forms. Post-translationally modified forms include forms resulting from proteolytic cleavage (e.g., fragments of a parent protein), glycosylation, phosphorylation, lipidation, oxidation, methylation, cystinylation, sulphonation and acetylation. Modified forms of any marker of this invention also may be used, themselves, as biomarkers. In certain cases the modified forms may exhibit better discriminatory power in diagnosis than the specific forms set forth herein.
[0164] Serum Peptide Marker Purification
[0165] For some of the method embodiments of the invention, it may be helpful to purify the marker detected by the methods disclosed herein prior to subsequent analysis. Nearly any means known to the art for the purification and separation of small molecular weight substances, e.g., anion or cation exchange chromatography, gas chromatography, liquid chromatography or high pressure liquid chromatography may be used. Methods of selecting suitable separation and purification techniques and means of carrying them out are known in the art (see, e.g., Labadarious et. al., J. Chromatography (1984) 310:223-231, and references cited therein; and Shahrokhin and Gehrke, J. Chromatography (1968) 36:31-41, and Niessen J. Chromatography (1998) 794:407-435).
[0166] In another embodiment of the method of the invention, purification of the marker comprises fractioning a sample comprising one or more protein markers by size-exclusion chromatography and collecting a fraction that includes the one or more marker; and/or fractioning a sample comprising the one or more markers by anion exchange chromatography and collecting a fraction that includes the one or more markers. Fractionation is monitored for purity on phase and immobilized nickel arrays. Generating data on immobilized marker fractions on an array is accomplished by subjecting the array to laser ionization and detecting intensity of signal for mass/charge ratio; and transforming the data into computer readable form. Preferably, fractions are subjected to gel electrophoresis and correlated with data generated by mass spectrometry. In one aspect, gel bands representative of potential markers are excised and subjected to enzymatic treatment and are applied to biochip arrays for peptide mapping.
[0167] Methods of Detection
[0168] Any suitable method can be used to detect one or more of the markers described herein. Successful practice of the invention can be achieved with one or a combination of methods that can detect and, preferably, quantify the markers. These methods include, without limitation, hybridization-based methods including those employed in biochip arrays, mass spectrometry (e.g., laser desorption/ionization mass spectrometry), fluorescence (e.g. sandwich immunoassay), surface plasmon resonance, ellipsometry and atomic force microscopy. Methods may further include, by one or more of electrospray ionization mass spectrometry (ESI-MS), ESI-MS/MS, ESI-MS/(MS)n, matrix-assisted laser desorption ionization time-of-flight mass spectrometry (MALDI-TOF-MS), surface-enhanced laser desorption/ionization time-of-flight mass spectrometry (SELDI-TOF-MS), desorption/ionization on silicon (DIOS), secondary ion mass spectrometry (SIMS), quadrupole time-of-flight (Q-TOF), atmospheric pressure chemical ionization mass spectrometry (APCI-MS), APCI-MS/MS, APCI-(MS)n, atmospheric pressure photoionization mass spectrometry (APPI-MS), APPI-MS/MS, and APPI-(MS)n, quadrupole mass spectrometry, fourier transform mass spectrometry (FTMS), and ion trap mass spectrometry, where n is an integer greater than zero.
[0169] Biochip-Based Methods
[0170] Detection methods may include use of a biochip array. Biochip arrays useful in the invention include protein and nucleic acid arrays. One or more markers are captured on the biochip array and subjected to laser ionization to detect the molecular weight of the markers. Analysis of the markers is, for example, by molecular weight of the one or more markers against a threshold intensity that is normalized against total ion current.
[0171] The biochip surfaces may, for example, be ionic, anionic, hydrophobic; comprised of immobilized nickel or copper ions, comprised of a mixture of positive and negative ions; and/or comprised of one or more antibodies, single or double stranded nucleic acids, proteins, peptides or fragments thereof; amino acid probes, or phage display libraries. Many protein biochips are described in the art. These include, for example, protein biochips produced by Ciphergen Biosystems (Fremont, Calif.), Packard BioScience Company (Meriden Conn.), Zyomyx (Hayward, Calif.) and Phylos (Lexington, Mass.). Examples of such protein biochips are described in the following patents or patent applications: U.S. Pat. No. 6,225,047 (Hutchens and Yip, "Use of retentate chromatography to generate difference maps," May 1, 2001); International publication WO 99/51773 (Kuimelis and Wagner, "Addressable protein arrays," Oct. 14, 1999); U.S. Pat. No. 6,329,209 (Wagner et al., "Arrays of protein-capture agents and methods of use thereof," Dec. 11, 2001) and International publication WO 00/56934 (Englert et al., "Continuous porous matrix arrays," Sep. 28, 2000).
[0172] Markers may be captured with capture reagents immobilized to a solid support, such as a biochip, a multiwell microtiter plate, a resin, or nitrocellulose membranes that are subsequently probed for the presence of proteins. Capture can be on a chromatographic surface or a biospecific surface. For example, a sample containing the markers, such as serum, may be placed on the active surface of a biochip for a sufficient time to allow binding. Then, unbound molecules are washed from the surface using a suitable eluant, such as phosphate buffered saline. In general, the more stringent the eluant, the more tightly the proteins must be bound to be retained after the wash.
[0173] Upon capture on a biochip, analytes can be detected by a variety of detection methods selected from, for example, a gas phase ion spectrometry method, an optical method, an electrochemical method, atomic force microscopy and a radio frequency method. Gas phase ion spectrometry methods are described herein. Of particular interest is the use of mass spectrometry, and in particular, SELDI. Optical methods include, for example, detection of fluorescence, luminescence, chemiluminescence, absorbance, reflectance, transmittance, birefringence or refractive index (e.g., surface plasmon resonance, ellipsometry, a resonant mirror method, a grating coupler waveguide method or interferometry). Optical methods include microscopy (both confocal and non-confocal), imaging methods and non-imaging methods. Immunoassays in various formats (e.g., ELISA) are popular methods for detection of analytes captured on a solid phase. Electrochemical methods include voltammetry and amperometry methods. Radio frequency methods include multipolar resonance spectroscopy.
[0174] Mass Spectrometry-Based Methods
[0175] Mass spectrometry (MS) is a well-known tool for analyzing chemical compounds. Thus, in one embodiment, the methods of the present invention comprise performing quantitative MS to measure the serum peptide marker. The method may be performed in an automated (Villanueva, et al., Nature Protocols (2006) 1(2):880-891) or semi-automated format. This can be accomplished, for example with MS operably linked to a liquid chromatography device (LC-MS/MS or LC-MS) or gas chromatography device (GC-MS or GC-MS/MS). Methods for performing MS are known in the field and have been disclosed, for example, in US Patent Application Publication Nos: 20050023454; 20050035286; U.S. Pat. No. 5,800,979 and references disclosed therein.
[0176] The protein fragments, whether they are peptides derived from the main chain of the protein or are residues of a side-chain, are collected on the collection layer. They may then be analyzed by a spectroscopic method based on matrix-assisted laser desorption/ionization (MALDI) or electrospray ionization (ESI). The preferred procedure is MALDI with time of flight (TOF) analysis, known as MALDI-TOF MS. This involves forming a matrix on the membrane, e.g. as described in the literature, with an agent which absorbs the incident light strongly at the particular wavelength employed. The sample is excited by UV, or IR laser light into the vapour phase in the MALDI mass spectrometer. Ions are generated by the vaporization and an ion plume. The ions are accelerated in an electric field and separated according to their time of travel along a given distance, giving a mass/charge (m/z) reading which is very accurate and sensitive. MALDI spectrometers are commercially available from PerSeptive Biosystems, Inc. (Frazingham, Mass., USA) and are described in the literature, e.g. M. Kussmann and P. Roepstorff, cited above.
[0177] Magnetic-based serum processing can be combined with traditional MALDI-TOF. Through this approach, improved peptide capture is achieved prior to matrix mixture and deposition of the sample on MALDI target plates. Accordingly, methods of peptide capture are enhanced through the use of derivatized magnetic bead based sample processing.
[0178] MALDI-TOF MS allows scanning of the fragments of many proteins at once. Thus, many proteins can be run simultaneously on a polyacrylamide gel, subjected to a method of the invention to produce an array of spots on the collecting membrane, and the array may be analyzed. Subsequently, automated output of the results is provided by using the ExPASy server, as at present used for MIDI-TOF MS and to generate the data in a form suitable for computers.
[0179] Other techniques for improving the mass accuracy and sensitivity of the MALDI-TOF MS can be used to analyze the fragments of protein obtained on the collection membrane. These include the use of delayed ion extraction, energy reflectors and ion-trap modules. In addition, post source decay and MS--MS analysis are useful to provide further structural analysis. With ESI, the sample is in the liquid phase and the analysis can be by ion-trap, TOF, single quadrupole or multi-quadrupole mass spectrometers. The use of such devices (other than a single quadrupole) allows MS--MS or MSn analysis to be performed. Tandem mass spectrometry allows multiple reactions to be monitored at the same time.
[0180] Capillary infusion may be employed to introduce the marker to a desired MS implementation, for instance, because it can efficiently introduce small quantities of a sample into a mass spectrometer without destroying the vacuum. Capillary columns are routinely used to interface the ionization source of a MS with other separation techniques including gas chromatography (GC) and liquid chromatography (LC). GC and LC can serve to separate a solution into its different components prior to mass analysis. Such techniques are readily combined with MS, for instance. One variation of the technique is that high performance liquid chromatography (HPLC) can now be directly coupled to mass spectrometer for integrated sample separation/and mass spectrometer analysis.
[0181] Quadrupole mass analyzers may also be employed as needed to practice the invention. Fourier-transform ion cyclotron resonance (FTMS) can also be used for some invention embodiments. It offers high resolution and the ability of tandem MS experiments. FTMS is based on the principle of a charged particle orbiting in the presence of a magnetic field. Coupled to ESI and MALDI, FTMS offers high accuracy with errors as low as 0.001%.
[0182] In one embodiment, the marker qualification methods of the invention may further comprise identifying significant peaks from combined spectra. The methods may also further comprise searching for outlier spectra. In another embodiment, the method of the invention further comprises determining distant dependent K-nearest neighbors.
[0183] In another embodiment of the method of the invention, an ion mobility spectrometer can be used to detect and characterize serum peptide markers. The principle of ion mobility spectrometry is based on different mobility of ions. Specifically, ions of a sample produced by ionization move at different rates, due to their difference in, e.g., mass, charge, or shape, through a tube under the influence of an electric field. The ions (typically in the form of a current) are registered at the detector which can then be used to identify a marker or other substances in a sample. One advantage of ion mobility spectrometry is that it can operate at atmospheric pressure.
[0184] For the mass values of the markers disclosed herein, the mass accuracy of the spectral instrument is considered to be about within +/-0.15 percent of the disclosed molecular weight value. Additionally, to such recognized accuracy variations of the instrument, the spectral mass determination can vary within resolution limits of from about 400 to 1000 m/dm, where m is mass and dm is the mass spectral peak width at 0.5 peak height. Mass accuracy and resolution variances and thus meaning of the term "about" with respect to the mass of each of the markers described herein is inclusive of variants of the markers as may exist due to sex, genotype and/or ethnicity of the subject and the particular cancer or origin or stage thereof.
[0185] In an additional embodiment of the methods of the present invention, multiple markers are measured. The use of multiple markers increases the predictive value of the test and provides greater utility in diagnosis, toxicology, patient stratification and patient monitoring. The process called "Pattern recognition" detects the patterns formed by multiple markers greatly improves the sensitivity and specificity of clinical proteomics for predictive medicine. Subtle variations in data from clinical samples indicate that certain patterns of protein expression can predict phenotypes such as the presence or absence of a certain disease, a particular stage of cancer-progression, or a positive or adverse response to drug treatments.
[0186] C. Data Analysis
[0187] Data generated by desorption and detection of markers can be analyzed using any suitable means. In one embodiment, data is analyzed and/or stored by electronic means, such as with the use of a programmable digital computer. The computer program generally contains a readable medium that stores codes. Certain code can be devoted to memory that includes the location of each feature on a probe, the identity of the adsorbent at that feature and the elution conditions used to wash the adsorbent. The computer also contains code that receives as input, data on the strength of the signal at various molecular masses received from a particular addressable location on the probe. This data can indicate the number of markers detected, including the strength of the signal generated by each marker.
[0188] Data analysis can include the steps of determining signal strength (e.g., height of peaks) of a marker detected and removing "outliers" (data deviating from a predetermined statistical distribution). The observed peaks can be normalized, a process whereby the height of each peak relative to some reference is calculated. For example, a reference can be background noise generated by instrument and chemicals (e.g., energy absorbing molecule) which is set as zero in the scale. Then the signal strength detected for each marker or other biomolecules can be displayed in the form of relative intensities in the scale desired (e.g., 100). Alternatively, a standard (e.g., a serum protein) may be admitted with the sample so that a peak from the standard can be used as a reference to calculate relative intensities of the signals observed for each marker or other markers detected.
[0189] The computer can transform the resulting data into various formats for displaying, such as "spectrum view or retentate map," "peak map," "gel view," "3-D overlays," "difference map view," and Spotfire Scatter Plot. For each sample, markers that are detected and the amount of markers present in the sample can be saved in a computer readable medium. This data can then be compared to a control (e.g., a profile or quantity of markers detected in control, e.g., subjects in whom human cancer is undetectable).
[0190] When the sample is measured and data is generated, e.g., by mass spectrometry, the data is then analyzed by a computer software program. Generally, the software can comprise code that converts signal from the mass spectrometer into computer readable form. The software also can include code that applies an algorithm to the analysis of the signal to determine whether the signal represents a "peak" in the signal corresponding to a marker of this invention, or other useful markers. The software also can include code that executes an algorithm that compares signal from a test sample to a typical signal characteristic of "normal" and human cancer and determines the closeness of fit between the two signals. The software also can include code indicating which the test sample is closest to, thereby providing a probable diagnosis.
[0191] TOF-to-M/Z transformation involves the application of an algorithm that transforms times-of-flight into mass-to-charge ratio (M/Z). In this step, the signals are converted from the time domain to the mass domain. That is, each time-of-flight is converted into mass-to-charge ratio, or M/Z. Calibration can be done internally or externally. In internal calibration, the sample analyzed contains one or more analytes of known M/Z. Signal peaks at times-of-flight representing these massed analytes are assigned the known M/Z. Based on these assigned M/Z ratios, parameters are calculated for a mathematical function that converts times-of-flight to M/Z. In external calibration, a function that converts times-of-flight to M/Z, such as one created by prior internal calibration, is applied to a time-of-flight spectrum without the use of internal calibrants.
[0192] Baseline subtraction improves data quantification by eliminating artificial, reproducible instrument offsets that perturb the spectrum. It involves calculating a spectrum baseline using an algorithm that incorporates parameters such as peak width, and then subtracting the baseline from the mass spectrum.
[0193] High frequency noise signals are eliminated by the application of a smoothing function. A typical smoothing function applies a moving average function to each time-dependent bin. In an improved version, the moving average filter is a variable width digital filter in which the bandwidth of the filter varies as a function of, e.g., peak bandwidth, generally becoming broader with increased time-of-flight. See, e.g., WO 00/70648, Nov. 23, 2000 (Gavin et al., "Variable Width Digital Filter for Time-of-flight Mass Spectrometry").
[0194] As mentioned briefly above, analysis generally involves the identification of peaks in the spectrum that represent signal from an analyte. Peak data from one or more spectra can be subject to further analysis by, for example, creating a spreadsheet in which each row represents a particular mass spectrum, each column represents a peak in the spectra defined by mass, and each cell includes the intensity of the peak in that particular spectrum. Various statistical or pattern recognition approaches can applied to the data.
[0195] The spectra that are generated in embodiments of the invention can be classified using a pattern recognition process that uses a classification model. In some embodiments, data derived from the spectra (e.g., mass spectra or time-of-flight spectra) that are generated using samples such as "known samples" can then be used to "train" a classification model. A "known sample" is a sample that is pre-classified (e.g., cancer or not cancer). The data that are derived from the spectra and are used to form the classification model can be referred to as a "training data set". Once trained, the classification model can recognize patterns in data derived from spectra generated using unknown samples. The classification model can then be used to classify the unknown samples into classes. This can be useful, for example, in predicting whether or not a particular biological sample is associated with a certain biological condition (e.g., diseased vs. non diseased).
[0196] The classification models can be formed on and used on any suitable digital computer. The digital computer that is used may be physically separate from the mass spectrometer that is used to create the spectra of interest, or it may be coupled to the mass spectrometer.
[0197] MALDI-TOF MS-Based Quantitative Profiling
[0198] Relative quantitation of serum peptides of interest can be done by comparing the MS-ion intensities to those of added, exogenous, isotopically labeled, reference peptides, having the exact same sequence and otherwise same chemical properties as the endogenous ones (i.e. distinguishable by molecular mass only). As such, all peptide pairs will display the exact same MALD-ionization characteristics. Comparing ion intensities will therefore provide a means of normalizing the values for each peptide. For instance, when the ion intensity of peptide A is two-fold higher than the spiked reference in sample X but two-fold lower in sample Y, then the difference would be about 4-fold between the same peptide in the two samples. When done on a systematic, larger scale, this approach can be referred to as relative "quantitative" profiling. Of note, the reference peptides will be added to the raw serum (i.e., before peptide extraction and MALDI sample prep), so that putative losses during processing are accounted for.
[0199] 66 reference peptides (listed in FIG. 31) can be synthesized, 44 of which have been determined to be surrogate markers for either prostate or breast cancer, 18 additional ones for bladder or thyroid cancer, and 4 non-marker control peptides. These reference peptides should not degrade in serum, and are, thus, synthesized using D-amino acids (i.e., D-stereo-isomers). One amino acid (Leu, Val, or Phe) of each reference peptide is labeled by incorporation of 6 (L, F) or 5 (V) 13C isotopes, and one additional 15N isotope (V only). 13C-labeled, FMOC-amino acids (for solid phase-peptide synthesis) are only commercially available in the L-form, which should not compromise stability as peptide bonds between a D- and L-amino acids are not protease sensitive.
[0200] MALDI-TOF MS-Based Protease Assays
[0201] A large part of the human serum `peptidome`, as detected by MALDI-TOF MS, is generated ex vivo (i.e., after blood collection) by protease degradation of blood proteins. Endoproteases produce `founder peptides` which are then pared down by exoproteases into ladder-like clusters. Panels of proteolytic activity in the blood contribute important cancer type-specific information, and that the resulting metabolic patterns have utility as surrogate markers for detection and classification of cancer. Degradation occurs during clotting. The use of exogenous synthetic peptides, identical to previously observed founder peptides, can be used to monitor cancer-specific proteolytic degradation in plasma or serum that contains proteases. Conditions in terms of time, temperature and added amounts of substrates can hereby be readily controlled. Coupled to a MALDI-based read-out, such analyses are blood "protease assays" to monitor the tumor-dependent activities inferred from prior studies. Simultaneous addition of non-degradable, exogenous reference peptides also enables relative quantitation of all rungs in the ladders.
[0202] Exogenous peptide degradation assays can be done, for example, in plasma, where there are no endogenous peptides that clutter the spectra, therefore simplifying interpretation. Thus, in addition to serving as (i) an alternative to endogenous serum peptide profiling, and as (ii) a highly reproducible, functional proteomics approach, the external peptide degradation assay (iii) permit analysis of plasma by the NY consortium, which is important as plasma is preferred by many for proteomic studies.
[0203] 15 founder peptides (listed in FIG. 33) can be synthesized, all `double-isotopically` labeled to be 12 Da heavier in molecular mass than their endogenous counterparts and 6 Da heavier than the non-degradable reference peptides. Selection is based on a sequence comparison of all previously observed peptide ladders in serum, most of which contain some known surrogate marker peptides. Synthesis, QC, quantitation and storage of the peptides will be done as described previously.
[0204] The degradation conditions and times are studied and optimized for each of the 15 synthetic founder peptides in each of the plasmas from the different groups of cancer patients and controls. The permissible inter-mixability of the different founders, and, particularly, of their resulting degradation ladders is determined in order to avoid disturbing the peak patterns (by ion suppression effects) and to avoid overlapping isotopic envelopes (when the peaks are too close).
[0205] As aminopeptidases come in varieties that remove one two or three amino acids, shorter endogenous peptides may have conceivably been derived from another precursor by leapfrogging over the stalled position. For non-degradable "founder" peptides, limited N-terminal ladders can be synthesized (by sequential sampling of resin during a pilot scale synthesis of unlabeled peptides), for instance, as shown in FIG. 33 (founder #7; five alternative `test` founder peptides), and degradability can be tested in pooled cancer patient plasma in a time course (15 min to 4 hours) experiment. Similar tests are performed for founder peptides 8, 9, 10 and 12A in FIG. 33. Each time, synthesis is carried out of the "full-length" founder, but resin sampled at 5, 4, 3, 2 and 1 amino acid away from the N-terminus, or as appropriate. The longest peptide is cleaved from the resin, purified, and tested. If no degradation in plasma is observed, the shorter versions are also cleaved, purified and tested. An isotope-labeled version of the peptide with the best founder properties (i.e., generating the best ladder in plasma) is then produced.
[0206] The assay may be divided into `founder pools` if two or more time points are too far apart or in the case of peptide inter-mixability problems. Once the ideal conditions and founder pools have been selected, and the resulting degradation products are identified, a relative quantitation aspect can be added to the blood protease assay by using the same non-degradable reference peptides as shown in FIG. 31.
[0207] D. Diagnosis
[0208] As indicated above, the invention provides methods for aiding a human cancer diagnosis using one or more markers, as specified herein. These markers can be used alone, in combination with other markers in any set, or with entirely different markers in aiding human cancer diagnosis. The markers are differentially present in samples of a human cancer patient and a normal subject in whom human cancer is undetectable. For example, some of the markers are expressed at an elevated level and/or are present at a higher frequency in human prostate cancer subjects than in normal subjects, while some of the markers are expressed at a decreased level and/or are present at a lower frequency in human prostate cancer subjects than in normal subjects. Therefore, detection of one or more of these markers in a person would provide useful information regarding the probability that the person may have prostate cancer.
[0209] The detection of the peptide marker is then correlated with a probable diagnosis of cancer. In some embodiments, the detection of the mere presence or absence of a marker, without quantifying the amount thereof, is useful and can be correlated with a probable diagnosis of cancer. The measurement of markers may also involve quantifying the markers to correlate the detection of markers with a probable diagnosis of cancer. Thus, if the amount of the markers detected in a subject being tested is different compared to a control amount (i.e., higher or lower than the control, depending on the marker), then the subject being tested has a higher probability of having cancer.
[0210] The correlation may take into account the amount of the marker or markers in the sample compared to a control amount of the marker or markers (up or down regulation of the marker or markers) (e.g., in normal subjects or in non-cancer subjects such as where cancer is undetectable). A control can be, e.g., the average or median amount of marker present in comparable samples of normal subjects in normal subjects or in non-cancer subjects such as where cancer is undetectable. The control amount is measured under the same or substantially similar experimental conditions as in measuring the test amount. As a result, the control can be employed as a reference standard, where the normal (non-cancer) phenotype is known, and each result can be compared to that standard, rather than re-running a control.
[0211] Accordingly, a marker profile may be obtained from a subject sample and compared to a reference marker profile obtained from a reference population, so that it is possible to classify the subject as belonging to or not belonging to the reference population. The correlation may take into account the presence or absence of the markers in a test sample and the frequency of detection of the same markers in a control. The correlation may take into account both of such factors to facilitate determination of cancer status.
[0212] In certain embodiments of the methods of qualifying cancer status, the methods further comprise managing subject treatment based on the status. The invention also provides for such methods where the markers (or specific combination of markers) are measured again after subject management. In these cases, the methods are used to monitor the status of the cancer, e.g., response to cancer treatment, remission of the disease or progression of the disease.
[0213] The markers of the present invention have a number of other uses. For example, they can be used to monitor responses to certain treatments of human cancer. In yet another example, the markers can be used in heredity studies. For instance, certain markers may be genetically linked. This can be determined by, e.g., analyzing samples from a population of human cancer subjects whose families have a history of cancer. The results can then be compared with data obtained from, e.g., cancer subjects whose families do not have a history of cancer. The markers that are genetically linked may be used as a tool to determine if a subject whose family has a history of cancer is pre-disposed to having cancer.
[0214] Any marker, individually, is useful in aiding in the determination of cancer status. First, the selected marker is detected in a subject sample using the methods described herein (e.g. mass spectrometry). Then, the result is compared with a control that distinguishes cancer status from non-cancer status. As is well understood in the art, the techniques can be adjusted to increase sensitivity or specificity of the diagnostic assay depending on the preference of the diagnostician.
[0215] While individual markers are useful diagnostic markers, in some instances, a combination of markers provides greater predictive value than single markers alone. The detection of a plurality of markers (or absence thereof, as the case may be) in a sample can increase the percentage of true positive and true negative diagnoses and decrease the percentage of false positive or false negative diagnoses. Thus, preferred methods of the present invention comprise the measurement of more than one marker.
[0216] E. Kits
[0217] In one aspect, the invention provides kits for monitoring and diagnosing cancer, wherein the kits can be used to detect the markers described herein. For example, the kits can be used to detect any one or more of the markers potentially differentially present in samples of cancer subjects vs. normal subjects. The kits of the invention have many applications. For example, the kits can be used to differentiate if a subject has cancer or has a negative diagnosis, thus aiding a cancer diagnosis. In another embodiment, the invention provides kits for aiding the diagnosis of cancer or the diagnosis of a specific type of cancer such as, for example, cancer of the prostate, of the bladder, or of the breast. The kits can also be used to identify compounds that modulate expression of one or more of the herein-described markers in in vitro or in vivo animal models for cancer.
[0218] In specific embodiments, kits of the invention contain an exogenous reference peptide, which is optionally isotopically labeled, for use in conducting the diagnostic assays of the invention.
[0219] The kits of the invention may include instructions for the assay, reagents, testing equipment (test tubes, reaction vessels, needles, syringes, etc.), standards for calibrating the assay, and/or equipment provided or used to conduct the assay. Reagents may include acids, bases, oxidizing agents, marker species. The instructions provided in a kit according to the invention may be directed to suitable operational parameters in the form of a label or a separate insert.
[0220] The kits may also include an adsorbent, wherein the adsorbent retains one or more markers selected from one or more of the markers described herein, and written instructions for use of the kit for detection of cancer. Such a kit could, for example, comprise: (a) a substrate comprising an adsorbent thereon, wherein the adsorbent is suitable for binding a marker, and (b) instructions to detect the marker or markers by contacting a sample with the adsorbent and detecting the marker or markers retained by the adsorbent. Accordingly, the kit could comprise (a) a DNA probe that specifically binds to a marker; and (b) a detection reagent. Such a kit could further comprise an eluant (as an alternative or in combination with instructions) or instructions for making an eluant, wherein the combination of the adsorbent and the eluant allows detection of the markers using gas phase ion spectrometry.
[0221] Optionally, the kit may further comprise a standard or control information so that the test sample can be compared with the control infatuation standard to determine if the test amount of a marker detected in a sample is a diagnostic amount consistent with a diagnosis of cancer.
[0222] This invention is further illustrated by the following examples, which should not be construed as limiting. A skilled artisan should readily understand that other similar instruments with equivalent function/specification, either commercially available or user modified, are suitable for practicing the instant invention. Rather, the invention should be construed to include any and all applications provided herein and all equivalent variations within the skill of the ordinary artisan.
EXAMPLES
Example 1
Unsupervised Hierarchical Clustering and PCA of Mass Spectrometry-Based Serum Peptide Profiling Data
[0223] In order to determine if selected patterns of serum peptides with known sequences can (i) separate cancer from non-cancer, (ii) distinguish between different types of solid tumors, and (iii) allow class prediction with an independent validation set, the serum peptide profiles were analyzed from patients with advanced prostate, breast, or bladder cancer, as well as control sera from healthy volunteers, all collected using a standardized protocol (Villanueva, J., et al., 2005. J Proteome Res: 4:1060-1072).
[0224] A. Methods
[0225] Serum Samples
[0226] Blood samples from n=33 healthy volunteers (mixed gender; ages 23 to 49) with no known malignancies and from patients diagnosed with advanced prostate cancer (n=32), bladder cancer (n=20), or breast cancer (n=21) were collected following a standard clinical protocol (Villanueva, J., et al., 2005. J Proteome Res: 4:1060-1072) and approved by the MSKCC Institutional Review and Privacy Board. Blood samples were obtained in 8.5-mL, BD Vacutainer, glass `red-top` tubes (Becton Dickinson # 366430, Franklin Lakes, N.J.), allowed to clot at room temperature for 1 hour, and centrifuged at 1400-2000 RCF for 10 min, at RT.
[0227] Sera (upper phase) were transferred to four 4-mL cryovials (Fisher # 0566966), ˜1 mL serum in each, and stored frozen at -80° C. until further use (Villanueva, J., et al. 2005. J Proteome Res: 4:1060-1072). A similar procedure was followed for preparation of plasma in heparin-containing `green-top` tubes (BD #366480), except that centrifugation was done immediately after blood collection. Upon delivery at the mass spectrometry (MS) laboratory, the cryovials (source vials) were barcoded. One cryovial of each sample was thawed on ice and used to generate nine smaller aliquots (50 μL each) in barcoded micro-eppendorf tubes and stored at -80° C. in barcoded freezer boxes. In the present study, every serum sample underwent two freeze/thaw cycles, the second thawing step occurring immediately prior to peptide extraction and MS analysis.
[0228] All 106 serum samples were processed automatically as a single batch with a robot liquid handler followed within one hour by automated MALDI-TOF mass spectrometric analysis. The four clinical groups were randomized before automated solid-phase peptide extraction and MALDI-TOF mass spectrometry.
[0229] Automated, Solid-Phase Peptide Extraction
[0230] Serum peptide profiling was accomplished using a technology platform developed for simultaneous measurement of large numbers of serum polypeptides (Villanueva, J., et al. 2004. Anal Chem 76:1560-1570). It uses magnetic bead-based, solid-phase extraction of predominantly small peptides followed by a MALDI-TOF MS read-out. The system is intrinsically more sensitive than any surface capture on chips, as spherical particles have larger combined surface areas than small-diameter spots. When combined with high-resolution MS, hundreds of peptides are detected in a single droplet of serum.
[0231] For the present analysis, peptides were captured and concentrated using SiMAG-C8/K superparamagnetic, silica-based particles (micron diameter; 80% iron oxide; non-porous), bearing C8 reversed-phase (RP) ligands (Chemicell, Berlin, Germany). All analyses were performed in a 96-well format, using the same batch of C8 magnetic particles, in 0.2-mL polypropylene tubes (8×12-tube `Temp Plate II`; USA Scientific, Ocala, Fla.).
[0232] The protocol is based on a detailed investigation of serum handling, RP ligand and eluant selection (Villanueva, J., et al. 2004. Anal Chem 76:1560-1570), and is automated using a `Genesis Freedom 100` (Tecan; Research Triangle Park, N.C.) liquid handling workstation for throughput and reproducibility. The system was programmed either directly via its standard software or, when individual wells needed to be accessed independently, indirectly through its work-lister capability. This system automates all of the liquid-handling steps, including magnetic separation via a robotic manipulating arm, mixing of eluates with MALDI matrix and deposition onto the Bruker 384-spot MALDI target plates. A computer randomization program was used to position case and control samples for both solid-phase extraction and mass spectrometry.
[0233] Mass Spectrometry
[0234] Peptide profiles were analyzed with an Autoflex MALDI-TOF mass spectrometer (Bruker; Bremen, Germany) equipped with a 337 nm nitrogen laser, a gridless ion source, delayed-extraction (DE) electronics, a high-resolution timed ion selector (TIS), and a 2 GHz digitizer. Separate spectra were obtained for two restricted mass-to-charge (m/z) ranges, corresponding to polypeptides with molecular mass of 0.7-4 kDa ("≦4 kD") and 4-15 kDa ("≧4 kD") (assuming z=1), under specifically optimized instrument settings. Each spectrum was the result of 400 laser shots, per m/z segment per sample, delivered in four sets of 100 shots (at 50-Hz frequency) to each of four different locations on the surface of the matrix spot.
[0235] The peak list (normalized intensities of 651 m/z-peaks, i.e., peptide-ions, in all 106 samples) generated was subjected to a Mann-Whitney U test, for each of the cancer groups individually versus the control. In a first selection, 196 peaks with adjusted p-values <0.00001 (arbitrarily chosen) for at least one cancer type were retained. This number was reduced to 68 by applying an arbitrary threshold (500 `units`) to the median intensities of each individual peptide peak within a group. An m/z-peak was selected if it passed the threshold in at least one of the cancer groups or the control (FIG. 13).
[0236] A weekly performance test was carried out with commercial human reference serum (# S-7023, lot 034K8937; Sigma, St Louis, Mo.), and the effective laser energy delivered to the target was adjusted when necessary. The entire irradiation program was automated using the instrument's `AutoXecute` function. Spectra were acquired in linear mode geometry under 20 kV (18.6 kV during DE) of ion accelerating and -1.3 kV multiplier potentials, and with gating of mass ions ≦400 m/z (≦4 kD segment) or ≦3,000 m/z (≧4 kD segment). DE was maintained for 80 (≦4 kD) or 50 nanoseconds (≧4 kD) to give appropriate time-lag focusing after each laser shot.
[0237] Peptide samples were consistently mixed with two volumes of pre-made a-cyano-4-hydroxycinnamic acid (ACCA) matrix solution (Agilent; Palo Alto, Calif.), deposited onto the stainless steel target surface, in every other column of the 384-spot layout, and allowed to dry at room temperature. Thirty fmoles (per peptide) and 500 fmoles (per protein) of commercially available calibration standards (Bruker Daltonics # 206195 (<4 kD) and # 206355 (>4 kD)) were also mixed with ACCA matrix and separately deposited onto the target plates, adjacent to each spotted serum sample (one sample/one standard), in the alternating columns. All spectra were acquired within less than 1-2 hours after completion of robotic sample processing, as an adverse effect had previously been observed upon increasing times between crystallization and mass spectral acquisition.
[0238] The AutoFlex MALDI-TOF has a probe at the output of the laser, before the attenuator. The accuracy of this monitoring device was verified prior to the calibration of the settings of the attenuator (displayed on the computer screen as an arbitrary scale of 100-0%) by measuring transmitted energy at varying %. This allowed the generation of a calibration curve to convert before-to-after attenuation laser energy. The optimal laser setting that had been empirically determined was then measured to yield 16-μJ energy per pulse, post-attenuation. Laser output energy was measured and documented on a weekly basis, and adjustments were made accordingly to compensate for fading laser energy over time.
[0239] Samples from patients with different cancers and from controls were randomly distributed during processing and analysis.
[0240] Signal Processing
[0241] Once acquired, all data were stored with a naming convention that allows each sample to be associated with its calibrant. The spectra were first converted from binary format to ASCII files containing two columns of data (x: m/z, y: intensity) by a custom written macro in FlexAnalysis (Bruker). For the lower mass range (700-4,000 Da), about 48,000 x,y-points were generated, while for the upper mass range (4-15 kDa), there were about 77,000 points.
[0242] Further data processing was carried out in MATLAB with a custom script called `Qcealign` using only the ASCII versions of the raw spectra. `Qcealign` used the `Qpeaks` program (Spectrum Square Associates, Ithaca, N.Y.) for smoothing, baseline subtraction and peak labeling. The singletwidth parameter required by `Qpeaks` was set to -400 for the lower mass range and -200 for the upper mass range, thereby specifying the resolution, (m/z)/Δ(m/z), for processing. This peak information was used automatically by `Qpeaks` in setting the parameters for smoothing, baseline-subtraction, and binning. The noise statistics were assumed `Normal`.
[0243] Following parameter selection, a setup file was created. `Qcealign` then queries the setup file to obtain a list of all the directories for processing. During a single processing run, all data files in all listed directories are aligned with each other. For each directory, singletwidth information is provided in the setup file, along with parameters controlling calibration, peak labeling sensitivity, alignment, etc. The files containing the polypeptide standards are calibrated first. The centroid positions of peaks in these calibration files are obtained from the peak table created by `Qpeaks`, compared to the known polypeptide peak positions, and a quadratic calibration equation for correcting the measured masses in each calibration file is created. The calibration equations are saved to disk for use in calibrating the mass axes of the sample files.
[0244] `Qcealign` subsequently creates a reference file to which all sample spectra will later be aligned. The first data file is loaded and calibrated by applying the curve calculated from its associated calibrant spectrum. This file's x-axis (m/z) becomes the x-axis (and thus the calibration) used in the reference file. `Qcealign` then loads all other sample files, calibrates them, and adds their intensities to the reference file's intensity. After all samples have been added, the reference spectrum becomes the average of all the sample files. The reference is processed with `Qpeaks` to find a baseline, which is subtracted, and is then normalized to unit size by dividing each intensity value by the Total Ion Count (TIC). Once normalized, a scaling factor is added by multiplying each intensity value by a user-selected number (e.g., 107). This scaling factor is constant within a data set and is used to convert the normalized spectrum to a "user friendly" scale, where most peak heights are greater than one. Next, `Qcealign` processes each sample file with `Qpeaks` to create a peak table, smoothed curve and a baseline. This spectrum is then taken for alignment.
[0245] Alignment
[0246] Processed spectra were aligned using the custom `Entropycal` program described herein above. A custom alignment algorithm, `Entropycal`, aligns sample data files to a reference file using a minimum entropy algorithm by taking unsmoothed (`raw`) baseline-corrected data. Taking raw spectra for alignment facilitates the use of all statistical information in the data; processed data contains less information. The alignment is performed in two steps: `Entropycal` and binning. `Entropycal` slides each data file by `n` data points to the right or left along the x-axis of the reference file. At each relative position n, the Shannon entropy of the sum of the two files is computed. The optimal alignment occurs at the shift that produces the minimum Shannon entropy. Second, the aligned peak lists are binned by using the resolution of the peaks: all peaks in rows within Δ(m/z) of the strongest peak at a given value of m/z are binned together, and a spreadsheet is created for further statistical analysis.
[0247] Three software modules, developed in MATLAB, were used for visualization and signal processing of the spectra. (I) Signal Processing & Preview (SPP), a graphical viewer for spectra in ASCII format, allows to plot raw and processed spectra side-by-side to review the outcome of signal processing. Furthermore, parameters of `Qpeaks` (the signal processing software) can be adjusted. (II) Mass Spectra Viewer (MSV), a visual interface for processed spectral data, plots spectra as X-Y curves (mass vs. magnitude) for examining the signatures of several groups of samples. MSV supports regular browsing functions such as scroll, zoom, highlighting, etc. (III) HeatMap (HM) displays spectra as a 2D heat map images, in which the magnitude of the peaks are color-coded on a continuous scale. In addition to browsing functions such as zoom and scroll, the rank of X- and Y-position coordinates can be reorganized without the constraints of statistical correlation that are enforced by most HeatMap commercial software packages.
[0248] Ratios were calculated by dividing the median normalized intensity of each m/z-peak in each cancer group by the median of the same m/z-peak in the control group. To avoid having to divide by zero, any median value of less than was converted to 1; this was applied to all groups. For hierarchical clustering, the 651 m/z-values were subjected to average-linkage hierarchical clustering analysis using the available algorithm in `GeneSpring`. The peaks were organized by creating mock-phylogenetic trees (dendrograms) termed `gene trees` and `experiment tree` in the software. The trees were displayed with the samples along the X-axis and the masses along the Y-axis. The clustering method for both trees also measured similarity by Standard Correlation (also known as `Pearson correlation around zero`) as the distance matrix.
[0249] A spreadsheet (`peak list`), containing the normalized intensities of all 651 peaks for each of the samples was taken for unsupervised, average-linkage hierarchical clustering using standard correlation. This resulted in a high degree of separation between each of the cancer types and the controls in either binary or multi-class comparisons (FIGS. 1B and 1C). Recognizing that correlations between patient samples involving 651 features would be difficult at different times and locations, statistical feature selection was performed to identify the most discriminant peaks.
[0250] The binned spreadsheet, containing data from spectra obtained for all samples of cancer patients or healthy subjects (106 samples total; 651 m/z values, with normalized intensities for each sample; >70,000 data points), as well as the test set for prostate (`Prostate #2`; 41 samples; ˜27,000 data points), were imported into the `GeneSpring` program (Agilent; Palo Alto, Calif.) and analyzed using various statistical algorithms, such as one-way ANOVA, PCA, hierarchical clustering, K-NN and SVM.
[0251] Different "experiments" were created in `GeneSpring` to represent the masses. No normalizations were applied to the experiment, since the masses were normalized by the database that binned them. In the parameter section of the experiments, a parameter called `cancertype` was created to label samples as prostate cancer, breast cancer, bladder cancer, or control. In the Experiment's Interpretation section, the Analysis mode was set to "Ratio (signal/control)", and all measurements were used. No Cross-Gene Error model was used.
[0252] For ANOVA, once the experiments were created, the m/z-values (`peaks`) were filtered by using non-parametric tests: Mann-Whitney test (for binary comparisons) and Kluskal-Wallis test (for multi-class comparisons) with Benjamini and Hochberg False Discovery Rate at p<1e-5. These tests are meant to find peaks that show statistically significant differences between the clinical groups studied.
[0253] For class prediction, K-nearest-neighbor (K-NN) analysis and Support Vector Machine (SVM) were carried out by using the Class Prediction Tool in `GeneSpring`. The training groups constituted either a binary comparison (prostate #1 and Control) or a multi-class comparison (prostate #1, breast, bladder and control). The test set was `prostate #2`. The Parameter to Predict was set to Cancertype. The Gene selection was set to use different groups of masses previously selected (e.g., 651, 68, 14, 13). In K-NN, the number of neighbors was set to five with a p-value decision cutoff of 1. The SVM was done with the same training sets and parameters and set to predict the Prostate #2 test set. The kernel used was polynomial dot product (Order 1) with a diagonal scaling of 0.
[0254] B. Results
[0255] 1. Distribution of Serum Peptides, Detected by MALDI-TOF MS, as a Function of Mass-to-Charge (m/z) Range and Normalized Intensity.
[0256] Peptides were extracted from 106 different serum samples (50 μL), drawn from one of three groups of cancer patients or healthy controls, analyzed by MALDI-TOF MS and the m/z-peaks were exported from the aligned spectra, as described earlier. In FIG. 11A, a total of 651 unique m/z-peaks, i.e., peptide-ions, derived from the combined spectra, are grouped in successive bins of 250 amu, starting at m/z=700.
[0257] In FIG. 11B, all peak intensities of all samples (i.e., 651×106 peaks) are grouped in successive bins of 100 arbitrary units, starting at zero. The intensities refer to normalized units that were calculated for each peak by dividing its raw intensity by the total of all the intensities in that spectrum (TIC--Total Ion Count). The resultant values were then multiplied by fixed scaling factor (1×10⁷) to convert the data to a `user-friendly` scale (i.e. most values ≧1) Serum peptide profiling resulted in a total of 651 distinct mass/charge (m/z) values resolved in the 800-15,000 Dalton range (FIG. 16A).
[0258] 2. Serum Peptides, Determined by MALDI-OF MS, Before and after Two Successive Feature Selection Steps for Candidate Markers.
[0259] One-way ANOVA Mann-Whitney test, for each individual cancer versus control, selected 196 peaks (red bars, FIG. 12) with a false positive rate of p<0.00001 (arbitrarily chosen) for at least one cancer type. This number was further reduced to 68 (yellow bars, FIG. 12) by applying an arbitrary threshold of 500 `units` to the median intensities of each individual peptide peak within a group. The threshold was set high enough to select only robust peaks in the spectra, with intensities that would permit MALDI MS/MS-based tandem mass spectrometric sequencing and to exclude closely positioned neighboring peaks or `shoulders`.
[0260] An m/z-peak was selected if this criterion was met in at least one of the cancer groups or the control (FIG. 13). When feature selection was repeated using a multi-class Kluskal-Wallis test (adjusted p<1e-5) and the same median intensity threshold as above, 214 and 67 peaks were selected (data not shown). The majority of selected peaks corresponded to peptides with molecular mass <2,000 Da; most peptides with a mass >4,000 Da were removed (FIG. 2A; FIG. 13). Thus, significance levels (p-values) were calculated for each m/z-peak using the Mann-Whitney rank sum test (for binary comparisons) or the Kruskal-Wallis test (for multi-class comparisons) (FIG. 16B).
Example 2
Feature Selection and Comparative Analysis of Serum Peptide Profiling Data
[0261] Feature Selection
[0262] The peak list (normalized intensities of 651 m/z-peaks in all 106 samples), generated as described in Example 1, above, was subjected to one-way ANOVA Mann-Whitney test for each of the three previously identified cancer groups individually vs. the control. For each of the three cancer groups versus the control, 196 peaks with a p-value <1e-5 were arbitrarily selected and retained (FIG. 12). This number was subsequently reduced to 68 by applying an arbitrary threshold (500 `units`) to the median intensities of each individual peptide peak within a group. The threshold was set high enough to only select robust peaks in the spectra, with intensities that would permit MALDI TOF/TOF-based tandem mass spectrometric sequencing and to exclude closely positioned neighboring peaks or `shoulders`. An m/z peak was selected if it passed the threshold in at least one of the cancer groups or the control.
[0263] The pie-charts depicted in FIG. 2A illustrate the effect of using a significance level (p<0.00001) cutoff by itself, or in combination with a cutoff for the median of normalized intensities (≧500) within any one group, on the m/z distribution of the candidate biomarker peptides. After the first filter, the 196 remaining peptides were redistributed in groups of 92, 76 and 28 for the increasing mass ranges. Sixty eight peptides passed the second filter; 39, 22 and merely 7 in the low-, medium- and high-mass ranges, respectively (right panel, FIG. 2A).
[0264] Examples are shown in FIGS. 2D and 3. The majority of the selected peaks corresponded to peptides with molecular mass <2,000 Da; most peptides with a mass >4,000 Da were eliminated (FIGS. 12 and 2A). Color-coded spectra from all samples were subsequently overlaid to visually inspect the 68 peaks for correct assignment, degree of separation, and overall difference between cancer and control. Of the peptides that passed the above-delineated two selection steps, 47 m/z peaks had higher intensities in one or more of the cancer groups, as compared to the controls, and 23 had lower intensities, as compared with the control. Of those, two were higher in breast cancer but lower in bladder cancer.
[0265] The total numbers of peptides of a specific cancer group that were observed to be up or down (have specific biomarker potential) were as follows: 3 peptides were up and 11 down (14 total--1 unique, 3 shared) in serum samples from prostate cancer patients, 12 up/2 down (14 total--11 unique) in breast cancer, and 36 up/22 down (58 total--43 unique) in bladder cancer (FIG. 2B).
[0266] Comparative analysis via heat map display and mass spectral overlay: Comparison of the selected features (Tables 17A-C) of the three cancer groups with controls in multi-class and binary formats was accomplished with heat maps. Heat map displays were generated using a MATLAB custom software tool.
[0267] Three software modules, developed in MATLAB, were used for visualization and signal processing of the spectra. (I) Signal Processing & Preview (SPP), a graphical viewer for spectra in ASCII format, allows the plotting of raw and processed spectra side-by-side to review the outcome of signal processing. Furthermore, parameters of `Qpeaks` (the signal processing software) can be adjusted. (II) Mass Spectra Viewer (MSV), a visual interface for processed spectral data, plots spectra as X-Y curves (mass vs. magnitude) for examining the signatures of several groups of samples. MSV supports regular browsing functions such as scroll, zoom, highlighting, etc. (III) HeatMap (HM) displays spectra as 2D heat map images, in which the magnitude of the peaks are color-coded on a continuous scale. In addition to browsing functions such as zoom and scroll, the rank of X- and Y-position coordinates can be reorganized without the constraints of statistical correlation that are enforced by most HeatMap commercial software packages.
[0268] The results, when represented in the form of heat maps in FIG. 2C, indicated that data reduction (by ˜90%) did not adversely affect the separation of the clinical groups.
[0269] Subsequently, mass spectra for the three binary comparisons (cancer vs. control) were processed as described earlier and displayed using Mass Spectra Viewer (MSV) (FIG. 2C).
Example 3
Serum Peptide Barcodes for Advanced Prostate, Bladder, and Breast Cancer
[0270] A. Methods
[0271] Assigning Peptide Sequences
[0272] A set of peptides previously selected on the basis of statistical differences in intensity between cancers and control groups was analyzed by MALDI-TOF/TOF tandem mass spectrometry, using an UltraFlex TOF/TOF instrument (Bruker; Bremen, Germany) operated in `LIFT` mode. The mono-isotopic masses were first assigned by one-dimensional reflectron-TOF MS, in the presence of three peptide calibrants (6 (moles each; calculated monoisotopic masses of 2,108.155 Da, 1,307.762 Da and 969.575 Da in the protonated form), as previously described (Winkler, G. S., et al; 2002, Methods 26:260-269).
[0273] Spectra were obtained by averaging multiple signals; laser irradiance and number of acquisitions (typically 100-150) were operator-adjusted to yield maximal peak deflections derived from the digitizer in real time. Mono-isotopic masses were assigned for all selected and other prominent peaks after visual inspection, and the low- and high-end internal standards were used for recalibration. The pass/fail criterion for recalibration is a correct assignment of an in/z value for the `middle` calibrant with a mass accuracy equal or better than 12 ppm.
[0274] Alternatively, a QSTAR XL Hybrid quadrupole (Q) time-of-flight mass spectrometer (Applied Biosystems/MDS Sciex; Concord, Canada), equipped with an o-MALDI ion source, was used for both duplicate and additional tandem-MS analyses. By selecting precursor ions of interest in `Q1` (operated in the mass-filter mode), mass measurements of fragment ions could be obtained in the TOF detector following collision-induced dissociation (CID) in `Q2`. Typically, a mass window of 3 Da was selected in order to transmit the entire isotopic envelope of the precursor ion species. Collision energy was operator adjusted to yield maximum number and intensities of the fragment ions.
[0275] Fragment ion spectra resulting from TOF/TOF analyses (300-1,000 acquisitions averaged per spectrum) were taken to search a "non-redundant" human database (`NCBInr`; release data: Sep. 20, 2004; 106,486 entries; National Center for Biotechnology Information, Bethesda, Md.) using the MASCOT MS/MS ion search program, version 2.0.04 for Windows (Matrix Science Ltd., London, UK) with the following search parameters: mono-isotopic precursor mass tolerance of 35 ppm, fragment mass tolerance of 0.5 Da, and without a specified protease cleavage site.
[0276] Mascot `mowse` scores greater than 35 were considered significant. Any identification thus obtained was verified independently by two different people, by comparing the computer-generated fragment ion series of the predicted peptide with the experimental MS/MS data. Some sequence assignments had below-threshold scores but could, nonetheless, be unequivocally assigned, as the precursor ion mass and selected fragment ion masses (b'' or y'') matched a particular peptide, representing a rung in one of the serum peptide sequence ladders.
[0277] B. Results
[0278] Peptide sequence assignment: 46 of the 68 previously selected peptides (FIGS. 2B and 17) were positively identified by MALDI-TOF/TOF MS/MS and MALDI-Q/TOF MS/MS analysis and database searches (FIG. 5A, additionally showing others (including m/z=1786.86, 2021.05, 2305.20, 2627.48)). Note that the m/z values listed in FIG. 5A are mono-isotopic and therefore smaller than the corresponding average isotopic values listed in FIGS. 16 and 17. Of note, all but a few of the peptide sequences clustered into the sets of overlapping fragments, lined up within each group at either the C- or N-terminal end, and with ladder-like truncations at the opposite ends. Some sequence assignments had below-threshold scores but could, nonetheless, be unequivocally assigned, as the precursor ion mass and selected fragment ion masses (b'' or y'') matched a particular rung in one of the ladders, taking into account whether the limited CID patterns were in agreement with established rules (Kapp, E. A. et al., 2003. Anal Chem 75:6251-6264) of preferential peptide bond cleavage (e.g., Xaa-Pro or Asp/Glu-Xaa) and the putative sequence.
[0279] Furthermore, 23 additional peptides, outside the original group of 68, could also be matched to certain sequence clusters by hypothesis-driven, targeted MS/MS analysis. Fifteen of those had significant discriminant analysis adjusted p-values (<0.0002) for at least on cancer type but typically lower ion intensities (FIG. 5B). Two others (`2553` and `2021`; yellow-coded in FIGS. 5A and 5B) displayed very high but similar MS ion intensities across all cancer groups and the control, with adjusted p-values >0.04, and can therefore be regarded as quasi-internal controls. Six more peptides (pink-coded in FIGS. 5A and 5B) that fit into the clusters were randomly observed in samples of the cancer and control groups and have neither discriminant nor internal control value. It should be noted that we used an unbiased approach to identify `marker peptides`, in which the peptides were selected first on the basis of discriminant analysis and then sequenced. This approach, commonly referred to as `ion mapping`, can be taken using any type of mass spectrometric platform (Gao, J. et al., 2003. J Proteome Res 2:643-649; Fach, E. M. et al. 2004. Mol Cell Proteomics 3:1200-1210).
[0280] Three clusters derived from naturally occurring serum peptides, fibrinopeptide A (FPA), complement C3f and bradykinin, that are themselves generated from various plasma proteins through endoproteolytic cleavage, either before (bradykinin, cleaved from H-kininogen by a kallekrein) or during (FPA, N-terminally cleaved from fibrinogen by thrombin to form fibrin; C3f, released by Factors I and H after prior conversion of C3 to C3b) serum preparation (Jandl, J. H. 1996. Blood: Textbook of hematology. New York, N.Y.: Little, Brown and Co.; Sahu, A., and Lambris, J. D. 2001. Immunol Rev 180:35-48).
[0281] The full-length `founder` peptides end with Arg, preceded by a hydrophobic amino acid (Val, Leu or Phe). Arg is partially removed from C3f and bradykinin (to form desArg-bradykinin). Similar `trypsin-like` cleavages (Arg/Lys--Xaa) underlie formation of all other peptide clusters as well (see below). The C-terminal basic amino acid is preceded by a hydrophobic amino acid (F, L, V, I, W, A) in 21 and by S, Q or N in 15 out of the 39 observed cleavage sites (FIG. 15). Arg/Lys is typically removed (fully or in part) by a carboxypeptidase, except when preceded by Pro (3 out of 3 cases) or sometimes when preceded by Val (2 out 4). Further exoprotease degradation then proceeds at the N-terminal or C-terminal ends, either to completion or until it stalls; many or all of the `intermediates` are typically represented (FIGS. 5A and 14). Of note, full-length C3f (m/z=2021.05) was found to be present at equally high concentrations in all patient and control sera (see B), and therefore represents a virtual internal standard.
[0282] Diagnostic MALDI-TOF spectral patterns consisting of N-terminal FPA and C3f truncations have previously been found in sera of myocardial infarction patients (Marshall, J. et al., 2003. J Proteome Res 2:361-372). In contrast, nearly all of these peptides (19 total) were detected in control sera (FIG. 3B), and their presence was shown to be either consistently lower (all FPA fragments in all cancers; three C3f fragments in breast cancer) and/or higher (several Cf3 fragments in bladder and prostate cancer; one FPA fragment in breast cancer) in patient sera (FIG. 5A). Full-length C3f was present in all samples at equally high concentrations. Full-length FPA was virtually absent in sera from bladder cancer patients; no fibrinopeptide B or fragments thereof were found in any of the samples.
[0283] Decreased levels of FPA (fragments) in prostate, bladder and breast cancer patients, as shown here, also contrast with earlier findings indicating elevated levels of phospho-FPA in sera of ovarian cancer patients (measured by ESI-MS (Bergen, H. R., 3rd, et al., 2003. Dis Markers 19:239-249) and of FPA in gastrointestinal and breast cancers (measured immunochemically (Abbasciano, V. et al., 1987. Med Oncol Tumor Pharmacother 4:75-79; Auger, M. J. et al., 1987. Haemostasis 17:336-339).
[0284] Bradykinin and desArg-bradykinin levels were higher in sera of breast cancer patients and lower in bladder cancer patients. Of note, the pro-hydroxylated forms of each peptide also followed that trend (data not shown). The bradykinin and FPA parent proteins, fibrinogen alpha and HMW-kininogen, each contributed one additional sequence cluster, located in a different section of the precursor sequence, to the cancer serum peptide barcodes (FIGS. 5A and 6; FIGS. 14 and 15). Interestingly, the bradykinin and `other` kininogen-derived peptides have very different marker properties. For example, whereas bradykinin and desArg-bradykinin were generally of lower ion intensity in bladder cancer than in control sera, the other two peptides (`1944` and `2209`) actually showed higher relative intensities in bladder cancer (FIGS. 5A and 16).
[0285] One of the peptides (`2724`, FIG. 5A) in a cluster of sequences is derived from the inter-alpha-trypsin inhibitor heavy chain H4 (ITIH4) precursor (Salier, J. P. et al., 1996. Biochem J 315 (Pt 1):1-9) and covers amino acids 662-687 (FIG. 17) and is bracketed by two kallikrein cleavage sites (Phe-Arg--Xaa). Residues 662-688 likely represent a `propeptide` of unknown function (Nishimura, H. et al., 1995. FEBS Lett 357:207-211). Like bradykinin, it ends with Pro-Phe-Arg. Several longer ITIH4 precursor fragments actually span the first kallikrein cleavage site, including `3272` at 658-687, that has been reported as a biomarker for early stage ovarian cancer (Zhang, Z. et al., 2004. Cancer Res 64:5882-5890). Variations in N-terminal truncation by just a few amino acids in the ITIH4 cluster were found to produce relatively selective `markers` for each of the three different cancers. Median ion intensities of peptides `3971` and `3273`, for instance, were clearly highest in bladder cancer samples, peptides `2358` and `2184` were highest in breast cancer, and `2271` was highest in prostate cancer. Also of note, peptide `2115` matches the sequence of an ITIH4 splice variant (PRO1851; FIG. 15) and appears to have strong marker capacity for each cancer type, particularly for bladder and breast (FIG. 16).
[0286] A seventh cluster of 8 sequences, 4 on either site of a single Ile-Arg-Xaa cleavage site, is derived from the complement C4a precursor (Belt, K. T. et al., 1984. Cell 36:907-914) (FIGS. 5A, 14, and 15). This C4a-cluster has the highest incidence of ion markers for breast cancer; more than any in other cluster and also more than C4a-derived bladder cancer markers (FIG. 16). Only a single ion (`1763`) of this cluster is an ion marker for prostate cancer, and is shared in that capacity with the other two cancer types. On the other hand, all but one ion marker derived from apolipoproteins (APO) A-I, A-IV and E are bladder cancer specific, all with appreciably higher ion intensities; the exception (APO A-IV, peptide `1971`) is actually highly selective and statistically the most significant (p=5.5e-13) ion marker for breast cancer (FIGS. 5A and 16).
[0287] Up-regulation of clusterin, i.e., `APO J`, has been correlated, by immuno-histochemistry, with progression of both prostate and bladder cancer (Jul., L. V. et al., 2002. Prostate 50:179-188; Scaltriti, M. et al., 2004. Int J Cancer 108:23-30; Miyake, H. et al., 2002. Urology 59:150-154). The 10-amino acid clusterin fragment detected at elevated concentrations in sera of bladder and prostate cancer patients is located at the C-terminus of the beta-chain. A single cut is, therefore, sufficient to release this peptide, following separation of the clusterin beta (N-t) and alpha (C-t) chains by cleavage of a Val-Arg--Xaa bond. A 6-amino acid sub-fragment has statistically relevant marker potential for bladder cancer (FIGS. 5A and 16), which is in keeping with the trend for most other peptides from APO A-I, A-IV, and E. Two ions (`2602`; `2451`), each with significantly higher median intensities in breast cancer samples than in controls, corresponded to peptides derived from, respectively, Factor XIIIa and transthyretin (FIGS. 5A and 5B). In contrast to the aforementioned clusters, each peptide was the only fragment from the respective precursors that we observed. Peptide `2602` actually represents the C-terminal 25 amino acids of the Factor XIIIa propeptide (37-residues long) (FIGS. 14 and 15). Interestingly, Factor XIII itself has been found significantly down-regulated in breast tumors compared to normal mammary tissues (Jiang, W. G. et al., 2003. Oncol Rep 10:2039-2044).
Example 4
MALDI-TOF Mass Spectral Overlays of Selected Peaks Derived from Serum Peptide Profiling of Three Groups of Cancer Patients and Healthy Controls
[0288] All spectra were obtained and aligned as described above, and subsequently displayed using the Mass Spectra Viewer (MSV) (FIGS. 3A and 3B). Overlays of mass spectra of selected peptides of known sequence (FIG. 5) that showed statistically significant differences between peak intensities in one or more of the three binary comparisons are shown in FIG. 3A. Peptide `2021.05` (i.e., C3f) is shown as an example of a peptide that is present in about equal concentrations in all serum samples analyzed in this study. Overlays of mass spectra of some as yet unidentified peptides that also showed statistically significant differences between peak intensities in one or more of the three binary comparisons are shown in FIG. 3B.
[0289] Peptides from a serum sample obtained from a breast cancer patient were extracted and analyzed by MS, and the ion of choice selected for MS/MS analysis. The fragment ion spectrum shown herein was taken for a MASCOT MS/MS on Search of the human segment of NR database, and retrieved a peptide sequence, GLEEELQFSLGSKINVKVGGNS (SEQ ID NO:23) ([MH].sup.+=2305.19; Δ=4 ppm) with a Mascot score of 38.
[0290] Taken together, a total of 69 serum peptides are listed in FIG. 5A (with matching information provided in FIG. 5B; all 79 sequenced peptides listed in FIG. 14). Of those, 61 have clear MALDI-TOF MS-ion marker potential (adjusted p<0.0002; and, in most cases, much lower) for at least one type of cancer and are color-coded in blue (prostate cancer), green (bladder cancer) or red (breast cancer). The resulting `barcodes` for the three cancer types consist of 26 (prostate), 50 (bladder) and 25 (breast) `bars`, i.e., peptides, several in common between any two or all three. Compared to healthy control samples, median intensities of ion markers could be up or down (represented by black dots in the colored barcodes in FIG. 5A) in any particular cancer group; 16 higher and 10 lower (16+/10-) in prostate cancer, 31+/-19 in bladder cancer, and 19+/6- in breast cancer. Only three peptides in each of the up- or down-categories were shared by all cancer groups.
[0291] One peptide from the C4a- and two from the ITIH4-cluster had consistently higher ion intensities in all cancers than in healthy controls; three FPA fragments were lower in all cancers. The rest of the ion markers were either in common between 2 groups or, more often, unique to a single patient cohort (FIG. 5A). Twenty six (17+/9-) of those were unique for bladder cancer and 16 (13+/3-) for breast cancer. To be noted are the nine APO[A-I, A-IV, E, J]-peptides and three C3f-peptides exclusively of higher ion intensities in bladder cancer, and the four C4a- two bradykinin- and one transthyretin-peptides in breast cancer. All three serum peptide ions that were uniquely of lower intensity in the breast cancer cohort each derived from C3f. Interestingly, a number of `shared` marker ions had, in fact, higher median intensities than the controls in one type cancer and lower in another (FIGS. 5A and 5B). For instance, one ITIH4-peptide (`842`) and one C3f-peptide (`1865`) had higher median ion intensities in sera from prostate cancer patients than in, respectively, bladder and breast cancer. Five peptide ions (including those corresponding to bradykinin and desArg-bradykinin) that had higher median intensities in breast cancer samples were lower in bladder cancer and had no appreciable marker value for prostate cancer.
[0292] In an attempt to find trends in what clusters might have ion marker value for a type of cancer, or to at least better visualize any global differences that might exist, we plotted the ratios of the median ion intensities were plotted, for each of the peptides in the four major clusters, between each cancer group and the healthy controls (i.e., r=case/control). The center line in the panels of FIG. 6 represents no difference (r=1); bars pointing to the left (r<1) or right (r>1) indicate, respectively, lower or higher median. Even in case of the FPA ladder where nearly all peptides in cancer sera produced ion signals of lower intensities than in controls, the actual ratios vary for each `rung` and for each cancer type. Of particular note is the seemingly total absence (r=0) of full-length FPA in sera of bladder cancer patients. The three other clusters exhibit an even more pronounced `internal` variability, with median intensity ratios that were mostly over, but also equal to or under 1.
[0293] Visual inspection of the 4 color-coded graphs (33×3 total data points) in FIG. 6 readily distinguishes the three cancer types. There is a trend for peptides in bladder cancer sera to exhibit relatively high ion intensities in the C3f cluster and rather variable intensities in the C4a and ITIH4 clusters, and for some peptides in the C3f-cluster to be of lower intensity and others in the C4a-cluster to be of higher intensity in breast cancer sera. Ion intensities of peptides in prostate cancer sera don't seem to follow those trends, but are selectively more pronounced in some of the smaller peptides of the ITIH4-cluster. Interestingly, there is one rung in each of the C3f-, C4a- and ITIH4-ladders (respectively the 6th, 5th and 5th rung in the corresponding panels in FIG. 6) for which median ion intensities in the control samples were virtually zero, yet much higher in all three cancer types, resulting in very high ratios for each.
[0294] Taken together, the data in FIG. 6, based in parts on statistical analysis (FIG. 5B), visual inspection of spectra overlays (FIG. 3), peptide sequencing (FIGS. 4 and 5A) and relative ion intensity analysis, now strongly indicate that the human serum peptidome holds information, in the form of barcodes consisting of a few dozen peptides each, that can distinguish three different cancers from controls as well as from each other.
Example 5
Independent Set of Prostate Cancer Serum Samples for Validation of Established `Peptide-Signature` Biomarkers
[0295] It was next tested whether the identified markers would correctly predict the class of an external validation set.
[0296] Sample Groups
[0297] An initial set of 32 serum samples from patients with advanced prostate cancer (Prostate #1) were analyzed together with 33 samples from healthy controls and two additional groups of cancer patient samples (FIG. 1A). One month later, an entirely different group of 41 advanced prostate cancer patients (Prostate #2), none previously studied, was analyzed using identical methodology (FIG. 8A), and a new spreadsheet with all data from the original 106 subjects and the new validation set, was generated. The assignment of the prostate cancer samples into the training set (Prostate 1--`PR1`) or the test set (Prostate 2--`PR2`) was random, but preserving the same demographic/pathological parameters (e.g., age, PSA levels, Gleason score, survival time).
[0298] Peptide ions from `feature list #2` (68 peptides; see FIGS. 2A and 7) and from the `prostate cancer barcode` (26 sequenced peptides; blue `barcode` in FIGS. 5A and 5B) were then selectively used for comparison of the control, PR1 and PR2 groups by hierarchical clustering and principal component analysis. While not a perfect fit, samples from prostate cancer sets #1 and #2 were mixed to some extent but for the most part separated from the controls. Individual comparisons of each of these 26 peptide ions between the three sample groups indicated that the intensities of 26 out of 26 were statistically different (adjusted p<0.0002; i.e. the p-value to create the barcode--FIG. 5B) between PR1 and control, 23 out of 26 between PR2 and control, and only 1 out of 26 between PR1 and PR2.
[0299] Class Prediction Analysis of the Prostate Cancer Validation
[0300] Support vector machine (SVM)-based class predictions, in either binary or multi-class formats, were carried out using all 651, or the 68 or 14 previously selected peptides. Analyses were carried out using linear kernel (as described earlier). Similar sensitivities were obtained in all three instances, namely 100% (41/41) and 97.5% (40/41) accuracy for, respectively, binary and multi-group class predictions.
Example 6
Aminoprotease Activities in Plasma
[0301] The serum peptidome is likely largely the product of resident substrates, more specifically their proteolytic breakdown products (Koomen, J. M. et al., 2005. J Proteome Res 4:972-981); findings herein), and, therefore, represents a read-out of the repertoire of proteases that exist in plasma and/or become activated during clotting. With the exception of bradykinin, much higher peptide concentrations were consistently observed in serum than in plasma (FIG. 9; and data not shown). The data presented herein indicate that cancer cells contribute unique proteases, perhaps exoproteases, which result in subtle but signature alterations of the complex equation of hundreds of peptides that can be resolved from human serum.
[0302] In an effort to begin to understand the presence and roles of exoproteases, synthetic C3f was added to fresh plasma at a concentration close to that observed in serum. As shown in FIG. 9, degradation is very fast. C-terminal Arg was removed within seconds, and the N-terminal truncations occurred in 10-15 min. The resulting pattern was similar to the endogenous one observed in serum and also illustrated the disparate ion intensities for different rungs in the ladder. However, most of the C3f ladder, except its smallest rung, disappeared upon prolonged incubation (data not shown). Exoproteolytic degradation of synthetic FPA in plasma followed a similar time course, but FPB was completely degraded in just a few minutes (data not shown. The results suggest that the operative exoprotease concentrations and activities are roughly equivalent in plasma and serum, and therefore not the consequence of coagulation.
[0303] As per Example 6, above, it is indicated that a sizable part of the human serum `peptidome`, as detected by MALDI-TOF MS, is generated by degradation of endogenous substrates by endogenous proteases. Peptide profiling is, therefore, a form of activity-based proteomics, by using a `metabolomic` read-out that is subject to variations in enzyme panels, cofactors and inhibitors. Here, proteolytic activities of the ex-vivo coagulation and complement-degradation pathways, in combination with exoproteases, have been shown to contribute to generation of not only cancer-specific, but also `cancer type`-specific serum peptides. The specificity derives largely from aminopeptidase panels in serum, which is consistent with previous observations (van Hensbergen, Y., et al., 2002, Clin Cancer Res 8:3747-3754; Matrisian, L. M., et al., 2003, Cancer Res 63:6105-6109; Moffatt, S., et al., 2005, Hum Gene Ther 16:57-67; Kehlen, A., et al., 2003, Cancer Res 63:8500-8506; Rocken, C., et al., 2004, Int J Oncol 24:487-495; Carl-McGrath, S, et al., 2004, Int J Oncol 25:1223-1232; Kojima, K., et al., 1987, Biochem Med Metab Biol 37:35-41; Essler, M., et al., 2002, Proc Natl Acad Sci USA 99:2252-2257; Carrera, M. P., et al., 2005, Anticancer Res 25:193-196; Pulido-Cejudo, G., et al., 2004, Biotechnol Lett 26:1335-1339; Suganuma, T., et al., 2004, Lab Invest 84:639-648; Selvakumar, P., et al., 2004, Clin Cancer Res 10:2771-2775; Ni, R. Z., et al., 2003, World J Gastroenterol 9:710-713; Sheppard, G. S., et al., 2004, Bioorg Med Chem Lett 14:865-868; Griffith, E. C., et al., 1998, Proc Natl Acad Sci USA 95:15183-15188; Pasqualini, R., et al., 2000, Cancer Res 60:722-727; Petrovic, N., et al., 2003, J Biol Chem 278:49358-49368; O'Malley, P. G., et al., 2005, Biochem J; Fair, W. R., et al., 1997, Prostate 32:140-148).
[0304] In the discovery phase of the present studies, hundreds of features were sorted through to identify several that are most predictive of outcome. Reduction in the number of key peptides to only a few that are easily recognized between samples has been shown not to adversely affect class predictions. Focused mass spectrometric quantitation of key peptides should facilitate introduction of this technology into general clinical practice.
Example 7
MALDI-TOF MS-Based Quantitative Profiling
[0305] Relative quantitation of the rungs of a C3f ladder in a pool of 50 serum samples from thyroid carcinoma patients and a pool of 50 healthy controls was carried out. Ten reference peptides (FIG. 31) were added to the raw sera (2 picomoles/50 μL), peptides extracted on magnetic beads, MALDI spectra taken and ion intensity ratios calculated for each pair, for each pool. The relative ion intensities (ratio: endogenous/REF) were consistently higher for the peptides in the `cancer sera` compared to the controls (˜20% to 100% higher) (FIG. 32, panel C). These results are in agreement with the normalized ion intensity comparisons of 40 individual cancer and 40 individual control samples; presented as spectral overlays and a heat plot in FIG. 32, panels A and B.
Example 8
MALDI-TOF MS-Based Protease Assays
[0306] The degradation conditions and times were studied for C3f and FPA in serum and plasma as described above. Synthetic C3f and FPA readily degraded in control serum and plasma; C3f rapidly (within 15-30 min), FPA rather slowly (up to 4 hours). 2 picomoles [13C-Leu]-labeled C3f was incubated for 30 min at RT with 50-4 aliquots of serum from 20 different breast cancer patients and 20 control samples. Four rungs (m/z=942, 1212, 1563, 1865) of the endogenous C3f degradation ladder were previously found to have a lower median ion intensity in MALDI spectra taken of breast cancer sera than control sera (FIG. 34, top panel). Upon overlay of the 40 color-coded spectra (FIG. 34, bottom panel), the equivalent four rungs in the ladder resulting from degradation of exogenous [13C-Leu]C3f had also generally lower ion intensities in the spectra of cancer patient sera compared to the controls, thus closely matching the endogenous patterns.
[0307] A synthetic version of the longest ITIH4-derived founder peptide (FIG. 33; #7, with N-t Pro) did not degrade in serum or plasma (data not shown), indicating that it probably is not a founder but rather a stalled degradation product of a bigger peptide.
[0308] Labeled C3f was added to two pools of serum, one from 50 samples obtained from thyroid carcinoma patients, and one from age- and gender-matched healthy controls. Aliquots were retrieved at various time points, ranging from 5 min to 5 hours, and analyzed by magnetic bead processing and a MALDI read-out; in triplicate. The 10 peptide-triplets (one for each rung in the C3f ladder) were then selected for each time point and each of the triplicates, the ratios between exogenously derived peptide and reference peptide calculated and plotted (FIG. 35).
[0309] The exogenous peptide was singly labeled (13C-Leu), and the reference peptide doubly labeled with 13C/15N-Leu, hence the 14 Da mass difference from the endogenous peptide. The time course results indicate that during the first 5 or so minutes, peptide degradation (removal of the C-t Arg) kinetics are faster in the cancer sera than in the controls. Furthermore, after 1-2 hours of incubation, clear differences in relative ion intensity were observed for the two smallest peptides in the ladder between the two samples; both higher in the cancer sample, indicating that the founder peptide was either more rapidly degraded in the cancer serum or that, alternatively, it was completely degraded to single amino acids in the control serum.
Sequence CWU
1
148115PRTHomo sapiens 1Asp Ser Gly Glu Gly Asp Phe Leu Ala Glu Gly Gly Gly
Val Arg1 5 10
15214PRTHomo sapiens 2Ser Gly Glu Gly Asp Phe Leu Ala Glu Gly Gly Gly Val
Arg1 5 10313PRTHomo sapiens 3Gly Glu Gly
Asp Phe Leu Ala Glu Gly Gly Gly Val Arg1 5
10412PRTHomo sapiens 4Glu Gly Asp Phe Leu Ala Glu Gly Gly Gly Val Arg1
5 10511PRTHomo sapiens 5Gly Asp Phe Leu Ala
Glu Gly Gly Gly Val Arg1 5 10610PRTHomo
sapiens 6Asp Phe Leu Ala Glu Gly Gly Gly Val Arg1 5
10716PRTHomo sapiens 7Glu Glu Glu Leu Gln Phe Ser Gly Leu Ser
Phe Asn Val Lys Val Ser1 5 10
15816PRTHomo sapiens 8Ser Ser Lys Ile Thr His Arg Ile His Trp Glu
Ser Ala Ser Leu Leu1 5 10
15915PRTHomo sapiens 9Ser Lys Ile Thr His Arg Ile His Trp Glu Ser Ala
Ser Leu Leu1 5 10
151014PRTHomo sapiens 10Lys Ile Thr His Arg Ile His Trp Glu Ser Ala Ser
Leu Leu1 5 101112PRTHomo sapiens 11Thr
His Arg Ile His Trp Glu Ser Ala Ser Leu Leu1 5
10128PRTHomo sapiens 12His Trp Glu Ser Ala Ser Leu Leu1
51326PRTHomo sapiens 13Pro Gly Val Leu Ser Ser Arg Gln Leu Gly Leu Pro
Gly Pro Pro Asp1 5 10
15Val Pro Asp His Ala Ala Tyr His Pro Phe 20
251425PRTHomo sapiens 14Gly Val Leu Ser Ser Arg Gln Leu Gly Leu Pro Gly
Pro Pro Asp Val1 5 10
15Pro Asp His Ala Ala Tyr His Pro Phe 20
251521PRTHomo sapiens 15Ser Arg Gln Leu Gly Leu Pro Gly Pro Pro Asp Val
Pro Asp His Ala1 5 10
15Ala Tyr His Pro Phe 201617PRTHomo sapiens 16Gly Leu Pro Gly
Pro Pro Asp Val Pro Asp His Ala Ala Tyr His Pro1 5
10 15Phe1710PRTHomo sapiens 17His Phe Phe Phe
Pro Lys Ser Arg Ile Val1 5 10186PRTHomo
sapiens 18His Phe Phe Phe Pro Lys1 5199PRTHomo sapiens
19Arg Pro Pro Gly Phe Ser Pro Phe Arg1 5208PRTHomo sapiens
20Arg Pro Pro Gly Phe Ser Pro Phe1 52116PRTHomo sapiens
21Arg Asn Gly Phe Lys Ser His Ala Leu Gln Leu Asn Asn Arg Gln Ile1
5 10 152215PRTHomo sapiens
22Asn Gly Phe Lys Ser His Ala Leu Gln Leu Asn Asn Arg Gln Ile1
5 10 152322PRTHomo sapiens 23Gly
Leu Glu Glu Glu Leu Gln Phe Ser Leu Gly Ser Lys Ile Asn Val1
5 10 15Lys Val Gly Gly Asn Ser
20249PRTHomo sapiens 24Phe Leu Ala Glu Gly Gly Gly Val Arg1
5258PRTHomo sapiens 25Leu Ala Glu Gly Gly Gly Val Arg1
52613PRTHomo sapiens 26Ile Thr His Arg Ile His Trp Glu Ser Ala Ser Leu
Leu1 5 102710PRTHomo sapiens 27Arg Ile
His Trp Glu Ser Ala Ser Leu Leu1 5
10289PRTHomo sapiens 28Ile His Trp Glu Ser Ala Ser Leu Leu1
52915PRTHomo sapiens 29Ser Ser Lys Ile Thr His Arg Ile His Trp Glu Ser
Ala Ser Leu1 5 10
153014PRTHomo sapiens 30Asn Gly Phe Lys Ser His Ala Leu Gln Leu Asn Asn
Arg Gln1 5 103113PRTHomo sapiens 31Asn
Gly Phe Lys Ser His Ala Leu Gln Leu Asn Asn Arg1 5
103226PRTHomo sapiens 32Gly Leu Glu Glu Glu Leu Gln Phe Ser Leu
Gly Ser Lys Ile Asn Val1 5 10
15Lys Val Gly Gly Asn Ser Lys Gly Thr Leu 20
253316PRTHomo sapiens 33Gly Leu Glu Glu Glu Leu Gln Phe Ser Leu Gly
Ser Lys Ile Asn Val1 5 10
15348PRTHomo sapiens 34His Ala Ala Tyr His Pro Phe Arg1
53520PRTHomo sapiens 35Gln Leu Gly Leu Pro Gly Pro Pro Asp Val Pro Asp
His Ala Ala Tyr1 5 10
15His Pro Phe Arg 203638PRTHomo sapiens 36Gln Ala Gly Ala Ala
Gly Ser Arg Met Asn Phe Arg Pro Gly Val Leu1 5
10 15Ser Ser Arg Gln Leu Gly Leu Pro Gly Pro Pro
Asp Val Pro Asp His 20 25
30Ala Ala Tyr His Pro Phe 353730PRTHomo sapiens 37Met Asn Phe Arg
Pro Gly Val Leu Ser Ser Arg Gln Leu Gly Leu Pro1 5
10 15Gly Pro Pro Asp Val Pro Asp His Ala Ala
Tyr His Pro Phe 20 25
303822PRTHomo sapiens 38Ser Ser Arg Gln Leu Gly Leu Pro Gly Pro Pro Asp
Val Pro Asp His1 5 10
15Ala Ala Tyr His Pro Phe 20397PRTHomo sapiens 39His Ala Ala
Tyr His Pro Phe1 54028PRTHomo sapiens 40Asn Val His Ser Gly
Ser Thr Phe Phe Lys Tyr Tyr Leu Gln Gly Ala1 5
10 15Lys Ile Pro Lys Pro Glu Ala Ser Phe Ser Pro
Arg 20 254121PRTHomo sapiens 41Asn Val His
Ser Ala Gly Ala Ala Gly Ser Arg Met Asn Phe Arg Pro1 5
10 15Gly Val Leu Ser Ser
204228PRTHomo sapiens 42Gln Gly Leu Leu Pro Val Leu Glu Ser Phe Lys Val
Ser Phe Leu Ser1 5 10
15Ala Leu Glu Glu Tyr Thr Lys Lys Leu Asn Thr Gln 20
254317PRTHomo sapiens 43Val Ser Phe Leu Ser Ala Leu Glu Glu Tyr
Thr Lys Lys Leu Asn Thr1 5 10
15Gln4419PRTHomo sapiens 44Ala Thr Glu His Leu Ser Thr Leu Ser Glu
Lys Ala Lys Pro Ala Leu1 5 10
15Glu Asp Leu4523PRTHomo sapiens 45Ile Ser Ala Ser Ala Glu Glu Leu
Arg Gln Arg Leu Ala Pro Leu Ala1 5 10
15Glu Asp Val Arg Gly Asn Leu 204625PRTHomo
sapiens 46Gly Asn Thr Glu Gly Leu Gln Lys Ser Leu Ala Glu Leu Gly Gly
His1 5 10 15Leu Asp Gln
Gln Val Glu Glu Phe Arg 20 254717PRTHomo
sapiens 47Ser Leu Ala Glu Leu Gly Gly His Leu Asp Gln Gln Val Glu Glu
Phe1 5 10
15Arg4816PRTHomo sapiens 48Ser Leu Ala Glu Leu Gly Gly His Leu Asp Gln
Gln Val Glu Glu Phe1 5 10
154924PRTHomo sapiens 49Ala Ala Thr Val Gly Ser Leu Ala Gly Gln Pro Leu
Gln Glu Arg Ala1 5 10
15Gln Ala Trp Gly Glu Arg Leu Arg 205023PRTHomo sapiens 50Ala
Ala Thr Val Gly Ser Leu Ala Gly Gln Pro Leu Gln Glu Arg Ala1
5 10 15Gln Ala Trp Gly Glu Arg Leu
205119PRTHomo sapiens 51Lys His Asn Leu Gly His Gly His Lys His
Glu Arg Asp Gln Gly His1 5 10
15Gly His Gln5217PRTHomo sapiens 52Asn Leu Gly His Gly His Lys His
Glu Arg Asp Gln Gly His Gly His1 5 10
15Gln5325PRTHomo sapiens 53Ala Val Pro Pro Asn Asn Ser Asn
Ala Ala Glu Asp Asp Leu Pro Thr1 5 10
15Val Glu Leu Gln Gly Val Val Pro Arg 20
255423PRTHomo sapiens 54Ala Leu Gly Ile Ser Pro Phe His Glu His
Ala Glu Val Val Phe Thr1 5 10
15Ala Asn Asp Ser Gly Pro Arg 205529PRTHomo sapiens 55Ser
Ser Ser Tyr Ser Lys Gln Phe Thr Ser Ser Thr Ser Tyr Asn Arg1
5 10 15Gly Asp Ser Thr Phe Glu Ser
Lys Ser Tyr Lys Met Ala 20 255628PRTHomo
sapiens 56Ser Ser Ser Tyr Ser Lys Gln Phe Thr Ser Ser Thr Ser Tyr Asn
Arg1 5 10 15Gly Asp Ser
Thr Phe Glu Ser Lys Ser Tyr Lys Met 20
255726PRTHomo sapiens 57Ser Ser Ser Tyr Ser Lys Gln Phe Thr Ser Ser Thr
Ser Tyr Asn Arg1 5 10
15Gly Asp Ser Thr Phe Glu Ser Lys Ser Tyr 20
255825PRTHomo sapiens 58Ser Ser Ser Tyr Ser Lys Gln Phe Thr Ser Ser Thr
Ser Tyr Asn Arg1 5 10
15Gly Asp Ser Thr Phe Glu Ser Lys Ser 20
255925PRTHomo sapiens 59Gly Leu Glu Glu Glu Leu Gln Phe Ser Leu Gly Ser
Lys Ile Asn Val1 5 10
15Lys Gly Gly Asn Ser Lys Gly Thr Ile 20
256021PRTHomo sapiens 60Ser Ser Tyr Ser Lys Gln Phe Thr Ser Ser Thr Ser
Tyr Asn Arg Gly1 5 10
15Asp Ser Thr Phe Glu 206127PRTHomo sapiens 61Gly Ser Glu Ser
Gly Ile Phe Thr Asn Thr Lys Glu Ser Ser Ser His1 5
10 15His Pro Gly Ile Ala Glu Phe Pro Ser Arg
Gly 20 256225PRTHomo sapiens 62Asp Glu Ala
Gly Ser Glu Ala Asp His Glu Gly Thr His Ser Thr Lys1 5
10 15Arg Gly His Ala Lys Ser Arg Pro Val
20 2563436PRTHomo sapiens 63Tyr Pro Phe Ala Leu
Phe Tyr Arg His Tyr Leu Phe Tyr Lys Glu Thr1 5
10 15Tyr Leu Ile His Leu Phe His Thr Phe Thr Gly
Leu Ser Ile Ala Tyr 20 25
30Phe Asn Phe Gly Asn Gln Leu Tyr His Ser Leu Leu Cys Ile Val Leu
35 40 45Gln Phe Leu Ile Leu Arg Leu Met
Gly Arg Thr Ile Thr Ala Val Leu 50 55
60Thr Thr Phe Cys Phe Gln Met Ala Tyr Leu Leu Ala Gly Tyr Tyr Tyr65
70 75 80Thr Ala Thr Gly Asn
Tyr Asp Ile Lys Trp Thr Met Pro His Cys Val 85
90 95Leu Thr Leu Lys Leu Ile Gly Leu Ala Val Asp
Tyr Phe Asp Gly Gly 100 105
110Lys Asp Gln Asn Ser Leu Ser Ser Glu Gln Gln Lys Tyr Ala Ile Arg
115 120 125Gly Val Pro Ser Leu Leu Glu
Val Ala Gly Phe Ser Tyr Phe Tyr Gly 130 135
140Ala Phe Leu Val Gly Pro Gln Phe Ser Met Asn His Tyr Met Lys
Leu145 150 155 160Val Gln
Gly Glu Leu Ile Asp Ile Pro Gly Lys Ile Pro Asn Ser Ile
165 170 175Ile Pro Ala Leu Lys Arg Leu
Ser Leu Gly Leu Phe Tyr Leu Val Gly 180 185
190Tyr Thr Leu Leu Ser Pro His Ile Thr Glu Asp Tyr Leu Leu
Thr Glu 195 200 205Asp Tyr Asp Asn
His Pro Phe Trp Phe Arg Cys Met Tyr Met Leu Ile 210
215 220Trp Gly Lys Phe Val Leu Tyr Lys Tyr Val Thr Cys
Trp Leu Val Thr225 230 235
240Glu Gly Val Cys Ile Leu Thr Gly Leu Gly Phe Asn Gly Phe Glu Glu
245 250 255Lys Gly Lys Ala Lys
Trp Asp Ala Cys Ala Asn Met Lys Val Trp Leu 260
265 270Phe Glu Thr Asn Pro Arg Phe Thr Gly Thr Ile Ala
Ser Phe Asn Ile 275 280 285Asn Thr
Asn Ala Trp Val Ala Arg Tyr Ile Phe Lys Arg Leu Lys Phe 290
295 300Leu Gly Asn Lys Glu Leu Ser Gln Gly Leu Ser
Leu Leu Phe Leu Ala305 310 315
320Leu Trp His Gly Leu His Ser Gly Tyr Leu Val Cys Phe Gln Met Lys
325 330 335Phe Leu Ile Val
Ile Val Glu Arg Gln Ala Ala Arg Leu Ile Gln Glu 340
345 350Ser Pro Thr Leu Ser Lys Leu Ala Ala Ile Thr
Val Leu Gln Pro Phe 355 360 365Tyr
Tyr Leu Val Gln Gln Thr Ile His Trp Leu Phe Met Gly Tyr Ser 370
375 380Met Thr Ala Phe Cys Leu Phe Thr Trp Asp
Lys Trp Leu Lys Val Tyr385 390 395
400Lys Ser Ile Tyr Phe Leu Gly His Ile Phe Phe Leu Ser Leu Leu
Phe 405 410 415Ile Leu Pro
Tyr Ile His Lys Ala Met Val Pro Arg Lys Glu Lys Leu 420
425 430Lys Lys Met Glu 43564930PRTHomo
sapiens 64Met Lys Pro Pro Arg Pro Val Arg Thr Cys Ser Lys Val Leu Val
Leu1 5 10 15Leu Ser Leu
Leu Ala Ile His Gln Thr Thr Thr Ala Glu Lys Asn Gly 20
25 30Ile Asp Ile Tyr Ser Leu Thr Val Asp Ser
Arg Val Ser Ser Arg Phe 35 40
45Ala His Thr Val Val Thr Ser Arg Val Val Asn Arg Ala Asn Thr Val 50
55 60Gln Glu Ala Thr Phe Gln Met Glu Leu
Pro Lys Lys Ala Phe Ile Thr65 70 75
80Asn Phe Ser Met Asn Ile Asp Gly Met Thr Tyr Pro Gly Ile
Ile Lys 85 90 95Glu Lys
Ala Glu Ala Gln Ala Gln Tyr Ser Ala Ala Val Ala Lys Gly 100
105 110Lys Ser Ala Gly Leu Val Lys Ala Thr
Gly Arg Asn Met Glu Gln Phe 115 120
125Gln Val Ser Val Ser Val Ala Pro Asn Ala Lys Ile Thr Phe Glu Leu
130 135 140Val Tyr Glu Glu Leu Leu Lys
Arg Arg Leu Gly Val Tyr Glu Leu Leu145 150
155 160Leu Lys Val Arg Pro Gln Gln Leu Val Lys His Leu
Gln Met Asp Ile 165 170
175His Ile Phe Glu Pro Gln Gly Ile Ser Phe Leu Glu Thr Glu Ser Thr
180 185 190Phe Met Thr Asn Gln Leu
Val Asp Ala Leu Thr Thr Trp Gln Asn Lys 195 200
205Thr Lys Ala His Ile Arg Phe Lys Pro Thr Leu Ser Gln Gln
Gln Lys 210 215 220Ser Pro Glu Gln Gln
Glu Thr Val Leu Asp Gly Asn Leu Ile Ile Arg225 230
235 240Tyr Asp Val Asp Arg Ala Ile Ser Gly Gly
Ser Ile Gln Ile Glu Asn 245 250
255Gly Tyr Phe Val His Tyr Phe Ala Pro Glu Gly Leu Thr Thr Met Pro
260 265 270Lys Asn Val Val Phe
Val Ile Asp Lys Ser Gly Ser Met Ser Gly Arg 275
280 285Lys Ile Gln Gln Thr Arg Glu Ala Leu Ile Lys Ile
Leu Asp Asp Leu 290 295 300Ser Pro Arg
Asp Gln Phe Asn Leu Ile Val Phe Ser Thr Glu Ala Thr305
310 315 320Gln Trp Arg Pro Ser Leu Val
Pro Ala Ser Ala Glu Asn Val Asn Lys 325
330 335Ala Arg Ser Phe Ala Ala Gly Ile Gln Ala Leu Gly
Gly Thr Asn Ile 340 345 350Asn
Asp Ala Met Leu Met Ala Val Gln Leu Leu Asp Ser Ser Asn Gln 355
360 365Glu Glu Arg Leu Pro Glu Gly Ser Val
Ser Leu Ile Ile Leu Leu Thr 370 375
380Asp Gly Asp Pro Thr Val Gly Glu Thr Asn Pro Arg Ser Ile Gln Asn385
390 395 400Asn Val Arg Glu
Ala Val Ser Gly Arg Tyr Ser Leu Phe Cys Leu Gly 405
410 415Phe Gly Phe Asp Val Ser Tyr Ala Phe Leu
Glu Lys Leu Ala Leu Asp 420 425
430Asn Gly Gly Leu Ala Arg Arg Ile His Glu Asp Ser Asp Ser Ala Leu
435 440 445Gln Leu Gln Asp Phe Tyr Gln
Glu Val Ala Asn Pro Leu Leu Thr Ala 450 455
460Val Thr Phe Glu Tyr Pro Ser Asn Ala Val Glu Glu Val Thr Gln
Asn465 470 475 480Asn Phe
Arg Leu Leu Phe Lys Gly Ser Glu Met Val Val Ala Gly Lys
485 490 495Leu Gln Asp Arg Gly Pro Asp
Val Leu Thr Ala Thr Val Ser Gly Lys 500 505
510Leu Pro Thr Gln Asn Ile Thr Phe Gln Thr Glu Ser Ser Val
Ala Glu 515 520 525Gln Glu Ala Glu
Phe Gln Ser Pro Lys Tyr Ile Phe His Asn Phe Met 530
535 540Glu Arg Leu Trp Ala Tyr Leu Thr Ile Gln Gln Leu
Leu Glu Gln Thr545 550 555
560Val Ser Ala Ser Asp Ala Asp Gln Gln Ala Leu Arg Asn Gln Ala Leu
565 570 575Asn Leu Ser Leu Ala
Tyr Ser Phe Val Thr Pro Leu Thr Ser Met Val 580
585 590Val Thr Lys Pro Asp Asp Gln Glu Gln Ser Gln Val
Ala Glu Lys Pro 595 600 605Met Glu
Gly Glu Ser Arg Asn Arg Asn Val His Ser Gly Ser Thr Phe 610
615 620Phe Lys Tyr Tyr Leu Gln Gly Ala Lys Ile Pro
Lys Pro Glu Ala Ser625 630 635
640Phe Ser Pro Arg Arg Gly Trp Asn Arg Gln Ala Gly Ala Ala Gly Ser
645 650 655Arg Met Asn Phe
Arg Pro Gly Val Leu Ser Ser Arg Gln Leu Gly Leu 660
665 670Pro Gly Pro Pro Asp Val Pro Asp His Ala Ala
Tyr His Pro Phe Arg 675 680 685Arg
Leu Ala Ile Leu Pro Ala Ser Ala Pro Pro Ala Thr Ser Asn Pro 690
695 700Asp Pro Ala Val Ser Arg Val Met Asn Met
Lys Ile Glu Glu Thr Thr705 710 715
720Met Thr Thr Gln Thr Pro Ala Pro Ile Gln Ala Pro Ser Ala Ile
Leu 725 730 735Pro Leu Pro
Gly Gln Ser Val Glu Arg Leu Cys Val Asp Pro Arg His 740
745 750Arg Gln Gly Pro Val Asn Leu Leu Ser Asp
Pro Glu Gln Gly Val Glu 755 760
765Val Thr Gly Gln Tyr Glu Arg Glu Lys Ala Gly Phe Ser Trp Ile Glu 770
775 780Val Thr Phe Lys Asn Pro Leu Val
Trp Val His Ala Ser Pro Glu His785 790
795 800Val Val Val Thr Arg Asn Arg Arg Ser Ser Ala Tyr
Lys Trp Lys Glu 805 810
815Thr Leu Phe Ser Val Met Pro Gly Leu Lys Met Thr Met Asp Lys Thr
820 825 830Gly Leu Leu Leu Leu Ser
Asp Pro Asp Lys Val Thr Ile Gly Leu Leu 835 840
845Phe Trp Asp Gly Arg Gly Glu Gly Leu Arg Leu Leu Leu Arg
Asp Thr 850 855 860Asp Arg Phe Ser Ser
His Val Gly Gly Thr Leu Gly Gln Phe Tyr Gln865 870
875 880Glu Val Leu Trp Gly Ser Pro Ala Ala Ser
Asp Asp Gly Arg Arg Thr 885 890
895Leu Arg Val Gln Gly Asn Asp His Ser Ala Thr Arg Glu Arg Arg Leu
900 905 910Asp Tyr Gln Glu Gly
Pro Pro Gly Val Glu Ile Ser Cys Trp Ser Val 915
920 925Glu Leu 93065447PRTHomo sapiens 65Met Met Lys
Thr Leu Leu Leu Phe Val Gly Leu Leu Leu Thr Trp Glu1 5
10 15Ser Gly Gln Val Leu Gly Asp Gln Thr
Val Ser Asp Asn Glu Leu Gln 20 25
30Glu Met Ser Asn Gln Gly Ser Lys Tyr Val Asn Lys Glu Ile Gln Asn
35 40 45Ala Val Asn Gly Val Lys Gln
Ile Lys Thr Leu Ile Glu Lys Thr Asn 50 55
60Glu Glu Arg Lys Thr Leu Leu Ser Asn Leu Glu Glu Ala Lys Lys Lys65
70 75 80Lys Glu Asp Ala
Leu Asn Glu Thr Arg Glu Ser Glu Thr Lys Leu Lys 85
90 95Glu Leu Pro Gly Val Cys Asn Glu Thr Met
Met Ala Leu Trp Glu Glu 100 105
110Cys Lys Pro Cys Leu Lys Gln Thr Cys Met Lys Phe Tyr Ala Arg Val
115 120 125Cys Arg Ser Gly Ser Gly Leu
Val Gly Arg Gln Leu Glu Glu Phe Leu 130 135
140Asn Gln Ser Ser Pro Phe Tyr Phe Trp Met Asn Gly Asp Arg Ile
Asp145 150 155 160Ser Leu
Leu Glu Asn Asp Arg Gln Gln Thr His Met Leu Asp Val Met
165 170 175Gln Asp His Phe Ser Arg Ala
Ser Ser Ile Ile Asp Glu Leu Phe Gln 180 185
190Asp Arg Phe Phe Thr Arg Glu Pro Gln Asp Thr Tyr His Tyr
Leu Pro 195 200 205Phe Ser Leu Pro
His Arg Arg Pro His Phe Phe Phe Pro Lys Ser Arg 210
215 220Ile Val Arg Ser Leu Met Pro Phe Ser Pro Tyr Glu
Pro Leu Asn Phe225 230 235
240His Ala Met Phe Gln Pro Phe Leu Glu Met Ile His Glu Ala Gln Gln
245 250 255Ala Met Asp Ile His
Phe His Ser Pro Ala Phe Gln His Pro Pro Thr 260
265 270Glu Phe Ile Arg Glu Gly Asp Asp Asp Arg Thr Val
Cys Arg Glu Ile 275 280 285Arg His
Asn Ser Thr Gly Cys Leu Arg Met Lys Asp Gln Cys Asp Lys 290
295 300Cys Arg Glu Ile Leu Ser Val Asp Cys Ser Thr
Asn Asn Pro Ser Gln305 310 315
320Ala Lys Leu Arg Arg Glu Leu Asp Glu Ser Leu Gln Val Ala Glu Arg
325 330 335Leu Thr Arg Lys
Tyr Asn Glu Leu Leu Lys Ser Tyr Gln Trp Lys Met 340
345 350Leu Asn Thr Ser Ser Leu Leu Glu Gln Leu Asn
Glu Gln Phe Asn Trp 355 360 365Val
Ser Arg Leu Ala Asn Leu Thr Gln Gly Glu Asp Gln Tyr Tyr Leu 370
375 380Arg Val Thr Thr Val Ala Ser His Thr Ser
Asp Ser Asp Val Pro Ser385 390 395
400Gly Val Thr Glu Val Val Val Lys Leu Phe Asp Ser Asp Pro Ile
Thr 405 410 415Val Thr Val
Pro Val Glu Val Ser Arg Lys Asn Pro Lys Phe Met Glu 420
425 430Thr Val Ala Glu Lys Ala Leu Gln Glu Tyr
Arg Lys Lys His Arg 435 440
44566534PRTHomo sapiensMOD_RES(485)..(485)Any amino acid 66Gly Gln Tyr
Ala Ser Pro Thr Ala Lys Arg Cys Cys Gln Asp Gly Val1 5
10 15Thr Arg Leu Pro Met Met Arg Ser Cys
Glu Gln Arg Ala Ala Arg Val 20 25
30Gln Gln Pro Asp Cys Arg Glu Pro Phe Leu Ser Cys Cys Gln Phe Ala
35 40 45Glu Ser Leu Arg Lys Lys Ser
Arg Asp Lys Gly Gln Ala Gly Leu Gln 50 55
60Arg Ala Leu Glu Ile Leu Gln Glu Glu Asp Leu Ile Asp Glu Asp Asp65
70 75 80Ile Pro Val Arg
Ser Phe Phe Pro Glu Asn Trp Leu Trp Arg Val Glu 85
90 95Thr Val Asp Arg Phe Gln Ile Leu Thr Leu
Trp Leu Pro Asp Ser Leu 100 105
110Thr Thr Trp Glu Ile His Gly Leu Ser Leu Ser Lys Thr Lys Gly Leu
115 120 125Cys Val Ala Thr Pro Val Gln
Leu Arg Val Phe Arg Glu Phe His Leu 130 135
140His Leu Arg Leu Pro Met Ser Val Arg Arg Phe Glu Gln Leu Glu
Leu145 150 155 160Arg Pro
Val Leu Tyr Asn Tyr Leu Asp Lys Asn Leu Thr Val Ser Val
165 170 175His Val Ser Pro Val Glu Gly
Leu Cys Leu Ala Gly Gly Gly Gly Leu 180 185
190Ala Gln Gln Val Leu Val Pro Ala Gly Ser Ala Arg Pro Val
Ala Phe 195 200 205Ser Val Val Pro
Thr Ala Ala Thr Ala Val Ser Leu Lys Val Val Ala 210
215 220Arg Gly Ser Phe Glu Phe Pro Val Gly Asp Ala Val
Ser Lys Val Leu225 230 235
240Gln Ile Glu Lys Glu Gly Ala Ile His Arg Glu Glu Leu Val Tyr Glu
245 250 255Leu Asn Pro Leu Asp
His Arg Gly Arg Thr Leu Glu Ile Pro Gly Asn 260
265 270Ser Asp Pro Asn Met Ile Pro Asp Gly Asp Phe Asn
Ser Tyr Val Arg 275 280 285Val Thr
Ala Ser Asp Pro Leu Asp Thr Leu Gly Ser Glu Gly Ala Leu 290
295 300Ser Pro Gly Gly Val Ala Ser Leu Leu Arg Leu
Pro Arg Gly Cys Gly305 310 315
320Glu Gln Thr Met Ile Tyr Leu Ala Pro Thr Leu Ala Ala Ser Arg Tyr
325 330 335Leu Asp Lys Thr
Glu Gln Trp Ser Thr Leu Pro Pro Glu Thr Lys Asp 340
345 350His Ala Val Asp Leu Ile Gln Lys Gly Tyr Met
Arg Ile Gln Gln Phe 355 360 365Arg
Lys Ala Asp Gly Ser Tyr Ala Ala Trp Leu Ser Arg Gly Ser Ser 370
375 380Thr Trp Leu Thr Ala Phe Val Leu Lys Val
Leu Ser Leu Ala Gln Glu385 390 395
400Gln Val Gly Gly Ser Pro Glu Lys Leu Gln Glu Thr Ser Asn Trp
Leu 405 410 415Leu Ser Gln
Gln Gln Ala Asp Gly Ser Phe Gln Asp Pro Cys Pro Val 420
425 430Leu Asp Arg Ser Met Gln Gly Gly Leu Val
Gly Asn Asp Glu Thr Val 435 440
445Ala Leu Thr Ala Phe Val Thr Ile Ala Leu His His Gly Leu Ala Val 450
455 460Phe Gln Asp Glu Gly Ala Glu Pro
Leu Lys Gln Arg Val Glu Ala Ser465 470
475 480Ile Ser Lys Ala Xaa Ser Phe Leu Gly Glu Lys Ala
Ser Ala Gly Leu 485 490
495Leu Gly Ala His Ala Ala Ala Ile Thr Ala Tyr Ala Leu Thr Leu Thr
500 505 510Lys Ala Pro Val Asp Leu
Leu Gly Val Ala His Asn Asn Leu Met Ala 515 520
525Met Ala Gln Glu Thr Gly 53067644PRTHomo sapiens 67Met
Phe Ser Met Arg Ile Val Cys Leu Val Leu Ser Val Val Gly Thr1
5 10 15Ala Trp Thr Ala Asp Ser Gly
Glu Gly Asp Phe Leu Ala Glu Gly Gly 20 25
30Gly Val Arg Gly Pro Arg Val Val Glu Arg His Gln Ser Ala
Cys Lys 35 40 45Asp Ser Asp Trp
Pro Phe Cys Ser Asp Glu Asp Trp Asn Tyr Lys Cys 50 55
60Pro Ser Gly Cys Arg Met Lys Gly Leu Ile Asp Glu Val
Asn Gln Asp65 70 75
80Phe Thr Asn Arg Ile Asn Lys Leu Lys Asn Ser Leu Phe Glu Tyr Gln
85 90 95Lys Asn Asn Lys Asp Ser
His Ser Leu Thr Thr Asn Ile Met Glu Ile 100
105 110Leu Arg Gly Asp Phe Ser Ser Ala Asn Asn Arg Asp
Asn Thr Tyr Asn 115 120 125Arg Val
Ser Glu Asp Leu Arg Ser Arg Ile Glu Val Leu Lys Arg Lys 130
135 140Val Ile Glu Lys Val Gln His Ile Gln Leu Leu
Gln Lys Asn Val Arg145 150 155
160Ala Gln Leu Val Asp Met Lys Arg Leu Glu Val Asp Ile Asp Ile Lys
165 170 175Ile Arg Ser Cys
Arg Gly Ser Cys Ser Arg Ala Leu Ala Arg Glu Val 180
185 190Asp Leu Lys Asp Tyr Glu Asp Gln Gln Lys Gln
Leu Glu Gln Val Ile 195 200 205Ala
Lys Asp Leu Leu Pro Ser Arg Asp Arg Gln His Leu Pro Leu Ile 210
215 220Lys Met Lys Pro Val Pro Asp Leu Val Pro
Gly Asn Phe Lys Ser Gln225 230 235
240Leu Gln Lys Val Pro Pro Glu Trp Lys Ala Leu Thr Asp Met Pro
Gln 245 250 255Met Arg Met
Glu Leu Glu Arg Pro Gly Gly Asn Glu Ile Thr Arg Gly 260
265 270Gly Ser Thr Ser Tyr Gly Thr Gly Ser Glu
Thr Glu Ser Pro Arg Asn 275 280
285Pro Ser Ser Ala Gly Ser Trp Asn Ser Gly Ser Ser Gly Pro Gly Ser 290
295 300Thr Gly Asn Arg Asn Pro Gly Ser
Ser Gly Thr Gly Gly Thr Ala Thr305 310
315 320Trp Lys Pro Gly Ser Ser Gly Pro Gly Ser Thr Gly
Ser Trp Asn Ser 325 330
335Gly Ser Ser Gly Thr Gly Ser Thr Gly Asn Gln Asn Pro Gly Ser Pro
340 345 350Arg Pro Gly Ser Thr Gly
Thr Trp Asn Pro Gly Ser Ser Glu Arg Gly 355 360
365Ser Ala Gly His Trp Thr Ser Glu Ser Ser Val Ser Gly Ser
Thr Gly 370 375 380Gln Trp His Ser Glu
Ser Gly Ser Phe Arg Pro Asp Ser Pro Gly Ser385 390
395 400Gly Asn Ala Arg Pro Asn Asn Pro Asp Trp
Gly Thr Phe Glu Glu Val 405 410
415Ser Gly Asn Val Ser Pro Gly Thr Arg Arg Glu Tyr His Thr Glu Lys
420 425 430Leu Val Thr Ser Lys
Gly Asp Lys Glu Leu Arg Thr Gly Lys Glu Lys 435
440 445Val Thr Ser Gly Ser Thr Thr Thr Thr Arg Arg Ser
Cys Ser Lys Thr 450 455 460Val Thr Lys
Thr Val Ile Gly Pro Asp Gly His Lys Glu Val Thr Lys465
470 475 480Glu Val Val Thr Ser Glu Asp
Gly Ser Asp Cys Pro Glu Ala Met Asp 485
490 495Leu Gly Thr Leu Ser Gly Ile Gly Thr Leu Asp Gly
Phe Arg His Arg 500 505 510His
Pro Asp Glu Ala Ala Phe Phe Asp Thr Ala Ser Thr Gly Lys Thr 515
520 525Phe Pro Gly Phe Phe Ser Pro Met Leu
Gly Glu Phe Val Ser Glu Thr 530 535
540Glu Ser Arg Gly Ser Glu Ser Gly Ile Phe Thr Asn Thr Lys Glu Ser545
550 555 560Ser Ser His His
Pro Gly Ile Ala Glu Phe Pro Ser Arg Gly Lys Ser 565
570 575Ser Ser Tyr Ser Lys Gln Phe Thr Ser Ser
Thr Ser Tyr Asn Arg Gly 580 585
590Asp Ser Thr Phe Glu Ser Lys Ser Tyr Lys Met Ala Asp Glu Ala Gly
595 600 605Ser Glu Ala Asp His Glu Gly
Thr His Ser Thr Lys Arg Gly His Ala 610 615
620Lys Ser Arg Pro Val Arg Gly Ile His Thr Ser Pro Leu Gly Lys
Pro625 630 635 640Ser Leu
Ser Pro68644PRTHomo sapiens 68Met Lys Leu Ile Thr Ile Leu Phe Leu Cys Ser
Arg Leu Leu Leu Ser1 5 10
15Leu Thr Gln Glu Ser Gln Ser Glu Glu Ile Asp Cys Asn Asp Lys Asp
20 25 30Leu Phe Lys Ala Val Asp Ala
Ala Leu Lys Lys Tyr Asn Ser Gln Asn 35 40
45Gln Ser Asn Asn Gln Phe Val Leu Tyr Arg Ile Thr Glu Ala Thr
Lys 50 55 60Thr Val Gly Ser Asp Thr
Phe Tyr Ser Phe Lys Tyr Glu Ile Lys Glu65 70
75 80Gly Asp Cys Pro Val Gln Ser Gly Lys Thr Trp
Gln Asp Cys Glu Tyr 85 90
95Lys Asp Ala Ala Lys Ala Ala Thr Gly Glu Cys Thr Ala Thr Val Gly
100 105 110Lys Arg Ser Ser Thr Lys
Phe Ser Val Ala Thr Gln Thr Cys Gln Ile 115 120
125Thr Pro Ala Glu Gly Pro Val Val Thr Ala Gln Tyr Asp Cys
Leu Gly 130 135 140Cys Val His Pro Ile
Ser Thr Gln Ser Pro Asp Leu Glu Pro Ile Leu145 150
155 160Arg His Gly Ile Gln Tyr Phe Asn Asn Asn
Thr Gln His Ser Ser Leu 165 170
175Phe Met Leu Asn Glu Val Lys Arg Ala Gln Arg Gln Val Val Ala Gly
180 185 190Leu Asn Phe Arg Ile
Thr Tyr Ser Ile Val Gln Thr Asn Cys Ser Lys 195
200 205Glu Asn Phe Leu Phe Leu Thr Pro Asp Cys Lys Ser
Leu Trp Asn Gly 210 215 220Asp Thr Gly
Glu Cys Thr Asp Asn Ala Tyr Ile Asp Ile Gln Leu Arg225
230 235 240Ile Ala Ser Phe Ser Gln Asn
Cys Asp Ile Tyr Pro Gly Lys Asp Phe 245
250 255Val Gln Pro Pro Thr Lys Ile Cys Val Gly Cys Pro
Arg Asp Ile Pro 260 265 270Thr
Asn Ser Pro Glu Leu Glu Glu Thr Leu Thr His Thr Ile Thr Lys 275
280 285Leu Asn Ala Glu Asn Asn Ala Thr Phe
Tyr Phe Lys Ile Asp Asn Val 290 295
300Lys Lys Ala Arg Val Gln Val Val Ala Gly Lys Lys Tyr Phe Ile Asp305
310 315 320Phe Val Ala Arg
Glu Thr Thr Cys Ser Lys Glu Ser Asn Glu Glu Leu 325
330 335Thr Glu Ser Cys Glu Thr Lys Lys Leu Gly
Gln Ser Leu Asp Cys Asn 340 345
350Ala Glu Val Tyr Val Val Pro Trp Glu Lys Lys Ile Tyr Pro Thr Val
355 360 365Asn Cys Gln Pro Leu Gly Met
Ile Ser Leu Met Lys Arg Pro Pro Gly 370 375
380Phe Ser Pro Phe Arg Ser Ser Arg Ile Gly Glu Ile Lys Glu Glu
Thr385 390 395 400Thr Val
Ser Pro Pro His Thr Ser Met Ala Pro Ala Gln Asp Glu Glu
405 410 415Arg Asp Ser Gly Lys Glu Gln
Gly His Thr Arg Arg His Asp Trp Gly 420 425
430His Glu Lys Gln Arg Lys His Asn Leu Gly His Gly His Lys
His Glu 435 440 445Arg Asp Gln Gly
His Gly His Gln Arg Gly His Gly Leu Gly His Gly 450
455 460His Glu Gln Gln His Gly Leu Gly His Gly His Lys
Phe Lys Leu Asp465 470 475
480Asp Asp Leu Glu His Gln Gly Gly His Val Leu Asp His Gly His Lys
485 490 495His Lys His Gly His
Gly His Gly Lys His Lys Asn Lys Gly Lys Lys 500
505 510Asn Gly Lys His Asn Gly Trp Lys Thr Glu His Leu
Ala Ser Ser Ser 515 520 525Glu Asp
Ser Thr Thr Pro Ser Ala Gln Thr Gln Glu Lys Thr Glu Gly 530
535 540Pro Thr Pro Ile Pro Ser Leu Ala Lys Pro Gly
Val Thr Val Thr Phe545 550 555
560Ser Asp Phe Gln Asp Ser Asp Leu Ile Ala Thr Met Met Pro Pro Ile
565 570 575Ser Pro Ala Pro
Ile Gln Ser Asp Asp Asp Trp Ile Pro Asp Ile Gln 580
585 590Thr Asp Pro Asn Gly Leu Ser Phe Asn Pro Ile
Ser Asp Phe Pro Asp 595 600 605Thr
Thr Ser Pro Lys Cys Pro Gly Arg Pro Trp Lys Ser Val Ser Glu 610
615 620Ile Asn Pro Thr Thr Gln Met Lys Glu Ser
Tyr Tyr Phe Asp Leu Thr625 630 635
640Asp Gly Leu Ser69644PRTHomo sapiens 69Met Phe Ser Met Arg Ile
Val Cys Leu Val Leu Ser Val Val Gly Thr1 5
10 15Ala Trp Thr Ala Asp Ser Gly Glu Gly Asp Phe Leu
Ala Glu Gly Gly 20 25 30Gly
Val Arg Gly Pro Arg Val Val Glu Arg His Gln Ser Ala Cys Lys 35
40 45Asp Ser Asp Trp Pro Phe Cys Ser Asp
Glu Asp Trp Asn Tyr Lys Cys 50 55
60Pro Ser Gly Cys Arg Met Lys Gly Leu Ile Asp Glu Val Asn Gln Asp65
70 75 80Phe Thr Asn Arg Ile
Asn Lys Leu Lys Asn Ser Leu Phe Glu Tyr Gln 85
90 95Lys Asn Asn Lys Asp Ser His Ser Leu Thr Thr
Asn Ile Met Glu Ile 100 105
110Leu Arg Gly Asp Phe Ser Ser Ala Asn Asn Arg Asp Asn Thr Tyr Asn
115 120 125Arg Val Ser Glu Asp Leu Arg
Ser Arg Ile Glu Val Leu Lys Arg Lys 130 135
140Val Ile Glu Lys Val Gln His Ile Gln Leu Leu Gln Lys Asn Val
Arg145 150 155 160Ala Gln
Leu Val Asp Met Lys Arg Leu Glu Val Asp Ile Asp Ile Lys
165 170 175Ile Arg Ser Cys Arg Gly Ser
Cys Ser Arg Ala Leu Ala Arg Glu Val 180 185
190Asp Leu Lys Asp Tyr Glu Asp Gln Gln Lys Gln Leu Glu Gln
Val Ile 195 200 205Ala Lys Asp Leu
Leu Pro Ser Arg Asp Arg Gln His Leu Pro Leu Ile 210
215 220Lys Met Lys Pro Val Pro Asp Leu Val Pro Gly Asn
Phe Lys Ser Gln225 230 235
240Leu Gln Lys Val Pro Pro Glu Trp Lys Ala Leu Thr Asp Met Pro Gln
245 250 255Met Arg Met Glu Leu
Glu Arg Pro Gly Gly Asn Glu Ile Thr Arg Gly 260
265 270Gly Ser Thr Ser Tyr Gly Thr Gly Ser Glu Thr Glu
Ser Pro Arg Asn 275 280 285Pro Ser
Ser Ala Gly Ser Trp Asn Ser Gly Ser Ser Gly Pro Gly Ser 290
295 300Thr Gly Asn Arg Asn Pro Gly Ser Ser Gly Thr
Gly Gly Thr Ala Thr305 310 315
320Trp Lys Pro Gly Ser Ser Gly Pro Gly Ser Thr Gly Ser Trp Asn Ser
325 330 335Gly Ser Ser Gly
Thr Gly Ser Thr Gly Asn Gln Asn Pro Gly Ser Pro 340
345 350Arg Pro Gly Ser Thr Gly Thr Trp Asn Pro Gly
Ser Ser Glu Arg Gly 355 360 365Ser
Ala Gly His Trp Thr Ser Glu Ser Ser Val Ser Gly Ser Thr Gly 370
375 380Gln Trp His Ser Glu Ser Gly Ser Phe Arg
Pro Asp Ser Pro Gly Ser385 390 395
400Gly Asn Ala Arg Pro Asn Asn Pro Asp Trp Gly Thr Phe Glu Glu
Val 405 410 415Ser Gly Asn
Val Ser Pro Gly Thr Arg Arg Glu Tyr His Thr Glu Lys 420
425 430Leu Val Thr Ser Lys Gly Asp Lys Glu Leu
Arg Thr Gly Lys Glu Lys 435 440
445Val Thr Ser Gly Ser Thr Thr Thr Thr Arg Arg Ser Cys Ser Lys Thr 450
455 460Val Thr Lys Thr Val Ile Gly Pro
Asp Gly His Lys Glu Val Thr Lys465 470
475 480Glu Val Val Thr Ser Glu Asp Gly Ser Asp Cys Pro
Glu Ala Met Asp 485 490
495Leu Gly Thr Leu Ser Gly Ile Gly Thr Leu Asp Gly Phe Arg His Arg
500 505 510His Pro Asp Glu Ala Ala
Phe Phe Asp Thr Ala Ser Thr Gly Lys Thr 515 520
525Phe Pro Gly Phe Phe Ser Pro Met Leu Gly Glu Phe Val Ser
Glu Thr 530 535 540Glu Ser Arg Gly Ser
Glu Ser Gly Ile Phe Thr Asn Thr Lys Glu Ser545 550
555 560Ser Ser His His Pro Gly Ile Ala Glu Phe
Pro Ser Arg Gly Lys Ser 565 570
575Ser Ser Tyr Ser Lys Gln Phe Thr Ser Ser Thr Ser Tyr Asn Arg Gly
580 585 590Asp Ser Thr Phe Glu
Ser Lys Ser Tyr Lys Met Ala Asp Glu Ala Gly 595
600 605Ser Glu Ala Asp His Glu Gly Thr His Ser Thr Lys
Arg Gly His Ala 610 615 620Lys Ser Arg
Pro Val Arg Gly Ile His Thr Ser Pro Leu Gly Lys Pro625
630 635 640Ser Leu Ser Pro70267PRTHomo
sapiens 70Met Lys Ala Ala Val Leu Thr Leu Ala Val Leu Phe Leu Thr Gly
Ser1 5 10 15Gln Ala Arg
His Phe Trp Gln Gln Asp Glu Pro Pro Gln Ser Pro Trp 20
25 30Asp Arg Val Lys Asp Leu Ala Thr Val Tyr
Val Asp Val Leu Lys Asp 35 40
45Ser Gly Arg Asp Tyr Val Ser Gln Phe Glu Gly Ser Ala Leu Gly Lys 50
55 60Gln Leu Asn Leu Lys Leu Leu Asp Asn
Trp Asp Ser Val Thr Ser Thr65 70 75
80Phe Ser Lys Leu Arg Glu Gln Leu Gly Pro Val Thr Gln Glu
Phe Trp 85 90 95Asp Asn
Leu Glu Lys Glu Thr Glu Gly Leu Arg Gln Glu Met Ser Lys 100
105 110Asp Leu Glu Glu Val Lys Ala Lys Val
Gln Pro Tyr Leu Asp Asp Phe 115 120
125Gln Lys Lys Trp Gln Glu Glu Met Glu Leu Tyr Arg Gln Lys Val Glu
130 135 140Pro Leu Arg Ala Glu Leu Gln
Glu Gly Ala Arg Gln Lys Leu His Glu145 150
155 160Leu Gln Glu Lys Leu Ser Pro Leu Gly Glu Glu Met
Arg Asp Arg Ala 165 170
175Arg Ala His Val Asp Ala Leu Arg Thr His Leu Ala Pro Tyr Ser Asp
180 185 190Glu Leu Arg Gln Arg Leu
Ala Ala Arg Leu Glu Ala Leu Lys Glu Asn 195 200
205Gly Gly Ala Arg Leu Ala Glu Tyr His Ala Lys Ala Thr Glu
His Leu 210 215 220Ser Thr Leu Ser Glu
Lys Ala Lys Pro Ala Leu Glu Asp Leu Arg Gln225 230
235 240Gly Leu Leu Pro Val Leu Glu Ser Phe Lys
Val Ser Phe Leu Ser Ala 245 250
255Leu Glu Glu Tyr Thr Lys Lys Leu Asn Thr Gln 260
26571396PRTHomo sapiens 71Met Phe Leu Lys Ala Val Val Leu Thr
Leu Ala Leu Val Ala Val Ala1 5 10
15Gly Ala Arg Ala Glu Val Ser Ala Asp Gln Val Ala Thr Val Met
Trp 20 25 30Asp Tyr Phe Ser
Gln Leu Ser Asn Asn Ala Lys Glu Ala Val Glu His 35
40 45Leu Gln Lys Ser Glu Leu Thr Gln Gln Leu Asn Ala
Leu Phe Gln Asp 50 55 60Lys Leu Gly
Glu Val Asn Thr Tyr Ala Gly Asp Leu Gln Lys Lys Leu65 70
75 80Val Pro Phe Ala Thr Glu Leu His
Glu Arg Leu Ala Lys Asp Ser Glu 85 90
95Lys Leu Lys Glu Glu Ile Gly Lys Glu Leu Glu Glu Leu Arg
Ala Arg 100 105 110Leu Leu Pro
His Ala Asn Glu Val Ser Gln Lys Ile Gly Asp Asn Leu 115
120 125Arg Glu Leu Gln Gln Arg Leu Glu Pro Tyr Ala
Asp Gln Leu Arg Thr 130 135 140Gln Val
Asn Thr Gln Ala Glu Gln Leu Arg Arg Gln Leu Thr Pro Tyr145
150 155 160Ala Gln Arg Met Glu Arg Val
Leu Arg Glu Asn Ala Asp Ser Leu Gln 165
170 175Ala Ser Leu Arg Pro His Ala Asp Glu Leu Lys Ala
Lys Ile Asp Gln 180 185 190Asn
Val Glu Glu Leu Lys Gly Arg Leu Thr Pro Tyr Ala Asp Glu Phe 195
200 205Lys Val Lys Ile Asp Gln Thr Val Glu
Glu Leu Arg Arg Ser Leu Ala 210 215
220Pro Tyr Ala Gln Asp Thr Gln Glu Lys Leu Asn His Gln Leu Glu Gly225
230 235 240Leu Thr Phe Gln
Met Lys Lys Asn Ala Glu Glu Leu Lys Ala Arg Ile 245
250 255Ser Ala Ser Ala Glu Glu Leu Arg Gln Arg
Leu Ala Pro Leu Ala Glu 260 265
270Asp Val Arg Gly Asn Leu Arg Gly Asn Thr Glu Gly Leu Gln Lys Ser
275 280 285Leu Ala Glu Leu Gly Gly His
Leu Asp Gln Gln Val Glu Glu Phe Arg 290 295
300Arg Arg Val Glu Pro Tyr Gly Glu Asn Phe Asn Lys Ala Leu Val
Gln305 310 315 320Gln Met
Glu Gln Leu Arg Thr Lys Leu Gly Pro His Ala Gly Asp Val
325 330 335Glu Gly His Leu Ser Phe Leu
Glu Lys Asp Leu Arg Asp Lys Val Asn 340 345
350Ser Phe Phe Ser Thr Phe Lys Glu Lys Glu Ser Gln Asp Lys
Thr Leu 355 360 365Ser Leu Pro Glu
Leu Glu Gln Gln Gln Glu Gln His Gln Glu Gln Gln 370
375 380Gln Glu Gln Val Gln Met Leu Ala Pro Leu Glu Ser385
390 39572317PRTHomo sapiens 72Met Lys Val
Leu Trp Ala Ala Leu Leu Val Thr Phe Leu Ala Gly Cys1 5
10 15Gln Ala Lys Val Glu Gln Ala Val Glu
Thr Glu Pro Glu Pro Glu Leu 20 25
30Arg Gln Gln Thr Glu Trp Gln Ser Gly Gln Arg Trp Glu Leu Ala Leu
35 40 45Gly Arg Phe Trp Asp Tyr Leu
Arg Trp Val Gln Thr Leu Ser Glu Gln 50 55
60Val Gln Glu Glu Leu Leu Ser Ser Gln Val Thr Gln Glu Leu Arg Ala65
70 75 80Leu Met Asp Glu
Thr Met Lys Glu Leu Lys Ala Tyr Lys Ser Glu Leu 85
90 95Glu Glu Gln Leu Thr Pro Val Ala Glu Glu
Thr Arg Ala Arg Leu Ser 100 105
110Lys Glu Leu Gln Ala Ala Gln Ala Arg Leu Gly Ala Asp Met Glu Asp
115 120 125Val Cys Gly Arg Leu Val Gln
Tyr Arg Gly Glu Val Gln Ala Met Leu 130 135
140Gly Gln Ser Thr Glu Glu Leu Arg Val Arg Leu Ala Ser His Leu
Arg145 150 155 160Lys Leu
Arg Lys Arg Leu Leu Arg Asp Ala Asp Asp Leu Gln Lys Arg
165 170 175Leu Ala Val Tyr Gln Ala Gly
Ala Arg Glu Gly Ala Glu Arg Gly Leu 180 185
190Ser Ala Ile Arg Glu Arg Leu Gly Pro Leu Val Glu Gln Gly
Arg Val 195 200 205Arg Ala Ala Thr
Val Gly Ser Leu Ala Gly Gln Pro Leu Gln Glu Arg 210
215 220Ala Gln Ala Trp Gly Glu Arg Leu Arg Ala Arg Met
Glu Glu Met Gly225 230 235
240Ser Arg Thr Arg Asp Arg Leu Asp Glu Val Lys Glu Gln Val Ala Glu
245 250 255Val Arg Ala Lys Leu
Glu Glu Gln Ala Gln Gln Ile Arg Leu Gln Ala 260
265 270Glu Ala Phe Gln Ala Arg Leu Lys Ser Trp Phe Glu
Pro Leu Val Glu 275 280 285Asp Met
Gln Arg Gln Trp Ala Gly Leu Val Glu Lys Val Gln Ala Ala 290
295 300Val Gly Thr Ser Ala Ala Pro Val Pro Ser Asp
Asn His305 310 31573427PRTHomo sapiens
73Met Lys Leu Ile Thr Ile Leu Phe Leu Cys Ser Arg Leu Leu Leu Ser1
5 10 15Leu Thr Gln Glu Ser Gln
Ser Glu Glu Ile Asp Cys Asn Asp Lys Asp 20 25
30Leu Phe Lys Ala Val Asp Ala Ala Leu Lys Lys Tyr Asn
Ser Gln Asn 35 40 45Gln Ser Asn
Asn Gln Phe Val Leu Tyr Arg Ile Thr Glu Ala Thr Lys 50
55 60Thr Val Gly Ser Asp Thr Phe Tyr Ser Phe Lys Tyr
Glu Ile Lys Glu65 70 75
80Gly Asp Cys Pro Val Gln Ser Gly Lys Thr Trp Gln Asp Cys Glu Tyr
85 90 95Lys Asp Ala Ala Lys Ala
Ala Thr Gly Glu Cys Thr Ala Thr Val Gly 100
105 110Lys Arg Ser Ser Thr Lys Phe Ser Val Ala Thr Gln
Thr Cys Gln Ile 115 120 125Thr Pro
Ala Glu Gly Pro Val Val Thr Ala Gln Tyr Asp Cys Leu Gly 130
135 140Cys Val His Pro Ile Ser Thr Gln Ser Pro Asp
Leu Glu Pro Ile Leu145 150 155
160Arg His Gly Ile Gln Tyr Phe Asn Asn Asn Thr Gln His Ser Ser Leu
165 170 175Phe Met Leu Asn
Glu Val Lys Arg Ala Gln Arg Gln Val Val Ala Gly 180
185 190Leu Asn Phe Arg Ile Thr Tyr Ser Ile Val Gln
Thr Asn Cys Ser Lys 195 200 205Glu
Asn Phe Leu Phe Leu Thr Pro Asp Cys Lys Ser Leu Trp Asn Gly 210
215 220Asp Thr Gly Glu Cys Thr Asp Asn Ala Tyr
Ile Asp Ile Gln Leu Arg225 230 235
240Ile Ala Ser Phe Ser Gln Asn Cys Asp Ile Tyr Pro Gly Lys Asp
Phe 245 250 255Val Gln Pro
Pro Thr Lys Ile Cys Val Gly Cys Pro Arg Asp Ile Pro 260
265 270Thr Asn Ser Pro Glu Leu Glu Glu Thr Leu
Thr His Thr Ile Thr Lys 275 280
285Leu Asn Ala Glu Asn Asn Ala Thr Phe Tyr Phe Lys Ile Asp Asn Val 290
295 300Lys Lys Ala Arg Val Gln Val Val
Ala Gly Lys Lys Tyr Phe Ile Asp305 310
315 320Phe Val Ala Arg Glu Thr Thr Cys Ser Lys Glu Ser
Asn Glu Glu Leu 325 330
335Thr Glu Ser Cys Glu Thr Lys Lys Leu Gly Gln Ser Leu Asp Cys Asn
340 345 350Ala Glu Val Tyr Val Val
Pro Trp Glu Lys Lys Ile Tyr Pro Thr Val 355 360
365Asn Cys Gln Pro Leu Gly Met Ile Ser Leu Met Lys Arg Pro
Pro Gly 370 375 380Phe Ser Pro Phe Arg
Ser Ser Arg Ile Gly Glu Ile Lys Glu Glu Thr385 390
395 400Thr Ser His Leu Arg Ser Cys Glu Tyr Lys
Gly Arg Pro Pro Lys Ala 405 410
415Gly Ala Glu Pro Ala Ser Glu Arg Glu Val Ser 420
42574732PRTHomo sapiens 74Met Ser Glu Thr Ser Arg Thr Ala Phe
Gly Gly Arg Arg Ala Val Pro1 5 10
15Pro Asn Asn Ser Asn Ala Ala Glu Asp Asp Leu Pro Thr Val Glu
Leu 20 25 30Gln Gly Val Val
Pro Arg Gly Val Asn Leu Gln Glu Phe Leu Asn Val 35
40 45Thr Ser Val His Leu Phe Lys Glu Arg Trp Asp Thr
Asn Lys Val Asp 50 55 60His His Thr
Asp Lys Tyr Glu Asn Asn Lys Leu Ile Val Arg Arg Gly65 70
75 80Gln Ser Phe Tyr Val Gln Ile Asp
Leu Ser Arg Pro Tyr Asp Pro Arg 85 90
95Arg Asp Leu Phe Arg Val Glu Tyr Val Ile Gly Arg Tyr Pro
Gln Glu 100 105 110Asn Lys Gly
Thr Tyr Ile Pro Val Pro Ile Val Ser Glu Leu Gln Ser 115
120 125Gly Lys Trp Gly Ala Lys Ile Val Met Arg Glu
Asp Arg Ser Val Arg 130 135 140Leu Ser
Ile Gln Ser Ser Pro Lys Cys Ile Val Gly Lys Phe Arg Met145
150 155 160Tyr Val Ala Val Trp Thr Pro
Tyr Gly Val Leu Arg Thr Ser Arg Asn 165
170 175Pro Glu Thr Asp Thr Tyr Ile Leu Phe Asn Pro Trp
Cys Glu Asp Asp 180 185 190Ala
Val Tyr Leu Asp Asn Glu Lys Glu Arg Glu Glu Tyr Val Leu Asn 195
200 205Asp Ile Gly Val Ile Phe Tyr Gly Glu
Val Asn Asp Ile Lys Thr Arg 210 215
220Ser Trp Ser Tyr Gly Gln Phe Glu Asp Gly Ile Leu Asp Thr Cys Leu225
230 235 240Tyr Val Met Asp
Arg Ala Gln Met Asp Leu Ser Gly Arg Gly Asn Pro 245
250 255Ile Lys Val Ser Arg Val Gly Ser Ala Met
Val Asn Ala Lys Asp Asp 260 265
270Glu Gly Val Leu Val Gly Ser Trp Asp Asn Ile Tyr Ala Tyr Gly Val
275 280 285Pro Pro Ser Ala Trp Thr Gly
Ser Val Asp Ile Leu Leu Glu Tyr Arg 290 295
300Ser Ser Glu Asn Pro Val Arg Tyr Gly Gln Cys Trp Val Phe Ala
Gly305 310 315 320Val Phe
Asn Thr Phe Leu Arg Cys Leu Gly Ile Pro Ala Arg Ile Val
325 330 335Thr Asn Tyr Phe Ser Ala His
Asp Asn Asp Ala Asn Leu Gln Met Asp 340 345
350Ile Phe Leu Glu Glu Asp Gly Asn Val Asn Ser Lys Leu Thr
Lys Asp 355 360 365Ser Val Trp Asn
Tyr His Cys Trp Asn Glu Ala Trp Met Thr Arg Pro 370
375 380Asp Leu Pro Val Gly Phe Gly Gly Trp Gln Ala Val
Asp Ser Thr Pro385 390 395
400Gln Glu Asn Ser Asp Gly Met Tyr Arg Cys Gly Pro Ala Ser Val Gln
405 410 415Ala Ile Lys His Gly
His Val Cys Phe Gln Phe Asp Ala Pro Phe Val 420
425 430Phe Ala Glu Val Asn Ser Asp Leu Ile Tyr Ile Thr
Ala Lys Lys Asp 435 440 445Gly Thr
His Val Val Glu Asn Val Asp Ala Thr His Ile Gly Lys Leu 450
455 460Ile Val Thr Lys Gln Ile Gly Gly Asp Gly Met
Met Asp Ile Thr Asp465 470 475
480Thr Tyr Lys Phe Gln Glu Gly Gln Glu Glu Glu Arg Leu Ala Leu Glu
485 490 495Thr Ala Leu Met
Tyr Gly Ala Lys Lys Pro Leu Asn Thr Glu Gly Val 500
505 510Met Lys Ser Arg Ser Asn Val Asp Met Asp Phe
Glu Val Glu Asn Ala 515 520 525Val
Leu Gly Lys Asp Phe Lys Leu Ser Ile Thr Phe Arg Asn Asn Ser 530
535 540His Asn Arg Tyr Thr Ile Thr Ala Tyr Leu
Ser Ala Asn Ile Thr Phe545 550 555
560Tyr Thr Gly Val Pro Lys Ala Glu Phe Lys Lys Glu Thr Phe Asp
Val 565 570 575Thr Leu Glu
Pro Leu Ser Phe Lys Lys Glu Ala Val Leu Ile Gln Ala 580
585 590Gly Glu Tyr Met Gly Gln Leu Leu Glu Gln
Ala Ser Leu His Phe Phe 595 600
605Val Thr Ala Arg Ile Asn Glu Thr Arg Asp Val Leu Ala Lys Gln Lys 610
615 620Ser Thr Val Leu Thr Ile Pro Glu
Ile Ile Ile Lys Val Arg Gly Thr625 630
635 640Gln Val Val Gly Ser Asp Met Thr Val Thr Val Gln
Phe Thr Asn Pro 645 650
655Leu Lys Glu Thr Leu Arg Asn Val Trp Val His Leu Asp Gly Pro Gly
660 665 670Val Thr Arg Pro Met Lys
Lys Met Phe Arg Glu Ile Arg Pro Asn Ser 675 680
685Thr Val Gln Trp Glu Glu Val Cys Arg Pro Trp Val Ser Gly
His Arg 690 695 700Lys Leu Ile Ala Ser
Met Ser Ser Asp Ser Leu Arg His Val Tyr Gly705 710
715 720Glu Leu Asp Val Gln Ile Gln Arg Arg Pro
Ser Met 725 73075147PRTHomo sapiens 75Met
Ala Ser His Arg Leu Leu Leu Leu Cys Leu Ala Gly Leu Val Phe1
5 10 15Val Ser Glu Ala Gly Pro Thr
Gly Thr Gly Glu Ser Lys Cys Pro Leu 20 25
30Met Val Lys Val Leu Asp Ala Val Arg Gly Ser Pro Ala Ile
Asn Val 35 40 45Ala Val His Val
Phe Arg Lys Ala Ala Asp Asp Thr Trp Glu Pro Phe 50 55
60Ala Ser Gly Lys Thr Ser Glu Ser Gly Glu Leu His Gly
Leu Thr Thr65 70 75
80Glu Glu Glu Phe Val Glu Gly Ile Tyr Lys Val Glu Ile Asp Thr Lys
85 90 95Ser Tyr Trp Lys Ala Leu
Gly Ile Ser Pro Phe His Glu His Ala Glu 100
105 110Val Val Phe Thr Ala Asn Asp Ser Gly Pro Arg Arg
Tyr Thr Ile Ala 115 120 125Ala Leu
Leu Ser Pro Tyr Ser Tyr Ser Thr Thr Ala Val Val Thr Asn 130
135 140Pro Lys Glu1457617PRTHomo sapiens 76Arg Asn
Gly Phe Lys Ser His Ala Leu Gln Leu Asn Asn Arg Gln Ile1 5
10 15Arg7716PRTHomo sapiens 77Asn Gly
Phe Lys Ser His Ala Leu Gln Leu Asn Asn Arg Gln Ile Arg1 5
10 157831PRTHomo sapiens 78Arg Gly Leu
Glu Glu Glu Leu Gln Phe Ser Leu Gly Ser Lys Ile Asn1 5
10 15Val Lys Val Gly Gly Asn Ser Lys Gly
Thr Leu Lys Val Leu Arg 20 25
307927PRTHomo sapiens 79Arg Gly Leu Glu Glu Glu Leu Gln Phe Ser Leu Gly
Ser Lys Ile Asn1 5 10
15Val Lys Val Gly Gly Asn Ser Lys Gly Thr Leu 20
258023PRTHomo sapiens 80Arg Gly Leu Glu Glu Glu Leu Gln Phe Ser Leu
Gly Ser Lys Ile Asn1 5 10
15Val Lys Val Gly Gly Asn Ser 208117PRTHomo sapiens 81Arg Gly
Leu Glu Glu Glu Leu Gln Phe Ser Leu Gly Ser Lys Ile Asn1 5
10 15Val8239PRTHomo sapiens 82Arg Gln
Ala Gly Ala Ala Gly Ser Arg Met Asn Phe Arg Pro Gly Val1 5
10 15Leu Ser Ser Arg Gln Leu Gly Leu
Pro Gly Pro Pro Asp Val Pro Asp 20 25
30His Ala Ala Tyr His Pro Phe 358319PRTHomo sapiens 83Gln
Leu Gly Leu Pro Gly Pro Pro Asp Val Pro Asp His Ala Ala Tyr1
5 10 15His Pro Phe8429PRTHomo sapiens
84Arg Asn Val His Ser Gly Ser Thr Phe Phe Lys Tyr Tyr Leu Gln Gly1
5 10 15Ala Lys Ile Pro Lys Pro
Glu Ala Ser Phe Ser Pro Arg 20 258523PRTHomo
sapiens 85Arg Asn Val His Ser Ala Gly Ala Ala Gly Ser Arg Met Asn Phe
Arg1 5 10 15Pro Gly Val
Leu Ser Ser Arg 208631PRTHomo sapiensMOD_RES(26)..(26)Oxidated
Met 86Arg Ala Glu Leu Gln Glu Gly Ala Arg Gln Lys Leu His Glu Leu Gln1
5 10 15Glu Lys Leu Ser Pro
Leu Gly Glu Glu Met Arg Asp Arg Ala Arg 20 25
308715PRTHomo sapiens 87Glu Leu Gln Glu Gly Ala Arg Gln
Lys Leu His Glu Leu Gln Glu1 5 10
158829PRTHomo sapiens 88Arg Gln Gly Leu Leu Pro Val Leu Glu Ser
Phe Lys Val Ser Phe Leu1 5 10
15Ser Ala Leu Glu Glu Tyr Thr Lys Lys Leu Asn Thr Gln 20
258921PRTHomo sapiens 89Lys Ala Thr Glu His Leu Ser Thr
Leu Ser Glu Lys Ala Lys Pro Ala1 5 10
15Leu Glu Asp Leu Arg 209024PRTHomo sapiens 90Ile
Ser Ala Ser Ala Glu Glu Leu Arg Gln Arg Leu Ala Pro Leu Ala1
5 10 15Glu Asp Val Arg Gly Asn Leu
Lys 209126PRTHomo sapiens 91Lys Gly Asn Thr Glu Gly Leu Gln
Lys Ser Leu Ala Glu Leu Gly Gly1 5 10
15His Leu Asp Gln Gln Val Glu Glu Phe Arg 20
259225PRTHomo sapiens 92Arg Ala Ala Thr Val Gly Ser Leu Ala
Gly Gln Pro Leu Gln Glu Arg1 5 10
15Ala Gln Ala Trp Gly Glu Arg Leu Arg 20
259324PRTHomo sapiens 93Arg Ala Ala Thr Val Gly Ser Leu Ala Gly Gln
Pro Leu Gln Glu Arg1 5 10
15Ala Gln Ala Trp Gly Glu Arg Leu 209411PRTHomo sapiens 94His
Phe Phe Phe Pro Lys Ser Arg Ile Val Arg1 5
109521PRTHomo sapiens 95Arg Lys His Asn Leu Gly His Gly His Lys His Glu
Arg Asp Gln Gly1 5 10
15His Gly His Gln Arg 209618PRTHomo sapiens 96Asn Leu Gly His
Gly His Lys His Glu Arg Asp Gln Gly His Gly His1 5
10 15Gln Arg9722PRTHomo sapiens 97Arg Gly His
Gly Leu Gly His Gly His Glu Gln Gln His Gly Leu Gly1 5
10 15His Gly His Lys Phe Lys
209826PRTHomo sapiens 98Arg Ala Val Pro Pro Asn Asn Ser Asn Ala Ala Glu
Asp Asp Leu Pro1 5 10
15Thr Val Glu Leu Gln Gly Val Val Pro Arg 20
259924PRTHomo sapiens 99Lys Ala Leu Gly Ile Ser Pro Phe His Glu His Ala
Glu Val Val Phe1 5 10
15Thr Ala Asn Asp Ser Gly Pro Arg 2010021PRTHomo sapiens
100Gly Leu Glu Glu Glu Leu Gln Phe Ser Leu Gly Ser Lys Ile Asn Val1
5 10 15Lys Gly Gly Asn Ser
2010130PRTHomo sapiens 101Lys Ser Ser Ser Tyr Ser Lys Gln Phe Thr
Ser Ser Thr Ser Tyr Asn1 5 10
15Arg Gly Asp Ser Thr Phe Glu Ser Lys Ser Tyr Lys Met Ala
20 25 3010257PRTHomo sapiens 102Gly Ser
Glu Ser Gly Ile Phe Thr Asn Thr Lys Glu Ser Ser Ser His1 5
10 15His Pro Gly Ile Ala Glu Phe Pro
Ser Arg Gly Lys Ser Ser Ser Tyr 20 25
30Ser Lys Gln Phe Thr Ser Ser Thr Ser Tyr Asn Arg Gly Asp Ser
Thr 35 40 45Phe Glu Ser Lys Ser
Tyr Lys Met Ala 50 5510319PRTHomo sapiens 103Arg Gly
Leu Glu Glu Glu Leu Gln Phe Ser Leu Gly Ser Lys Ile Asn1 5
10 15Val Lys Val10424PRTHomo sapiens
104Arg Thr Leu Glu Ile Pro Gly Asn Ser Asp Pro Asn Met Ile Pro Asp1
5 10 15Gly Asp Phe Asn Ser Tyr
Val Arg 2010525PRTHomo sapiens 105Lys Gly Asn Thr Glu Gly Leu
Gln Lys Ser Leu Ala Glu Leu Gly Gly1 5 10
15His Leu Asp Gln Gln Val Glu Glu Phe 20
2510626PRTHomo sapiens 106Asp Val Ser Ser Ala Leu Asp Lys Leu
Lys Glu Phe Gly Asn Thr Leu1 5 10
15Glu Asp Lys Ala Arg Glu Leu Ile Ser Arg 20
2510721PRTHomo sapiens 107Thr Val Gly Ser Leu Ala Gly Gln Pro Leu
Gln Glu Arg Ala Gln Ala1 5 10
15Trp Gly Glu Arg Leu 20108644PRTHomo sapiens 108Met Phe
Ser Met Arg Ile Val Cys Leu Val Leu Ser Val Val Gly Thr1 5
10 15Ala Trp Thr Ala Asp Ser Gly Glu
Gly Asp Phe Leu Ala Glu Gly Gly 20 25
30Gly Val Arg Gly Pro Arg Val Val Glu Arg His Gln Ser Ala Cys
Lys 35 40 45Asp Ser Asp Trp Pro
Phe Cys Ser Asp Glu Asp Trp Asn Tyr Lys Cys 50 55
60Pro Ser Gly Cys Arg Met Lys Gly Leu Ile Asp Glu Val Asn
Gln Asp65 70 75 80Phe
Thr Asn Arg Ile Asn Lys Leu Lys Asn Ser Leu Phe Glu Tyr Gln
85 90 95Lys Asn Asn Lys Asp Ser His
Ser Leu Thr Thr Asn Ile Met Glu Ile 100 105
110Leu Arg Gly Asp Phe Ser Ser Ala Asn Asn Arg Asp Asn Thr
Tyr Asn 115 120 125Arg Val Ser Glu
Asp Leu Arg Ser Arg Ile Glu Val Leu Lys Arg Lys 130
135 140Val Ile Glu Lys Val Gln His Ile Gln Leu Leu Gln
Lys Asn Val Arg145 150 155
160Ala Gln Leu Val Asp Met Lys Arg Leu Glu Val Asp Ile Asp Ile Lys
165 170 175Ile Arg Ser Cys Arg
Gly Ser Cys Ser Arg Ala Leu Ala Arg Glu Val 180
185 190Asp Leu Lys Asp Tyr Glu Asp Gln Gln Lys Gln Leu
Glu Gln Val Ile 195 200 205Ala Lys
Asp Leu Leu Pro Ser Arg Asp Arg Gln His Leu Pro Leu Ile 210
215 220Lys Met Lys Pro Val Pro Asp Leu Val Pro Gly
Asn Phe Lys Ser Gln225 230 235
240Leu Gln Lys Val Pro Pro Glu Trp Lys Ala Leu Thr Asp Met Pro Gln
245 250 255Met Arg Met Glu
Leu Glu Arg Pro Gly Gly Asn Glu Ile Thr Arg Gly 260
265 270Gly Ser Thr Ser Tyr Gly Thr Gly Ser Glu Thr
Glu Ser Pro Arg Asn 275 280 285Pro
Ser Ser Ala Gly Ser Trp Asn Ser Gly Ser Ser Gly Pro Gly Ser 290
295 300Thr Gly Asn Arg Asn Pro Gly Ser Ser Gly
Thr Gly Gly Thr Ala Thr305 310 315
320Trp Lys Pro Gly Ser Ser Gly Pro Gly Ser Thr Gly Ser Trp Asn
Ser 325 330 335Gly Ser Ser
Gly Thr Gly Ser Thr Gly Asn Gln Asn Pro Gly Ser Pro 340
345 350Arg Pro Gly Ser Thr Gly Thr Trp Asn Pro
Gly Ser Ser Glu Arg Gly 355 360
365Ser Ala Gly His Trp Thr Ser Glu Ser Ser Val Ser Gly Ser Thr Gly 370
375 380Gln Trp His Ser Glu Ser Gly Ser
Phe Arg Pro Asp Ser Pro Gly Ser385 390
395 400Gly Asn Ala Arg Pro Asn Asn Pro Asp Trp Gly Thr
Phe Glu Glu Val 405 410
415Ser Gly Asn Val Ser Pro Gly Thr Arg Arg Glu Tyr His Thr Glu Lys
420 425 430Leu Val Thr Ser Lys Gly
Asp Lys Glu Leu Arg Thr Gly Lys Glu Lys 435 440
445Val Thr Ser Gly Ser Thr Thr Thr Thr Arg Arg Ser Cys Ser
Lys Thr 450 455 460Val Thr Lys Thr Val
Ile Gly Pro Asp Gly His Lys Glu Val Thr Lys465 470
475 480Glu Val Val Thr Ser Glu Asp Gly Ser Asp
Cys Pro Glu Ala Met Asp 485 490
495Leu Gly Thr Leu Ser Gly Ile Gly Thr Leu Asp Gly Phe Arg His Arg
500 505 510His Pro Asp Glu Ala
Ala Phe Phe Asp Thr Ala Ser Thr Gly Lys Thr 515
520 525Phe Pro Gly Phe Phe Ser Pro Met Leu Gly Glu Phe
Val Ser Glu Thr 530 535 540Glu Ser Arg
Gly Ser Glu Ser Gly Ile Phe Thr Asn Thr Lys Glu Ser545
550 555 560Ser Ser His His Pro Gly Ile
Ala Glu Phe Pro Ser Arg Gly Lys Ser 565
570 575Ser Ser Tyr Ser Lys Gln Phe Thr Ser Ser Thr Ser
Tyr Asn Arg Gly 580 585 590Asp
Ser Thr Phe Glu Ser Lys Ser Tyr Lys Met Ala Asp Glu Ala Gly 595
600 605Ser Glu Ala Asp His Glu Gly Thr His
Ser Thr Lys Arg Gly His Ala 610 615
620Lys Ser Arg Pro Val Arg Gly Ile His Thr Ser Pro Leu Gly Lys Pro625
630 635 640Ser Leu Ser
Pro1091663PRTHomo sapiens 109Met Gly Pro Thr Ser Gly Pro Ser Leu Leu Leu
Leu Leu Leu Thr His1 5 10
15Leu Pro Leu Ala Leu Gly Ser Pro Met Tyr Ser Ile Ile Thr Pro Asn
20 25 30Ile Leu Arg Leu Glu Ser Glu
Glu Thr Met Val Leu Glu Ala His Asp 35 40
45Ala Gln Gly Asp Val Pro Val Thr Val Thr Val His Asp Phe Pro
Gly 50 55 60Lys Lys Leu Val Leu Ser
Ser Glu Lys Thr Val Leu Thr Pro Ala Thr65 70
75 80Asn His Met Gly Asn Val Thr Phe Thr Ile Pro
Ala Asn Arg Glu Phe 85 90
95Lys Ser Glu Lys Gly Arg Asn Lys Phe Val Thr Val Gln Ala Thr Phe
100 105 110Gly Thr Gln Val Val Glu
Lys Val Val Leu Val Ser Leu Gln Ser Gly 115 120
125Tyr Leu Phe Ile Gln Thr Asp Lys Thr Ile Tyr Thr Pro Gly
Ser Thr 130 135 140Val Leu Tyr Arg Ile
Phe Thr Val Asn His Lys Leu Leu Pro Val Gly145 150
155 160Arg Thr Val Met Val Asn Ile Glu Asn Pro
Glu Gly Ile Pro Val Lys 165 170
175Gln Asp Ser Leu Ser Ser Gln Asn Gln Leu Gly Val Leu Pro Leu Ser
180 185 190Trp Asp Ile Pro Glu
Leu Val Asn Met Gly Gln Trp Lys Ile Arg Ala 195
200 205Tyr Tyr Glu Asn Ser Pro Gln Gln Val Phe Ser Thr
Glu Phe Glu Val 210 215 220Lys Glu Tyr
Val Leu Pro Ser Phe Glu Val Ile Val Glu Pro Thr Glu225
230 235 240Lys Phe Tyr Tyr Ile Tyr Asn
Glu Lys Gly Leu Glu Val Thr Ile Thr 245
250 255Ala Arg Phe Leu Tyr Gly Lys Lys Val Glu Gly Thr
Ala Phe Val Ile 260 265 270Phe
Gly Ile Gln Asp Gly Glu Gln Arg Ile Ser Leu Pro Glu Ser Leu 275
280 285Lys Arg Ile Pro Ile Glu Asp Gly Ser
Gly Glu Val Val Leu Ser Arg 290 295
300Lys Val Leu Leu Asp Gly Val Gln Asn Leu Arg Ala Glu Asp Leu Val305
310 315 320Gly Lys Ser Leu
Tyr Val Ser Ala Thr Val Ile Leu His Ser Gly Ser 325
330 335Asp Met Val Gln Ala Glu Arg Ser Gly Ile
Pro Ile Val Thr Ser Pro 340 345
350Tyr Gln Ile His Phe Thr Lys Thr Pro Lys Tyr Phe Lys Pro Gly Met
355 360 365Pro Phe Asp Leu Met Val Phe
Val Thr Asn Pro Asp Gly Ser Pro Ala 370 375
380Tyr Arg Val Pro Val Ala Val Gln Gly Glu Asp Thr Val Gln Ser
Leu385 390 395 400Thr Gln
Gly Asp Gly Val Ala Lys Leu Ser Ile Asn Thr His Pro Ser
405 410 415Gln Lys Pro Leu Ser Ile Thr
Val Arg Thr Lys Lys Gln Glu Leu Ser 420 425
430Glu Ala Glu Gln Ala Thr Arg Thr Met Gln Ala Leu Pro Tyr
Ser Thr 435 440 445Val Gly Asn Ser
Asn Asn Tyr Leu His Leu Ser Val Leu Arg Thr Glu 450
455 460Leu Arg Pro Gly Glu Thr Leu Asn Val Asn Phe Leu
Leu Arg Met Asp465 470 475
480Arg Ala His Glu Ala Lys Ile Arg Tyr Tyr Thr Tyr Leu Ile Met Asn
485 490 495Lys Gly Arg Leu Leu
Lys Ala Gly Arg Gln Val Arg Glu Pro Gly Gln 500
505 510Asp Leu Val Val Leu Pro Leu Ser Ile Thr Thr Asp
Phe Ile Pro Ser 515 520 525Phe Arg
Leu Val Ala Tyr Tyr Thr Leu Ile Gly Ala Ser Gly Gln Arg 530
535 540Glu Val Val Ala Asp Ser Val Trp Val Asp Val
Lys Asp Ser Cys Val545 550 555
560Gly Ser Leu Val Val Lys Ser Gly Gln Ser Glu Asp Arg Gln Pro Val
565 570 575Pro Gly Gln Gln
Met Thr Leu Lys Ile Glu Gly Asp His Gly Ala Arg 580
585 590Val Val Leu Val Ala Val Asp Lys Gly Val Phe
Val Leu Asn Lys Lys 595 600 605Asn
Lys Leu Thr Gln Ser Lys Ile Trp Asp Val Val Glu Lys Ala Asp 610
615 620Ile Gly Cys Thr Pro Gly Ser Gly Lys Asp
Tyr Ala Gly Val Phe Ser625 630 635
640Asp Ala Gly Leu Thr Phe Thr Ser Ser Ser Gly Gln Gln Thr Ala
Gln 645 650 655Arg Ala Glu
Leu Gln Cys Pro Gln Pro Ala Ala Arg Arg Arg Arg Ser 660
665 670Val Gln Leu Thr Glu Lys Arg Met Asp Lys
Val Gly Lys Tyr Pro Lys 675 680
685Glu Leu Arg Lys Cys Cys Glu Asp Gly Met Arg Glu Asn Pro Met Arg 690
695 700Phe Ser Cys Gln Arg Arg Thr Arg
Phe Ile Ser Leu Gly Glu Ala Cys705 710
715 720Lys Lys Val Phe Leu Asp Cys Cys Asn Tyr Ile Thr
Glu Leu Arg Arg 725 730
735Gln His Ala Arg Ala Ser His Leu Gly Leu Ala Arg Ser Asn Leu Asp
740 745 750Glu Asp Ile Ile Ala Glu
Glu Asn Ile Val Ser Arg Ser Glu Phe Pro 755 760
765Glu Ser Trp Leu Trp Asn Val Glu Asp Leu Lys Glu Pro Pro
Lys Asn 770 775 780Gly Ile Ser Thr Lys
Leu Met Asn Ile Phe Leu Lys Asp Ser Ile Thr785 790
795 800Thr Trp Glu Ile Leu Ala Val Ser Met Ser
Asp Lys Lys Gly Ile Cys 805 810
815Val Ala Asp Pro Phe Glu Val Thr Val Met Gln Asp Phe Phe Ile Asp
820 825 830Leu Arg Leu Pro Tyr
Ser Val Val Arg Asn Glu Gln Val Glu Ile Arg 835
840 845Ala Val Leu Tyr Asn Tyr Arg Gln Asn Gln Glu Leu
Lys Val Arg Val 850 855 860Glu Leu Leu
His Asn Pro Ala Phe Cys Ser Leu Ala Thr Thr Lys Arg865
870 875 880Arg His Gln Gln Thr Val Thr
Ile Pro Pro Lys Ser Ser Leu Ser Val 885
890 895Pro Tyr Val Ile Val Pro Leu Lys Thr Gly Leu Gln
Glu Val Glu Val 900 905 910Lys
Ala Ala Val Tyr His His Phe Ile Ser Asp Gly Val Arg Lys Ser 915
920 925Leu Lys Val Val Pro Glu Gly Ile Arg
Met Asn Lys Thr Val Ala Val 930 935
940Arg Thr Leu Asp Pro Glu Arg Leu Gly Arg Glu Gly Val Gln Lys Glu945
950 955 960Asp Ile Pro Pro
Ala Asp Leu Ser Asp Gln Val Pro Asp Thr Glu Ser 965
970 975Glu Thr Arg Ile Leu Leu Gln Gly Thr Pro
Val Ala Gln Met Thr Glu 980 985
990Asp Ala Val Asp Ala Glu Arg Leu Lys His Leu Ile Val Thr Pro Ser
995 1000 1005Gly Cys Gly Glu Gln Asn
Met Ile Gly Met Thr Pro Thr Val Ile 1010 1015
1020Ala Val His Tyr Leu Asp Glu Thr Glu Gln Trp Glu Lys Phe
Gly 1025 1030 1035Leu Glu Lys Arg Gln
Gly Ala Leu Glu Leu Ile Lys Lys Gly Tyr 1040 1045
1050Thr Gln Gln Leu Ala Phe Arg Gln Pro Ser Ser Ala Phe
Ala Ala 1055 1060 1065Phe Val Lys Arg
Ala Pro Ser Thr Trp Leu Thr Ala Tyr Val Val 1070
1075 1080Lys Val Phe Ser Leu Ala Val Asn Leu Ile Ala
Ile Asp Ser Gln 1085 1090 1095Val Leu
Cys Gly Ala Val Lys Trp Leu Ile Leu Glu Lys Gln Lys 1100
1105 1110Pro Asp Gly Val Phe Gln Glu Asp Ala Pro
Val Ile His Gln Glu 1115 1120 1125Met
Ile Gly Gly Leu Arg Asn Asn Asn Glu Lys Asp Met Ala Leu 1130
1135 1140Thr Ala Phe Val Leu Ile Ser Leu Gln
Glu Ala Lys Asp Ile Cys 1145 1150
1155Glu Glu Gln Val Asn Ser Leu Pro Gly Ser Ile Thr Lys Ala Gly
1160 1165 1170Asp Phe Leu Glu Ala Asn
Tyr Met Asn Leu Gln Arg Ser Tyr Thr 1175 1180
1185Val Ala Ile Ala Gly Tyr Ala Leu Ala Gln Met Gly Arg Leu
Lys 1190 1195 1200Gly Pro Leu Leu Asn
Lys Phe Leu Thr Thr Ala Lys Asp Lys Asn 1205 1210
1215Arg Trp Glu Asp Pro Gly Lys Gln Leu Tyr Asn Val Glu
Ala Thr 1220 1225 1230Ser Tyr Ala Leu
Leu Ala Leu Leu Gln Leu Lys Asp Phe Asp Phe 1235
1240 1245Val Pro Pro Val Val Arg Trp Leu Asn Glu Gln
Arg Tyr Tyr Gly 1250 1255 1260Gly Gly
Tyr Gly Ser Thr Gln Ala Thr Phe Met Val Phe Gln Ala 1265
1270 1275Leu Ala Gln Tyr Gln Lys Asp Ala Pro Asp
His Gln Glu Leu Asn 1280 1285 1290Leu
Asp Val Ser Leu Gln Leu Pro Ser Arg Ser Ser Lys Ile Thr 1295
1300 1305His Arg Ile His Trp Glu Ser Ala Ser
Leu Leu Arg Ser Glu Glu 1310 1315
1320Thr Lys Glu Asn Glu Gly Phe Thr Val Thr Ala Glu Gly Lys Gly
1325 1330 1335Gln Gly Thr Leu Ser Val
Val Thr Met Tyr His Ala Lys Ala Lys 1340 1345
1350Asp Gln Leu Thr Cys Asn Lys Phe Asp Leu Lys Val Thr Ile
Lys 1355 1360 1365Pro Ala Pro Glu Thr
Glu Lys Arg Pro Gln Asp Ala Lys Asn Thr 1370 1375
1380Met Ile Leu Glu Ile Cys Thr Arg Tyr Arg Gly Asp Gln
Asp Ala 1385 1390 1395Thr Met Ser Ile
Leu Asp Ile Ser Met Met Thr Gly Phe Ala Pro 1400
1405 1410Asp Thr Asp Asp Leu Lys Gln Leu Ala Asn Gly
Val Asp Arg Tyr 1415 1420 1425Ile Ser
Lys Tyr Glu Leu Asp Lys Ala Phe Ser Asp Arg Asn Thr 1430
1435 1440Leu Ile Ile Tyr Leu Asp Lys Val Ser His
Ser Glu Asp Asp Cys 1445 1450 1455Leu
Ala Phe Lys Val His Gln Tyr Phe Asn Val Glu Leu Ile Gln 1460
1465 1470Pro Gly Ala Val Lys Val Tyr Ala Tyr
Tyr Asn Leu Glu Glu Ser 1475 1480
1485Cys Thr Arg Phe Tyr His Pro Glu Lys Glu Asp Gly Lys Leu Asn
1490 1495 1500Lys Leu Cys Arg Asp Glu
Leu Cys Arg Cys Ala Glu Glu Asn Cys 1505 1510
1515Phe Ile Gln Lys Ser Asp Asp Lys Val Thr Leu Glu Glu Arg
Leu 1520 1525 1530Asp Lys Ala Cys Glu
Pro Gly Val Asp Tyr Val Tyr Lys Thr Arg 1535 1540
1545Leu Val Lys Val Gln Leu Ser Asn Asp Phe Asp Glu Tyr
Ile Met 1550 1555 1560Ala Ile Glu Gln
Thr Ile Lys Ser Gly Ser Asp Glu Val Gln Val 1565
1570 1575Gly Gln Gln Arg Thr Phe Ile Ser Pro Ile Lys
Cys Arg Glu Ala 1580 1585 1590Leu Lys
Leu Glu Glu Lys Lys His Tyr Leu Met Trp Gly Leu Ser 1595
1600 1605Ser Asp Phe Trp Gly Glu Lys Pro Asn Leu
Ser Tyr Ile Ile Gly 1610 1615 1620Lys
Asp Thr Trp Val Glu His Trp Pro Glu Glu Asp Glu Cys Gln 1625
1630 1635Asp Glu Glu Asn Gln Lys Gln Cys Gln
Asp Leu Gly Ala Phe Thr 1640 1645
1650Glu Ser Met Val Val Phe Gly Cys Pro Asn 1655
16601101744PRTHomo sapiens 110Met Arg Leu Leu Trp Gly Leu Ile Trp Ala Ser
Ser Phe Phe Thr Leu1 5 10
15Ser Leu Gln Lys Pro Arg Leu Leu Leu Phe Ser Pro Ser Val Val His
20 25 30Leu Gly Val Pro Leu Ser Val
Gly Val Gln Leu Gln Asp Val Pro Arg 35 40
45Gly Gln Val Val Lys Gly Ser Val Phe Leu Arg Asn Pro Ser Arg
Asn 50 55 60Asn Val Pro Cys Ser Pro
Lys Val Asp Phe Thr Leu Ser Ser Glu Arg65 70
75 80Asp Phe Ala Leu Leu Ser Leu Gln Val Pro Leu
Lys Asp Ala Lys Ser 85 90
95Cys Gly Leu His Gln Leu Leu Arg Gly Pro Glu Val Gln Leu Val Ala
100 105 110His Ser Pro Trp Leu Lys
Asp Ser Leu Ser Arg Thr Thr Asn Ile Gln 115 120
125Gly Ile Asn Leu Leu Phe Ser Ser Arg Arg Gly His Leu Phe
Leu Gln 130 135 140Thr Asp Gln Pro Ile
Tyr Asn Pro Gly Gln Arg Val Arg Tyr Arg Val145 150
155 160Phe Ala Leu Asp Gln Lys Met Arg Pro Ser
Thr Asp Thr Ile Thr Val 165 170
175Met Val Glu Asn Ser His Gly Leu Arg Val Arg Lys Lys Glu Val Tyr
180 185 190Met Pro Ser Ser Ile
Phe Gln Asp Asp Phe Val Ile Pro Asp Ile Ser 195
200 205Glu Pro Gly Thr Trp Lys Ile Ser Ala Arg Phe Ser
Asp Gly Leu Glu 210 215 220Ser Asn Ser
Ser Thr Gln Phe Glu Val Lys Lys Tyr Val Leu Pro Asn225
230 235 240Phe Glu Val Lys Ile Thr Pro
Gly Lys Pro Tyr Ile Leu Thr Val Pro 245
250 255Gly His Leu Asp Glu Met Gln Leu Asp Ile Gln Ala
Arg Tyr Ile Tyr 260 265 270Gly
Lys Pro Val Gln Gly Val Ala Tyr Val Arg Phe Gly Leu Leu Asp 275
280 285Glu Asp Gly Lys Lys Thr Phe Phe Arg
Gly Leu Glu Ser Gln Thr Lys 290 295
300Leu Val Asn Gly Gln Ser His Ile Ser Leu Ser Lys Ala Glu Phe Gln305
310 315 320Asp Ala Leu Glu
Lys Leu Asn Met Gly Ile Thr Asp Leu Gln Gly Leu 325
330 335Arg Leu Tyr Val Ala Ala Ala Ile Ile Glu
Ser Pro Gly Gly Glu Met 340 345
350Glu Glu Ala Glu Leu Thr Ser Trp Tyr Phe Val Ser Ser Pro Phe Ser
355 360 365Leu Asp Leu Ser Lys Thr Lys
Arg His Leu Val Pro Gly Ala Pro Phe 370 375
380Leu Leu Gln Ala Leu Val Arg Glu Met Ser Gly Ser Pro Ala Ser
Gly385 390 395 400Ile Pro
Val Lys Val Ser Ala Thr Val Ser Ser Pro Gly Ser Val Pro
405 410 415Glu Val Gln Asp Ile Gln Gln
Asn Thr Asp Gly Ser Gly Gln Val Ser 420 425
430Ile Pro Ile Ile Ile Pro Gln Thr Ile Ser Glu Leu Gln Leu
Ser Val 435 440 445Ser Ala Gly Ser
Pro His Pro Ala Ile Ala Arg Leu Thr Val Ala Ala 450
455 460Pro Pro Ser Gly Gly Pro Gly Phe Leu Ser Ile Glu
Arg Pro Asp Ser465 470 475
480Arg Pro Pro Arg Val Gly Asp Thr Leu Asn Leu Asn Leu Arg Ala Val
485 490 495Gly Ser Gly Ala Thr
Phe Ser His Tyr Tyr Tyr Met Ile Leu Ser Arg 500
505 510Gly Gln Ile Val Phe Met Asn Arg Glu Pro Lys Arg
Thr Leu Thr Ser 515 520 525Val Ser
Val Phe Val Asp His His Leu Ala Pro Ser Phe Tyr Phe Val 530
535 540Ala Phe Tyr Tyr His Gly Asp His Pro Val Ala
Asn Ser Leu Arg Val545 550 555
560Asp Val Gln Ala Gly Ala Cys Glu Gly Lys Leu Glu Leu Ser Val Asp
565 570 575Gly Ala Lys Gln
Tyr Arg Asn Gly Glu Ser Val Lys Leu His Leu Glu 580
585 590Thr Asp Ser Leu Ala Leu Val Ala Leu Gly Ala
Leu Asp Thr Ala Leu 595 600 605Tyr
Ala Ala Gly Ser Lys Ser His Lys Pro Leu Asn Met Gly Lys Val 610
615 620Phe Glu Ala Met Asn Ser Tyr Asp Leu Gly
Cys Gly Pro Gly Gly Gly625 630 635
640Asp Ser Ala Leu Gln Val Phe Gln Ala Ala Gly Leu Ala Phe Ser
Asp 645 650 655Gly Asp Gln
Trp Thr Leu Ser Arg Lys Arg Leu Ser Cys Pro Lys Glu 660
665 670Lys Thr Thr Arg Lys Lys Arg Asn Val Asn
Phe Gln Lys Ala Ile Asn 675 680
685Glu Lys Leu Gly Gln Tyr Ala Ser Pro Thr Ala Lys Arg Cys Cys Gln 690
695 700Asp Gly Val Thr Arg Leu Pro Met
Met Arg Ser Cys Glu Gln Arg Ala705 710
715 720Ala Arg Val Gln Gln Pro Asp Cys Arg Glu Pro Phe
Leu Ser Cys Cys 725 730
735Gln Phe Ala Glu Ser Leu Arg Lys Lys Ser Arg Asp Lys Gly Gln Ala
740 745 750Gly Leu Gln Arg Ala Leu
Glu Ile Leu Gln Glu Glu Asp Leu Ile Asp 755 760
765Glu Asp Asp Ile Pro Val Arg Ser Phe Phe Pro Glu Asn Trp
Leu Trp 770 775 780Arg Val Glu Thr Val
Asp Arg Phe Gln Ile Leu Thr Leu Trp Leu Pro785 790
795 800Asp Ser Leu Thr Thr Trp Glu Ile His Gly
Leu Ser Leu Ser Lys Thr 805 810
815Lys Gly Leu Cys Val Ala Thr Pro Val Gln Leu Arg Val Phe Arg Glu
820 825 830Phe His Leu His Leu
Arg Leu Pro Met Ser Val Arg Arg Phe Glu Gln 835
840 845Leu Glu Leu Arg Pro Val Leu Tyr Asn Tyr Leu Asp
Lys Asn Leu Thr 850 855 860Val Ser Val
His Val Ser Pro Val Glu Gly Leu Cys Leu Ala Gly Gly865
870 875 880Gly Gly Leu Ala Gln Gln Val
Leu Val Pro Ala Gly Ser Ala Arg Pro 885
890 895Val Ala Phe Ser Val Val Pro Thr Ala Ala Ala Ala
Val Ser Leu Lys 900 905 910Val
Val Ala Arg Gly Ser Phe Glu Phe Pro Val Gly Asp Ala Val Ser 915
920 925Lys Val Leu Gln Ile Glu Lys Glu Gly
Ala Ile His Arg Glu Glu Leu 930 935
940Val Tyr Glu Leu Asn Pro Leu Asp His Arg Gly Arg Thr Leu Glu Ile945
950 955 960Pro Gly Asn Ser
Asp Pro Asn Met Ile Pro Asp Gly Asp Phe Asn Ser 965
970 975Tyr Val Arg Val Thr Ala Ser Asp Pro Leu
Asp Thr Leu Gly Ser Glu 980 985
990Gly Ala Leu Ser Pro Gly Gly Val Ala Ser Leu Leu Arg Leu Pro Arg
995 1000 1005Gly Cys Gly Glu Gln Thr
Met Ile Tyr Leu Ala Pro Thr Leu Ala 1010 1015
1020Ala Ser Arg Tyr Leu Asp Lys Thr Glu Gln Trp Ser Thr Leu
Pro 1025 1030 1035Pro Glu Thr Lys Asp
His Ala Val Asp Leu Ile Gln Lys Gly Tyr 1040 1045
1050Met Arg Ile Gln Gln Phe Arg Lys Ala Asp Gly Ser Tyr
Ala Ala 1055 1060 1065Trp Leu Ser Arg
Asp Ser Ser Thr Trp Leu Thr Ala Phe Val Leu 1070
1075 1080Lys Val Leu Ser Leu Ala Gln Glu Gln Val Gly
Gly Ser Pro Glu 1085 1090 1095Lys Leu
Gln Glu Thr Ser Asn Trp Leu Leu Ser Gln Gln Gln Ala 1100
1105 1110Asp Gly Ser Phe Gln Asp Pro Cys Pro Val
Leu Asp Arg Ser Met 1115 1120 1125Gln
Gly Gly Leu Val Gly Asn Asp Glu Thr Val Ala Leu Thr Ala 1130
1135 1140Phe Val Thr Ile Ala Leu His His Gly
Leu Ala Val Phe Gln Asp 1145 1150
1155Glu Gly Ala Glu Pro Leu Lys Gln Arg Val Glu Ala Ser Ile Ser
1160 1165 1170Lys Ala Asn Ser Phe Leu
Gly Glu Lys Ala Ser Ala Gly Leu Leu 1175 1180
1185Gly Ala His Ala Ala Ala Ile Thr Ala Tyr Ala Leu Ser Leu
Thr 1190 1195 1200Lys Ala Pro Val Asp
Leu Leu Gly Val Ala His Asn Asn Leu Met 1205 1210
1215Ala Met Ala Gln Glu Thr Gly Asp Asn Leu Tyr Trp Gly
Ser Val 1220 1225 1230Thr Gly Ser Gln
Ser Asn Ala Val Ser Pro Thr Pro Ala Pro Arg 1235
1240 1245Asn Pro Ser Asp Pro Met Pro Gln Ala Pro Ala
Leu Trp Ile Glu 1250 1255 1260Thr Thr
Ala Tyr Ala Leu Leu His Leu Leu Leu His Glu Gly Lys 1265
1270 1275Ala Glu Met Ala Asp Gln Ala Ser Ala Trp
Leu Thr Arg Gln Gly 1280 1285 1290Ser
Phe Gln Gly Gly Phe Arg Ser Thr Gln Asp Thr Val Ile Ala 1295
1300 1305Leu Asp Ala Leu Ser Ala Tyr Trp Ile
Ala Ser His Thr Thr Glu 1310 1315
1320Glu Arg Gly Leu Asn Val Thr Leu Ser Ser Thr Gly Arg Asn Gly
1325 1330 1335Phe Lys Ser His Ala Leu
Gln Leu Asn Asn Arg Gln Ile Arg Gly 1340 1345
1350Leu Glu Glu Glu Leu Gln Phe Ser Leu Gly Ser Lys Ile Asn
Val 1355 1360 1365Lys Val Gly Gly Asn
Ser Lys Gly Thr Leu Lys Val Leu Arg Thr 1370 1375
1380Tyr Asn Val Leu Asp Met Lys Asn Thr Thr Cys Gln Asp
Leu Gln 1385 1390 1395Ile Glu Val Thr
Val Lys Gly His Val Glu Tyr Thr Met Glu Ala 1400
1405 1410Asn Glu Asp Tyr Glu Asp Tyr Glu Tyr Asp Glu
Leu Pro Ala Lys 1415 1420 1425Asp Asp
Pro Asp Ala Pro Leu Gln Pro Val Thr Pro Leu Gln Leu 1430
1435 1440Phe Glu Gly Arg Arg Asn Arg Arg Arg Arg
Glu Ala Pro Lys Val 1445 1450 1455Val
Glu Glu Gln Glu Ser Arg Val His Tyr Thr Val Cys Ile Trp 1460
1465 1470Arg Asn Gly Lys Val Gly Leu Ser Gly
Met Ala Ile Ala Asp Val 1475 1480
1485Thr Leu Leu Ser Gly Phe His Ala Leu Arg Ala Asp Leu Glu Lys
1490 1495 1500Leu Thr Ser Leu Ser Asp
Arg Tyr Val Ser His Phe Glu Thr Glu 1505 1510
1515Gly Pro His Val Leu Leu Tyr Phe Asp Ser Val Pro Thr Ser
Arg 1520 1525 1530Glu Cys Val Gly Phe
Glu Ala Val Gln Glu Val Pro Val Gly Leu 1535 1540
1545Val Gln Pro Ala Ser Ala Thr Leu Tyr Asp Tyr Tyr Asn
Pro Glu 1550 1555 1560Arg Arg Cys Ser
Val Phe Tyr Gly Ala Pro Ser Lys Ser Arg Leu 1565
1570 1575Leu Ala Thr Leu Cys Ser Ala Glu Val Cys Gln
Cys Ala Glu Gly 1580 1585 1590Lys Cys
Pro Arg Gln Arg Arg Ala Leu Glu Arg Gly Leu Gln Asp 1595
1600 1605Glu Asp Gly Tyr Arg Met Lys Phe Ala Cys
Tyr Tyr Pro Arg Val 1610 1615 1620Glu
Tyr Gly Phe Gln Val Lys Val Leu Arg Glu Asp Ser Arg Ala 1625
1630 1635Ala Phe Arg Leu Phe Glu Thr Lys Ile
Thr Gln Val Leu His Phe 1640 1645
1650Thr Lys Asp Val Lys Ala Ala Ala Asn Gln Met Arg Asn Phe Leu
1655 1660 1665Val Arg Ala Ser Cys Arg
Leu Arg Leu Glu Pro Gly Lys Glu Tyr 1670 1675
1680Leu Ile Met Gly Leu Asp Gly Ala Thr Tyr Asp Leu Glu Gly
His 1685 1690 1695Pro Gln Tyr Leu Leu
Asp Ser Asn Ser Trp Ile Glu Glu Met Pro 1700 1705
1710Ser Glu Arg Leu Cys Arg Ser Thr Arg Gln Arg Ala Ala
Cys Ala 1715 1720 1725Gln Leu Asn Asp
Phe Leu Gln Glu Tyr Gly Thr Gln Gly Cys Gln 1730
1735 1740Val111930PRTHomo sapiens 111Met Lys Pro Pro Arg
Pro Val Arg Thr Cys Ser Lys Val Leu Val Leu1 5
10 15Leu Ser Leu Leu Ala Ile His Gln Thr Thr Thr
Ala Glu Lys Asn Gly 20 25
30Ile Asp Ile Tyr Ser Leu Thr Val Asp Ser Arg Val Ser Ser Arg Phe
35 40 45Ala His Thr Val Val Thr Ser Arg
Val Val Asn Arg Ala Asn Thr Val 50 55
60Gln Glu Ala Thr Phe Gln Met Glu Leu Pro Lys Lys Ala Phe Ile Thr65
70 75 80Asn Phe Ser Met Asn
Ile Asp Gly Met Thr Tyr Pro Gly Ile Ile Lys 85
90 95Glu Lys Ala Glu Ala Gln Ala Gln Tyr Ser Ala
Ala Val Ala Lys Gly 100 105
110Lys Ser Ala Gly Leu Val Lys Ala Thr Gly Arg Asn Met Glu Gln Phe
115 120 125Gln Val Ser Val Ser Val Ala
Pro Asn Ala Lys Ile Thr Phe Glu Leu 130 135
140Val Tyr Glu Glu Leu Leu Lys Arg Arg Leu Gly Val Tyr Glu Leu
Leu145 150 155 160Leu Lys
Val Arg Pro Gln Gln Leu Val Lys His Leu Gln Met Asp Ile
165 170 175His Ile Phe Glu Pro Gln Gly
Ile Ser Phe Leu Glu Thr Glu Ser Thr 180 185
190Phe Met Thr Asn Gln Leu Val Asp Ala Leu Thr Thr Trp Gln
Asn Lys 195 200 205Thr Lys Ala His
Ile Arg Phe Lys Pro Thr Leu Ser Gln Gln Gln Lys 210
215 220Ser Pro Glu Gln Gln Glu Thr Val Leu Asp Gly Asn
Leu Ile Ile Arg225 230 235
240Tyr Asp Val Asp Arg Ala Ile Ser Gly Gly Ser Ile Gln Ile Glu Asn
245 250 255Gly Tyr Phe Val His
Tyr Phe Ala Pro Glu Gly Leu Thr Thr Met Pro 260
265 270Lys Asn Val Val Phe Val Ile Asp Lys Ser Gly Ser
Met Ser Gly Arg 275 280 285Lys Ile
Gln Gln Thr Arg Glu Ala Leu Ile Lys Ile Leu Asp Asp Leu 290
295 300Ser Pro Arg Asp Gln Phe Asn Leu Ile Val Phe
Ser Thr Glu Ala Thr305 310 315
320Gln Trp Arg Pro Ser Leu Val Pro Ala Ser Ala Glu Asn Val Asn Lys
325 330 335Ala Arg Ser Phe
Ala Ala Gly Ile Gln Ala Leu Gly Gly Thr Asn Ile 340
345 350Asn Asp Ala Met Leu Met Ala Val Gln Leu Leu
Asp Ser Ser Asn Gln 355 360 365Glu
Glu Arg Leu Pro Glu Gly Ser Val Ser Leu Ile Ile Leu Leu Thr 370
375 380Asp Gly Asp Pro Thr Val Gly Glu Thr Asn
Pro Arg Ser Ile Gln Asn385 390 395
400Asn Val Arg Glu Ala Val Ser Gly Arg Tyr Ser Leu Phe Cys Leu
Gly 405 410 415Phe Gly Phe
Asp Val Ser Tyr Ala Phe Leu Glu Lys Leu Ala Leu Asp 420
425 430Asn Gly Gly Leu Ala Arg Arg Ile His Glu
Asp Ser Asp Ser Ala Leu 435 440
445Gln Leu Gln Asp Phe Tyr Gln Glu Val Ala Asn Pro Leu Leu Thr Ala 450
455 460Val Thr Phe Glu Tyr Pro Ser Asn
Ala Val Glu Glu Val Thr Gln Asn465 470
475 480Asn Phe Arg Leu Leu Phe Lys Gly Ser Glu Met Val
Val Ala Gly Lys 485 490
495Leu Gln Asp Arg Gly Pro Asp Val Leu Thr Ala Thr Val Ser Gly Lys
500 505 510Leu Pro Thr Gln Asn Ile
Thr Phe Gln Thr Glu Ser Ser Val Ala Glu 515 520
525Gln Glu Ala Glu Phe Gln Ser Pro Lys Tyr Ile Phe His Asn
Phe Met 530 535 540Glu Arg Leu Trp Ala
Tyr Leu Thr Ile Gln Gln Leu Leu Glu Gln Thr545 550
555 560Val Ser Ala Ser Asp Ala Asp Gln Gln Ala
Leu Arg Asn Gln Ala Leu 565 570
575Asn Leu Ser Leu Ala Tyr Ser Phe Val Thr Pro Leu Thr Ser Met Val
580 585 590Val Thr Lys Pro Asp
Asp Gln Glu Gln Ser Gln Val Ala Glu Lys Pro 595
600 605Met Glu Gly Glu Ser Arg Asn Arg Asn Val His Ser
Gly Ser Thr Phe 610 615 620Phe Lys Tyr
Tyr Leu Gln Gly Ala Lys Ile Pro Lys Pro Glu Ala Ser625
630 635 640Phe Ser Pro Arg Arg Gly Trp
Asn Arg Gln Ala Gly Ala Ala Gly Ser 645
650 655Arg Met Asn Phe Arg Pro Gly Val Leu Ser Ser Arg
Gln Leu Gly Leu 660 665 670Pro
Gly Pro Pro Asp Val Pro Asp His Ala Ala Tyr His Pro Phe Arg 675
680 685Arg Leu Ala Ile Leu Pro Ala Ser Ala
Pro Pro Ala Thr Ser Asn Pro 690 695
700Asp Pro Ala Val Ser Arg Val Met Asn Met Lys Ile Glu Glu Thr Thr705
710 715 720Met Thr Thr Gln
Thr Pro Ala Pro Ile Gln Ala Pro Ser Ala Ile Leu 725
730 735Pro Leu Pro Gly Gln Ser Val Glu Arg Leu
Cys Val Asp Pro Arg His 740 745
750Arg Gln Gly Pro Val Asn Leu Leu Ser Asp Pro Glu Gln Gly Val Glu
755 760 765Val Thr Gly Gln Tyr Glu Arg
Glu Lys Ala Gly Phe Ser Trp Ile Glu 770 775
780Val Thr Phe Lys Asn Pro Leu Val Trp Val His Ala Ser Pro Glu
His785 790 795 800Val Val
Val Thr Arg Asn Arg Arg Ser Ser Ala Tyr Lys Trp Lys Glu
805 810 815Thr Leu Phe Ser Val Met Pro
Gly Leu Lys Met Thr Met Asp Lys Thr 820 825
830Gly Leu Leu Leu Leu Ser Asp Pro Asp Lys Val Thr Ile Gly
Leu Leu 835 840 845Phe Trp Asp Gly
Arg Gly Glu Gly Leu Arg Leu Leu Leu Arg Asp Thr 850
855 860Asp Arg Phe Ser Ser His Val Gly Gly Thr Leu Gly
Gln Phe Tyr Gln865 870 875
880Glu Val Leu Trp Gly Ser Pro Ala Ala Ser Asp Asp Gly Arg Arg Thr
885 890 895Leu Arg Val Gln Gly
Asn Asp His Ser Ala Thr Arg Glu Arg Arg Leu 900
905 910Asp Tyr Gln Glu Gly Pro Pro Gly Val Glu Ile Ser
Cys Trp Ser Val 915 920 925Glu Leu
930112644PRTHomo sapiens 112Met Pro Lys Asn Val Val Phe Val Ile Asp
Lys Ser Gly Ser Met Ser1 5 10
15Gly Arg Lys Ile Gln Gln Thr Arg Glu Ala Leu Ile Lys Ile Leu Asp
20 25 30Asp Leu Ser Pro Arg Asp
Gln Phe Asn Leu Ile Val Phe Ser Thr Glu 35 40
45Ala Thr Gln Trp Arg Pro Ser Leu Val Pro Ala Ser Ala Glu
Asn Val 50 55 60Asn Lys Ala Arg Ser
Phe Ala Ala Gly Ile Gln Ala Leu Gly Gly Thr65 70
75 80Asn Ile Asn Asp Ala Met Leu Met Ala Val
Gln Leu Leu Asp Ser Ser 85 90
95Asn Gln Glu Glu Arg Leu Pro Glu Gly Ser Val Ser Leu Ile Ile Leu
100 105 110Leu Thr Asp Gly Asp
Pro Thr Val Gly Glu Thr Asn Pro Arg Ser Ile 115
120 125Gln Asn Asn Val Arg Glu Ala Val Ser Gly Arg Tyr
Ser Leu Phe Cys 130 135 140Leu Gly Phe
Gly Phe Asp Val Ser Tyr Ala Phe Leu Glu Lys Leu Ala145
150 155 160Leu Asp Asn Gly Gly Leu Ala
Arg Arg Ile His Glu Asp Ser Asp Ser 165
170 175Ala Leu Gln Leu Gln Asp Phe Tyr Gln Glu Val Ala
Asn Pro Leu Leu 180 185 190Thr
Ala Val Thr Phe Glu Tyr Pro Ser Asn Ala Val Glu Glu Val Thr 195
200 205Gln Asn Asn Phe Arg Leu Leu Phe Lys
Gly Ser Glu Met Val Val Ala 210 215
220Gly Lys Leu Gln Asp Arg Gly Pro Asp Val Leu Thr Ala Thr Val Ser225
230 235 240Gly Lys Leu Pro
Thr Gln Asn Ile Thr Phe Gln Thr Glu Ser Ser Val 245
250 255Ala Glu Gln Glu Ala Glu Phe Gln Ser Pro
Lys Tyr Ile Phe His Asn 260 265
270Phe Met Glu Arg Leu Trp Ala Tyr Leu Thr Ile Gln Gln Leu Leu Glu
275 280 285Gln Thr Val Ser Ala Ser Asp
Ala Asp Gln Gln Ala Leu Arg Asn Gln 290 295
300Ala Leu Asn Leu Ser Leu Ala Tyr Ser Phe Val Thr Pro Leu Thr
Ser305 310 315 320Met Val
Val Thr Lys Pro Asp Asp Gln Glu Gln Ser Gln Val Ala Glu
325 330 335Lys Pro Met Glu Gly Glu Ser
Arg Asn Arg Asn Val His Ser Ala Gly 340 345
350Ala Ala Gly Ser Arg Met Asn Phe Arg Pro Gly Val Leu Ser
Ser Arg 355 360 365Gln Leu Gly Leu
Pro Gly Pro Pro Asp Val Pro Asp His Ala Ala Tyr 370
375 380His Pro Phe Arg Arg Leu Ala Ile Leu Pro Ala Ser
Ala Pro Pro Ala385 390 395
400Thr Ser Asn Pro Asp Pro Ala Val Ser Arg Val Met Asn Met Lys Ile
405 410 415Glu Glu Thr Thr Met
Thr Thr Gln Thr Pro Ala Cys Pro Ser Cys Ser 420
425 430Arg Ser Arg Ala Pro Ala Val Pro Ala Pro Ile Gln
Ala Pro Ser Ala 435 440 445Ile Leu
Pro Leu Pro Gly Gln Ser Val Glu Arg Leu Cys Val Asp Pro 450
455 460Arg His Arg Gln Gly Pro Val Asn Leu Leu Ser
Asp Pro Glu Gln Gly465 470 475
480Val Glu Val Thr Gly Gln Tyr Glu Arg Glu Lys Ala Gly Phe Ser Trp
485 490 495Ile Glu Val Thr
Phe Lys Asn Pro Leu Val Trp Val His Ala Ser Pro 500
505 510Glu His Val Val Val Thr Arg Asn Arg Arg Ser
Ser Ala Tyr Lys Trp 515 520 525Lys
Glu Thr Leu Phe Ser Val Met Pro Gly Leu Lys Met Thr Met Asp 530
535 540Lys Thr Gly Leu Leu Leu Leu Ser Asp Pro
Asp Lys Val Thr Ile Gly545 550 555
560Leu Leu Phe Trp Asp Gly Arg Gly Glu Gly Leu Arg Leu Leu Leu
Arg 565 570 575Asp Thr Asp
Arg Phe Ser Ser His Val Gly Gly Thr Leu Gly Gln Phe 580
585 590Tyr Gln Glu Val Leu Trp Gly Ser Pro Ala
Ala Ser Asp Asp Gly Arg 595 600
605Arg Thr Leu Arg Val Gln Gly Asn Asp His Ser Ala Thr Arg Glu Arg 610
615 620Arg Leu Asp Tyr Gln Glu Gly Pro
Pro Gly Val Glu Ile Ser Cys Trp625 630
635 640Ser Val Glu Leu113267PRTHomo sapiens 113Met Lys
Ala Ala Val Leu Thr Leu Ala Val Leu Phe Leu Thr Gly Ser1 5
10 15Gln Ala Arg His Phe Trp Gln Gln
Asp Glu Pro Pro Gln Ser Pro Trp 20 25
30Asp Arg Val Lys Asp Leu Ala Thr Val Tyr Val Asp Val Leu Lys
Asp 35 40 45Ser Gly Arg Asp Tyr
Val Ser Gln Phe Glu Gly Ser Ala Leu Gly Lys 50 55
60Gln Leu Asn Leu Lys Leu Leu Asp Asn Trp Asp Ser Val Thr
Ser Thr65 70 75 80Phe
Ser Lys Leu Arg Glu Gln Leu Gly Pro Val Thr Gln Glu Phe Trp
85 90 95Asp Asn Leu Glu Lys Glu Thr
Glu Gly Leu Arg Gln Glu Met Ser Lys 100 105
110Asp Leu Glu Glu Val Lys Ala Lys Val Gln Pro Tyr Leu Asp
Asp Phe 115 120 125Gln Lys Lys Trp
Gln Glu Glu Met Glu Leu Tyr Arg Gln Lys Val Glu 130
135 140Pro Leu Arg Ala Glu Leu Gly Glu Gly Ala Arg Gln
Lys Leu His Glu145 150 155
160Leu Gln Glu Lys Leu Ser Pro Leu Gly Glu Glu Met Arg Asp Arg Ala
165 170 175Arg Ala His Val Asp
Ala Leu Arg Thr His Leu Ala Pro Tyr Ser Asp 180
185 190Glu Leu Arg Gln Arg Leu Ala Ala Arg Leu Glu Ala
Leu Lys Glu Asn 195 200 205Gly Gly
Ala Arg Leu Ala Glu Tyr His Ala Lys Ala Thr Glu His Leu 210
215 220Ser Thr Leu Ser Glu Lys Ala Lys Pro Ala Leu
Glu Asp Leu Arg Gln225 230 235
240Gly Leu Leu Pro Val Leu Glu Ser Phe Lys Val Ser Phe Leu Ser Ala
245 250 255Leu Glu Glu Tyr
Thr Lys Lys Leu Asn Thr Gln 260
265114396PRTHomo sapiens 114Met Phe Leu Lys Ala Val Val Leu Thr Leu Ala
Leu Val Ala Val Ala1 5 10
15Gly Ala Arg Ala Glu Val Ser Ala Asp Gln Val Ala Thr Val Met Trp
20 25 30Asp Tyr Phe Ser Gln Leu Ser
Asn Asn Ala Lys Glu Ala Val Glu His 35 40
45Leu Gln Lys Ser Glu Leu Thr Gln Gln Leu Asn Ala Leu Phe Gln
Asp 50 55 60Lys Leu Gly Glu Val Asn
Thr Tyr Ala Gly Asp Leu Gln Lys Lys Leu65 70
75 80Val Pro Phe Ala Thr Glu Leu His Glu Arg Leu
Ala Lys Asp Ser Glu 85 90
95Lys Leu Lys Glu Glu Ile Gly Lys Glu Leu Glu Glu Leu Arg Ala Arg
100 105 110Leu Leu Pro His Ala Asn
Glu Val Ser Gln Lys Ile Gly Asp Asn Leu 115 120
125Arg Glu Leu Gln Gln Arg Leu Glu Pro Tyr Ala Asp Gln Leu
Arg Thr 130 135 140Gln Val Asn Thr Gln
Ala Glu Gln Leu Arg Arg Gln Leu Thr Pro Tyr145 150
155 160Ala Gln Arg Met Glu Arg Val Leu Arg Glu
Asn Ala Asp Ser Leu Gln 165 170
175Ala Ser Leu Arg Pro His Ala Asp Glu Leu Lys Ala Lys Ile Asp Gln
180 185 190Asn Val Glu Glu Leu
Lys Gly Arg Leu Thr Pro Tyr Ala Asp Glu Phe 195
200 205Lys Val Lys Ile Asp Gln Thr Val Glu Glu Leu Arg
Arg Ser Leu Ala 210 215 220Pro Tyr Ala
Gln Asp Thr Gln Glu Lys Leu Asn His Gln Leu Glu Gly225
230 235 240Leu Thr Phe Gln Met Lys Lys
Asn Ala Glu Glu Leu Lys Ala Arg Ile 245
250 255Ser Ala Ser Ala Glu Glu Leu Arg Gln Arg Leu Ala
Pro Leu Ala Glu 260 265 270Asp
Val Arg Gly Asn Leu Lys Gly Asn Thr Glu Gly Leu Gln Lys Ser 275
280 285Leu Ala Glu Leu Gly Gly His Leu Asp
Gln Gln Val Glu Glu Phe Arg 290 295
300Arg Arg Val Glu Pro Tyr Gly Glu Asn Phe Asn Lys Ala Leu Val Gln305
310 315 320Gln Met Glu Gln
Leu Arg Gln Lys Leu Gly Pro His Ala Gly Asp Val 325
330 335Glu Gly His Leu Ser Phe Leu Glu Lys Asp
Leu Arg Asp Lys Val Asn 340 345
350Ser Phe Phe Ser Thr Phe Lys Glu Lys Glu Ser Gln Asp Lys Thr Leu
355 360 365Ser Leu Pro Glu Leu Glu Gln
Gln Gln Glu Gln Gln Gln Glu Gln Gln 370 375
380Gln Glu Gln Val Gln Met Leu Ala Pro Glu Leu Ser385
390 395115317PRTHomo sapiens 115Met Lys Val Leu Trp Ala
Ala Leu Leu Val Thr Phe Leu Ala Gly Cys1 5
10 15Gln Ala Lys Val Glu Gln Ala Val Glu Thr Glu Pro
Glu Pro Glu Leu 20 25 30Arg
Gln Gln Thr Glu Trp Gln Ser Gly Gln Arg Trp Glu Leu Ala Leu 35
40 45Gly Arg Phe Trp Asp Tyr Leu Arg Trp
Val Gln Thr Leu Ser Glu Gln 50 55
60Val Gln Glu Glu Leu Leu Ser Ser Gln Val Thr Gln Glu Leu Arg Ala65
70 75 80Leu Met Asp Glu Thr
Met Lys Glu Leu Lys Ala Tyr Lys Ser Glu Leu 85
90 95Glu Glu Gln Leu Thr Pro Val Ala Glu Glu Thr
Arg Ala Arg Leu Ser 100 105
110Lys Glu Leu Gln Ala Ala Gln Ala Arg Leu Gly Ala Asp Met Glu Asp
115 120 125Val Cys Gly Arg Leu Val Gln
Tyr Arg Gly Glu Val Gln Ala Met Leu 130 135
140Gly Gln Ser Thr Glu Glu Leu Arg Val Arg Leu Ala Ser His Leu
Arg145 150 155 160Lys Leu
Arg Lys Arg Leu Leu Arg Asp Ala Asp Asp Leu Gln Lys Arg
165 170 175Leu Ala Val Tyr Gln Ala Gly
Ala Arg Glu Gly Ala Glu Arg Gly Leu 180 185
190Ser Ala Ile Arg Glu Arg Leu Gly Pro Leu Val Glu Gln Gly
Arg Val 195 200 205Arg Ala Ala Thr
Val Gly Ser Leu Ala Gly Gln Pro Leu Gln Glu Arg 210
215 220Ala Gln Ala Trp Gly Glu Arg Leu Arg Ala Arg Met
Glu Glu Met Gly225 230 235
240Ser Arg Thr Arg Asp Arg Leu Asp Glu Val Lys Glu Gln Val Ala Glu
245 250 255Val Arg Ala Lys Leu
Glu Glu Gln Ala Gln Gln Ile Arg Leu Gln Ala 260
265 270Glu Ala Phe Gln Ala Arg Leu Lys Ser Trp Phe Glu
Pro Leu Val Glu 275 280 285Asp Met
Gln Arg Gln Trp Ala Gly Leu Val Glu Lys Val Gln Ala Ala 290
295 300Val Gly Thr Ser Ala Ala Pro Val Pro Ser Asp
Asn His305 310 31511616PRTHomo sapiens
116Ala Asp Ser Gly Glu Gly Asp Phe Leu Ala Glu Gly Gly Gly Val Arg1
5 10 1511716PRTHomo sapiens
117Ala Asp Ser Gly Glu Gly Asp Phe Leu Ala Glu Gly Gly Gly Val Arg1
5 10 1511816PRTHomo sapiens
118Ala Asp Ser Gly Glu Gly Asp Phe Leu Ala Glu Gly Gly Gly Val Arg1
5 10 1511930PRTHomo sapiens
119Lys Ser Ser Ser Tyr Ser Lys Gln Phe Thr Ser Ser Thr Ser Tyr Asn1
5 10 15Arg Gly Asp Ser Thr Phe
Glu Ser Lys Ser Tyr Lys Met Ala 20 25
3012029PRTHomo sapiens 120Lys Ser Ser Ser Tyr Ser Lys Gln Phe
Thr Ser Ser Thr Ser Tyr Asn1 5 10
15Arg Gly Asp Ser Thr Phe Glu Ser Lys Ser Tyr Lys Met
20 2512127PRTHomo sapiens 121Lys Ser Ser Ser Tyr Ser Lys
Gln Phe Thr Ser Ser Thr Ser Tyr Asn1 5 10
15Arg Gly Asp Ser Thr Phe Glu Ser Lys Ser Tyr
20 2512226PRTHomo sapiens 122Lys Ser Ser Ser Tyr Ser Lys
Gln Phe Thr Ser Ser Thr Ser Tyr Asn1 5 10
15Arg Gly Asp Ser Thr Phe Glu Ser Lys Ser 20
2512324PRTHomo sapiens 123Lys Ser Ser Ser Tyr Ser Lys Gln
Phe Thr Ser Ser Thr Ser Tyr Asn1 5 10
15Arg Gly Asp Ser Thr Phe Glu Ser 2012429PRTHomo
sapiens 124Arg Gly Ser Glu Ser Gly Ile Phe Thr Asn Thr Lys Glu Ser Ser
Ser1 5 10 15His His Pro
Gly Ile Ala Glu Phe Pro Ser Arg Gly Lys 20
2512531PRTHomo sapiens 125Ser Tyr Lys Met Ala Asp Glu Ala Gly Ser Glu Ala
Asp His Glu Gly1 5 10
15Thr His Ser Thr Lys Arg Gly His Ala Lys Ser Arg Pro Val Arg
20 25 3012626PRTHomo sapiens 126Asp Glu
Ala Gly Ser Glu Ala Asp His Glu Gly Thr His Ser Thr Lys1 5
10 15Arg Gly His Ala Lys Ser Arg Pro
Val Arg 20 2512717PRTHomo sapiens 127Ser Ser
Lys Ile Thr His Arg Ile His Trp Glu Ser Ala Ser Leu Leu1 5
10 15Arg12811PRTHomo sapiens 128His Arg
Ile His Trp Glu Ser Ala Ser Leu Leu1 5
1012918PRTHomo sapiens 129Ser Ser Lys Ile Thr His Arg Ile His Val Ile Glu
Ser Ala Ser Leu1 5 10
15Leu Arg13011PRTHomo sapiens 130Asn Gly Phe Lys Ser His Ala Leu Gln Leu
Asn1 5 1013114PRTHomo sapiens 131Gly Pro
Pro Asp Val Pro Asp His Ala Ala Tyr His Pro Phe1 5
1013215PRTHomo sapiens 132Pro Gly Pro Pro Asp Val Pro Asp His
Ala Ala Tyr His Pro Phe1 5 10
1513329PRTHomo sapiens 133Met Phe Arg Pro Gly Val Leu Ser Ser Arg
Gln Leu Gly Leu Pro Gly1 5 10
15Pro Pro Asp Val Pro Asp His Ala Ala Tyr His Pro Phe 20
2513412PRTHomo sapiens 134Arg Pro His Phe Phe Phe Pro Lys
Ser Arg Ile Val1 5 1013530PRTHomo sapiens
135Ser Tyr Lys Met Ala Asp Glu Ala Gly Ser Glu Ala Asp His Glu Gly1
5 10 15Thr His Ser Thr Lys Arg
Gly His Ala Lys Ser Arg Pro Val 20 25
3013630PRTHomo sapiens 136Gly Leu Glu Glu Glu Leu Gln Phe Ser
Leu Gly Ser Lys Ile Asn Val1 5 10
15Lys Val Gly Gly Asn Ser Lys Gly Thr Leu Lys Val Leu Arg
20 25 3013727PRTHomo sapiens 137Pro
Gly Val Leu Ser Ser Arg Gln Leu Gly Leu Pro Gly Pro Pro Asp1
5 10 15Val Pro Asp His Ala Ala Tyr
His Pro Phe Arg 20 2513826PRTHomo sapiens
138Gly Val Leu Ser Ser Arg Gln Leu Gly Leu Pro Gly Pro Pro Asp Val1
5 10 15Pro Asp His Ala Ala Tyr
His Pro Phe Arg 20 2513925PRTHomo sapiens
139Val Leu Ser Ser Arg Gln Leu Gly Leu Pro Gly Pro Pro Asp Val Pro1
5 10 15Asp His Ala Ala Tyr His
Pro Phe Arg 20 2514024PRTHomo sapiens 140Leu
Ser Ser Arg Gln Leu Gly Leu Pro Gly Pro Pro Asp Val Pro Asp1
5 10 15His Ala Ala Tyr His Pro Phe
Arg 2014123PRTHomo sapiens 141Ser Ser Arg Gln Leu Gly Leu Pro
Gly Pro Pro Asp Val Pro Asp His1 5 10
15Ala Ala Tyr His Pro Phe Arg 2014222PRTHomo
sapiens 142Leu Met Ile Asp Gln Asn Thr Lys Ser Pro Leu Phe Met Gly Lys
Val1 5 10 15Val Asn Pro
Thr Gln Lys 2014322PRTHomo sapiens 143Leu Met Ile Glu Gln Asn
Thr Lys Ser Pro Leu Phe Met Gly Lys Val1 5
10 15Val Asn Pro Thr Gln Lys 2014424PRTHomo
sapiens 144Arg Tyr Thr Ile Ala Ala Leu Leu Ser Pro Tyr Ser Tyr Ser Thr
Thr1 5 10 15Ala Val Val
Thr Asn Pro Lys Glu 2014523PRTHomo sapiens 145Tyr Thr Ile Ala
Ala Leu Leu Ser Pro Tyr Ser Tyr Ser Thr Thr Ala1 5
10 15Val Val Thr Asn Pro Lys Glu
2014610PRTHomo sapiens 146Arg Ile His Trp Glu Ser Ala Ala Leu Leu1
5 1014713PRTHomo sapiens 147Ile Thr His Arg Ile
His Trp Glu Ser Ala Ala Leu Leu1 5
1014816PRTHomo sapiens 148Ser Ser Lys Ile Thr His Arg Ile His Trp Glu Ser
Ala Ala Leu Leu1 5 10 15
User Contributions:
Comment about this patent or add new information about this topic:
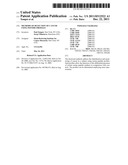 | 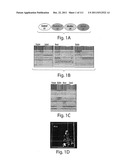 |
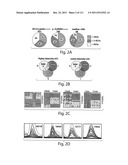 | 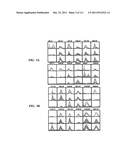 |
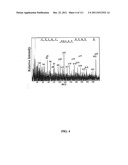 | 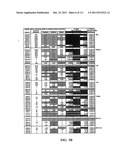 |
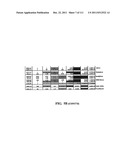 | 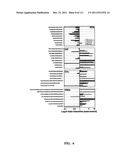 |
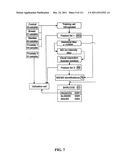 |  |
 |  |
 | 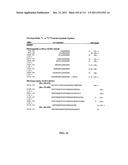 |
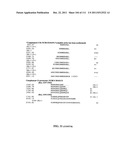 | 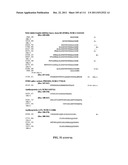 |
 |  |
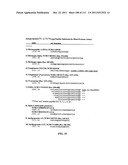 | 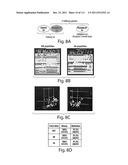 |
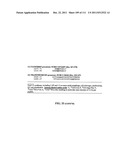 | 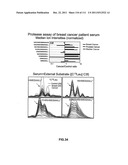 |
 | 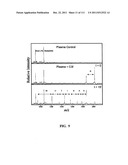 |
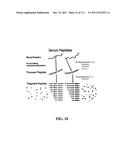 |  |
 |  |
 |  |
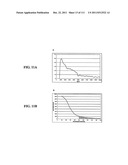 |  |
 |  |
 |  |
 |  |
 |  |
 | 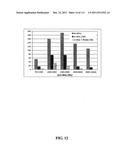 |
 |  |
 |  |
 |  |
 |  |
 |  |
 |  |
 |  |
 |  |
 |  |
 |  |
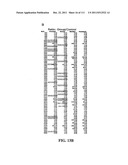 |  |
 |  |
 |  |
 |  |
 |  |
 | 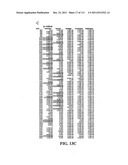 |
 |  |
 |  |
 |  |
 |  |
 |  |
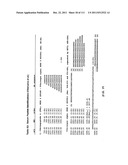 |  |
 | 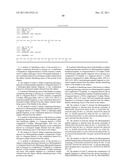 |
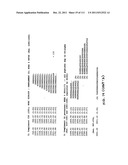 | 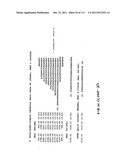 |
 | 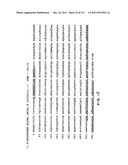 |
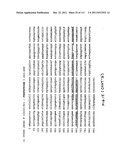 | 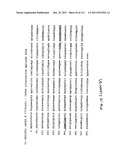 |
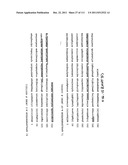 | 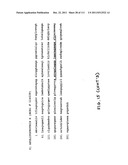 |
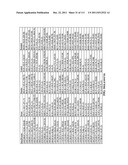 | 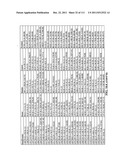 |
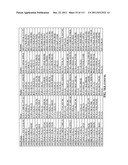 |  |
 | 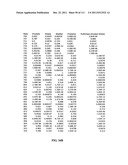 |
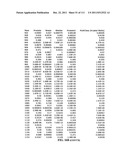 | 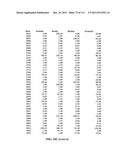 |
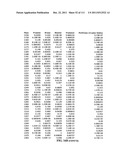 | 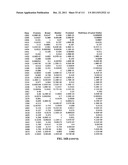 |
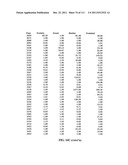 | 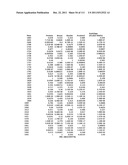 |
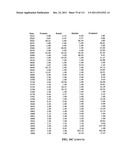 | 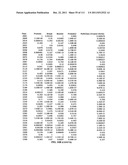 |
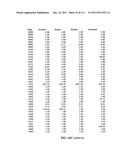 | 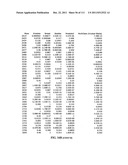 |
 | 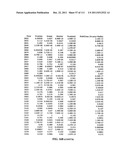 |
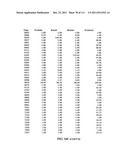 | 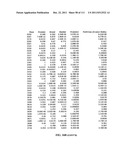 |
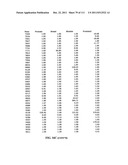 | 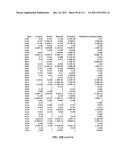 |
 | 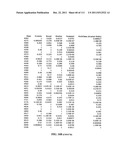 |
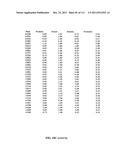 | 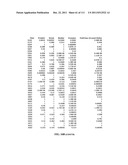 |
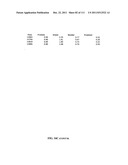 | 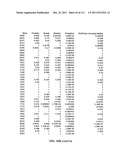 |
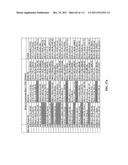 | 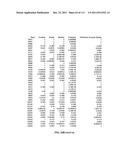 |
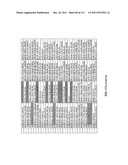 | 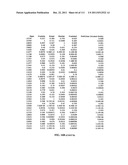 |
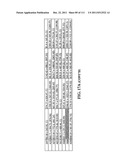 | 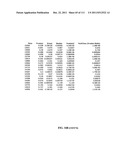 |
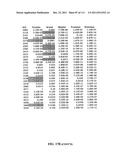 | 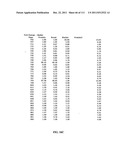 |
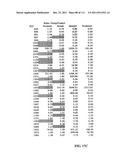 | 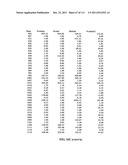 |
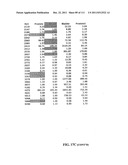 | 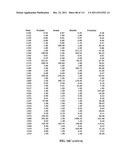 |
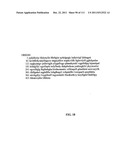 | 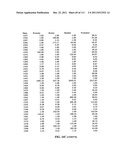 |
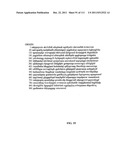 | 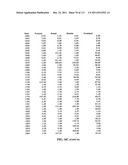 |
 | 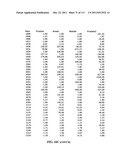 |
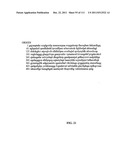 | 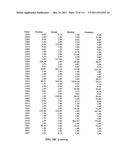 |
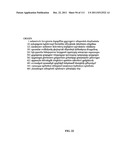 |  |
 |  |
 |
| Similar patent applications: | |
| Date | Title |
|---|---|
| 2012-02-16 | Methods for determining protein binding specificity using peptide libraries |
| 2011-06-30 | Methods for selecting a collection of single nucleotide polymorphisms |
| 2011-11-17 | Methods and compositions for detection of complement fixing antibodies |
| 2009-03-26 | Method and kit for the determination of cellular activation profiles |
| 2010-08-19 | Method of synthesis and testing of cominatorial libraries using microcapsules |
| New patent applications in this class: | |
| Date | Title |
|---|---|
| 2022-05-05 | Microfluidic system for amplifying and detecting polynucleotides in parallel |
| 2019-05-16 | Reagents and methods for detecting protein lysine 2-hydroxyisobutyrylation |
| 2019-05-16 | Lateral flow analyte detection |
| 2019-05-16 | Mutations in the bcr-abl tyrosine kinase associated with resistance to sti-571 |
| 2019-05-16 | Enhanced methods of ribonucleic acid hybridization |
| New patent applications from these inventors: | |
| Date | Title |
|---|---|
| 2014-08-21 | Methods of detection of cancer using peptide profiles |
| 2009-08-20 | Methods of detection of cancer using peptide profiles |
| Top Inventors for class "Combinatorial chemistry technology: method, library, apparatus" | |
| Rank | Inventor's name |
|---|---|
| 1 | Mehdi Azimi |
| 2 | Kia Silverbrook |
| 3 | Geoffrey Richard Facer |
| 4 | Alireza Moini |
| 5 | William Marshall |