Patent application title: Methods For Detecting Colorectal Diseases And Disorders
Inventors:
Robert S. Chapkin (College Station, TX, US)
Laurie A. Davidson (College Station, TX, US)
Joanne R. Lupton (College Station, TX, US)
Edward R. Dougherty, Jr. (College Station, TX, US)
IPC8 Class: AG01N3348FI
USPC Class:
436 94
Class name: Heterocyclic carbon compound (i.e., o, s, n, se, te, as only ring hetero atom) hetero-o (e.g., ascorbic acid, etc.) saccharide (e.g., dna, etc.)
Publication date: 2010-05-06
Patent application number: 20100112713
Inventors list |
Agents list |
Assignees list |
List by place |
Classification tree browser |
Top 100 Inventors |
Top 100 Agents |
Top 100 Assignees |
Usenet FAQ Index |
Documents |
Other FAQs |
Patent application title: Methods For Detecting Colorectal Diseases And Disorders
Inventors:
Robert S. Chapkin
Laurie A. Davidson
Joanne R. Lupton
Edward R. Dougherty, JR.
Agents:
Peter G. Carroll;MEDLEN & CARROLL, LLP
Assignees:
The Texas A&M University System
Origin: SAN FRANCISCO, CA US
IPC8 Class: AG01N3348FI
USPC Class:
436 94
Publication date: 05/06/2010
Patent application number: 20100112713
Abstract:
The present invention relates to methods and compositions for the
detection of biomarkers associated with colorectal diseases and
disorders. In preferred embodiments, said colorectal disease is
colorectal cancer. In some embodiments, the invention relates to the
detection of said biomarkers using non-invasive methods. In further
embodiments, the invention relates to the isolation and evaluation of
biomarkers residing in feces from a subject at risk for or exhibiting
symptoms associated with a colorectal disease or disorder. In still
further embodiments, said biomarkers include exfoliated colonocytes. In
additional embodiments, mRNA transcripts isolated from said colonocytes
and associated with said colorectal diseases and disorders are
quantified.Claims:
1. A method of detecting a biomarker associated with a colorectal disease
or disorder comprisinga) obtaining a fecal sample from a subject
exhibiting symptoms associated with or at risk for said colorectal
disease or disorder,b) further isolating at least one biomarker from said
fecal sample, andc) quantifying said biomarker.
2. The method of claim 1, wherein said colorectal disease or disorder is selected from the group consisting of colorectal cancer, colon cancer, large bowel cancer, colonic polyps, anal cancer, general anal and rectal diseases, colitis, Crohn's disease, hemorrhoids, ischemic colitis, ulcerative colitis, diverticulosis, diverticulitis and irritable bowel syndrome.
3. The method of claim 1, wherein said fecal sample is obtained from excretion from said subject.
4. The method of claim 1, wherein said subject is a mammal.
5. The method of claim 1, wherein said biomarker is messenger RNA.
6. The method of claim 1, wherein said biomarker is associated with at least one gene.
7. The method of claim 1, wherein said gene is selected from the group consisting of ACADS, ADAM9, ALOX5, ALOX12B, ATOH1, AXIN2, BAX, BCL, BCL2L12, BECN, CEAL1, CDC42, CSPG2, CSPG4, CXCL-1, EGF, EGFR, F11R, FABP1, FOX, FOXD2, FOXD4L1, FOXL1, FOXL2, FOXP1, FOXP3, FOXD2, FOXO3A, GST-M4, GUCA2A, HMGCL, HOXA1, HOXA11, HOXB2, HOXB3, HOXD10, HSPA12B, ICAM1 (CD54), IGF2, IGFR-1, ITGB4BP, KAI1, KIT, MAPK11, MCM2, MUC5AC, NOX1, NPAT, OGG1, PCNA, PHB, PIK3R1, PIK3C2G, PLCG1, PLCG2, PLCD3, PLCD4, POLG, PRKACB, PTK2B, PTK2, SDC1, SPARC, TGFB2, TGFβ, TGM4, TIMP3, TNF, TNFRSF10B, UCP-3, WNT1, WNT3, Wnt3A, and Wnt5A.
8. A method of measuring biomarkers associated with a colorectal disease or disorder comprisinga) obtaining a first fecal sample from a subject on a first diet;b) isolating mRNA from said first sample,c) determining a first mRNA profile;d) changing the diet of said subject to a second diet;e) obtaining a second fecal sample from a subject on said second diet;f) isolating mRNA from said second sample,g) determining a second mRNA profile; andh) comparing said first and second mRNA profiles.
9. The method of claim 8, wherein said second mRNA profile indicates a reduced risk for developing adenomas.
10. The method of claim 8, wherein said second diet consists of consuming legumes.
11. The method of claim 8, wherein said first and said second diets have the same energy percentage from dietary fat and dietary protein.
12. The method of claim 11, wherein said energy percentage from dietary fat is at least 30%.
13. The method of claim 11, wherein said energy percentage from dietary protein is at least 15%.
14. The method of claim 8, wherein said change in said diet was after a period of time.
15. The method if claim 11, wherein said period of time is at least one week.
Description:
FIELD OF THE INVENTION
[0002]The present invention relates to methods and compositions for the detection of biomarkers associated with colorectal diseases and disorders. In preferred embodiments, said colorectal disease is colorectal cancer. In some embodiments, the invention relates to the detection of said biomarkers using non-invasive methods. In further embodiments, the invention relates to the isolation and evaluation of biomarkers residing in feces from a subject at risk for or exhibiting symptoms associated with a colorectal disease or disorder. In still further embodiments, said biomarkers include exfoliated colonocytes. In additional embodiments, messenger RNA (mRNA) transcripts isolated from said colonocytes and associated with said colorectal diseases and disorders are quantified.
BACKGROUND OF THE INVENTION
[0003]Diseases and disorders of the colon and rectum, collectively referred to as the colorectal region, affect millions of people worldwide. One of the most recognizable diseases, colorectal cancer, is among the most common forms of cancer and a leading cause of cancer-related death in the Western world. Current methods for detecting colorectal cancer and pre-cancerous lesions and polyps are based largely on the use of invasive, tube-based cameras known as colonoscopes or sigmoidoscopes. The use of such devices is often a source of anxiety and extreme discomfort for a patient. Therefore, the development and implementation of non-invasive methods and assays for detecting biomedical indicators or biomarkers associated with colorectal cancer holds great appeal. However, current non-invasive methods lack both the necessary sensitivity of the aforementioned invasive techniques and the capacity for detecting alterations in the expression of genes associated with colorectal cancer. Thus, there is a need for the development of non-invasive methods for determining colorectal diseases and disorders that further allows for the examination of a patient's colonic gene expression profile.
SUMMARY OF THE INVENTION
[0004]The present invention relates to methods and compositions for the detection of biomarkers associated with colorectal diseases and disorders. In preferred embodiments, said colorectal disease is colorectal cancer. In some embodiments, the invention relates to the detection of said biomarkers using non-invasive methods. In further embodiments, the invention relates to the isolation and evaluation of biomarkers residing in feces from a subject at risk for or exhibiting symptoms associated with a colorectal disease or disorder. In still further embodiments, said biomarkers include exfoliated colonocytes. In additional embodiments, mRNA transcripts isolated from said colonocytes and associated with said colorectal diseases and disorders are quantified.
[0005]In some embodiments, the invention relates to a method of detecting a biomarker associated with a colorectal disease or disorder comprising a) obtaining a fecal sample from a subject exhibiting symptoms associated with or at risk (e.g. at risk because of prior adenomas, at risk because of insulin resistance, at risk because of a history of adenomatous polyps, etc.) for said colorectal disease or disorder, b) isolating at least one biomarker from said fecal sample, and c) quantifying said biomarker. In further embodiments, said colorectal disease or disorder is selected from the group consisting of colorectal cancer, colon cancer, large bowel cancer, colonic polyps, anal cancer, general anal and rectal diseases, colitis, Crohn's disease, hemorrhoids, ischemic colitis, ulcerative colitis, diverticulosis, diverticulitis and irritable bowel syndrome. In still further embodiments, said fecal sample is obtained within two hours of excretion from said subject. In additional embodiments, said subject is a mammal. In some embodiments, said biomarker is messenger RNA. In further embodiments, said biomarker is associated with at least one gene. In still further embodiments, said gene is selected from the group consisting of ACADS, ADAM9, ALOX5, ALOX12B, ATOH1, AXIN2, BAX, BCL, BCL2L12, BECN, CEAL1, CDC42, CSPG2, CSPG4, CXCL-1, EGF, EGFR, F11R, FABP1, FOX, FOXD2, FOXD4L1, FOXL1, FOXL2, FOXP1, FOXP3, FOXD2, FOXO3A, GST-M4, GUCA2A, HMGCL, HOXA1, HOXA11, HOXB2, HOXB3, HOXD10, HSPA12B, ICAM1 (CD54), IGF2, IGFR-1, ITGB4BP, KAI1, KIT, MAPK11, MCM2, MUC5AC, NOX1, NPAT, OGG1, PCNA, PHB, PIK3R1, PIK3C2G, PLCG1, PLCG2, PLCD3, PLCD4, POLG, PRKACB, PTK2B, PTK2, SDC1, SPARC, TGFB2, TGFβ, TGM4, TIMP3, TNF, TNFRSF10B, UCP-3, WNT1, WNT3, Wnt3A, and Wnt5A.
[0006]In some embodiments, the invention relates to a method of measuring biomarker associated with a colorectal disease or disorder comprising a) obtaining a first fecal sample from a subject on a first diet, b) isolating mRNA from said fecal sample, c) determining a first mRNA profile, d) changing the diet of said subject to a second diet, f) obtaining a second fecal sample from a subject on said second diet, g) isolating mRNA from said fecal sample, h) determining a second mRNA profile, and j) comparing said first and second mRNA profiles. In further embodiments, said second mRNA profile indicates a reduced risk for developing adenomas. In still further embodiments, said second diet consists of consuming legumes. It is not intended that the present invention be limited by the precise nature of the diets employed. In one embodiment, a seven-day menu cycle is contemplated for the second diet with a standard set of legumes of the Phaseolus vulgaris species, such as, navy beans, pinto beans, and kidney beans in order to limit nutrient and phytochemical differences in the seven-day diet cycle. In further embodiments, the second diet contains at least 200 grams of legumes per day, more preferably approximately 250 grams of legumes per day. In still further embodiments, said second diet may be modified to provide other high glycemic index (GI) foods in the control or first diet such that the GI of the control or first diet has a GI of approximately 70 compared to a GI of 30 in the legume diet. In still further embodiments, said first diet and said second diet are controlled such that a constant level of energy available from dietary fat is maintained. In additional embodiments, the energy percentage of said dietary fat energy is at least 30%, more preferably between 32 and 33%. A further embodiment of the present invention is the use of a high legume, low glycemic index diet with a total dietary fiber intake of approximately 40 grams per day. In further embodiments, the invention relates to a corresponding high glycemic index diet comprising approximately 20 grams of total dietary fiber per day. A further embodiment of the present invention relates to the maintenance of the protein level of both the high glycemic index diet and the low glycemic index diet. In preferred embodiments, the energy percentage available from said protein level is at least 15%, preferably approximately 18%. It is further contemplated that said protein level is maintained through incorporation of protein sources including but in no way limited to red meat, fish and poultry.
[0007]In some embodiments, the present invention relates to a legume enriched, low glycemic index (GI), high fermentable fiber diet for reducing the risk of or symptoms associated with colorectal diseases and disorders in a subject. In further embodiments, said subject exhibits at least one risk factor. In still further embodiments, said risk factor includes but is in no way limited to insulin resistance and adenomatous polyps. In still further embodiments, at least one gene associated with a colorectal disease or disorder, and preferably at least two genes, are analyzed using the methods of the present invention. In additional embodiments, said gene or genes are analyzed for identifying subjects at risk for or exhibiting symptoms associated with risk factors including but not limited to adenomatous polyps and insulin resistance.
[0008]In some embodiments, the invention relates to a method of detecting a biomarker associated with a colorectal disease or disorder comprising a) obtaining a fecal sample from a subject exhibiting symptoms associated with or at risk (e.g. at risk because of prior adenomas, at risk because of insulin resistance, at risk because of a history of adenomatous polyps, etc.) for said colorectal disease or disorder, b) isolating at least one colonocyte from said fecal sample; c) further isolating at least one biomarker from said colonocyte, and d) quantifying said biomarker. In further embodiments, said colorectal disease or disorder is selected from the group consisting of colorectal cancer, colon cancer, large bowel cancer, colonic polyps, anal cancer, general anal and rectal diseases, colitis, Crohn's disease, hemorrhoids, ischemic colitis, ulcerative colitis, diverticulosis, diverticulitis and irritable bowel syndrome. In still further embodiments, said fecal sample is obtained within two hours of excretion from said subject. In additional embodiments, said subject is a mammal. In some embodiments, said biomarker is messenger RNA.
[0009]In some embodiments, the invention relates to a method of measuring biomarker associated with a colorectal disease or disorder comprising a) obtaining a first fecal sample from a subject on a first diet, b) isolating colonocytes from said first fecal sample; c) isolating mRNA from said colonocytes fecal samples; d) determining a first mRNA profile, e) changing the diet of said subject to a second diet, f) obtaining a second fecal sample from a subject on said second diet, g) isolating colonocytes from said second fecal sample; h) isolating mRNA from said colonocytes fecal samples; i) determining a second mRNA profile, and j) comparing said first and second mRNA profiles. In further embodiments, said second mRNA profile indicates a reduced risk for developing adenomas. In still further embodiments, said second diet consists of consuming only legumes.
BRIEF DESCRIPTION OF THE DRAWINGS
[0010]For a more complete understanding of the features and advantages of the present invention, reference is now made to the detailed description of the invention along with the accompanying figures.
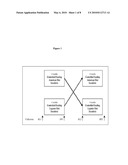
[0011]FIG. 1 shows a schematic overview of the experimental design as described in Example 1.
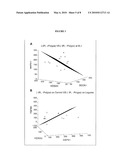
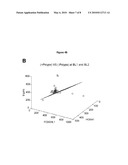
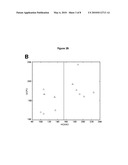
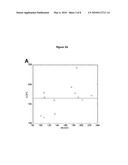
[0012]FIG. 2 shows the LDA classification (+IR, +Polyps)/class 0 (depicted as ◯), versus (-IR, -Polyps)/class 1 (Δ), at bl1 as described in Example 1. The concept of intrinsically multivariate predictive (IMP) genes is shown where expression profiles of a group of genes predict the phenotype. Results represent a linear classification of (+IR, +Polyps) subjects (◯) versus (-IR, -Polyps) subjects (Δ) at BL1. UCP2 and HOXA3 were used as individual one-feature sets (A and B) as compared with both genes together as a two-feature set (C). The bolstered error is 0.2784, 0.4882, and 0.1415 for (A), (B), and (C), respectively.
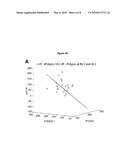
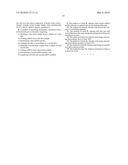
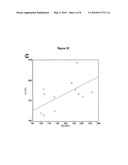
[0013]FIG. 3 shows the LDA classification (+IR, +Polyps)/class 0 (depicted as ◯), versus (-IR, -Polyps)/class 1 (Δ), at bl1 as described in Example 1. Effective classification of clinical phenotype or diet. (A), linear (LDA) classification of (+IR, +Polyps) subjects (◯) versus (-IR, -Polyps) subjects (Δ) at BL1; (B) linear (LDA) classification of (-IR, -Polyps) subjects on the control diet (◯) versus (-IR, -Polyps) subjects on the legume diet (Δ) using the crossover design and combining the microarrays from samples collected at the end of the two diet periods DP1 and DP2.
[0014]FIG. 4 shows the LDA classification (-IR, -Polyps, Control diet)/class 0 (depicted as ◯), versus (-IR, -Polyps, Legume diet)/class 1 (Δ) as described in Example 1. Potential design problems and importance of the experimental design factors IR and history of adenomas. (A) increased error in the LDA classification of (+IR, +Polyps) subjects (◯) versus (-IR, -Polyps) subjects (Δ) when both baselines BL1 and BL2 were included. (B) (+Polyps) subjects (◯) versus (-Polyps) subjects (Δ) at baselines BL1 and BL2. (C) (+IR) subjects (◯) versus (-IR) subjects (Δ) at all time points.
[0015]FIG. 5 shows the Housekeeping gene preparation. Two normalization issues were addressed. First, there was a large number of low-quality spots and second, while the microarray intensities showed no aberrant trend up to a certain point in time (relative to when microarray was performed), after a certain point there was a somewhat linear decline in intensity. Data points (blue dots) in FIG. 5 show the average values of the 18 housekeeping genes across microarrays, ordered from earliest to latest with respect to the time of processing. Common good probes (2,584) across all 86 microarrays were identified. A good probe is defined as having, at most, two low measures across all 86 microarrays. Using a list of 575 housekeeping genes (16), 18 genes were identified from the 2,584 probes found in the previous step. Subsequently, the raw intensity of each of the 18 housekeeping genes was quantified, and those with missing values were excluded. As a result, there were a total of 18 housekeeping genes used for normalization in Example 1. Arrays were grouped across time and the average values of 18 housekeeping genes were calculated in FIG. 5.
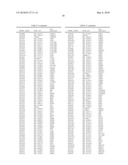
[0016]Table I shows the classification groups, sample sizes and number of common genes in the set A21∩B as described in Example 1. BL1 and BL2 indicate the base lines 1 or 2, +IR and -IR indicate present or absent insulin resistance, and +Polyps and -Polyps indicate presence or absence of polyps.
[0017]Table II shows the (+IR, +Polyps) data versus (-IR, -Polyps) data and BL1 as provided for in Example 1. Pair-wise or triplet-wise LDA classifiers are included when they rank higher than 20th in both lists. εbolstered denotes the bolstered re-substitution error for the respective classifier; Δεbolstered denotes the largest increase in error for the feature set relative to all of its subsets and εresub denotes the re-substitution as described in Example 1. Shows the classification of (+IR, +Polyps) subjects versus (-IR, -Polyps) subjects at BL1. Single-gene, pair-wise, and triplet-wise LDA classifiers are shown. εbolstered denotes the bolstered resubstitution error for the respective classifier; Δεbolstered denotes the largest decrease in error for the feature set relative to all of its subsets.
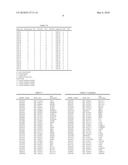
[0018]Table III shows the (-IR, -Polyps) on control versus (-IR, -Polyps) on legume diet as provided for in Example 1. Pair-wise or triplet-wise LDA classifiers are included when they rank higher than 30th in both lists. εbolstered denotes the bolstered re-substitution error for the respective classifier; Δεbolstered denotes the largest increase in error for the feature set relative to all of its subsets and εresub denotes the re-substitution as described in Example 1. Shows the classification of (-IR, -Polyps) subjects on control diet versus (-IR, -Polyps) subjects on the legume diet. Single-gene, pair-wise, and triplet-wise LDA classifiers are shown. Refer to Table II for legend details.
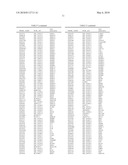
[0019]Table IV shows the overall structure of the microarray data set.
[0020]Table V shows the Final classifier gene list.
[0021]Table VI Akj∩B represents the number of genes that are common between the set B of established colonic biomarkers and the spots Akj on the microarray set that passed quality threshold set by the parameters k and j. The value k=1.5 is the default value for the CodeLink image processing software, and j represents the number of accepted low (L) spots for a gene across all of the microarrays in the experiment.
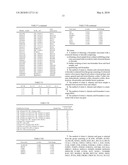
[0022]Table VII shows the classification groups, sample size and number of common genes in each data set. BL1, baseline 1; BL2, baseline 2; +IR and IR indicate presence or absence of insulin resistance, respectively. +Polyps and -polyps indicate the presence or absence of polyps, respectively.
[0023]Table VIII shows Relative exfoliated cell gene expression levels in (+IR, +Polyps) vs (-IR, -Polyps) subjects at baseline 1 (BL1). Fold change represents the relative expression level in (+IR, +Polyps) subjects divided by (-IR, -Polyps) subjects for individual genes described in Table 1. p-values were computed using t-tests applied to the normalized data.
DEFINITIONS
[0024]To facilitate the understanding of this invention, a number of terms are defined below. Terms defined herein have meanings as commonly understood by a person of ordinary skill in the areas relevant to the present invention. Terms such as "a", "an" and "the" are not intended to refer to only a singular entity, but include the general class of which a specific example may be used for illustration. The terminology herein is used to describe specific embodiments of the invention, but their usage does not delimit the invention, except as outlined in the claims.
[0025]As used herein, "colorectal disease" and "colorectal disorder" refer to diseases and disorders of the colon, and rectum. While not limiting the scope of the invention in any way, colorectal diseases and disorders include but are in no way limited to colorectal cancer, colon cancer, large bowel cancer, colonic polyps, anal cancer, general anal and rectal diseases, colitis, Crohn's disease, hemorrhoids, ischemic colitis, ulcerative colitis, diverticulosis, diverticulitis and irritable bowel syndrome.
[0026]As used herein, "colorectal cancer", also known as "colon cancer", "large rectal cancer" and "anal cancer," is a disease that originates from the epithelial cells lining the gastrointestinal tract. The disease is often characterized by the cancerous growths residing in the colon and/or rectum. Symptoms associated with colorectal cancer include but are in no way limited to change in bowel habits, change in the appearance of stool including but not limited to bloody stool, rectal bleeding, stool with mucus, and/or black tar-like stool, bowel obstruction, the presence of an abdominal tumor, unexplained weight loss, jaundice, abdominal pain, anemia and blood clots.
[0027]A "colonocyte" refers to an epithelial cell that lines the mammalian colon.
[0028]As used herein, a "biomarker" is a substance used as an indicator of a biomedical state. While not limiting the scope of the present invention in any way, it is often a characteristic that is objectively measured and evaluated as an indicator of normal biomedical processes, pathogenic processes, or pharmacologic responses to a therapeutic intervention. A biomarker includes but is in no way limited to a nucleic acid sequence, peptide, protein, chemical modifier, chemical inhibitor, biomedical fluid or biomedical excrement. In preferred embodiments, the present invention relates to the detection and analysis of biomarkers associated with colorectal diseases and disorders. In even more preferred embodiments, said biomarker is messenger RNA. Examples of biomarkers associated with the detection of said colorectal diseases and disorders include but are in no way limited to biomarkers associated with ALOX12B (arachidonate 12-lipoxygenase), APC2 (adenomatous polyposis coli 2), Axin2 (conductin), BAD (bcl-2 antagonist of cell death), BECN1 (beclin 1), CA5B (carbonic anhydrase 5), CDC42 (G25K GTP-binding protein), CDK4 (cyclin-dependent kinase 4), CD44 (CD44 antigen), CSPG4 (chondroitin sulphate proteoglycan 4), CXCL-1 (chemokine CXC motif (GRO-alpha)), DAPK1 (death-associated protein kinase), EGF (epidermal growth factor), EGFR (epidermal growth factor receptor), FOXL1 (forkhead box protein L1), FOXL2 (forkhead box protein L2), FOXO1A (forkhead box protein O1A), FOXP3 (forkhead box protein P3), FOXP4 (forkhead box protein P4), FOXD2 (forkhead box protein D2), FOXO3A (forkhead box protein 3A), GST-M4 (glutathione S-transferase), GUCA2A (guanylate cyclase activator 2A), HOXA3 (homeobox gene A3), HOXB3 (homeobox gene B3), HOXC6 (homeobox gene C6), HOXD10 (homeobox gene D10), HSPA12B (heat shock protein A12B), ICAM1 (intracellular adhesion molecule 1 (CD54)), ID2 (inhibitor of DNA binding 2), IGF2 (insulin-like growth factor 2), IGFR-1 (insulin-like growth factor receptor 1), ITGB4BP (integrin beta 4 binding protein), KAI1 (CD82 tumor suppressor gene), KIT (proto-oncogen tyrosine-protein kinase), LEF-1 (lymphoid enhancer binding factor/T cell factor transcription factor), MAPK11 (mitogen activated protein kinase 11/p38 beta), MCM2 (minichromosome maintenance deficient 2), MUC5AC (secreted gel forming mucin 5AC), NOS3 (nitric oxide synthase 3), NOX1 (NADPH oxidase 1), NPAT (ataxia telangiectasia locus), OGG1 (8-oxoguanine DNA glycosylase), PCNA (proliferating cell nuclear antigen), PHB (prohibitin), PIK3R1 (phosphatidylinositol 3-kinase regulatory subunit p85 alpha), PIK3C2G (phosphoinositide 3-kinase, class 2, gamma polypeptide), PLCG2 (phosphatidylinositol-specific phospholipase gamma 2), PLCD4 (phospholipase C delta 4), POLG (DNA polymerase gamma), PRKACB (protein kinase, cyclic AMP-dependent, catalytic subunit beta), PTK2 (protein tyrosine kinase 2), SDC1 (syndecan 1), SFRP5 (secreted frizzled-related protein 5), SPARC, TGFβ (transforming growth factor beta 3), TNF (tumor necrosis factor), TNFRSF10B (tumor necrosis factor super family member 10B), TP53 (tumor suppressor protein p53), UCP-2 (uncoupling protein 2), UCP-3 (uncoupling protein 3), WNT1 (Wingless-type MMTV integration site family, member 1), Wnt3A (wingless-type MMTV integration site family member 3A), Wnt5A (wingless-type MMTV integration site family member 5A), YWHAZ (14-3-3 zeta).
[0029]As used herein, "energy percentage" is the percentage of energy, i.e. calories, derived from a macronutrient, including but in no way limited to carbohydrates, proteins and fats consumed by a subject.
[0030]As used herein, the terms "prevent" and "preventing" include the prevention of the recurrence, spread or onset of a disease or disorder. It is not intended that the present invention be limited to complete prevention. In some embodiments, the onset is delayed, or the severity of the disease or disorder is reduced.
[0031]As used herein, the terms "treat" and "treating" are not limited to the case where the subject (e.g. patient) is cured and the disease is eradicated. Rather, the present invention also contemplates treatment that merely reduces symptoms, improves (to some degree) and/or delays disease progression. It is not intended that the present invention be limited to instances wherein a disease or affliction is cured. It is sufficient that symptoms are reduced.
[0032]"Subject" refers to any mammal, preferably a human patient, laboratory animal, livestock, or domestic pet.
DETAILED DESCRIPTION OF THE INVENTION
[0033]The present invention relates to methods and compositions for the detection of biomarkers associated with colorectal diseases and disorders. In preferred embodiments, said colorectal disease is colorectal cancer. In some embodiments, the invention relates to the detection of said biomarkers using non-invasive methods. In further embodiments, the invention relates to the isolation and evaluation of biomarkers residing in feces from a subject at risk for or exhibiting symptoms associated with a colorectal disease or disorder. In still further embodiments, said biomarkers include exfoliated colonocytes. In additional embodiments, mRNA transcripts isolated from said colonocytes and associated with said colorectal diseases and disorders are quantified.
[0034]In preferred embodiments, the present invention relates to methods for the detection of colorectal diseases and disorders such as colorectal cancer. Early detection of colorectal cancer can greatly increase the prognosis for a subject exhibiting symptoms associated with the disease, thus it is desirable to have accurate screening methods and assays. Consistent with this goal, the adoption of non-invasive methodology designed to reduce anxiety over colorectal cancer screening and improve overall acceptance of the screening process would be highly desirable. Unfortunately, current non-invasive detection methods lack sensitivity and are incapable of detecting alterations in gene expression. This current limitation is significant because changes in gene expression can modulate the regulatory mechanisms that either promote or protect a subject against colorectal diseases and disorders such as colorectal cancer. Thus, the present invention utilizes a novel, non-invasive methodology based on the analysis of fecal or stool samples, which contain intact sloughed colon cells, in order to quantify colorectal disease and disorder relevant gene expression profiles.
[0035]Colon cancer is one of the leading causes of cancer-related deaths in the United States. Early detection is one of the proven strategies resulting in a higher cure rate (Rutter, 2006). Unfortunately, the currently adopted screening procedures for early detection are often invasive, e.g. colonoscopy, and discomfort associated with such procedures generally leads to resistance toward the screening process. Thus, adoption of noninvasive methodology designed to reduce anxiety over colorectal cancer screening and improve overall acceptance of the screening process would be highly desirable. See U.S. Pat. No. 6,258,541, hereby incorporated by reference.
[0036]Approximately one-sixth to one-third of normal adult colonic epithelial cells are shed daily as provided for in Potten (1979) Biochimica et Biophysica Acta 560, 281-299, incorporated herein by reference. The present invention provides for novel, non-invasive methodologies utilizing feces, which contain exfoliated colonocytes, in order to quantify colonic mRNAs as provided for in Davidson et al. (1995) Cancer Epidemiology Biomarkers and Prevention 4, 643-647; Davidson et al. (1998) Carcinogenesis 19, 253-257; Davidson et al. (2003) Biomarkers 8, 51-61, all of which are hereby incorporated by reference. Although RNA is generally less suitable than DNA because it is readily degraded, it has previously been demonstrated that intact fecal eukaryotic mRNA can be isolated because of the presence of viable exfoliated colonocytes in the fecal stream as described in Albaugh (1992) International Journal of Cancer 52, 347-350; Davidson et al. (1995) Cancer Epidemiology Biomarkers and Prevention 4, 643-647; Davidson et al. (2003) Biomarkers 8, 51-61; Santiago et al. (2003) Journal of Virology 77, 2233-2242 and Kanaoka et al. (2004) Gastroenterology 127, 422-427, all of which are incorporated herein by reference.
[0037]Using exfoliated colonocytes, the discriminative mRNA expression signatures between conditions associated with inflammatory bowel disease versus normal conditions as well as conditions consistent with the presence of adenoma versus normal conditions has been described in Davidson et al. (2003) Biomarkers 8, 51-61. Those data suggest that mRNA isolated from exfoliated human colonocytes can be used to detect early stages of colon cancer, and possibly chronic inflammation. However, the microarray gene expression profile-based classification of colonic diseases for diagnostic purposes has yet to be solved. Therefore, a further embodiment of the present invention is the utilization of non-invasive mRNA procedures in patients at high risk for colorectal adenoma recurrence. In some embodiments, the effect of a legume enriched, low glycemic index (GI), high fermentable fiber diet, on subjects exhibiting a combination of risk factors including insulin resistance and history of adenomatous polyps is evaluated. This method evaluates the effects of legumes or a low GI diet on changes in intestinal gene expression profiles using exfoliated colonocytes. A further embodiment of the present invention involves the implementation of diagnostic gene sets (combinations) analyses for the objective classification of different phenotypes. These methods allow for the identification of both individual genes and two- to three-gene combinations for distinguishing polyps, insulin resistance, and exposure to a legume diet. The disclosed methods further reduce the classification error rate, with two and three-gene combinations providing robust classifiers that non-invasively identify discriminative signatures for diagnostic purposes.
EXAMPLES
[0038]The following examples are provided in order to demonstrate and further illustrate certain preferred embodiments and aspects of the present invention and are not to be construed as limiting the scope thereof.
[0039]In the experimental disclosure that follows, the following abbreviations apply: bl1 (base line 1); bl2 (base line 2); dp1 (diet period 1); dp2 (diet period 2); GI (glycemic index); IR (insulin resistance); mRNA (messenger RNA); RMR (resting metabolic rate).
Example I
Materials and Methods
[0040]The effects of a legume enriched, low glycemic index, high fermentable fiber diet, were evaluated in participants with four possible combinations of risk factors, including insulin resistance (IR) and a history of adenomatous polyps. In a randomized, crossover, design-controlled feeding study, each participant consumed the "experimental diet", defined as 1.5 cups of cooked dry beans per day, as well as a "control diet", defined as an isocaloric average American diet, for four weeks, with a three-week washout period between diets. A total of 68 male subjects were examined, with 17 males assigned to each of four groups: Group 1 (previous history of adenomas and IR); Group 2 (previous history of adenomas without IR); Group 3 (IR with no history of adenomas); and Group 4 (non-IR and no history of adenomas). The effects of patient risk and diet on global gene expression profiling were examined using exfoliated colonic cells collected from the male subjects. All procedures used in the study were reviewed and approved by the human subjects' committees at the Pennsylvania State University and the National Institutes of Health. Study procedures are briefly summarized below.
Subject Recruitment
[0041]Subjects were recruited with the assistance of gastroenterologists performing colonoscopies at the Mount Nittany Medical Center in State College, Pa. After receiving informed consent, the subject's height, weight and blood pressure were checked by study staff or the nurses at the clinic and a fasting blood sample was taken to determine overall health including fasting insulin and glucose to determine insulin sensitivity and cholesterol levels and lab tests for heart and liver function. A physician reviewed the results to determine eligibility for participation, with eligible consented participants asked to return to assess their resting metabolic rate (RMR). Each participant completed demographic, health and lifestyle questionnaires and subsequently provided instructions for completing a four-day food record for the purpose of estimating pre-study, baseline dietary intake.
Inclusion and Exclusion Criteria
[0042]Eligible participants for the study were males between 35-75 years of age, with a body mass index of 25.0-34.9 kg/m2, and having previously undergone a screening colonoscopy within the past two years. Subjects were selected that lacked pre-existing medical conditions including but not limited to cancer, heart disease, kidney disease and diabetes as well as a family history of such conditions, including but not limited to colorectal cancer, surgical resection of adenomas, bowel resection, polyposis syndrome and inflammatory bowel disease. Subjects were not permitted to take any medication that would alter inflammation markers, insulin, glucose, or blood lipids.
Dietary Intervention
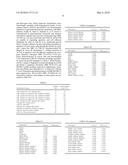
[0043]Subjects consumed one meal per day (breakfast or dinner) on site during the weekdays and consumed a packed lunch, snack and an additional meal at a time and place of convenience. Weekend meals were prepared and packed for carry out. Compliance was monitored according to procedures routinely used in the Pennsylvania State University General Clinical Center Research Center (GCRC). No foods other than those provided by the study kitchen were permitted. Alcohol consumption was limited to no more than two drinks/week during the controlled feeding period. A seven-day menu cycle was developed with a standard set of legumes of the Phaseolus vulgaris species, such as, navy beans, pinto beans, and kidney beans in order to limit nutrient and phytochemical differences in the seven-day diet cycle. The diet contained approximately 250 grams of legumes per day (1.5 cups). This level added approximately 20 grams of total dietary fiber and 8 g of soluble fiber/day. The diet was modified to provide other high glycemic index (GI) foods in the control diet so that the GI of the control diet had a GI of approximately 70 compared to a GI of 30 in the legume diet. Each daily menu was designed to maintain a constant level of fat (32-33 energy %), while the high legume low glycemic index diet had a total dietary fiber intake of approximately 40 grams per day compared to 20 grams per day for the high glycemic index diet. The protein level of both diets was approximately 18 energy %. In order to maintain the same level of red meat and fish (foods that have been associated with colon cancer) in both diets, the protein in legumes was substituted for protein from poultry. All nutrients were provided in amounts to meet the recommended dietary allowances for men of the same age groups. A food composite for each of the six days was freeze-dried and analyzed for macro-nutrient and fiber levels. Individual food items were purchased at the same time from the same supplier in order to assure uniformity of the diet.
mRNA Expression Microarray Analysis
[0044]The overall study design is shown in FIG. 1. All fecal samples were processed within two hours of excretion, coded by the Research Assistant and stored at -80 degrees C. at the Penn State GCRC for later analysis. From each subject, poly A+RNA was isolated from feces as disclosed in Davidson et al. (1995) Cancer Epidemiology Biomarkers and Prevention 4, 643-647; Davidson et al. (1998) Carcinogenesis 19, 253-257; Davidson et al. (2003) Biomarkers 8, 51-61, all of which are hereby incorporated by reference. Due to the high level of bacterial RNA in fecal samples, poly A+RNA must be isolated in order to obtain a pure mammalian RNA population. As described in Davidson et al. (1995) Cancer Epidemiology Biomarkers and Prevention 4, 643-647, the isolation of poly A+ is free of bacterial RNA contamination. In addition, an Agilent 2100 Bioanalyzer was used to assess integrity of mucosal and fecal poly A+RNA. Samples were processed in strict accordance to the CodeLink® Gene Expression Assay manual (Applied Microarray, Tempe, Ariz.) and analyzed using the Human whole Genome Expression Bioarray as provided for in Davidson et al. (2004) Cancer Research 64, 6797-6804, hereby incorporated by reference. Each array contains the entire human genome derived from publicly available, well-annotated mRNA sequences. This platform is unique because it is capable of detecting minimal differences in gene expression, as low as 1.3-fold with 95% confidence (Ramakrishnan, 2002; Stafford, 2003). The 3-D gel provides support for 30-mers in a matrix that holds the probe away from the surface of the slide. This substantially reduces background and enhances sensitivity, allowing for the detection of one transcript per cell with 50-200 ng of poly A+RNA (Stafford, 2003).
[0045]Arrays were inspected for spot morphology. Marginal spots were flagged as either background contamination (C) or irregular shape (I) in the output of the scanning software. Spots that passed the quality control standards were categorized as good (G). In addition, spots marked with (L) indicated a corresponding reading was "near the background". The low (L) measurements reflect either true low gene expression levels or may have been caused by degradation of the mRNA resulting in a low signal. Samples collected from colonic mucosa previously exhibited a relatively low proportion (5-8%) of L spots as disclosed in Davidson et al. (2004) Cancer Research 64, 6797-6804, incorporated herein by reference. In contrast, the proportion of L spots in data obtained from fecal samples was significantly higher (65-83%).
Microarray Data Normalization
[0046]The standard procedure for microarray data analysis requires a normalization step to facilitate the comparison of gene expression levels from two or more arrays. The goal of such a processing step is to reduce the technical variance while preserving the biologically meaningful variance produced by the different experimental conditions/treatments. The normalization procedures can be either "local" or "global" as disclosed in Quackenbush (2002) Nature Genetics Supplement 32, 496-501, incorporated in its entirety by reference. Besides these, model-based, parametric or non-parametric normalization procedures have been disclosed in Kerr et al. (2001) Genetic Research 77, 123-128; Sidorov et al. (2002) Information Sciences 146, 65-71; Bolstad et al. (2003) Bioinformatics 19, 185-193, all of which are incorporated herein by reference. However, none of these methods were developed for the situations where one deals with a high percentage of partially degraded mRNA in the samples. Recently, we proposed a two-stage normalization procedure for such data sets as described in Liu et al. (2005) Bioinformatics 21, 4000-4006, incorporated herein by reference. The method is built on non-parametric smoothing techniques with robustness consideration, and was used to evaluate the feasibility of properly extracting information from fecal mRNA data. We note, that the main objective of the two-stage normalization is to "regularize" the G spots for each gene while including the L spots that behave "similarly" to other G probes for that same gene, and excluding the outlying G probes. In contrast, our goal was to identify groups of genes/features that distinguish or classify between the different combinations of risk factors. Therefore, we adopted a conservative approach that does not include a normalization step, and focuses on a subset of genes that have been implicated in colorectal carcinogenesis. This procedure is justified by the observation that applying any kind of normalization to a data set with a high percentage of L spots has the potential to "flatten" the signal that results in a loss of data.
Developing an Algorithm for Identifying Feature (Gene) Sets
[0047]Because there is high percentage of L spots on each array in the data set we first examined how the values of the parameters used by the CodeLink scanning software affect the number of G spots that are common for a subset of the arrays in our data set. To be specific, denoted by Akj the set of genes xi that have at most j raw mean spot intensity values less than where μi,l+kσi,l where μi,l is the value of local background median for the spot representing the gene xi on the lth array, and σi,l is the corresponding standard deviation for that background signal. For example A1.50 is the set of G spots that are common for all of the arrays in the data set (by default k=1.5 in the CodeLink software). Spots that are flagged C are not considered when the sets Akj are formed. Notice that Akj.OR right.Asr if s≦k and j≦r. In particular, Akj.OR right.Asj, s≦k represents the fact that one gets a lesser number of common good spots if one requires a stronger signal as compared to the background. Also, Akj.OR right.Akr, j≦r represents the fact that the number of common genes increases if one allows more L spots per gene.
[0048]Keeping in mind that our main goal is to check if mRNA data from fecal colonocytes has the potential to classify different colon cancer risk factors we combined the so obtained sets Akj with a set B of approximately 1300 known human colonic markers. Because our main goal was to determine if mRNA data from exfoliated colonocytes have the potential to classify different colon cancer risk factors, we compared the obtained array data sets (termed A) with a set of 529 putative human colonic markers (termed B; refer to Table V). Using such a prior biological knowledge we investigated the sets of common genes for Akj and B. The number of those common genes for various values of the parameters k and j are given in Table VI. Based on these results, we focus on the intersection A21∩B. This conservative approach provides us with a subset of the known colonic biomarkers that have strong signal (k=2 compare to the CodeLink weaker default condition k=1.5) and no more than 1 low signal spot on the entire data set. One should notice that the microarray data could be grouped into various combinations of two different classes. This is due to the experimental design which lists to risk factors: (IR), and (-IR); four time points: Base line 1 (bl1), Diet period 1 (dp1), Base line 2 (bl2), Diet period 2 (dp2); and two diets: high legume low glycemic index, and control. These different groupings produce their respective sets Akj that could be larger or smaller depending on which of the microarrays are included in the corresponding groups and classes (Table VII). Obviously, Akj has the smallest possible size when one considers all of the data as being divided into two major categories, e.g. (+IR) vs (-IR). The next step in finding feature sets is to design classifiers that categorize samples based on the expression values of the genes from the intersection A21∩B. An important consideration is that the number of genes in such gene feature sets should be sufficiently small, and we construct the classifiers for feature sets of size 1, 2, and 3. There are two reasons why we desire classifiers involving small numbers of genes: (a) the limited number of samples often available in clinical studies makes classifier design and error estimation problematic for large feature sets as provided for in Dougherty et al. (2001) Comparative and Functional Genomics 2, 28-34, incorporated herein by reference, and (b) small gene sets facilitate design of practical immunohistochemical diagnostic panels. Thus, we use a simple linear discriminant analysis (LDA) classifier and a small number of genes. Given a set of features on which to base a classifier, one has to address not only the classifier design from sample data, but also the estimation of its error. When the number of potential feature sets is large, the key issue is whether a particular feature set provides good classification. A key concern is the precision with which the error of the designed classifier estimates the error of the optimal classifier. When data are limited, an error estimator may have a large variance and therefore may often be low. This can produce many feature sets and classifiers with low error estimates. The algorithm we use mitigates this problem by applying the bolstered error estimation as disclosed in Braga-Neto et al. (2004) Pattern Recognition 37, 1267-1281, incorporated in its entirety by reference. It has advantages with respect to commonly used error estimators such as re-substitution, cross-validation, and bootstrap methods for error estimation in terms of speed and accuracy (bias and variance). The basic idea is to bolster the original empirical distribution of the available data by means of suitable bolstering kernels placed at each datapoint location. The error can be computed analytically in some cases, such as in the case of LDA. The relatively small size of the set A21∩B allows for a comparing the errors of the potential feature sets of size 1, 2, and 3. The results of those comparisons are discussed in the next section.
Results and Discussion
Classification Analysis
[0049]In this feasibility study, our aim was to develop mRNA expression patterns that may establish the basis of a new non-invasive molecular diagnostic method. For this purpose, we applied an algorithm to 12 different pairs of classes arising from the experimental design as described in FIG. 1. The number of genes/features for each linear classifier was limited to three, which allowed for an exhaustive search. Biologists are often interested in finding individual genes that have some influence on the system under study. In the context of classification, this approach translates into finding single-gene classifiers. To illustrate how our approach compares to the traditional statistical analysis, we considered the classes (+IR, +Polyps) vs (-IR, -Polyps) at bl1. The top 10 feature sets of size 1 were compared to the differentially expressed genes in the set A21∩B, where t-tests were performed using the log2-transformed raw intensity values. The comparison revealed that 7 out of the 10 top 1-feature sets (genes) identified by the linear (LDA) classifier also had p-values <0.05. This should not be surprising because individual, differentially expressed genes are often used to discriminate between phenotypes. The results disclosed herein show that there are several cases where single genes can provide good classification in terms of the error estimate. However, when comparing these results to the two-feature classification for the same two classes, a trend is observed as described in Martins et al. (2008) Journal of Selected Topics in Signal Processing 2, 424-439, incorporated in relevant parts by reference. The concept of intrinsically multivariate predictive (IMP) genes was introduced based on observations where expression profiles of a group of genes predicts the target, e.g. a gene or a phenotype) with great accuracy while any proper subset of these genes produces poor prediction.
[0050]The concept of intrinsically multivariate predictive (IMP) genes is shown where expression profiles of a group of genes predict the phenotype. Results represent a linear classification of (+IR, +Polyps) subjects (◯) versus (-IR, -Polyps) subjects (Δ) at BL1. UCP2 and HOXA3 were used as individual one-feature sets (A and B) as compared with both genes together as a two-feature set (C). The bolstered error is 0.2784, 0.4882, and 0.1415 for (A), (B), and (C), respectively. Specifically, the expression profiles of a group of genes predicted the target (either a gene or a phenotype) with greater accuracy relative to any proper subset of these genes. For example, single-gene classifiers (one-feature) based on either the Homeoboxpr otein-A3 (HOXA3) or uncoupling protein-2 (UCP2) performed very poorly when discriminating between (+IR, +Polyps) and (-IR, -Polyps) at BL1 (Table II; FIGS. 2A and B). Interestingly, HOXA3 was close to the worst predictor of all of the available 97 genes (ranked 94). In comparison, when combined as a two-feature set, UCP2 and HOXA3 provided one of the best two-feature classifiers (one misclassified data point only) among all of the 4,656 possible two-gene sets (Table II; 3C). These data clearly illustrate why complex phenotypes can be explained better by multivariate feature sets.
[0051]To identify sets of genes that perform in a multivariate manner to provide strong classification, we specifically looked for pairs of genes that performed better than either of the genes individually, and triplets of genes that performed well and substantially better than the best-performing pair among the three, and so on. To estimate the improvements of the classification performance, we introduced two quantities for each feature set: εbolstered and Δ(εbolstered). εbolstered denotes the bolstered resubstitution error for the LDA classifier for the respective feature set, and Δ(εbolstered) denotes the largest decrease in error for the full feature set relative to all of its subsets. The feature sets were initially ranked based on the value of εbolstered, and subsequently ranked again based on the improvement Δ(εbolstered). For multiple-gene classifiers, we focused on feature sets with high rank in both lists. Along these lines, we designed two-feature classifiers for the classification of (+IR, +Polyps) versus (-IR, -Polyps) data at baseline BL1; (-IR, -Polyps, control diet) versus (-IR, -Polyps, legume diet) data at the end of the two diet periods DP1 and DP2; (+IR, +Polyps) versus (-IR, -Polyps) at baselines BL1 and BL2; (+Polyps) versus (-Polyps) at baselines BL1 and BL2; and (+IR) versus (-IR) at all of the time points. Table II and Table III describe the best (according to this ranking procedure) feature sets identified for the first two of these classification categories, and FIGS. 3A and B shows representative multivariate classifiers.
[0052]The results in FIG. 4 show that the two factors, IR and history of adenomas, should be considered in tandem when determining the risk for the patient. For example, combining baseline samples (BL1 and BL2) increased the classification error, indicating complications related to the crossover design (FIG. 4A). Similarly, the three-feature set LDA classifiers performed poorly when the classification was considered separately with respect to either one of the two experimental factors (IR) or (Polyps; FIGS. 4B and C). The advantage of reporting the results in this way is that multivariate discriminatory power is revealed. This is clearly shown in Table II with regard to HOXA3. The gene did not appear on the single-gene list, indicating that the error of the respective classifier exceeded 0.3 (εbolstered=0.4882). However, it appeared with UCP2, 14-3-3ζ (YWHAZ), insulin growth factor receptor-I (IGF1R), beclin-1 (BECN1), and mitogen-activated protein kinase-11 (MAPK11) genes in the two-gene and three-gene lists, which improved classification error. Interestingly, members of the homeoprotein family of transcription factors (HOXA3 and HOXC6) are developmental regulators of gastrointestinal growth, patterning, and differentiation (Fujiki K, Duerr E, Kikuchi H, et al. Hoxc6 is overexpressed in gastrointestinal carcinoids and interacts with JunD to regulate tumor growth. Gastroenterology 2008; 135:907-16). It is also noteworthy that YWHAZ and IGF1R are capable of regulating apoptosis and cell adhesion (Sekharam M, Zhao H, Sun M, et al. Insulin-like growth factor 1 receptor enhances invasion and induces resistance to apoptosis of colon cancer cells through the Akt/Bcl-xL pathway. Cancer Res 2003; 63:7708-16, Niemantsverdriet M, Wagner K, Visser M, Backendorf C. Cellular functions of 14-3-3ζ in apoptosis and cell adhesion emphasize its oncogenic character. Oncogene 2008; 27:1315-9); UCP2 promotes chemoresistance in cancer cells and mitochondrial Ca2+ sequestration; BECN1 stimulates autophagy and inhibits tumor cell growth (Pattingre S, Espert L, Biard-Piechaczyk M, Codogno P. Regulation of macroautophagy by mTOR and Beclin 1 complexes. Biochimie 2008; 90:313-23); and MAPK11 (p38β) mediates response to inflammatory cytokines and cellular stress (Beardmore V A, Hinton H J, Eftychi C, et al. Generation and characterization of p38β (MAPK11) gene-targeted mice. Mol Cell Biol 2005; 25:10454-64). For comparative purposes, fold changes in select genes are presented in Table VIII.
TABLE-US-00001 TABLE I Sample Common Genes Classification Groups Size in A12 ∩C (+IR, +Polyps) VS (-IR, -Polyps) at BL1 12 97 (+IR, +Polyps) on Control VS (+IR, +Polyps) on Legume 11 103 (-IR, -Polyps) on Control VS (-IR, -Polyps) on Legume 12 145 (+IR, +Polyps) on Control VS (-IR, -Polyps) on Control 11 121 (+IR, +Polyps) on Legume VS (-IR, -Polyps) on Legume 12 114 (+IR, +Polyps) VS (-IR, -Polyps) at BL1 & BL2 21 92 (+Polyps) VS (-Polyps) at BL1 23 64 (+IR) VS (-IR) at BL1 23 64 (+Polyps) VS (-Polyps) at BL1 & BL2 41 59 (+Polyps) on Control VS (+Polyps) on Legume 21 87 (+IR) on Control VS (+IR) on Legume 23 74 (+IR) VS (-IR) at all time points 86 54
TABLE-US-00002 TABLE II Gene names εbolstered Δ(εbolstered) IGF1R 0.1094 CDK4 0.1200 BECN1 0.1223 NOS3 0.1436 ALOX12B 0.1477 NOS3, WNT1 0.1277 0.2656 HOXA3, UCP2 0.1415 0.3467 IGF1R, WNT1 0.1484 0.2449 ID2, IGF1R 0.1486 0.3139 HOXA3, YWHAZ 0.1503 0.3379 HOXA3, IGF1R 0.1513 0.3369 BECN1, HOXA3, MAPK11 0.0891 0.3991 BECN1, HOXA3, IGF1R 0.0907 0.3975 HOXA3, MAPK11, YWHAZ 0.0935 0.3947 HOXA3, HOXC6, MAPK11 0.0941 0.3941 HOXA3, MAPK11, NOS3 0.0987 0.3895 HOXA3, UCP2, YWHAZ 0.1001 0.3881 HOXA3, IGF1R, YWHAZ 0.1006 0.3876 BECN1, DAPK1, IGF1R 0.1012 0.3768 HOXA3, HOXC6, TJP1 0.1023 0.3859 HOXA3, HOXC6, IGF1R 0.1079 0.3803
TABLE-US-00003 TABLE III Gene names εbolstered Δ(εbolstered) TGFB3 0.2350 FOXP4 0.2586 TP53 0.2970 BAD 0.3009 FOXO1A 0.3033 DAPK1, HOXA3 0.1829 0.3760 BAD, LYZL6 0.2275 0.2321 IGF1R, LEF1 0.2315 0.2488 DAPK1, FOXM1 0.2371 0.2336 IGF2, TGFB3 0.2455 0.2814 LEF1, TGFB3 0.2459 0.2344 DAPK1, TP53 0.2642 0.2426 APC, CDC42 0.2650 0.2564 DAPK1, HOXA3, TGFB3 0.1675 0.3914 DAPK1, LEF1, TGFB3 0.1799 0.3004 DAPK1, HOXA3, LEF1 0.1854 0.3735 DAPK1, HOXA3, SELP 0.1887 0.3702 CAMK2A, DAPK1, HOXA3 0.1922 0.3667 DAPK1, HOXA3, SPARC 0.1944 0.3645 DAPK1, HOXA3, PRKACG 0.1969 0.3620 DAPK1, HOXA3, SFRP5 0.1982 0.3607 BAD, FOXE3, PTK2 0.2003 0.3018 CA5B, DAPK1, HOXA3 0.2028 0.3561 CD44, DAPK1, HOXA3 0.2052 0.3537 BAD, FOXP4, GSS 0.2056 0.3112 BAD, FOXE3, PTK2B 0.2072 0.3187 APC2, DAPK1, HOXA3 0.2117 0.3472
TABLE-US-00004 TABLE IV Subject ID Study Group BL 1 End DP 1 BL 2 End DP 2 Subject ID DP1 DP2 LEG 01 3 x x x x LEG 01 L C LEG 02 2 x x x x LEG 02 C L LEG 03 1 x x x x LEG 03 C L LEG 04 3 x x x x LEG 04 L C LEG 05 2 x x x x LEG 05 L C LEG 06 4 x x x x LEG 06 C L LEG 08 3 x x x x LEG 08 C L LEG 09 2 x x x x LEG 09 L C LEG 10 2 x x m x LEG 10 C L LEG 11 4 x x x x LEG 11 L C LEG 13 1 x x m x LEG 13 C L LEG 14 3 x x x x LEG 14 C L LEG 18 3 x x x x LEG 18 L C LEG 19 4 x x x x LEG 19 C L LEG 24 4 x x x x LEG 24 L C LEG 26 4 x x x x LEG 26 C L LEG 27 4 x x x x LEG 27 L C LEG 33 2 x x m x LEG 33 C L LEG 44 1 x x m x LEG 44 L C LEG 47 1 x x x x LEG 47 C L LEG 49 1 x x m x LEG 49 L C LEG 54 1 x x x m LEG 54 L C LEG 65 3 x x x x LEG 65 C L x = array was processed; m = missing sample L = Legume diet: C = American control diet Study Group: 1 = +insulin resistance/+polyps; 2 = -insulin resistance/+polyps 3 = +insulin resistance/-polyps: 4 = -insulin resistance/-polyps
TABLE-US-00005 TABLE V Gene PROBE_NAME NCBI_ACC abbreviation GE55294 NM_012138.2 AATF GE57835 NM_000927.3 ABCB1 GE82449 NM_018849.1 ABCB4 GE60435 NM_000017.1 ACADS GE54239 NM_004458.1 ACSL4 GE59148 NM_003816.2 ADAM9 GE53921 NM_006988.3 ADAMTS1 GE61341 NM_005099.3 ADAMTS4 GE80938 NM_000697.1 ALOX12 GE54325 NM_001139.1 ALOX12B GE80985 NM_001140.3 ALOX15 GE59425 NM_001141.1 ALOX15B GE57484 NM_000698.1 ALOX5 GE54404 NM_005503.2 APBA2 GE58061 NM_000038.3 APC GE53318 NM_005883.1 APC2 GE58776 NM_001641.2 APEX1 GE59705 NM_000045.2 ARG1 GE59481 NM_001172.3 ARG2 GE62666 NM_005172.1 ATOH1 GE57035 NM_001686.3 ATP5B GE53329 NM_006095.1 ATP8A1 GE61790 NM_003502.2 AXIN1 GE58341 NM_004655.1 AXIN2 GE61740 NM_032989.1 BAD GE60444 NM_001188.2 BAK1 GE57679 NM_004324.3 BAX GE79818 NM_003921.2 BCL10 GE62993 NM_004049.2 BCL2A1 GE60374 NM_138578.1 BCL2L1 GE80623 NM_020396.2 BCL2L10 GE890567 NM_138622.2 BCL2L11 GE83665 NM_138639.1 BCL2L12 GE61161 NM_015367.2 BCL2L13 GE83170 NM_030766.1 BCL2L14 GE57412 NM_004050.2 BCL2L2 GE79828 NM_003766.2 BECN1 GE59117 NM_001166.3 BIRC2 GE612545 AI873224.1 BIRC4 GE59394 NM_001168.1 BIRC5 GE57870 NM_001200.1 BMP2 GE59170 NM_001202.2 BMP4 GE55306 NM_017589.2 BTG4 GE58358 NM_005181.2 CA3 GE58106 NM_000717.2 CA4 GE58264 NM_001739.1 CA5A GE53590 NM_007220.2 CA5B GE53630 NM_015981.2 CAMK2A GE62184 NM_001221.2 CAMK2D GE58946 NM_032991.1 CASP3 GE61602 NM_001752.1 CAT GE54670 NM_001753.3 CAV1 GE57886 NM_031966.2 CCNB1 GE795552 AW439398.1 CCND1 GE79118 NM_013230.1 CD24 GE59805 NM_001001389.1 CD44 GE62023 NM_212530.1 CDC25B GE57603 NM_001791.2 CDC42 GE57732 NM_004360.2 CDH1 GE59262 NM_001257.2 CDH13 GE54070 NM_004642.2 CDK2AP1 GE57828 NM_000075.2 CDK4 GE58861 NM_000389.2 CDKN1A GE81344 NM_004064.2 CDKN1B GE80886 NM_000076.1 CDKN1C GE59038 NM_058195.2 CDKN2A GE81459 L36844.1 CDKN2B GE79397 NM_001804.1 CDX1 GE59216 NM_001265.2 CDX2 GE59735 NM_001712.2 CEACAM1 GE62998 NM_001815.1 CEACAM3 GE81072 NM_001817.1 CEACAM4 GE81388 NM_004363.1 CEACAM5 GE79541 NM_002483.3 CEACAM6 GE54005 NM_006890.1 CEACAM7 GE579012 NM_001816.2 CEACAM8 GE87279 NM_020219.2 CEAL1 GE742535 NM_033377.1 CGB1 GE62911 NM_033142.1 CGB7 GE54896 AY358652.1 CLDN1 GE79293 NM_001306.2 CLDN3 GE54025 NM_003277.2 CLDN5 GE56220 NM_199328.1 CLDN8 GE54150 NM_130444.1 COL18A1 GE80889 NM_000089.3 COL1A2 GE59553 NM_001861.2 COX4I1 GE81079 NM_001862.2 COX5B GE61834 NM_015513.2 CRELD1 GE61173 NM_004385.2 CSPG2 GE54206 NM_004386.1 CSPG3 GE60186 NM_001897.3 CSPG4 GE54549 NM_006574.2 CSPG5 GE54158 NM_005445.2 CSPG6 GE60116 NM_001904.2 CTNNB1 GE63376 NM_001511.1 CXCL1 GE60012 NM_004938.1 DAPK1 GE54486 NM_014326.2 DAPK2 GE53147 NM_001348.1 DAPK3 GE79017 NM_020548.4 DBI GE60014 NM_005215.1 DCC GE55123 NM_004942.2 DEFB4 GE53874 NM_015881.4 DKK3 GE61043 NM_004413.1 DPEP1 GE54709 NM_004147.3 DRG1 GE60381 NM_001943.1 DSG2 GE56426 NM_198057.1 DSIPI GE61271 NM_004417.2 DUSP1 GE59081 NM_001948.2 DUT GE59467 U80811.1 EDG2 GE54109 NM_004720.4 EDG4 GE61188 NM_012152.1 EDG7 GE56653 NM_004429.3 EFNB1 GE58272 NM_001963.2 EGF GE59632 NM_005228.3 EGFR GE59464 NM_015409.2 EP400 GE80071 NM_004441.3 EPHB1 GE54191 NM_004442.5 EPHB2 GE62563 NM_004444.4 EPHB4 GE57332 NM_004445.2 EPHB6 GE54479 NM_194356.1 EPIM GE57810 NM_004448.2 ERBB2 GE59651 NM_000125.1 ESR1 GE62899 NM_016946.3 F11R GE81021 NM_001443.1 FABP1 GE79151 NM_000134.2 FABP2 GE80868 NM_004102.2 FABP3 GE79086 NM_001444.1 FABP5 GE55154 NM_001446.3 FABP7 GE60092 NM_003824.2 FADD GE59061 NM_004104.4 FASN GE62924 NM_004111.4 FEN1 GE54695 NM_003862.1 FGF18 GE79526 NM_005130.3 FGFBP1 GE59130 NM_004496.2 FOXA1 GE80477 NM_021784.3 FOXA2 GE81402 NM_004497.2 FOXA3 GE81766 NM_012182.1 FOXB1 GE80442 NM_001453.1 FOXC1 GE61182 D63042.1 FOXC2 GE59268 NM_004472.1 FOXD1 GE80316 NM_004474.2 FOXD2 GE614874 NM_012183.1 FOXD3 GE561268 NM_207305.1 FOXD4 GE59533 NM_004473.3 FOXE1 GE81767 NM_012186.1 FOXE3 GE61775 NM_001451.1 FOXF1 GE58940 NM_001452.1 FOXF2 GE59988 NM_005249.3 FOXG1B GE79568 NM_003923.1 FOXH1 GE57620 NM_012188.3 FOXI1 GE817567 AI684913.1 FOXJ1 GE56857 NM_018416.2 FOXJ2 GE53710 NM_014947.3 FOXJ3 GE61025 NM_181431.1 FOXK2 GE481743 NM_005250.1 FOXL1 GE79861 NM_023067.2 FOXL2 GE59391 NM_021953.2 FOXM1 GE80086 NM_003593.2 FOXN1 GE573609 NM_213596.1 FOXN4 GE54250 NM_002015.2 FOXO1A GE54251 NM_001455.2 FOXO3A GE620465 AI732568.1 FOXP1 GE771702 NM_148899.1 FOXP2 GE503510 NM_014009.2 FOXP3 GE55167 BM679319.1 FOXP4 GE83634 NM_033260.2 FOXQ1 GE573639 NM_181721.1 FOXR1 GE525901 NM_198451.1 FOXR2 GE61934 NM_002029.3 FPR1 GE81028 NM_001469.3 G22P1 GE59654 NM_000402.2 G6PD GE57684 NM_001924.2 GADD45A GE82030 NM_015675.1 GADD45B GE62138 NM_006705.2 GADD45G GE81449 NM_004864.1 GDF15 GE80927 NM_000581.2 GPX1 GE81111 NM_002083.2 GPX2 GE695561 AW129281.1 GPX3 GE81112 NM_002084.2 GPX3 GE81113 NM_002085.1 GPX4 GE80647 NM_003996.2 GPX5 GE54767 NM_015696.2 GPX7 GE79962 AF154054.1 GREM1 GE88366 CA437861.1 GREM2 GE61362 NM_000177.3 GSN GE54991 NM_000637.2 GSR GE59100 NM_000178.2 GSS GE79099 NM_145740.2 GSTA1 GE503167 AI762244.1 GSTA2 GE54166 NM_000847.3 GSTA3 GE61329 NM_001512.2 GSTA4 GE516052 NM_153699.1 GSTA5 GE61688 NM_000561.2 GSTM1 GE835116 NM_000849.3 GSTM3 GE57545 NM_000851.2 GSTM5 GE61334 NM_000852.2 GSTP1 GE60049 NM_000853.1 GSTT1 GE79395 NM_033553.2 GUCA2A GE79398 NM_007102.1 GUCA2B GE537019 NM_005524.2 HES1 GE62425 NM_000601.3 HGF GE82322 NM_018194.1 HHAT GE59057 NM_001530.2 HIF1A GE60472 NM_005338.4 HIP1 GE568338 NM_003493.2 HIST3H3 GE659143 NM_145904.1 HMGA1 GE57571 NM_000191.1 HMGCL GE59927 NM_002130.4 HMGCS1 GE60087 NM_005518.2 HMGCS2 GE61857 NM_002133.1 HMOX1 GE79731 NM_005522.3 HOXA1 GE88138 NM_153715.1 HOXA10 GE79995 NM_005523.4 HOXA11 GE80920 NM_000522.2 HOXA13 GE667398 NM_006735.3 HOXA2 GE83160 NM_030661.3 HOXA3 GE80064 NM_002141.2 HOXA4 GE57892 NM_019102.2 HOXA5 GE479776 NM_024014.2 HOXA6 GE483668 NM_006896.2 HOXA7 GE54105 NM_002142.3 HOXA9 GE59739 NM_002144.2 HOXB1 GE81628 NM_006361.2 HOXB13 GE59738 NM_002145.2 HOXB2 GE59740 NM_002146.3 HOXB3 GE56717 NM_024015.3 HOXB4 GE58143 NM_002147.2 HOXB5 GE82457 NM_156036.1 HOXB6 GE81403 NM_004502.2 HOXB7 GE79102 NM_024016.2 HOXB8 GE58746 NM_017409.2 HOXC10 GE497436 NM_014212.2 HOXC11 GE808308 NM_173860.1 HOXC12 GE80244 NM_017410.2 HOXC13 GE59694 NM_014620.2 HOXC4 GE59871 NM_018953.2 HOXC5 GE57846 NM_153693.1 HOXC6 GE812007 NM_022658.3 HOXC8 GE55497 NM_006897.1 HOXC9 GE82840 NM_024501.1 HOXD1 GE81125 NM_002148.2 HOXD10 GE82602 NM_021192.2 HOXD11 GE729613 NM_021193.2 HOXD12 GE80921 NM_000523.2 HOXD13 GE881059 BQ941558.1 HOXD4
GE59727 NM_019558.2 HOXD8 GE61129 NM_014213.2 HOXD9 GE57789 NM_000860.3 HPGD GE57461 NM_005343.2 HRAS GE53171 BC041412.2 HSPA12A GE811123 BX116887.1 HSPA12B GE82101 NM_016299.1 HSPA14 GE81493 AK097113.1 HSPA1A GE81494 NM_005346.3 HSPA1B GE62810 NM_000201.1 ICAM1 GE81127 NM_002166.4 ID2 GE59822 NM_000618.2 IGF1 GE80962 NM_000875.2 IGF1R GE79183 NM_000612.2 IGF2 GE508441 BC034757.1 IHH GE54386 W52507.1 IKBKAP GE62527 NM_001556.1 IKBKB GE61317 NM_014002.2 IKBKE GE54691 NM_003639.2 IKBKG GE61058 NM_000572.2 IL10 GE80144 NM_000641.2 IL11 GE563350 NM_000575.3 IL1A GE79235 NM_000576.2 IL1B GE902998 NM_000586.2 IL2 GE63369 NM_020525.4 IL22 GE53760 NM_016584.2 IL23A GE59635 NM_000417.1 IL2RA GE59660 NM_000600.1 IL6 GE61911 NM_002211.2 ITGB1 GE54170 NM_181468.1 ITGB4BP GE59788 NM_002231.2 KAI1 GE61879 NM_000238.2 KCNH2 GE58431 NM_007035.2 KERA GE53820 BG912905.1 KIAA1199 GE59676 NM_000222.1 KIT GE86000 NM_004235.3 KLF4 GE61031 NM_033360.2 KRAS2 GE79418 BU153499.1 KRT8 GE60355 NM_005562.1 LAMC2 GE80131 NM_002295.2 LAMR1 GE80813 NM_002300.3 LDHB GE56173 NM_016269.2 LEF1 GE60548 NM_002306.1 LGALS3 GE57621 NM_005567.2 LGALS3BP GE61853 NM_003667.2 LGR5 GE60093 NM_013975.1 LIG3 GE61118 NM_000627.2 LTBP1 GE54721 NM_006330.2 LYPLA1 GE79416 NM_000239.1 LYZ GE87934 NM_032517.3 LYZL1 GE573861 NM_144634.2 LYZL4 GE54752 NM_020426.1 LYZL6 GE534117 NM_002745.2 MAPK1 GE62730 NM_002753.2 MAPK10 GE88364 NM_002751.5 MAPK11 GE62595 NM_002969.3 MAPK12 GE54058 NM_002754.3 MAPK13 GE57735 NM_001315.1 MAPK14 GE79221 NM_002746.1 MAPK3 GE84984 R87970.1 MAPK4 GE79439 NM_002748.2 MAPK6 GE81188 NM_139033.1 MAPK7 GE57700 NM_139046.1 MAPK8 GE81189 NM_002752.3 MAPK9 GE59858 NM_002382.3 MAX GE57107 NM_004526.2 MCM2 GE80542 NM_130799.1 MEN1 GE57468 J02958.1 MET GE57913 NM_002412.2 MGMT GE80049 NM_145792.1 MGST1 GE63001 NM_032390.3 MKI67IP GE58891 NM_000249.2 MLH1 GE80495 NM_002421.2 MMP1 GE518683 NM_002427.2 MMP13 GE79854 NM_002422.2 MMP3 GE57525 NM_004994.1 MMP9 GE81153 NM_002434.1 MPG GE58211 NM_000251.1 MSH2 GE59286 NM_002439.1 MSH3 GE60542 NM_000179.1 MSH6 GE53323 NM_002442.2 MSI1 GE88536 N26272.1 MSI2 GE57533 NM_182741.1 MUC1 GE81158 NM_002457.1 MUC2 GE86707 AB038784.1 MUC3B GE82366 NM_018406.2 MUC4 GE60413 AJ001402.1 MUC5AC GE564339 U78550.1 MUC5B GE59609 AK096772.1 MUC6 GE57582 NM_005962.3 MXI1 GE57537 NM_002467.2 MYC GE81665 NM_006656.4 NEU3 GE57992 NM_003998.2 NFKB1 GE81163 NM_002502.2 NFKB2 GE583888 NM_145285.1 NKX2-3 GE58970 NM_000620.1 NOS1 GE61880 NM_000625.3 NOS2A GE57703 NM_000603.3 NOS3 GE58433 NM_007052.3 NOX1 GE57330 NM_002519.1 NPAT GE79523 NM_002524.2 NRAS GE59456 NM_002528.4 NTHL1 GE62798 NM_004822.1 NTN1 GE79384 NM_006183.3 NTS GE79065 NM_002538.2 OCLN GE59733 NM_002539.1 ODC1 GE58739 NM_016819.2 OGG1 GE80094 NM_002583.2 PAWR GE61312 NM_002592.2 PCNA GE61229 NM_002634.2 PHB GE55121 NM_004570.2 PIK3C2G GE85962 NM_181523.1 PIK3R1 GE57869 NM_000300.2 PLA2G2A GE62645 NM_005090.1 PLA2G4B GE54546 NM_003706.1 PLA2G4C GE577920 AB090876.1 PLA2G4D GE55263 NM_004253.2 PLAA GE80967 NM_000930.2 PLAT GE59641 NM_002658.2 PLAU GE80529 NM_002659.2 PLAUR GE58900 NM_006225.1 PLCD1 GE86096 NM_133373.2 PLCD3 GE83496 NM_032726.2 PLCD4 GE81175 NM_002660.2 PLCG1 GE57955 NM_002661.1 PLCG2 GE54324 NM_002663.2 PLD2 GE58954 NM_000535.2 PMS2 GE61315 CD356988.1 POLB GE60200 NM_002693.1 POLG GE54124 NM_003711.2 PPAP2A GE86713 NM_177414.1 PPAP2B GE54290 NM_003712.2 PPAP2C GE56066 NM_006238.2 PPARD GE54254 NM_005037.3 PPARG GE62667 NM_013261.2 PPARGC1A GE59698 NM_002730.3 PRKACA GE652786 AW467479.1 PRKACB GE577011 NM_002732.2 PRKACG GE61216 M33336.1 PRKAR1A GE58041 NM_002735.1 PRKAR1B GE57918 NM_002736.2 PRKAR2B GE86264 NM_002737.2 PRKCA GE59687 NM_002738.5 PRKCB1 GE57042 NM_006254.3 PRKCD GE611116 AK025126.1 PRKCE GE57971 NM_006255.3 PRKCH GE57727 L33881.1 PRKCI GE79759 NM_006257.2 PRKCQ GE62614 NM_006904.6 PRKDC GE54213 NM_006017.1 PROM1 GE57041 NM_000952.3 PTAFR GE59570 NM_000314.2 PTEN GE79421 NM_000955.2 PTGER1 GE58989 NM_000956.2 PTGER2 GE80971 NM_198714.1 PTGER3 GE57688 NM_000958.2 PTGER4 GE55312 NM_004878.3 PTGES GE87476 NM_198938.1 PTGES2 GE54054 NM_000959.2 PTGFR GE53970 NM_020440.2 PTGFRN GE57997 M59979.1 PTGS1 GE62312 NM_000963.1 PTGS2 GE79453 NM_005607.3 PTK2 GE59167 NM_173174.1 PTK2B GE57124 NM_006908.3 RAC1 GE56475 NM_002878.2 RAD51L3 GE58929 NM_002879.2 RAD52 GE57879 NM_002890.1 RASA1 GE81207 NM_002895.2 RBL1 GE60009 NM_005611.2 RBL2 GE58291 NM_002899.2 RBP1 GE57895 NM_002909.3 REG1A GE61112 NM_002908.2 REL GE61225 BC033522.1 RELA GE58104 NM_006509.2 RELB GE61154 X52773.1 RXRA GE59677 NM_002964.3 S100A8 GE80079 NM_002965.2 S100A9 GE87242 NM_133491.2 SAT2 GE53772 NM_005063.4 SCD GE82995 NM_024906.1 SCD4 GE58925 NM_002979.3 SCP2 GE60412 NM_002997.4 SDC1 GE57514 NM_002998.3 SDC2 GE56057 NM_000450.1 SELE GE57883 NM_000655.2 SELL GE58293 NM_003005.2 SELP GE62796 NM_000295.3 SERPINA1 GE58697 NM_016186.1 SERPINA10 GE88319 BX248259.1 SERPINA11 GE87109 NM_173850.2 SERPINA12 GE60232 NM_002575.1 SERPINB2 GE57824 NM_000602.1 SERPINE1 GE79528 NM_006142.3 SFN GE54530 NM_003012.3 SFRP1 GE527352 NM_003013.2 SFRP2 GE62558 NM_003015.2 SFRP5 GE619667 NM_000193.2 SHH GE62087 NM_021805.1 SIGIRR GE81228 NM_003051.2 SLC16A1 GE57541 NM_006516.1 SLC2A1 GE56147 AI792874.1 SLC5A12 GE558682 NM_145913.2 SLC5A8 GE54526 NM_004787.1 SLIT2 GE60408 NM_003071.2 SMARCA3 GE54831 NM_005631.3 SMO GE59855 NM_000543.3 SMPD1 GE58315 NM_003877.3 SOCS2 GE79683 NM_000454.4 SOD1 GE80932 NM_000636.1 SOD2 GE545368 NM_003118.2 SPARC GE61335 NM_000582.2 SPP1 GE61402 NM_003150.3 STAT3 GE83532 NM_032811.1 TBRG1 GE57183 NM_201636.1 TBXA2R GE58073 NM_003199.1 TCF4 GE80031 NM_003219.1 TERT GE81248 NM_003220.1 TFAP2A GE57647 NM_003226.2 TFF3 GE59644 NM_000660.2 TGFB1 GE55238 NM_006022.2 TGFB1I4 GE81250 NM_003238.1 TGFB2 GE59720 NM_003239.1 TGFB3 GE61621 NM_000358.1 TGFBI GE578892 NM_003242.3 TGFBR2 GE80065 NM_003241.1 TGM4 GE78973 S78453.1 TIMP3 GE81254 NM_003257.2 TJP1 GE54434 NM_003264.2 TLR2 GE59576 NM_003266.2 TLR4 GE54433 NM_003268.3 TLR5 GE56816 NM_016192.2 TMEFF2 GE59636 NM_000594.2 TNF GE79493 NM_021137.3 TNFAIP1 GE62903 NM_003844.2 TNFRSF10A GE54131 NM_003842.3 TNFRSF10B GE54132 NM_003841.2 TNFRSF10C GE54225 AF029761.1 TNFRSF10D GE562184 NM_003839.2 TNFRSF11A GE59899 NM_000043.3 TNFRSF6 GE62504 NM_032945.2 TNFRSF6B GE59115 NM_003810.2 TNFSF10 GE79109 NM_003701.2 TNFSF11 GE784965 NM_000639.1 TNFSF6 GE55270 D62608.1 TOLLIP GE58227 NM_000546.2 TP53 GE60333 NM_003722.3 TP73L GE79329 NM_003295.1 TPT1 GE61891 NM_003313.2 TSTA3 GE59639 NM_001071.1 TYMS GE840631 BF516171.1 TYMS
GE495741 NM_021833.3 UCP1 GE59585 NM_003355.2 UCP2 GE59501 NM_022803.1 UCP3 GE57479 NM_000376.1 VDR GE59158 NM_005429.2 VEGFC GE59707 NM_007127.1 VIL1 GE63384 NM_005430.2 WNT1 GE83129 NM_025216.2 WNT10A GE59476 NM_003394.2 WNT10B GE81421 NM_004626.2 WNT11 GE59699 NM_003391.1 WNT2 GE63181 NM_024494.1 WNT2B GE86328 NM_030753.3 WNT3 GE507271 NM_033131.2 WNT3A GE62675 NM_030761.3 WNT4 GE57670 BQ942339.1 WNT5A GE61657 NM_032642.2 WNT5B GE63133 W79066.1 WNT6 GE62528 NM_004625.3 WNT7A GE507187 NM_058238.1 WNT7B GE897460 NM_058244.1 WNT8A GE80654 NM_003393.2 WNT8B GE80087 NM_003395.1 WNT9A GE543960 NM_003396.1 WNT9B GE62786 NM_000380.2 XPA GE81853 NM_003404.3 YWHAB GE59242 NM_006761.3 YWHAE GE53664 NM_012479.2 YWHAG GE60439 NM_003405.2 YWHAH GE80214 NM_006826.2 YWHAQ GE844420 BF508115.1 YWHAZ GE81678 BQ945983.1 ZBTB33
TABLE-US-00006 TABLE VI Ajk ∩B k = 1.5 k = 2 k = 2.5 k = 3 j = 0 50 36 23 10 j = 1 65 54 35 18 j = 2 84 61 46 29 j = 3 94 70 51 37
TABLE-US-00007 TABLE VII Common Genes Classification Groups Sample Size in A12 ∩ B (+IR, +Polyps) VS (-IR, -Polyps) at BL1 12 97 (+IR, +Polyps) on Control VS (+IR, +Polyps) on Legume 11 103 (-IR, -Polyps) on Control VS (-IR, -Polyps) on Legume 12 145 (+IR, +Polyps) on Control VS (-IR, -Polyps) on Control 11 121 (+IR, +Polyps) on Legume VS (-IR, -Polyps) on Legume 12 114 (+IR, +Polyps) VS (-IR, -Polyps) at BL1 & BL2 21 92 (+Polyps) VS (-Polyps) at BL1 23 64 (+IR) VS (-IR) at BL1 23 64 (+Polyps) VS (-Polyps) at BL1 & BL2 41 59 (+Polyps) on Control VS (+Polyps) on Legume 21 87 (+IR) on Control VS (+IR) on Legume 23 74 (+IR) VS (-IR) at all time points 86 54
TABLE-US-00008 TABLE VIII Gene name p-value Fold change ALOX12B 0.1841 0.6486 BECN1 0.0580 0.5140 CDK4 0.0370 0.5787 DAPK1 0.0639 1.1258 HOXA3 0.0202 1.0712 HOXC6 0.0134 0.4352 ID2 0.0626 0.9413 IGF1R 0.0040 0.4537 MAPK11 0.6291 0.7521 NOS3 0.0285 0.4451 TJP1 0.0168 0.6092 uCP2 0.6330 0.7669 WNT1 0.7147 0.8290 YWHAZ 0.0298 0.4901
User Contributions:
comments("1"); ?> comment_form("1"); ?>Inventors list |
Agents list |
Assignees list |
List by place |
Classification tree browser |
Top 100 Inventors |
Top 100 Agents |
Top 100 Assignees |
Usenet FAQ Index |
Documents |
Other FAQs |
User Contributions:
Comment about this patent or add new information about this topic:
| People who visited this patent also read: | |
| Patent application number | Title |
|---|---|
| 20170018249 | SOURCE DRIVER INTEGRATED CIRCUIT AND GAMMA REFERENCE VOLTAGE GENERATOR |
| 20170018248 | METHOD AND ELECTRONIC DEVICE FOR DISPLAYING CONTENT |
| 20170018247 | IDLE FRAME COMPRESSION WITHOUT WRITEBACK |
| 20170018246 | PIXEL CELL CIRCUITS OF COMPENSATION FEEDBACK VOLTAGE |
| 20170018245 | GATE DRIVING CIRCUIT AND DISPLAY APPARATUS HAVING THE SAME |
Images included with this patent application:
 |  |
 |  |
 |  |
 |  |
 |  |
 |  |
 |  |
 |  |
| Similar patent applications: | |
| Date | Title |
|---|---|
| 2009-01-15 | Methods for diagnosing renal disorders |
| 2010-09-30 | Methods for detecting urushiol-bearing plants |
| 2012-11-15 | Method of detecting raw pork and detection kit therefor |
| 2012-11-22 | Automated method and apparatus for detecting erroneous sample collection in clinical assays |
| 2009-07-02 | Methods for detection of cyclosporin a |
| New patent applications in this class: | |
| Date | Title |
|---|---|
| 2016-06-23 | Microfluidic transducer |
| 2016-06-16 | Compound for labeling sugar chain sample |
| 2016-05-19 | Rapid fluorescence tagging of glycans and other biomolecules with enhanced ms signals |
| 2016-05-19 | Method and system for imaging a molecular strand |
| 2016-04-28 | Apparatuses for sterilely delivering fluid |
| New patent applications from these inventors: | |
| Date | Title |
|---|---|
| 2010-10-28 | Compositions and methods for preventing and monitoring disease |
| Top Inventors for class "Chemistry: analytical and immunological testing" | |
| Rank | Inventor's name |
|---|---|
| 1 | Andreas Bergmann |
| 2 | Joachim Struck |
| 3 | Richard E. Reitz |
| 4 | Georg Hess |
| 5 | Tetsuo Nagano |