Patent application title: BIOMARKERS UPREGULATED IN PROSTATE CANCER
Inventors:
Isabelle Guyon (Berkeley, CA, US)
Assignees:
HEALTH DISCOVERY CORPORATION
IPC8 Class: AC12Q100FI
USPC Class:
435 4
Class name: Chemistry: molecular biology and microbiology measuring or testing process involving enzymes or micro-organisms; composition or test strip therefore; processes of forming such composition or test strip
Publication date: 2009-08-27
Patent application number: 20090215024
Inventors list |
Agents list |
Assignees list |
List by place |
Classification tree browser |
Top 100 Inventors |
Top 100 Agents |
Top 100 Assignees |
Usenet FAQ Index |
Documents |
Other FAQs |
Patent application title: BIOMARKERS UPREGULATED IN PROSTATE CANCER
Inventors:
ISABELLE GUYON
Agents:
PROCOPIO, CORY, HARGREAVES & SAVITCH LLP
Assignees:
HEALTH DISCOVERY CORPORATION
Origin: SAN DIEGO, CA US
IPC8 Class: AC12Q100FI
USPC Class:
435 4
Abstract:
Biomarkers are identified by analyzing gene expression data using support
vector machines (SVM) to rank genes according to their ability to
separate prostate cancer from normal tissue. Proteins expressed by
identified genes are detected in patient samples to screen, predict and
monitor prostate cancer.Claims:
1. A method for screening, predicting or monitoring prostate cancer
comprising:detecting within a patient sample from one to eight proteins
selected from the group consisting of PDZ and LIM5 (SEQ ID NO. 19),
UAP1/AgX1 antigen (SEQ ID NO. 20), HSPD1/chaperonin (SEQ ID NO. 21),
IMPDH2 (SEQ ID NO. 22), F5 (SEQ ID NO. 23), PPIB (SEQ ID NO. 24), RGS10
(SEQ ID NO. 25) and PYCR1 (SEQ ID NO. 28); andcomparing detected levels
of the from one to eight proteins to the same proteins in a normal
prostate sample;wherein increased of the proteins in the patient sample
is indicative of prostate cancer.
2. The method of claim 1, wherein the patient sample comprises serum and the protein comprises PDZ and LIM5 (SEQ ID NO. 19).
3. The method of claim 1, wherein the proteins are expressed within an apoptosis pathway and the proteins comprise UAP1/AgX1 antigen (SEQ ID NO. 20), IMPDH2 (SEQ ID NO. 22), PPIB (SEQ ID NO. 24) and RGS10 (SEQ ID NO. 25).
4. The method of claim 1, wherein the proteins are expressed within mitochondrial activity pathway and the proteins comprise UAP1/AgX1 antigen (SEQ ID NO. 20), HSPD1/chaperonin (SEQ ID NO. 21) and PYCR1 (SEQ ID NO. 28).
5. The method of claim 1, wherein the patient sample comprises semen and the protein comprises UAP1/AgX1 antigen (SEQ ID NO. 20).
6. A method for screening, predicting or monitoring prostate cancer comprising:detecting within a patient sample overexpression relative to normal of any combination of four proteins selected from the group consisting of PDZ and LIM5 (SEQ ID NO. 19), UAP1/AgX1 antigen (SEQ ID NO. 20), HSPD1/chaperonin (SEQ ID NO. 21), IMPDH2 (SEQ ID NO. 22), F5 (SEQ ID NO. 23), PPIB (SEQ ID NO. 24), RGS10 (SEQ ID NO. 25) and PYCR1 (SEQ ID NO. 28).
7. The method of claim 6, wherein the four proteins comprise PDZ and LIM5 (SEQ ID NO. 19), UAP1/AgX1 antigen (SEQ ID NO. 20), HSPD1/chaperonin (SEQ ID NO. 21) and IMPDH2 (SEQ ID NO. 22).
8. The method of claim 6, wherein the four proteins comprise PDZ and LIM5 (SEQ ID NO. 19), UAP1/AgX1 antigen (SEQ ID NO. 20), HSPD1/chaperonin (SEQ ID NO. 21) and F5 (SEQ ID NO. 23).
9. A method for screening, predicting or monitoring prostate cancer comprising:detecting within a patient sample overexpression relative to normal of the combination of three proteins consisting of PDZ and LIM5 (SEQ ID NO. 19), UAP1/AgX1 antigen (SEQ ID NO. 20), HSPD1/chaperonin (SEQ ID NO. 21).
Description:
RELATED APPLICATIONS
[0001]The present application claims priority to U.S. provisional Application No. 60/880,070, filed Feb. 2, 2007, and is a continuation-in-part of U.S. application Ser. No. 11/274,931, filed Nov. 14, 2005, which claims priority to each of U.S. Provisional Applications No. 60/627,626, filed Nov. 12, 2004, and No. 60/651,340, filed Feb. 9, 2005, and is a continuation-in-part of U.S. application Ser. No. 10/057,849, now issued as U.S. Pat. No. 7,117,188, which claims priority to each of U.S. Provisional Applications No. 60/263,696, filed Jan. 24, 2001, No. 60/298,757, filed Jun. 15, 2001, and No. 60/275,760, filed Mar. 14, 2001, and is a continuation-in-part of U.S. patent application Ser. No. 09/633,410, filed Aug. 7, 2000, now issued as U.S. Pat. No. 6,882,990, which claims priority to each of U.S. Provisional Applications No. 60/161,806, filed Oct. 27, 1999, No. 60/168,703, filed Dec. 2, 1999, No. 60/184,596, filed Feb. 24, 2000, No. 60/191,219, filed Mar. 22, 2000, and No. 60/207,026, filed May 25, 2000. Each of the above cited applications and patents is incorporated herein by reference.
FIELD OF THE INVENTION
[0002]The present invention relates to the use of learning machines to identify relevant patterns in datasets containing large quantities of gene expression data, and more particularly to biomarkers so identified for use in screening, predicting, and monitoring prostate cancer.
BACKGROUND OF THE INVENTION
[0003]Knowledge discovery is the most desirable end product of data collection. Recent advancements in database technology have lead to an explosive growth in systems and methods for generating, collecting and storing vast amounts of data. While database technology enables efficient collection and storage of large data sets, the challenge of facilitating human comprehension of the information in this data is growing ever more difficult. With many existing techniques the problem has become unapproachable. In particular, methods are needed for identifying patterns in biological systems as reflected in gene expression data.
[0004]A significant percentage of men (20%) in the U.S. are diagnosed with prostate cancer during their lifetime, with nearly 300,000 men diagnosed annually, a rate second only to skin cancer. However, only 3% of those die of the disease. About 70% of all diagnosed prostate cancers occur in men aged 65 years and older. Many prostate cancer patients have undergone aggressive treatments that can have life-altering side effects such as incontinence and sexual dysfunction. It is believed that a substantial portion of the cancers are over-treated. Currently, most early prostate cancer identification is done using prostate-specific antigen (PSA) screening, but few indicators currently distinguish between progressive prostate tumors that may metastasize and escape local treatment and indolent cancers of benign prostate hyperplasia (BPH). Further, some studies have shown that PSA is a poor predictor of cancer, instead tending to predict BPH, which requires no or little treatment.
[0005]There is an urgent need for new biomarkers for distinguishing between normal, benign and malignant prostate tissue and for predicting the size and malignancy of prostate cancer. Blood serum biomarkers, or biomarkers found in semen, would be particularly desirable for screening prior to biopsy, however, evaluation of gene expression microarrays from biopsied prostate tissue is also useful.
SUMMARY OF THE INVENTION
[0006]Gene expression data are analyzed using learning machines such as support vector machines (SVM) and ridge regression classifiers to rank genes according to their ability to separate prostate cancer from other prostate conditions including BPH and normal. Genes are identified that individually provide sensitivities and selectivities of better than 80% and, when combined in small groups, 90%, for separating prostate cancer from other prostate conditions.
[0007]An exemplary embodiment comprises methods and systems for detecting genes involved with prostate cancer and determination of methods and compositions for treatment of prostate cancer. In one embodiment, to improve the statistical significance of the results, supervised learning techniques can analyze data obtained from a number of different sources using different microarrays, such as the Affymetrix U95 and U133A GeneChip® chip sets.
BRIEF DESCRIPTION OF THE DRAWINGS
[0008]FIG. 1 is a functional block diagram illustrating an exemplary operating environment for an embodiment of the present invention.
[0009]FIG. 2 is a plot showing the results based on LCM data preparation for prostate cancer analysis.
[0010]FIG. 3 is a plot graphically comparing SVM-RFE of the present invention with leave-one-out classifier for prostate cancer.
[0011]FIGS. 4a-4d combined are a table showing the ranking of the top 200 genes for separating prostate tumor from other tissues.
[0012]FIGS. 5a-5o combined are two tables showing the top 200 genes for separating prostate cancer from all other tissues that were identified in each of the 2001 study and the 2003 study.
[0013]FIGS. 6a-6g combined are a table showing the top 200 genes for separating G3 and G4 tumor versus others using feature ranking by consensus between the 2001 study and the 2003 study.
[0014]FIG. 7 is a plot of performance as a function of number of genes selected.
[0015]FIG. 8 is a plot of the ROC curves for the 3 top RFE selected genes and the ROC of the combination, on test data.
[0016]FIG. 9 is a prior art diagram showing the KEGG pathway around gene AgX-1/UAP 1/SPAG2.
[0017]FIG. 10 is a dendogram showing gene expression clustering of mitochondrial genes.
[0018]FIG. 11 is a dendogram showing gene expression clustering of perixosome and cell adhesion genes.
[0019]FIG. 12 is a dendogram showing gene expression clustering of genes linked to cell proliferation and growth.
[0020]FIG. 13 is a dendogram showing gene expression clustering of genes linked to apoptosis or p53 pathway.
DETAILED DESCRIPTION OF THE PREFERRED EMBODIMENT
[0021]The present invention utilizes learning machine techniques, including support vector machines and ridge regression, to discover knowledge from gene expression data obtained by measuring hybridization intensity of gene and gene fragment probes on microarrays. The knowledge so discovered can be used for diagnosing and prognosing changes in biological systems, such as diseases. Preferred embodiments comprise identification of genes that will distinguish between different types of prostate disorders, such as benign prostate hyperplasy and cancer, and normal, and use of such information for decisions on treatment of patients with prostate disorders.
[0022]For purposes of the present invention, "gene" refers to the gene expression products corresponding to genes, gene fragments, ESTs and olionucleotides that are included on the Affymetrix microarrays used in the tests described in the examples. Identification of a gene by a GeneBank accession number (GAN), Unigene No. and/or gene name constitutes an express incorporation by reference of the record corresponding to that identifier in the National Center for Biotechnology Information (NCBI) databases, which is publicly accessible and well known to those of skill in the art.
[0023]The problem of selection of a small amount of data from a large data source, such as a gene subset from a microarray, is particularly solved using the methods described herein. Preferred methods described herein use support vector machine (SVM) methods based and recursive feature elimination (RFE), which is described in detail in U.S. Pat. No. 7,117,188, which is incorporated by reference. (It should be noted that "RFE-SVM" and "SVM-RFE" may be used interchangeably throughout the detailed description, however, both refer to the same technique.) In examining gene expression data to find determinative genes, these methods eliminate gene redundancy automatically and yield better and more compact gene subsets.
[0024]The data is input into computer system programmed for executing an algorithm using a learning machine for performing a feature selection and/or ranking, preferably a SVM-RFE. The SVM-RFE is run one or more times to generate the best feature selections, which can be displayed in an observation graph or listed in a table or other display format. (Examples of listings of selected features (in this case, genes) are included in many of the tables below.) The SVM may use any algorithm and the data may be preprocessed and postprocessed if needed. Preferably, a server contains a first observation graph that organizes the results of the SVM activity and selection of features.
[0025]The information generated by the SVM may be examined by outside experts, computer databases, or other complementary information sources. For example, if the resulting feature selection information is about selected genes, biologists or experts or computer databases may provide complementary information about the selected genes, for example, from medical and scientific literature. Using all the data available, the genes are given objective or subjective grades. Gene interactions may also be recorded.
[0026]FIG. 1 and the following discussion are intended to provide a brief and general description of a suitable computing environment for implementing biological data analysis according to the present invention. Although the system shown in FIG. 1 is a conventional personal computer 1000, those skilled in the art will recognize that the invention also may be implemented using other types of computer system configurations. The computer 1000 includes a central processing unit 1022, a system memory 1020, and an Input/Output ("I/O") bus 1026. A system bus 1021 couples the central processing unit 1022 to the system memory 1020. A bus controller 1023 controls the flow of data on the I/O bus 1026 and between the central processing unit 1022 and a variety of internal and external I/O devices. The I/O devices connected to the I/O bus 1026 may have direct access to the system memory 1020 using a Direct Memory Access ("DMA") controller 1024.
[0027]The I/O devices are connected to the I/O bus 1026 via a set of device interfaces. The device interfaces may include both hardware components and software components. For instance, a hard disk drive 1030 and a floppy disk drive 1032 for reading or writing removable media 1050 may be connected to the I/O bus 1026 through disk drive controllers 1040. An optical disk drive 1034 for reading or writing optical media 1052 may be connected to the I/O bus 1026 using a Small Computer System Interface ("SCSI") 1041. Alternatively, an IDE (Integrated Drive Electronics, i.e., a hard disk drive interface for PCs), ATAPI (ATtAchment Packet Interface, i.e., CD-ROM and tape drive interface), or EIDE (Enhanced IDE) interface may be associated with an optical drive such as may be the case with a CD-ROM drive. The drives and their associated computer-readable media provide nonvolatile storage for the computer 1000. In addition to the computer-readable media described above, other types of computer-readable media may also be used, such as ZIP drives, or the like.
[0028]A display device 1053, such as a monitor, is connected to the I/O bus 1026 via another interface, such as a video adapter 1042. A parallel interface 1043 connects synchronous peripheral devices, such as a laser printer 1056, to the I/O bus 1026. A serial interface 1044 connects communication devices to the I/O bus 1026. A user may enter commands and information into the computer 1000 via the serial interface 1044 or by using an input device, such as a keyboard 1038, a mouse 1036 or a modem 1057. Other peripheral devices (not shown) may also be connected to the computer 1000, such as audio input/output devices or image capture devices.
[0029]A number of program modules may be stored on the drives and in the system memory 1020. The system memory 1020 can include both Random Access Memory ("RAM") and Read Only Memory ("ROM"). The program modules control how the computer 1000 functions and interacts with the user, with I/O devices or with other computers. Program modules include routines, operating systems 1065, application programs, data structures, and other software or firmware components. In an illustrative embodiment, the learning machine may comprise one or more pre-processing program modules 1075A, one or more post-processing program modules 1075B, and/or one or more optimal categorization program modules 1077 and one or more SVM program modules 1070 stored on the drives or in the system memory 1020 of the computer 1000. Specifically, pre-processing program modules 1075A, post-processing program modules 1075B, together with the SVM program modules 1070 may comprise computer-executable instructions for pre-processing data and post-processing output from a learning machine and implementing the learning algorithm. Furthermore, optimal categorization program modules 1077 may comprise computer-executable instructions for optimally categorizing a data set.
[0030]The computer 1000 may operate in a networked environment using logical connections to one or more remote computers, such as remote computer 1060. The remote computer 1060 may be a server, a router, a peer to peer device or other common network node, and typically includes many or all of the elements described in connection with the computer 1000. In a networked environment, program modules and data may be stored on the remote computer 1060. Appropriate logical connections include a local area network ("LAN") and a wide area network ("WAN"). In a LAN environment, a network interface, such as an Ethernet adapter card, can be used to connect the computer to the remote computer. In a WAN environment, the computer may use a telecommunications device, such as a modem, to establish a connection. It will be appreciated that the network connections shown are illustrative and other devices of establishing a communications link between the computers may be used.
[0031]A preferred selection browser is preferably a graphical user interface that would assist final users in using the generated information. For example, in the examples herein, the selection browser is a gene selection browser that assists the final user is selection of potential drug targets from the genes identified by the SVM RFE. The inputs are the observation graph, which is an output of a statistical analysis package and any complementary knowledge base information, preferably in a graph or ranked form. For example, such complementary information for gene selection may include knowledge about the genes, functions, derived proteins, measurement assays, isolation techniques, etc. The user interface preferably allows for visual exploration of the graphs and the product of the two graphs to identify promising targets. The browser does not generally require intensive computations and if needed, can be run on other computer means. The graph generated by the server can be precomputed, prior to access by the browser, or is generated in situ and functions by expanding the graph at points of interest.
[0032]In a preferred embodiment, the server is a statistical analysis package, and in the gene feature selection, a gene selection server. For example, inputs are patterns of gene expression, from sources such as DNA microarrays or other data sources. Outputs are an observation graph that organizes the results of one or more runs of SVM RFE. It is optimum to have the selection server run the computationally expensive operations.
[0033]A preferred method of the server is to expand the information acquired by the SVM. The server can use any SVM results, and is not limited to SVM RFE selection methods. As an example, the method is directed to gene selection, though any data can be treated by the server. Using SVM RFE for gene selection, gene redundancy is eliminated, but it is informative to know about discriminant genes that are correlated with the genes selected. For a given number N of genes, only one combination is retained by SVM-RFE. In actuality, there are many combinations of N different genes that provide similar results.
[0034]A combinatorial search is a method allowing selection of many alternative combinations of N genes, but this method is prone to overfitting the data. SVM-RFE does not overfit the data. SVM-RFE is combined with supervised clustering to provide lists of alternative genes that are correlated with the optimum selected genes. Mere substitution of one gene by another correlated gene yields substantial classification performance degradation.
[0035]The examples included herein show preferred methods for determining the genes that are most correlated to the presence of cancer or can be used to predict cancer occurrance in an individual. There is no limitation to the source of the data and the data can be combinations of measurable criteria, such as genes, proteins or clinical tests, that are capable of being used to differentiate between normal conditions and changes in conditions in biological systems.
[0036]In the following examples, preferred numbers of genes were determined that result from separation of the data that discriminate. These numbers are not limiting to the methods of the present invention. Preferably, the preferred optimum number of genes is a range of approximately from 1 to 500, more preferably, the range is from 10 to 250, from 1 to 50, even more preferably the range is from 1 to 32, still more preferably the range is from 1 to 21 and most preferably, from 1 to 10. The preferred optimum number of genes can be affected by the quality and quantity of the original data and thus can be determined for each application by those skilled in the art.
[0037]Once the determinative genes are found by the learning machines of the present invention, methods and compositions for treatments of the biological changes in the organisms can be employed. For example, for the treatment of cancer, therapeutic agents can be administered to antagonize or agonize, enhance or inhibit activities, presence, or synthesis of the gene products. Therapeutic agents and methods include, but are not limited to, gene therapies such as sense or antisense polynucleotides, DNA or RNA analogs, pharmaceutical agents, plasmaphoresis, antiangiogenics, and derivatives, analogs and metabolic products of such agents.
[0038]Such agents may be administered via parenteral or noninvasive routes. Many active agents are administered through parenteral routes of administration, intravenous, intramuscular, subcutaneous, intraperitoneal, intraspinal, intrathecal, intracerebroventricular, intraarterial and other routes of injection. Noninvasive routes for drug delivery include oral, nasal, pulmonary, rectal, buccal, vaginal, transdermal and occular routes.
[0039]The following examples illustrate the results of using SVMs and other learning machines to identify genes associated with disorders of the prostate. Such genes may be used for diagnosis, treatment, in terms of identifying appropriate therapeutic agents, and for monitoring the progress of treatment.
Example 1
Isolation of Genes Involved with Prostate Cancer
[0040]Using the methods disclosed herein, genes associated with prostate cancer were isolated. Various methods of treating and analyzing the cells, including SVM, were utilized to determine the most reliable method for analysis.
[0041]Tissues were obtained from patients that had cancer and had undergone prostatectomy. The tissues were processed according to a standard protocol of Affymetrix and gene expression values from 7129 probes on the Affymetrix U95 GeneChip® were recorded for 67 tissues from 26 patients.
[0042]Specialists of prostate histology recognize at least three different zones in the prostate: the peripheral zone (PZ), the central zone (CZ), and the transition zone (TZ). In this study, tissues from all three zones are analyzed because previous findings have demonstrated that the zonal origin of the tissue is an important factor influencing the genetic profiling. Most prostate cancers originate in the PZ. Cancers originating in the PZ have worse prognosis than those originating in the TZ. Contemporary biopsy strategies concentrate on the PZ and largely ignore cancer in the TZ. Benign prostate hyperplasia (BPH) is found only in the TZ. BPH is a suitable control that may be used to compare cancer tissues in genetic profiling experiments. BPH is also convenient to use as control because it is abundant and easily dissected. However, controls coming from normal tissues microdissected with lasers in the CZ and PZ can also provide important complementary controls. The gene expression profile differences have been found to be larger between PZ-G4-G5 cancer and CZ-normal used as control, compared to PZ-normal used as control. A possible explanation comes from the fact that is presence of cancer, even normal adjacent tissues have undergone DNA changes (Malins et al, 2003-2004). Table 1 gives zone properties.
TABLE-US-00001 TABLE 1 Zone Properties PZ From apex posterior to base, surrounds transition and central zones. Largest zone (70% in young men). Largest number cancers (60-80%). Dysplasia and atrophy common in older men. CZ Surrounds transition zone to angle of urethra to bladder base. Second largest zone (25% in young men to 30% at 40 year old). 50% of PSA secreting epithelium. 5-20% of cancers. TZ Two pear shaped lobes surrounding the proximal urethra. Smallest zone in young men (less than 5%). Gives rise to BPH in older men. May expand to the bulk of the gland. 10-18% of cancers. Better cancer prognosis than PZ cancer.
[0043]Classification of cancer determines appropriate treatment and helps determine a prognosis. Cancer develops progressively from an alteration in a cell's genetic structure due to mutations, to cells with uncontrolled growth patterns. Classification is made according to the site of origin, histology (or cell analysis; called grading), and the extent of the disease (called staging).
[0044]Prostate cancer specialists classify cancer tissues according to grades, called Gleason grades, which are correlated with the malignancy of the diseases. The larger the grade, the worse the prognosis (chance of survival). In this study, tissues of grade 3 and above are used. Grades 1 and 2 are more difficult to characterize with biopsies and not very malignant. Grades 4 and 5 are not very differentiated and correspond to the most malignant cancers: for every 10% increase in the percent of grade 4/5 tissue found, there is a concomitant increase in post radical prostatectomy failure rate. Each grade is defined in Table 2.
TABLE-US-00002 TABLE 2 Grade Description 1 Single, separate, uniform, round glands closely packed with a definite rounded edge limiting the area of the tumor. Separation of glands at the periphery from the main collection by more than one gland diameter indicates a component of at least grade 2. Uncommon pattern except in the TZ. Almost never seen in needle biopsies. 2 Like grade 1 but more variability in gland shape and more stroma separating glands. Occasional glands show angulated or distorted contours. More common in TZ than PZ. Pathologists don't diagnose Gleason grades 1 or 2 on prostate needle biopsies since they are uncommon in the PZ, there is inter-pathologist variability and poor correlation with radical prostatectomy. 3 G3 is the most commonly seen pattern. Variation in size, shape (may be angulated or compressed), and spacing of glands (may be separated by >1 gland diameter). Many small glands have occluded or abortive lumens (hollow areas). There is no evidence of glandular fusion. The malignant glands infiltrate between benign glands. 4 The glands are fused and there is no intervening stroma. 5 Tumor cells are arranged in solid sheets with no attempts at gland formation. The presence of Gleason grade 5 and high percent carcinoma at prostatectomy predicts early death.
[0045]Staging is the classification of the extent of the disease. There are several types of staging methods. The tumor, node, metastases (TNM) system classifies cancer by tumor size (T), the degree of regional spread or lymph node involvement (N), and distant metastasis (M). The stage is determined by the size and location of the cancer, whether it has invaded the prostatic capsule or seminal vesicle, and whether it has metastasized. For staging, MRI is preferred to CT because it permits more accurate T staging. Both techniques can be used in N staging, and they have equivalent accuracy. Bone scintigraphy is used in M staging.
[0046]The grade and the stage correlate well with each other and with the prognosis. Adenocarcinomas of the prostate are given two grade based on the most common and second most common architectural patterns. These two grades are added to get a final score of 2 to 10. Cancers with a Gleason score of <6 are generally low grade and not aggressive.
[0047]The samples collected included tissues from the Peripheral Zone (PZ); Central Zone (CZ) and Transition Zone (TZ). Each sample potentially consisted of four different cell types: Stomal cells (from the supporting tissue of the prostate, not participating in its function); Normal organ cells; Benign prostatic hyperplasia cells (BPH); Dysplasia cells (cancer precursor stage) and Cancer cells (of various grades indicating the stage of the cancer). The distribution of the samples in Table 3 reflects the difficulty of obtaining certain types of tissues:
TABLE-US-00003 TABLE 3 Cancer Cancer Stroma Normal BPH Dysplasia G3 G4 G3 + G4 PZ 1 5 3 10 24 3 CZ 3 TZ 18
[0048]Benign Prostate Hyperplasia (BPH), also called nodular prostatic hyperplasia, occurs frequently in aging men. By the eighth decade, over 90% of males will have prostatic hyperplasia. However, in only a minority of cases (about 10%) will this hyperplasia be symptomatic and severe enough to require surgical or medical therapy. BPH is not a precursor to carcinoma.
[0049]It has been argued in the medical literature that TZ BPH could serve as a good reference for PZ cancer. The highest grade cancer (G4) is the most malignant. Part of these experiments are therefore directed towards the separation of BPH vs. G4.
[0050]Some of the cells were prepared using laser confocal microscopy (LCM which was used to eliminate as much of the supporting stromal cells as possible and provides purer samples.
[0051]Gene expression was assessed from the presence of mRNA in the cells. The mRNA is converted into cDNA and amplified, to obtain a sufficient quantity. Depending on the amount of mRNA that can be extracted from the sample, one or two amplifications may be necessary. The amplification process may distort the gene expression pattern. In the data set under study, either 1 or 2 amplifications were used. LCM data always required 2 amplifications. The treatment of the samples is detailed in Table 4.
TABLE-US-00004 TABLE 4 1 amplification 2 amplifications No LCM 33 14 LCM 20
[0052]The end result of data extraction is a vector of 7129 gene expression coefficients.
[0053]Gene expression measurements require calibration. A probe cell (a square on the array) contains many replicates of the same oligonucleotide (probe) that is a 25 bases long sequence of DNA. Each "perfect match" (PM) probe is designed to complement a reference sequence (piece of gene). It is associated with a "mismatch" (MM) probe that is identical except for a single base difference in the central position. The chip may contain replicates of the same PM probe at different positions and several MM probes for the same PM probe corresponding to the substitution of one of the four bases. This ensemble of probes is referred to as a probe set. The gene expression is calculated as:
Average Difference=1/pair num Σprobe set(PM-MM)
[0054]If the magnitude of the probe pair values is not sufficiently contrasted, the probe pair is considered dubious. Thresholds are set to accept or reject probe pairs. Affymetrix considers samples with 40% or over acceptable probe pairs of good quality. Lower quality samples can also be effectively used with the SVM techniques.
[0055]A simple "whitening" was performed as pre-processing, so that after pre-processing, the data matrix resembles "white noise". In the original data matrix, a line of the matrix represented the expression values of 7129 genes for a given sample (corresponding to a particular combination of patient/tissue/preparation method). A column of the matrix represented the expression values of a given gene across the 67 samples. Without normalization, neither the lines nor the columns can be compared. There are obvious offset and scaling problems. The samples were pre-processed to: normalize matrix columns; normalize matrix lines; and normalize columns again. Normalization consists of subtracting the mean and dividing by the standard deviation. A further normalization step was taken when the samples are split into a training set and a test set.
[0056]The mean and variance column-wise was computed for the training samples only. All samples (training and test samples) were then normalized by subtracting that mean and dividing by the standard deviation.
[0057]Samples were evaluated to determine whether LCM data preparation yields more informative data than unfiltered tissue samples and whether arrays of lower quality contain useful information when processed using the SVM technique.
[0058]Two data sets were prepared, one for a given data preparation method (subset 1) and one for a reference method (subset 2). For example, method 1=LCM and method 2=unfiltered samples. Golub's linear classifiers were then trained to distinguish between cancer and normal cases using subset 1 and another classifier using subset 2. The classifiers were then tested on the subset on which they had not been trained (classifier 1 with subset 2 and classifier 2 with subset 1).
[0059]If classifier 1 performs better on subset 2 than classifier 2 on subset 1, it means that subset 1 contains more information to do the separation cancer vs. normal than subset 2.
[0060]The input to the classifier is a vector of n "features" that are gene expression coefficients coming from one microarray experiment. The two classes are identified with the symbols (+) and (-) with "normal" or reference samples belong to class (+) and cancer tissues to class (-). A training set of a number of patterns {x1, x2, . . . xk, . . . , xl} with known class labels {y1, y2, . . . yk, . . . yl}, yk.di-elect cons.{-1,+1}, is given. The training samples are used to build a decision function (or discriminant function) D(x), that is a scalar function of an input pattern x. New samples are classified according to the sign of the decision function:
D(x)>0×.di-elect cons.class (+)
D(x)<0×.di-elect cons.class (-)
D(x)=0, decision boundary.
Decision functions that are simple weighted sums of the training patterns plus a bias are called linear discriminant functions.
D(x)=wx+b,
where w is the weight vector and b is a bias value.
[0061]In the case of Golub's classifier, each weight is computed as:
Wi=(μi(+)-μi(-))/(σi(+)+σi(-)),
where (μi and σi are the mean and standard deviation of the gene expression values of gene i for all the patients of class (+) or class (-), i=1, . . . n. Large positive wi values indicate strong correlation with class (+) whereas large negative wi values indicate strong correlation with class (-). Thus the weights can also be used to rank the features (genes) according to relevance. The bias is computed as b=-wμ, where μ=(μ(+)+(-))/2.
[0062]Golub's classifier is a standard reference that is robust against outliers. Once a first classifier is trained, the magnitude of wi is used to rank the genes. The classifiers are then retrained with subsets of genes of different sizes, including the best ranking genes.
[0063]To assess the statistical significance of the results, ten random splits of the data including samples were prepared from either preparation method and submitted to the same method. This allowed the computation of an average and standard deviation for comparison purposes.
[0064]Tissue from the same patient was processed either directly (unfiltered) or after the LCM procedure, yielding a pair of microarray experiments. This yielded 13 pairs, including: four G4; one G3+4; two G3; four BPH; one CZ (normal) and one PZ (normal).
[0065]For each data preparation method (LCM or unfiltered tissues), the tissues were grouped into two subsets:
Cancer=G4+G3 (7 cases)
Normal=BPH+CZ+PZ (6 cases).
[0066]The results are shown in FIG. 2. The large error bars are due to the small size. However, there is an indication that LCM samples are better than unfiltered tissue samples. It is also interesting to note that the average curve corresponding to random splits of the data is above both curves. This is not surprising since the data in subset 1 and subset 2 are differently distributed. When making a random split rather than segregating samples, both LCM and unfiltered tissues are represented in the training and the test set and performance on the test set are better on average.
[0067]The same methods were applied to determine whether microarrays with gene expression data rejected by the Affymetrix quality criterion contained useful information by focusing on the problem of separating BPH tissue vs. G4 tissue with a total of 42 arrays (18 BPH and 24 G4).
[0068]The Affymetrix criterion identified 17 good quality arrays, 8 BPH and 9 G4.
Two subsets were formed: [0069]Subset 1="good" samples, 8 BPH+9 G4 [0070]Subset 2="mediocre" samples, 10 BPH+15 G4
[0071]For comparison, all of the samples were lumped together and 10 random subset 1 containing 8 BPH+9 G4 of any quality were selected. The remaining samples were used as subset 2 allowing an average curve to be obtained. Additionally the subsets were inverted with training on the "mediocre" examples and testing on the "good" examples.
[0072]When the mediocre samples are trained, perfect accuracy on the good samples is obtained, whereas training on the good examples and testing on the mediocre yield substantially worse results.
[0073]All the BPH and G4 samples were divided into LCM and unfiltered tissue subsets to repeat similar experiments as in the previous Section: [0074]Subset1=LCM samples (5 BPH+6 LCM) [0075]Subset2=unfiltered tissue samples (13 BPH+18 LCM)
[0076]There, in spite of the difference in sample size, training on LCM data yields better results. In spite of the large error bars, this is an indication that the LCM data preparation method might be of help in improving sample quality.
BPH vs. G4
[0077]The Affymetrix data quality criterion were irrelevant for the purpose of determining the predictive value of particular genes and while the LCM samples seemed marginally better than the unfiltered samples, it was not possible to determine a statistical significance. Therefore, all samples were grouped together and the separation BPH vs. G4 with all 42 samples (18 BPH and 24 G4) was preformed.
[0078]To evaluate performance and compare Golub's method with SVMs, the leave-one-out method was used. The fraction of successfully classified left-out examples gives an estimate of the success rate of the various classifiers.
[0079]In this procedure, the gene selection process was run 41 times to obtain subsets of genes of various sizes for all 41 gene rankings. One classifier was then trained on the corresponding 40 genes for every subset of genes. This leave-one-out method differs from the "naive" leave-one-out that consists of running the gene selection only once on all 41 examples and then training 41 classifiers on every subset of genes. The naive method gives overly optimistic results because all the examples are used in the gene selection process, which is like "training on the test set". The increased accuracy of the first method is illustrated in FIG. 3. The method used in the figure is RFE-SVM and the classifier used is an SVM. All SVMs are linear with soft margin parameters C=100 and t=1014. The dashed line represents the "naive" leave-one-out (LOO), which consists in running the gene selection once and performing loo for classifiers using subsets of genes thus derived, with different sizes. The solid line represents the more computationally expensive "true" LOO, which consists in running the gene selection 41 times, for every left out example. The left out example is classified with a classifier trained on the corresponding 40 examples for every selection of genes. If f is the success rate obtained (a point on the curve), the standard deviation is computed as sqrt(f(1-f)).
Example 2
Analyzing Small Data Sets with Multiple Features
[0080]Small data sets with large numbers of features present several problems. In order to address ways of avoiding data overfitting and to assess the significance in performance of multivariate and univariate methods, the samples from Example 1 that were classified by Affymetrix as high quality samples were further analyzed. The samples included 8 BPH and 9 G4 tissues. Each microarray recorded 7129 gene expression values. About 2/3 of the samples in the BPH/G4 subset were considered of inadequate quality for use with standard non-SVM methods.
[0081]Simulations resulting from multiple splits of the data set of 17 examples (8 BPH and 9 G4) into a training set and a test set were run. The size of the training set is varied. For each training set drawn, the remaining data are used for testing. For number of training examples greater than 4 and less than 16, 20 training sets were selected at random. For 16 training examples, the leave-one-out method was used, in that all the possible training sets obtained by removing 1 example at a time (17 possible choices) were created. The test set is then of size 1. Note that the test set is never used as part of the feature selection process, even in the case of the leave-one-out method.
[0082]For 4 examples, all possible training sets containing 2 examples of each class (2 BPH and 2 G4), were created and 20 of them were selected at random. For SVM methods, the initial training set size is 2 examples, one of each class (1 BPH and 1 G4). The examples of each class are drawn at random. The performance of the LDA methods cannot be computed with only 2 examples, because at least 4 examples (2 of each class) are required to compute intraclass standard deviations. The number of training examples is incremented by steps of 2.
[0083]The top ranked genes are presented in Tables 5-8. Having determined that the SVM method provided the most compact set of features to achieve 0 leave-one-out error and that the SF-SVM method is the best and most robust method for small numbers of training examples, the top genes found by these methods were researched in the literature. Most of the genes have a connection to cancer or more specifically to prostate cancer.
[0084]Table 5 shows the top ranked genes for SF LDA using 17 best BPH/G4.
TABLE-US-00005 TABLE 5 Rank GAN EXP Description 10 X83416 -1 H. sapiens PrP gene 9 U50360 -1 Human calcium calmodulin-dependent protein kinase II gamma mRNA 8 U35735 -1 Human RACH1 (RACH1) mRNA 7 M57399 -1 Human nerve growth factor (HBNF-1) mRNA 6 M55531 -1 Human glucose transport-like 5 (GLUT5) mRNA 5 U48959 -1 Human myosin light chain kinase (MLCK) mRNA 4 Y00097 -1 Human mRNA for protein p68 3 D10667 -1 Human mRNA for smooth muscle myosin heavy chain 2 L09604 -1 Homo sapiens differentiation- dependent A4 protein MRNA 1 HG1612-HT1612 1 McMarcks
where GAN=Gene Acession Number; EXP=Expression (-1=underexpressed in cancer (G4) tissues; +1=overexpressed in cancer tissues).
[0085]Table 6 lists the top ranked genes obtained for LDA using 17 best BPH/G4.
TABLE-US-00006 TABLE 6 Rank GAN EXP Description 10 J03592 1 Human ADP/ATP translocase mRNA 9 U40380 1 Human presenilin I-374 (AD3-212) mRNA 8 D31716 -1 Human mRNA for GC box bindig protein 7 L24203 -1 Homo sapiens ataxia-telangiectasia group D 6 J00124 -1 Homo sapiens 50 kDa type I epidermal keratin gene 5 D10667 -1 Human mRNA for smooth muscle myosin heavy chain 4 J03241 -1 Human transforming growth factor-beta 3 (TGF-beta3) MRNA 3 017760 -1 Human laminin S B3 chain (LAMB3) gene 2 X76717 -1 H. sapiens MT-11 mRNA 1 X83416 -1 1 H. sapiens PrP gene
[0086]Table 7 lists the top ranked genes obtained for SF SVM using 17 best BPH/G4.
TABLE-US-00007 TABLE 7 Rank GAN EXP Description 10 X07732 1 Human hepatoma mRNA for serine protease hepsin 9 J03241 -1 Human transforming growth factor-beta 3 (TGF-beta3) MRNA 8 X83416 -1 H. sapiens PrP gene 7 X14885 -1 H. sapiens gene for transforming growth factor-beta 3 (TGF-beta 3) exon 1 (and joined CDS) 6 U32114 -1 Human caveolin-2 mRNA 5 M16938 1 Human homeo-box c8 protein 4 L09604 -1 H. sapiens differentiation-dependent A4 protein MRNA 3 Y00097 -1 Human mRNA for protein p68 2 D88422 -1 Human DNA for cystatin A 1 U35735 -1 Human RACH1 (RACH1) mRNA
[0087]Table 8 provides the top ranked genes for SVM using 17 best BPH/G4.
TABLE-US-00008 TABLE 8 Rank GAN EXP Description 10 X76717 -1 H. sapiens MT-11 mRNA 9 U32114 -1 Human caveolin-2 mRNA 8 X85137 1 H. sapiens mRNA for kinesin-related protein 7 D83018 -1 Human mRNA for nel-related protein 2 6 D10667 -1 Human mRNA for smooth muscle myosin heavy chain 5 M16938 1 Human homeo box c8 protein 4 L09604 -1 Homo sapiens differentiation-dependent A4 protein mRNA 3 HG1612 1 McMarcks 2 M10943 -1 Human metaIlothionein-If gene (hMT-If) 1 X83416 -1 H. sapiens PrP gene
[0088]Using the "true" leave-one-out method (including gene selection and classification), the experiments indicate that 2 genes should suffice to achieve 100% prediction accuracy. The two top genes were therefore more particularly researched in the literature. The results are summarized in Table 10. It is interesting to note that the two genes selected appear frequently in the top 10 lists of Tables 5-8 obtained by training only on the 17 best genes.
[0089]Table 9 is a listing of the ten top ranked genes for SVM using all 42 BPH/G4.
TABLE-US-00009 TABLE 9 Rank GAN EXP Description 10 X87613 -1 H. sapiens mRNA for skeletal muscle abundant 9 X58072 -1 Human hGATA3 mRNA for trans-acting T-cell specific 8 M33653 -1 Human alpha-2 type IV collagen (COL4A2) 7 S76473 1 trkB [human brain mRNA] 6 X14885 -1 H. sapiens gene for transforming growth factor-beta 3 5 S83366 -1 region centromeric to t(12; 17) brakepoint 4 X15306 -1 H. sapiens NF-H gene 3 M30894 1 Human T-cell receptor Ti rearranged gamma-chain 2 M16938 1 Human homeo box c8 protein 1 U35735 -1 Human RACH1 (RACH1) mRNA
[0090]Table 10 provides the findings for the top 2 genes found by SVM using all 42 BPH/G4. Taken together, the expression of these two genes is indicative of the severity of the disease.
TABLE-US-00010 TABLE 10 GAN Synonyms Possible function/link to prostate cancer M16938 HOXC8 Hox genes encode transcriptional regulatory proteins that are largely responsible for establishing the body plan of all metazoan organisms. There are hundreds of papers in PubMed reporting the role of HOX genes in various cancers. HOXC5 and HOXC8 expression are selectively turned on in human cervical cancer cells compared to normal keratinocytes. Another homeobox gene (GBX2) may participate in metastatic progression in prostatic cancer. Another HOX protein (hoxb-13) was identified as an androgen-independent gene expressed in adult mouse prostate epithelial cells. The authors indicate that this provides a new potential target for developing therapeutics to treat advanced prostate cancer U35735 Jk Overexpression of RACH2 in human tissue culture cells Kidd induces apoptosis. RACH1 is downregulated in breast RACH1 cancer cell line MCF-7. RACH2 complements the RAD1 RACH2 protein. RAM is implicated in several cancers. SLC14A1 Significant positive lod scores of 3.19 for linkage of the Jk UT1 (Kidd blood group) with cancer family syndrome (CFS) UTE were obtained. CFS gene(s) may possibly be located on chromosome 2, where Jk is located.
[0091]Table 11 shows the severity of the disease as indicated by the top 2 ranking genes selected by SVMs using all 42 BPH and G4 tissues.
TABLE-US-00011 TABLE 11 HOXC8 HOXC8 Underexpressed Overexpressed RACH1Overexpressed Benign N/A RACH1 Underexpressed Grade 3 Grade 4
Example 3
Prostate Cancer Study on Affymetrix Gene Expression Data (09-2004)
[0092]A set of Affymetrix microarray GeneChip® experiments from prostate tissues were obtained from Dr. Thomas A. Stamey at Stanford University. The data from samples obtained for the prostate cancer study are summarized in Table 12 (which represents the same data as in Table 3 but organized differently.) Preliminary investigation of the data included determining the potential need for normalizations. Classification experiments were run with a linear SVM on the separation of Grade 4 tissues vs. BPH tissues. In a 32×3-fold experiment, an 8% error rate could be achieved with a selection of 100 genes using the multiplicative updates technique (similar to RFE-SVM). Performances without feature selection are slightly worse but comparable. The gene most often selected by forward selection was independently chosen in the top list of an independent published study, which provided an encouraging validation of the quality of the data.
TABLE-US-00012 TABLE 12 Prostate zone Histological classification No. of samples Central (CZ) Normal (NL) 9 Dysplasia (Dys) 4 Grade 4 cancer (G4) 1 Peripheral (PZ) Normal (NL) 13 Dysplasia (Dys) 13 Grade 3 cancer (G3) 11 Grade 4 cancer (G4) 18 Transition (TZ) Benign Prostate Hyperplasia (BPH) 10 Grade 4 cancer (G4) 8 Total 87
[0093]As controls, normal tissues and two types of abnormal tissues are used in the study: BPH and Dysplasia.
[0094]To verify the data integrity, the genes were sorted according to intensity. For each gene, the minimum intensity across all experiments was taken. The top 50 most intense values were taken. Heat maps of the data matrix were made by sorting the lines (experiments) according to zone, grade, and time processed. No correlation was found with zone or grade, however, there was a significant correlation with the time the sample was processed. Hence, the arrays are poorly normalized.
[0095]In other ranges of intensity, this artifact is not seen. Various normalization techniques were tried, but no significant improvements were obtained. It has been observed by several authors that microarray data are log-normal distributed. A qqplot of all the log of the values in the data matrix confirms that the data are approximately log-normal distributed. Nevertheless, in preliminary classification experiments, there was not a significant advantage of taking the log.
[0096]Tests were run to classify BPH vs. G4 samples. There were 10 BPH samples and 27 G4 samples. 32×3 fold experiments were performed in which the data was split into 3 subsets 32 times. Two of the subsets were used for training while the third was used for testing. The results were averaged. A feature selection was performed for each of the 32×3 data splits; the features were not selected on the entire dataset.
[0097]A linear SVM was used for classification, with ridge parameter 0.1, adjusted for each class to balance the number of samples per class. Three feature selection methods were used: (1) multiplicative updates down to 100 genes (MU100); (2) forward selection with approximate gene orthogonalisation up to 2 genes (FS2); and (3) no gene selection (NO).
[0098]The data was either raw or after taking the log(LOG). The genes were always standardized (STD: the mean over all samples is subtracted and the result is divided by the standard deviation; mean and stdev are computed on training data only, the same coefficients are applied to test data).
[0099]The results for the performances for the BPH vs. G4 separation are shown in Table 13 below, with the standard errors are shown in parentheses. "Error rate" is the average number of misclassification errors; "Balanced errate" is the average of the error rate of the positive class and the error rate of the negative class; "AUC" is the area under the ROC (receiver operating characteristic) curves that plots the sensitivity (error rate of the positive class, G4) as a function of the specificity (error rate of the negative class, BPH).
It was noted that the SVM performs quite well without feature selection, and MU 100 performs similarly, but slightly better. The number of features was not adjusted--100 was chosen arbitrarily.
TABLE-US-00013 TABLE 13 Balanced Preprocessing Feat. Select. Error rate errate AUC Log + STD MU 100 8.09 (0.66) 11.68 (1.09) 98.93 (0.2) Log + STD FS 2 13.1 (1.1) 15.9 (1.3) 92.02 (1.15) Log + STD No selection 8.49 (0.71) 12.37 (1.13) 97.92 (0.33) STD No selection 8.57 (0.72) 12.36 (1.14) 97.74 (0.35)
[0100]In Table 13, the good AUC and the difference between the error rate and the balanced error rate show that the bias of the classifier must be optimized to obtained a desired tradeoff between sensitivity and specificity.
[0101]Two features are not enough to match the best performances, but do quite well already.
[0102]It was determined which features were selected most often with the FS 2 method. The first gene (3480) was selected 56 times, while the second best one (5783) was selected only 7 times. The first one is believed to be relevant to cancer, while the second one has probably been selected for normalization purposes. It is interesting that the first gene (Hs.79389) is among the top three genes selected in another independent study (Febbo-Sellers, 2003).
[0103]The details of the two genes are as follows: [0104]Gene 3480: gb:NM--006159.1/DEF=Homo sapiens nel (chicken)-like 2 (NELL2), mRNA./FEA=mRNA/GEN=NELL2/PROD=nel (chicken)-like2/DB_XREF=gi:5453765/UG=Hs.79389 nel (chicken)-like 2/FL=gb:D83018.1 gb:NM--006159.1 [0105]Gene 5783: gb:NM--018843.1/DEF=Homo sapiens mitochondrial carrier family protein(LOC55972), mRNA./FEA=mRNA/GEN=LOC55972 /PROD=mitochondrial carrier family protein /DB_XREF=gi: 10047121 /UG=Hs.172294 mitochondrial carrier family protein /FL=gb:NM--018843.1 gb:AF125531.1.
Example 4
Prostate Cancer Study from Affymetrix Gene Expression Data (10-2004)
[0106]This example is a continuation of the analysis of Example 3 above on the Stamey prostate cancer microarray data. PSA has long been used as a biomarker of prostate cancer in serum, but is no longer useful. Other markers have been studied in immunohistochemical staining of tissues, including p27, Bcl-2, E-catherin and P53. However, to date, no marker has gained acceptance for use in routine clinical practice.
[0107]The gene rankings obtained correlate with those of the Febbo paper, confirming that the top ranking genes found from the Stamey data have a significant intersection with the genes found in the Febbo study. In the top 1000 genes, about 10% are Febbo genes. In comparison, a random ordering would be expected to have less than 1% are Febbo genes.
[0108]BPH is not by itself an adequate control. When selecting genes according to how well they separate grade 4 cancer tissues (G4) from BPH, one can find genes that group all non-BPH tissues with the G4 tissues (including normal, dysplasia and grade 3 tissues). However, when BPH is excluded from the training set, genes can be found that correlate well with disease severity. According to those genes, BPH groups with the low severity diseases, leading to a conclusion that BPH has its own molecular characteristics and that normal adjacent tissues should be used as controls.
[0109]TZG4 is less malignant than PZG4. It is known that TZ cancer has a better prognosis than PZ cancer. The present analysis provides molecular confirmation that TZG4 is less malignant than PZG4. Further, TZG4 samples group with the less malignant samples (grade 3, dysplasia, normal, or BPH) than with PZG4. This differentiated grouping is emphasized in genes correlating with disease progression (normal<dysplasia<g3<g4) and selected to provide good separation of TZG4 from PZG4 (without using an ordering for TZG4 and PZG4 in the gene selection criterion).
[0110]Ranking criteria implementing prior knowledge about disease malignancy are more reliable. Ranking criteria validity was assessed both with p values and with classification performance. The criterion that works best implements a tissue ordering normal<dysplasia<G3<G4 and seeks a good separation TZG4 from PZG4. The second best criterion implements the ordering normal<dysplasia<G3<TZG4<PZG4.
[0111]Comparing with other studies may help reducing the risk of overfitting. A subset of 7 genes was selected that ranked high in the present study and that of Febbo et al. 2004. Such genes yield good separating power for G4 vs. other tissues. The training set excludes BPH samples and is used both to select genes and train a ridge regression classifier. The test set includes 10 BPH and 10 G4 samples (1/2 from the TZ and 1/2 from the PZ). Success was evaluated with the area under the ROC curve ("AUC")(sensitivity vs. specificity) on test examples. AUCs between 0.96 and 1 are obtained, depending on the number of genes. Two genes are of special interest (GSTP1 and PTGDS) because they are found in semen and could be potential biomarkers that do not require the use of biopsied tissue.
[0112]The choice of the control may influence the findings (normal tissue or BPH). as may the zones from which the tissues originate. The first test sought to separate Grade 4 from BPH. Two interesting genes were identified by forward selection as gene 3480 (NELL2) and gene 5783(LOC55972). As explained in Example 3, gene 3480 is the informative gene, and it is believed that gene 5783 helps correct local on-chip variations. Gene 3480, which has Unigene cluster id. Hs.79389, is a Nel-related protein, which has been found at high levels in normal tissue by Febbo et al.
[0113]All G4 tissues seem intermixed regardless of zone. The other tissues are not used for gene selection and they all fall on the side of G4. Therefore, the genes found characterize BPH, not G4 cancer, such that it is not sufficient to use tissues of G4 and BPH to find useful genes to characterize G4 cancer.
[0114]For comparison, two filter methods were used: the Fisher criterion and the shrunken centroid criterion (Tibshirani et al, 2002). Both methods found gene 3480 to be highly informative (first or second ranking). The second best gene is 5309, which has Unigene cluster ID Hs. 100431 and is described as small inducible cytokine B subfamily (Cys-X-Cys motif). This gene is highly correlated to the first one.
[0115]The Fisher criterion is implemented by the following routine: [0116]A vector x containing the values of a given feature for all patt_num samples [0117]cl_num classes, k=1, 2, . . . cl_num, grouping the values of x [0118]mu_val(k) is the mean of the x values for class k [0119]var_val(k) is the variance of the x values for class k [0120]patt--4 per class(k) is the number of elements of class k [0121]Unbiased_within_var is the unbiased pooled within class variance, i.e., we make a weighted average of var_val(k) with coefficients patt_per class(k)/(patt_num--cl_num) [0122]Unbiased_between_var=var(mu_val); % Divides by cl_num-1 then [0123]Fisher_crit=Unbiased_between_var /Unbiased_within_var
[0124]Although the shrunken centroid criterion is somewhat more complicated that the Fisher criterion, it is quite similar. In both cases, the pooled within class variance is used to normalize the criterion. The main difference is that instead of ranking according to the between class variance (that is, the average deviation of the class centroids to the overall centroid), the shrunken centroid criterion uses the maximum deviation of any class centroid to the global centroid. In doing so, the criterion seeks features that well separate at least one class, instead of features that well separate all classes (on average).
The other small other differences are: [0125]A fudge factor is added to Unbiased_within_std=sqrt(Unbiased_within_var) to prevent divisions by very small values. The fudge factor is computed as: [0126]fudge=mean(Unbiased_within_std); the mean being taken over all the features. [0127]Each class is weighted according to its number of elements cl_elem(k). The deviation for each class is weighted by 1/sqrt(1/cl_elem(k)+1/patt_num). Similar corrections could be applied to the Fisher criterion.
[0128]The two criteria are compared using pvalues. The Fisher criterion produces fewer false positive in the top ranked features. It is more robust, however, it also produces more redundant features. It does not find discriminant features for the classes that are least abundant or hardest to separate.
[0129]Also for comparison, the criterion of Golub et al., also known as signal to noise ratio, was used. This criterion is used in the Febbo paper to separate tumor vs. normal tissues. On this data that the Golub criterion was verified to yield a similar ranking as the Pearson correlation coefficient. For simplicity, only the Golub criterion results are reported. To mimic the situation, three binary separations were run: (G3+4 vs. all other tissues), (G4 vs. all other tissues), and (G4 vs. BPH). As expected, the first gene selected for the G4 vs. BPH is 3480, but it does not rank high in the G3+4 vs. all other and G4 vs. all other.
[0130]Compared to a random ranking, the genes selected using the various criteria applied are enriched in Febbo genes, which cross-validates the two study. For the multiclass criteria, the shrunken centroid method provides genes that are more different from the Febbo genes than the Fisher criterion. For the two-class separations, the tumor vs normal (G3+4 vs others) and the G4 vs. BPH provide similar Febbo enrichment while the G4 vs. all others gives gene sets that depart more from the Febbo genes. Finally, it is worth noting that the initial enrichment up to 1000 genes is of about 10% of Febbo genes in the gene set. After that, the enrichment decreases. This may be due to the fact that the genes are identified by their Unigene Ids and more than one probe is attributed to the same Id. In any case, the enrichment is very significant compared to the random ranking.
[0131]A number of probes do not have Unigene numbers. Of 22,283 lines in the Affymetrix data, 615 do not have Unigene numbers and there are only 14,640 unique Unigene numbers. In 10,130 cases, a unique matrix entry corresponds to a particular Unigene ID. However, 2,868 Unigene IDs are represented by 2 lines, 1,080 by 3 lines, and 563 by more than 3 lines. One Unigene ID covers 13 lines of data. For example, Unigene ID Hs.20019, identifies variants of Homo sapiens hemochromatosis (HFE) corresponding to GenBank accession numbers: AF115265.1, NM--000410.1, AF144240.1, AF150664.1, AF149804.1, AF144244.1, AF115264.1, AF144242.1, AF144243.1, AF144241.1, AF079408.1, AF079409.1, and (consensus) BG402-460.
[0132]The Unigene IDs of the paper of Febbo et al. (2003) were compared using the U95AV2 Affymetrix array and the IDs found in the U133A array under study. The Febbo paper reported 47 unique Unigene IDs for tumor high genes, 45 of which are IDs also found in the U133A array. Of the 49 unique Unigene IDs for normal high genes, 42 are also found in the U133A array. Overall, it is possible to see cross-correlations between the findings. There is a total of 96 Febbo genes that correspond to 173 lines (some genes being repeated) in the current matrix.
[0133]Based on the current results, one can either conclude that the "normal" tissues that are not BPH and drawn near the cancer tissues are on their way to cancer, or that BPH has a unique molecular signature that, although it may be considered "normal", makes it unfit as a control. A test set was created using 10 BPH samples and 10 grade 4 samples. Naturally, all BPH are in the TZ. The grade 4 are 1/2 in the TZ and 1/2 in the PZ.
[0134]Gene selection experiments were performed using the following filter methods:
[0135](1)--Pearson's correlation coefficient to correlate with disease severity, where disease severity is coded as normal=1, dysplasia=2, grade3=3, grade4=4.
[0136](2)--Fisher's criterion to separate the 4 classes (normal, dysplasia, grade3, grade4) with no consideration of disease severity.
[0137](3)--Fisher's criterion to separate the 3 classes (PZ, CZ, TZ)
[0138](4)--Relative Fisher criterion by computing the ratio of the between class variances of the disease severity and the zones, in an attempt to de-emphasize the zone factor.
[0139](5)--Fisher's criterion to separate 8 classes corresponding to all the combinations of zones and disease severity found in the training data.
[0140](6)--Using the combination of 2 rankings: the ranking of (1) and a ranking by zone for the grade 4 samples only. The idea is to identify genes that separate TZ from PZ cancers that have a different prognosis.
[0141]For each experiment, scatter plots were analyzed for the two best selected genes, the heat map of the 50 top ranked genes was reviewed, and p values were compared. The conclusions are as follows:
[0142]The Pearson correlation coefficient tracking disease severity (Experiment (1)) gives a similar ranking to the Fisher criterion, which discriminates between disease classes without ranking according to severity. However, the Pearson criterion has slightly better p values and, therefore, may give fewer false positives. The two best genes found by the Pearson criterion are gene 6519, ranked 6th by the Fisher criterion, and gene 9457, ranked 1st by the Fisher criterion. The test set examples are nicely separated, except for one outlier.
[0143]The zonal separation experiments were not conclusive because there are only 3 TZ examples in the training set and no example of CZ in the test set. Experiment (3) revealed a good separation of PZ and CZ on training data. TZ was not very well separated. Experiments (4) and (5) did not show very significant groupings. Experiment (6) found two genes that show both disease progression and that TZ G4 is grouped with "less severe diseases" than PZ G4, although that constraint was not enforced. To confirm the latter finding, the distance for the centroids of PZG4 and TZG4 were compared to control samples. Using the test set only (controls are BPH), 63% of all the genes show that TZG4 is closer to the control than PZG4. That number increases to 70% if the top 100 genes of experiment (6) are considered. To further confirm, experiment (6) was repeated with the entire dataset (without splitting between training and test). TZG4 is closer to normal than PZG4 for most top ranked genes. In the first 15 selected genes, 100% have TZG4 closer to normal than PZG4. This finding is significant because TZG4 has better prognosis than PZG4.
[0144]Classification experiments were performed to assess whether the appropriate features had been selected using the following setting:
[0145]The data were split into a training set and a test set. The test set consists of 20 samples: 10 BPH, 5 TZG4 and 5 PZG4. The training set contains the rest of the samples from the data set, a total of 67 samples (9 CZNL, 4 CZDYS, 1 CZG4, 13 PZNL, 13 PZDYS, 11PZG3, 13 PZG4, 3 TZG4). The training set does not contain any BPH.
[0146]Feature selection was performed on training data only. Classification was performed using linear ridge regression. The ridge value was adjusted with the leave-one-out error estimated using training data only. The performance criterion was the area under the ROC curve (AUC), where the ROC curve is a plot of the sensitivity as a function of the specificity. The AUC measures how well methods monitor the tradeoff sensitivity/specificity without imposing a particular threshold.
[0147]P values are obtained using a randomization method proposed by Tibshirani et al. Random "probes" that have a distribution similar to real features (gene) are obtained by randomizing the columns of the data matrix, with samples in lines and genes in columns. The probes are ranked in a similar manner as the real features using the same ranking criterion. For each feature having a given score s, where a larger score is better, a p value is obtained by counting the fraction of probes having a score larger than s. The larger the number of probes, the more accurate the p value.
[0148]For most ranking methods, and for forward selection criteria using probes to compute p values does not affect the ranking. For example, one can rank the probes and the features separately for the Fisher and Pearson criteria.
[0149]P values measure the probability that a randomly generated probe imitating a real gene, but carrying no information, gets a score larger or equal to s. Considering a single gene, if it has a score of s, the p value test can be used to test whether to reject the hypothesis that it is a random meaningless gene by setting a threshold on the p value, e.g., 0.0. The problem is that there are many genes of interest (in the present study, N=22,283.) Therefore, it becomes probable that at least one of the genes having a score larger than s will be meaningless. Considering many genes simultaneously is like doing multiple testing in statistics. If all tests are independent, a simple correction known as the Bonferroni correction can be performed by multiplying the p values by N. This correction is conservative when the test are not independent.
[0150]From p values, one can compute a "false discovery rate" as FDR(s)=pvalue(s)*N/r, where r is the rank of the gene with score s, pvalue(s) is the associated p value, N is the total number of genes, and pvalue(s)*N is the estimated number of meaningless genes having a score larger than s. FDR estimates the ratio of the number of falsely significant genes over the number of genes call significant.
[0151]Of the classification experiments described above, the method that performed best was the one that used the combined criteria of the different classification experiments. In general, imposing meaningful constraints derived from prior knowledge seems to improve the criteria. In particular, simply applying the Fisher criterion to the G4 vs. all-the-rest separation (G4vsAll) yields good separation of the training examples, but poorer generalization than the more constrained criteria. Using a number of random probes equal to the number of genes, the G4vsAll identifies 170 genes before the first random probe, multiclass Fisher obtains 105 and the Pearson criterion measuring disease progression gets 377. The combined criteria identifies only 8 genes, which may be attributed to the different way in which values are computed. With respect to the number of Febbo genes found in the top ranking genes, G4 vs All has 20, multiclass Fisher 19, Pearson 19, and the combined criteria 8. The combined criteria provide a characterization of zone differentiation. On the other hand, the top 100 ranking genes found both by Febbo and by criteria G4 vs All, Fisher or Pearson have a high chance of having some relevance to prostate cancer. These genes are listed in Table 14.
TABLE-US-00014 TABLE 14 Order G4 vs Num Unigene ID Fisher Pearson ALL AUC Description 12337 Hs.7780 11 6 54 0.96 cDNA DKFZp56A072 893 Hs.226795 17 7 74 0.99 Glutathione S-transferase pi (GSTP1) 5001 Hs.823 41 52 72 0.96 Hepsin (transmembrance protease, serine 1) (HPN) 1908 Hs.692 62 34 111 0.96 Tumor-associated calcium signal transducer 1 (TACSTD1) 5676 Hs.2463 85 317 151 1 Angiopoietin 1 (ANGPT1) 12113 Hs.8272 181 93 391 1 Prostaglandin D2 synthase (21 kD, brain) (PTGDS) 12572 Hs.9651 96 131 1346 0.99 RAS related viral oncogene homolog (RRAS)
[0152]Table 14 shows genes found in the top 100 as determined by the three criteria, Fisher, Pearson and G4vsALL, that were also reported in the Febbo paper. In the table, Order num is the order in the data matrix. The numbers in the criteria columns indicate the rank. The genes are ranked according to the sum of the ranks of the 3 criteria. Classifiers were trained with increasing subset sizes showing that a test AUC of 1 is reached with 5 genes.
[0153]The published literature was checked for the genes listed in Table 14. Third ranked Hepsin has been reported in several papers on prostate cancer: Chen et al. (2003) and Febbo et al. (2003) and is picked up by all criteria. Polymorphisms of second ranked GSTP1 (also picked by all criteria) are connected to prostate cancer risk (Beer et al, 2002). The fact that GSTP1 is found in semen (Lee (1978)) makes it a potentially interesting marker for non-invasive screening and monitoring. The clone DKFZp564A072, ranked first, is cited is several gene expression studies.
[0154]Fourth ranked Gene TACSTD1 was also previously described as more-highly expressed in prostate adenocarcinoma (see Lapointe et al, 2004 and references therein). Angiopoietin (ranked fifth) is involved in angiogenesis and known to help the blood irrigation of tumors in cancers and, in particular, prostate cancer (see e.g. Cane, 2003). Prostaglandin D2 synthase (ranked sixth) has been reported to be linked to prostate cancer in some gene expression analysis papers, but more interestingly, prostaglandin D synthase is found in semen (Tokugawa, 1998), making it another biomarker candidate for non-invasive screening and monitoring. Seventh ranked RRAS is an oncogene, so it makes sense to find it in cancer, however, its role in prostate cancer has not been documented.
[0155]A combined criterion was constructed for selecting genes according to disease severity NL<DYS<G3<G4 and simultaneously tries to differentiate TZG4 from PZG4 without ordering them. This following procedure was used: [0156]Build an ordering using the Pearson criterion with encoded target vector having values NL=1, DYS=2, G3=3, G4=4 (best genes come last.) [0157]Build an ordering using the Fisher criterion to separate TZG4 from PZG$ (best genes come last.) [0158]Obtain a combined criterion by adding for each gene its ranks obtained with the first and second criterion.
[0159]Sort according to the combined criterion (in descending order, best first).
P values can be obtained for the combined criterion as follows: [0160]Unsorted score vectors for real features (genes) and probes are concatenated for both criteria (Pearson and Fisher). [0161]Genes and probes are sorted together for both criteria, in ascending order (best last).
[0162]The combined criterion is obtained by summing the ranks, as described above. [0163]For each feature having a given combined criterion value s (larger values being better), a p value is obtained by counting the fraction of probes a having a combined criterion larger than s.
[0164]Note that this method for obtaining p values disturbs the ranking, so the ranking that was obtained without the probes listed in Table 15 was used.
[0165]A listing of genes obtained with the combined criterion are shown in Table 15. The ranking is performed on training data only. "Order num" designates the gene order number in the data matrix; p values are adjusted by the Bonferroni correction; "FDR" indicates the false discovery rate; "Test AUC" is the area under the ROC curve computed on the test set; and "Cancer cor" indicates over-expression in cancer tissues.
TABLE-US-00015 TABLE 15 Order Unigene P Test Cancer Rank num ID value FDR AUC cor Gene description 1 3059 Hs.771 <0.1 <0.01 0.96 -1 gb: NM_002863.1 /DEF = Homo sapiens phosphorylase, /UG = Hs.771 phosphorylase, glycogen; liver 2 13862 Hs.66744 <0.1 <0.01 0.96 1 Consensus includes gb: X99268.1/DEF = H./FL = gb: NM_000474.1 3 13045 Hs.173094 <0.1 <0.01 1 -1 Consensus includes gb: AI096375/FEA = EST 4 5759 Hs.66052 <0.1 <0.01 0.97 -1 gb: NM_001775.1/DEF = Homo sapiens CD38 5 18621 Hs.42824 <0.1 <0.01 0.95 -1 gb: NM_018192.1/DEF = Homo sapiens hypothetical 6 3391 Hs.139851 <0.1 <0.01 0.94 -1 gb: NM_001233.1/DEF = Homo sapiens caveolin 7 18304 Hs.34045 <0.1 <0.01 0.95 1 gb: NM_017955.1/DEF = Homo sapiens hypothetical 8 14532 Hs.37035 <0.1 <0.01 1 1 Consensus includes gb: AI738662/FEA = EST 9 3577 Hs.285754 0.1 0.01 1 -1 Consensus includes gb: BG170541/FEA = EST 10 9010 Hs.180446 0.1 0.01 1 1 gb: L38951.1/DEF = Homo sapiens importin 11 13497 Hs.71465 0.1 0.01 1 -1 Consensus includes gb: AA639705/FEA = EST 12 19488 Hs.17752 0.1 0.01 1 1 gb: NM_015900.1/DEF = Homo sapiens phosph phospholipase A1alpha/FL = gb: AF035268.1 13 8838 Hs.237825 0.1 0.01 1 1 gb: AF069765.1/DEF = Homo sapiens signal gb: NM_006947.1 14 14347 Hs.170250 0.1 0.01 1 1 Consensus includes gb: K02403.1/DEF = Human 15 2300 Hs.69469 0.2 0.01 1 1 gb: NM_006360.1/DEF = Homo sapiens dendritic 16 10973 Hs.77899 0.2 0.01 1 -1 gb: Z24727.1/DEF = H. sapiens tropomyosin 17 11073 Hs.0 0.2 0.01 1 1 gb: Z25434.1/DEF = H. sapiens protein- serinethreonine 18 22193 Hs.165337 0.2 0.01 1 -1 Consensus includes gb: AW971415/FE 19 12742 Hs.237506 0.2 0.01 1 -1 Consensus includes gb: AK023253.1/DEF = 20 21823 Hs.9614 0.3 0.01 1 1 Consensus includes gb: AA191576/FEA = EST 21 13376 Hs.246885 0.3 0.01 1 -1 Consensus includes gb: W87466/FEA = EST 22 6182 Hs.77899 0.3 0.01 1 -1 gb: NM_000366.1/DEF = Homo sapiens tropomyosin 23 3999 Hs.1162 0.4 0.02 1 1 gb: NM_002118.1/DEF = Homo sapiens major II, DM beta/FL = gb: NM_002118.1 gb: U15085.1 24 1776 Hs.168670 0.7 0.03 1 -1 gb: NM_002857.1/DEF = Homo sapiens peroxisomal gb: AB018541.1 25 4046 Hs.82568 0.7 0.03 1 -1 gb: NM_000784.1/DEF = Homo sapiens cytochrome cerebrotendinous xanthomatosis), polypeptide 26 6924 Hs.820 0.8 0.03 1 1 gb: NM_004503.1/DEF = Homo sapiens homeo 27 2957 Hs.1239 0.9 0.03 1 -1 gb: NM_001150.1/DEF = Homo sapiens alanyl/DB_XREF = gi: 4502094/UG = Hs.1239 alanyl 28 5699 Hs.78406 1.3 0.05 1 -1 gb: NM_003558.1/DEF = Homo sapiens phosphatidylinositol phosphate 5-kinase, type I, beta/FL = gb: NM 29 19167 Hs.9238 1.4 0.05 1 -1 gb: NM_024539.1/DEF = Homo sapiens hypothetical 30 4012 Hs.172851 1.4 0.05 1 -1 gb: NM_001172.2/DEF = Homo sapiens arginase, gb: D86724.1 gb: U75667.1 gb: U82256.1 31 9032 Hs.80658 1.4 0.05 1 -1 gb: U94592.1/DEF = Human uncoupling protein gb: U82819.1 gb: U94592.1 32 15425 Hs.20141 1.5 0.05 1 1 Consensus includes gb: AK000970.1/DEF= 33 14359 Hs.155956 1.6 0.05 1 -1 Consensus includes gb: NM_000662.1/DEF = acetyltransferase)/FL = gb: NM_000662.1 34 6571 Hs.89691 1.6 0.05 1 1 gb: NM_021139.1/DEF = Homo sapiens UDP polypeptide B4/FL = gb: NM_021139.1 gb: AF064200.1 35 13201 Hs.301552 1.8 0.05 1 1 Consensus includes gb: AK000478.1/DEF= 36 21754 Hs.292911 1.8 0.05 1 -1 Consensus includes gb: AI378979/FEA = EST 37 5227 Hs.31034 2 0.05 1 -1 Consensus includes gb: AL360141.1/DEF= 38 18969 Hs.20814 2.1 0.06 1 1 gb: NM_015955.1/DEF = Homo sapiens CGI 39 17907 Hs.24395 2.2 0.06 1 1 gb: NM_004887.1/DEF = Homo sapiens small small inducible cytokine subfamily B (Cys 40 3831 Hs.77695 2.3 0.06 1 1 gb: NM_014750.1/DEF = Homo sapiens KIAA0008 41 10519 Hs.4975 2.4 0.06 0.98 1 gb: D82346.1/DEF = Homo sapiens mRNA 42 2090 Hs.150580 2.4 0.06 0.97 -1 gb: AF083441.1/DEF = Homo sapiens SUI1 43 9345 Hs.75244 2.6 0.06 0.97 -1 gb: D87461.1/DEF = Human mRNA for KIAA0271 44 3822 Hs.36708 2.7 0.06 0.97 1 gb: NM_001211.2/DEF = Homo sapiens budding uninhibited by benzimidazoles 1 (yeast homolog) 45 17999 Hs.179666 2.9 0.06 0.97 -1 gb: NM_018478.1/DEF = Homo sapiens uncharacterized HSMNP1/FL = gb: BC001105.1 gb: AF220191.1 46 5070 Hs.118140 2.9 0.06 0.96 1 gb: NM_014705.1/DEF = Homo sapiens KIAA0716 47 20627 Hs.288462 3 0.06 0.98 -1 gb: NM_025087.1/DEF = Homo sapiens hypothetical 48 14690 Hs.110826 3 0.06 0.99 1 Consensus includes gb: AK027006.1/DEF= 49 18137 Hs.9641 3 0.06 0.98 1 gb: NM_015991.1/DEF = Homo sapiens complement component 1, q subcomponent, alpha polypeptide-1 50 9594 Hs.182278 3 0.06 0.98 -1 gb: BC000454.1/DEF = Homo sapiens, cal/FL = gb: BC000454.1
[0166]From Table 15, the combined criteria give an AUC of 1 between 8 and 40 genes. This indicates that subsets of up to 40 genes taken in the order of the criteria have a high predictive power. However, genes individually can also be judged for their predictive power by estimating p values. P values provide the probability that a gene is a random meaningless gene. A threshold can be set on that p value, e.g. 0.05.
[0167]Using the Bonferroni correction ensures that p values are not underestimated when a large number of genes are tested. This correction penalizes p values in proportion to the number of genes tested. Using 10*N probes (N=number of genes) the number of genes that score higher than all probes are significant at the threshold 0.1. Eight such genes were found with the combined criterion, while 26 genes were found with a p value<1.
[0168]It may be useful to filter out as many genes as possible before ranking them in order to avoid an excessive penalty. When the genes were filtered with the criterion that the standard deviation should exceed twice the mean (a criterion not involving any knowledge of how useful this gene is to predict cancer). This reduced the gene set to N'=571, but there were also only 8 genes at the significance level of 0.1 and 22 genes had p value<1.
[0169]The 8 first genes found by this method are given in Table 16. Genes over-expressed in cancer are under Rank 2, 7, and 8 (underlined). The remaining genes are under-expressed.
TABLE-US-00016 TABLE 16 Rank Unigene ID Description and findings 1 Hs.771 Phosphorylase, glycogen; liver (Hers disease, glycogen storage disease type VI) (PYGL). 2 Hs.66744 B-HLH DNA binding protein. H-twist. 3 Hs.173094 KIAA1750 4 Hs.66052 CD38 antigen (p45) 5 Hs.42824 FLJ10718 hypothetical protein 6 Hs.139851 Caveolin 2 (CAV2) 7 Hs.34045 FLJ20764 hypothetical protein 8 Hs.37035 Homeo box HB9
[0170]Genes were ranked using the Pearson correlation criterion, see Table 17, with disease progression coded as Normal=1, Dysplasia=2, Grade3=3, Grade4=4. The p values are smaller than in the genes of Table 15, but the AUCs are worse. Three Febbo genes were found, corresponding to genes ranked 6th, 7th and 34th.
TABLE-US-00017 TABLE 17 Order Test Cancer Rank num Unigene ID Pvalue FDR AUC cor Febbo Gene description 1 6519 Hs.243960 <0.1 <0.0003 0.85 -1 0 gb: NM_016250.1/DEF = Homo s 2 9457 Hs.128749 <0.1 <0.0003 0.93 1 0 Consensus includes gb: AI796120 3 9976 Hs.103665 <0.1 <0.0003 0.89 -1 0 gb: BC004300.1/DEF = Homo sapiens, 4 9459 Hs.128749 <0.1 <0.0003 0.87 1 0 gb: AF047020.1/DEF = Homo sapiens gb: NM_014324.1 5 9458 Hs.128749 <0.1 <0.0003 0.89 1 0 Consensus includes gb: AA888 6 12337 Hs.7780 <0.1 <0.0003 0.96 1 1 Consensus includes gb: AV715767 7 893 Hs.226795 <0.1 <0.0003 0.97 -1 1 gb: NM_000852.2/DEF = Homo sapiens 8 19589 Hs.45140 <0.1 <0.0003 0.98 -1 0 gb: NM_021637.1/DEF = Homo sapiens 9 11911 Hs.279009 <0.1 <0.0003 0.98 -1 0 Consensus includes gb: AI653730 10 17944 Hs.279905 <0.1 <0.0003 0.96 1 0 gb: NM_016359.1/DEF = Homo sapiens gb: AF290612.1 gb: AF090915.1 11 9180 Hs.239926 <0.1 <0.0003 0.96 -1 0 Consensus includes gb: AV704962 12 18122 Hs.106747 <0.1 <0.0003 0.96 -1 0 gb: NM_021626.1/DEF = Homo sapiens protein /FL = gb: AF282618.1 gb: NM-- 13 12023 Hs.74034 <0.1 <0.0003 0.96 -1 0 Consensus includes gb: AU14739 14 374 Hs.234642 <0.1 <0.0003 0.96 -1 0 Cluster Incl. 74607: za55a01.s1 15 12435 Hs.82432 <0.1 <0.0003 0.96 -1 0 Consensus includes b: AA135522 16 18598 Hs.9728 <0.1 <0.0003 0.96 -1 0 gb: NM_016608.1/DEF = Homo sapiens 17 3638 Hs.74120 <0.1 <0.0003 0.97 -1 0 gb: NM_006829.1/DEF = Homo sapiens 18 5150 Hs.174151 <0.1 <0.0003 0.97 -1 0 gb: NM_001159.2/DEF = Homo sapiens 19 1889 Hs.195850 <0.1 <0.0003 0.97 -1 0 gb: NM_000424.1/DEF = Homo sapiens/DB_XREF = gi: 4557889/UG = Hs. 20 3425 Hs.77256 <0.1 <0.0003 0.97 1 0 gb: NM_004456.1/DEF = Homo sapiens/FL = gb: U61145.1 gb: NM_004456.1 21 5149 Hs.174151 <0.1 <0.0003 0.96 -1 0 gb: AB046692.1/DEF = Homo sapiens 22 4351 Hs.303090 <0.1 <0.0003 0.97 -1 0 Consensus includes gb: N26005 23 4467 Hs.24587 <0.1 <0.0003 0.97 -1 0 gb: NM_005864.1/DEF = Homo sapiens/FL = gb: AB001466.1 gb: NM_005864.1 24 12434 Hs.250723 <0.1 <0.0003 0.96 -1 0 Consensus includes gb: BF968134 25 12809 Hs.169401 <0.1 <0.0003 0.95 1 0 Consensus includes gb: AI358867 26 7082 Hs.95197 <0.1 <0.0003 0.95 -1 0 gb: AB015228.1/DEF = Homo sapiens gb: AB015228.1 27 18659 Hs.73625 <0.1 <0.0003 0.95 1 0 gb: NM_005733.1/DEF = Homo sapiens (rabkinesin6)/FL = gb: AF070672.1 28 13862 Hs.66744 <0.1 <0.0003 0.98 1 0 Consensus includes gb: X99268.1 syndrome)/FL = gb: NM_000474 29 3059 Hs.771 <0.1 <0.0003 0.98 -1 0 gb: NM_002863.1/DEF = Homo sapiens/DB_XREF = gi: 4506352/UG = Hs. 30 15294 Hs.288649 <0.1 <0.0003 0.98 1 0 Consensus includes gb: AK0 31 9325 Hs.34853 <0.1 <0.0003 0.99 -1 0 Consensus includes gb: AW157094 32 18969 Hs.20814 <0.1 <0.0003 0.98 1 0 gb: NM_015955.1/DEF = Homo sapiens 33 4524 Hs.65029 <0.1 <0.0003 0.96 -1 0 gb: NM_002048.1/DEF = Homo sapiens 34 1908 Hs.692 <0.1 <0.0003 0.97 1 1 gb: NM_002354.1/DEF = Homo sapiens signal transducer 1/FL = gb: M32306.1 35 11407 Hs.326776 <0.1 <0.0003 0.96 -1 0 gb: AF180519.1/DEF = Homo sapiens cds/FL = gb: AF180519.1 36 19501 Hs.272813 <0.1 <0.0003 0.96 -1 0 gb: NM_017434.1/DEF = Homo sapiens 37 11248 Hs.17481 <0.1 <0.0003 0.96 -1 0 gb: AF063606.1/DEF = Homo sapiens 38 5894 Hs.80247 <0.1 <0.0003 0.95 -1 0 gb: NM_000729.2/DEF = Homo sapiens 39 19455 Hs.26892 <0.1 <0.0003 0.96 -1 0 gb: NM_018456.1/DEF = Homo sapie BM040/FL = gb: AF217516.1 gb: 40 3448 Hs.169401 <0.1 <0.0003 0.96 1 0 Consensus includes gb: N33009 41 6666 Hs.90911 <0.1 <0.0003 0.96 -1 0 gb: NM_004695.1/DEF = Homo sapiens/UG = Hs.90911 solute carrier family 42 6924 Hs.820 <0.1 <0.0003 0.98 1 0 gb: NM_004503.1/DEF = Homo sapiens 43 2169 Hs.250811 <0.1 <0.0003 0.98 -1 0 Consensus includes gb: BG169673 44 12168 Hs.75318 <0.1 <0.0003 0.98 -1 0 Consensus includes gb: AL565074 45 18237 Hs.283719 <0.1 <0.0003 0.98 -1 0 gb: NM_018476.1/DEF = Homo sapiens HBEX2/FL = gb: AF220189.1 gb: 46 5383 Hs.182575 <0.1 <0.0003 0.98 -1 0 Consensus includes gb: BF223679 47 19449 Hs.17296 <0.1 <0.0003 0.99 -1 0 gb: NM_023930.1/DEF = Homo sapiens gb: BC001929.1 gb: NM_023930.1 48 4860 Hs.113082 <0.1 <0.0003 0.99 -1 0 gb: NM_014710.1/DEF = Homo sapiens 49 17714 Hs.5216 <0.1 <0.0003 0.99 1 0 gb: NM_014038.1/DEF = Homo sapiens 50 12020 Hs.137476 <0.1 <0.0003 0.97 -1 0 Consensus includes gb: AL582836
[0171]The data is rich in potential biomarkers. To find the most promising markers, criteria were designed to implement prior knowledge of disease severity and zonal information. This allowed better separation of relevant genes from genes that coincidentally well separate the data, thus alleviating the problem of overfitting. To further reduce the risk of overfitting, genes were selected that were also found in an independent study Table 15. Those genes include well-known proteins involved in prostate cancer and some potentially interesting targets.
Example 5
Prostate Cancer Gene Expression Microarray Data (11-2004)
[0172]Separations of class pairs were performed for "tumor (G3+4) vs. all other tissues". These separations are relatively easy and can be performed with fewer than 10 genes, however, hundreds of significant genes were identified.
[0173]Separations of "G4 vs. all others", "Dysplasia vs. all others", and "Normal vs. all others" are less easy (best AUCs between 0.75 and 0.85) and separation of "G3 vs. all others" is almost impossible in this data (AUC around 0.5). With over 100 genes, G4 can be separated from all other tissues with about 10% BER. Hundreds of genes separate G4 from all other tissues significantly, yet one cannot find a good separation with just a few genes.
[0174]Separations of "TZG4 vs. PZG4", "Normal vs. Dysplasia" and "G3 vs. G4" are also hard. 10×10-fold CV yielded very poor results. Using leave-one out CV and under 20 genes, we separated some pairs of classes: ERRTZG4/PZG4≈6%, ERRNL/Dys and ERRG3/G4≈9%. However, due to the small sample sizes, the significance of the genes found for those separations is not good, shedding doubt on the results.
[0175]Pre-operative PSA was found to correlate poorly with clinical variables (R2=0.316 with cancer volume, 0.025 with prostate weight, and 0.323 with CAvol/Weight). Genes were found with activity that correlated with pre-operative PSA either in BPH samples or G34 samples or both. Possible connections of those genes were found to cancer and/or prostate in the literature, but their relationship to PSA is not documented. Genes associated to PSA by their description do not have expression values correlated with pre-operative PSA. This illustrates that gene expression coefficients do not necessarily reflect the corresponding protein abundance.
[0176]Genes were identified that correlate with cancer volume in G3+4 tissues and with cure/fail prognosis. Neither are statistically significant, however, the gene most correlated with cancer volume has been reported in the literature as connected to prostate cancer. Prognosis information can be used in conjunction with grade levels to determine the significance of genes. Several genes were identified for separating G4 from non-G4 and G3 from G3 in the group the samples of patients with the poor prognosis in regions of lowest expression values.
[0177]The following experiments were performed using data consisting of a matrix of 87 lines (samples) and 22283 columns (genes) obtained from an Affymetrix U133A GeneChip®. The distributions of the samples of the microarray prostate cancer study are the same as those listed in Table 12.
[0178]Genes were selected on the basis of their individual separating power, as measured by the AUC (area under the ROC curve that plots sensitivity vs. specificity).
[0179]Similarly "random genes" that are genes obtained by permuting randomly the values of columns of the matrix are ranked. Where N is the total number of genes (here, N=22283, 40 times more random genes than real genes are used to estimate p values accurately (Nr=40*22283). For a given AUC value A, nr(A) is the number of random genes that have an AUC larger than A. The p value is estimated by the fraction of random genes that have an AUC larger than A, i.e.,:
Pvalue=(1+nr(A))/Nr
[0180]Adding 1 to the numerator avoids having zero p values for the best ranking genes and accounts for the limited precision due to the limited number of random genes. Because the pvalues of a large number of genes are measured simultaneously, correction must be applied to account for this multiple testing. As in the previous example, the simple Bonferroni correction is used:
Bonferroni--pvalue=N*(1+nr(A))/Nr
[0181]Hence, with a number of probes that is 40 times the number of genes, the p values are estimated with an accuracy of 0.025.
[0182]For a given gene of AUC value A, one can also compute the false discovery rate (FDR), which is an estimate of the ratio of the number of falsely significant genes over the number of genes called significant. Where n(A) is the number of genes found above A, the FDR is computed as the ratio of the p value (before Bonferroni correction) and the fraction of real genes found above A:
FDR=pvalue*N/n(A)=((1+nr(A))*N)/(n(A)*Nr).
[0183]Linear ridge regression classifiers (similar to SVMs) were trained with 10×10-fold cross validation, i.e., the data were split 100 times into a training set and a test set and the average performance and standard deviation were computed. In these experiments, the feature selection is performed within the cross-validation loop. That is, a separate featuring ranking is performed for each data split. The number of features are varied and a separate training/testing is performed for each number of features. Performances for each number of features are averaged to plot performance vs. number of features. The ridge value is optimized separately for each training subset and number of features, using the leave-one-out error, which can be computed analytically from the training error. In some experiments, the 10×10-fold cross-validation was done by leave-one-out cross-validation. Everything else remains the same.
[0184]Using the rankings obtained for the 100 data splits of the machine learning experiments (also called "bootstraps"), average gene ranks are computed. Average gene rank carries more information in proportion to the fraction of time a gene was always found in the top N ranking genes. This last criterion is sometimes used in the literature, but the number of genes always found in the top N ranking genes appears to grows linearly with N.
[0185]The following statistics were computed for cross-validation (10 times 10-fold or leave-one-out) of the machine learning experiments:
[0186]AUC mean: The average area under the ROC curve over all data splits.
[0187]AUC stdev: The corresponding standard deviation. Note that the standard error obtained by dividing stdev by the square root of the number of data splits is inaccurate because sampling is done with replacements and the experiments are not independent of one another.
[0188]BER mean: The average BER over all data splits. The BER is the balanced error rate, which is the average of the error rate of examples of the first class and examples of the second class. This provides a measure that is not biased toward the most abundant class.
[0189]BER stdev: The corresponding standard deviation.
[0190]Pooled AUC: The AUC obtained using the predicted classification values of all the test examples in all data splits altogether.
[0191]Pooled BER: The BER obtained using the predicted classification values of all the test examples in all data splits altogether.
[0192]Note that for leave-one-out CV, it does not make sense to compute BER-mean because there is only one example in each test set. Instead, the leave-one-out error rate or the pooled BER is computed.
[0193]High classification accuracy (as measured by the AUC) can be achieved a small number of genes (3 or more) to provide an AUC above 0.90. If the experimental repeats were independent, the standard error of the mean obtained by dividing the standard deviation by 10 could be used as an error bar. A more reasonable estimate of the error bar may be obtained by dividing it by three to account for the dependencies between repeats.
[0194]The genes listed in the following tables are ranked according to their individual AUC computed with all the data. The first column is the rank, followed by the Gene ID (order number in the data matrix), and the Unigene ID. The column "Under Expr" is +1 if the gene is underexpressed and -1 otherwise. AUC is the ranking criterion. Pval is the pvalue computed with random genes as explained above. FDR is the false discovery rate. "Ave. rank" is the average rank of the feature when subsamples of the data are taken in a 10×10-fold cross-validation experiment in Tables 18, 21, 23, 25 & 27 and with leave-one-out in Tables 29, 31 & 33.
[0195]In the test to separate tumors (cancer G3 and G4) from other tissues, the results show that it is relatively easy to separate tumor from other tissues. The list of the top 50 tumor genes, both overexpressed and underexpressed in cancer, is shown in Table 18. A complete listing of the top 200 tumor genes is provided in FIG. The three best genes, Gene IDs no. 9457, 9458 and 9459 all have same Unigene ID. Additional description about the top three genes is provided in Table 19 below.
TABLE-US-00018 TABLE 18 Under Gene Expr. In Ave. Rank ID Unigene ID tumor AUC Pval FDR rank 1 9459 Hs.128749 -1 0.9458 0.02 0.025 1.16 2 9458 Hs.128749 -1 0.9425 0.02 0.012 2.48 3 9457 Hs.128749 -1 0.9423 0.02 0.0083 2.51 4 11911 Hs.279009 1 0.9253 0.02 0.0062 4.31 5 12337 Hs.7780 -1 0.9125 0.02 0.005 7.23 6 983 Hs.226795 1 0.9076 0.02 0.0042 8.42 7 18792 Hs.6823 -1 0.9047 0.02 0.0036 10.04 8 1908 Hs.692 -1 0.9044 0.02 0.0031 10.03 9 19589 Hs.45140 1 0.9033 0.02 0.0028 10.47 10 6519 Hs.243960 1 0.8996 0.02 0.0025 12.67 11 17714 Hs.5216 -1 0.8985 0.02 0.0023 13.93 12 18122 Hs.106747 1 0.8985 0.02 0.0021 13.86 13 18237 Hs.283719 1 0.8961 0.02 0.0019 16.61 14 3059 Hs.771 1 0.8942 0.02 0.0018 17.86 15 16533 Hs.110826 -1 0.8921 0.02 0.0017 19.44 16 18598 Hs.9728 1 0.8904 0.02 0.0016 19.43 17 12434 Hs.250723 1 0.8899 0.02 0.0015 20.19 18 4922 Hs.55279 1 0.884 0.02 0.0014 27.23 19 13862 Hs.66744 -1 0.8832 0.02 0.0013 30.59 20 9976 Hs.103665 1 0.8824 0.02 0.0012 30.49 21 18835 Hs.44278 -1 0.8824 0.02 0.0012 30.94 22 3331 Hs.54697 1 0.8802 0.02 0.0011 32.35 23 18969 Hs.20814 -1 0.8797 0.02 0.0011 35.89 24 9373 Hs.21293 -1 0.8786 0.02 0.001 35.52 25 15294 Hs.288649 -1 0.8786 0.02 0.001 35.69 26 4497 Hs.33084 1 0.8776 0.02 0.00096 37.77 27 5001 Hs.823 -1 0.8765 0.02 0.00093 40.25 28 9765 Hs.22599 1 0.8765 0.02 0.00089 39.32 29 4479 Hs.198760 1 0.8759 0.02 0.00086 40.82 30 239 Hs.198760 1 0.8749 0.02 0.00083 43.04 31 6666 Hs.90911 1 0.8749 0.02 0.00081 42.53 32 12655 Hs.10587 1 0.8749 0.02 0.00078 41.56 33 19264 Hs.31608 -1 0.8743 0.02 0.00076 44.66 34 5923 Hs.171731 1 0.8738 0.02 0.00074 44.3 35 1889 Hs.195850 1 0.8727 0.02 0.00071 46.1 36 21568 Hs.111676 1 0.8716 0.02 0.00069 48.3 37 3264 Hs.139336 -1 0.8714 0.02 0.00068 51.17 38 14738 Hs.8198 1 0.8706 0.02 0.00066 52.7 39 1867 Hs.234680 1 0.8695 0.02 0.00064 52.99 40 4467 Hs.24587 1 0.8695 0.02 0.00062 52.25 41 9614 Hs.8583 1 0.8695 0.02 0.00061 53.62 42 18659 Hs.73625 -1 0.8692 0.02 0.0006 56.86 43 20137 Hs.249727 1 0.8692 0.02 0.00058 55.2 44 12023 Hs.74034 1 0.869 0.02 0.00057 55.69 45 12435 Hs.82432 1 0.869 0.02 0.00056 56.63 46 14626 Hs.23960 -1 0.8687 0.02 0.00054 58.95 47 7082 Hs.95197 1 0.8684 0.02 0.00053 56.27 48 15022 Hs.110826 -1 0.8679 0.02 0.00052 59.51 49 20922 Hs.0 -1 0.8679 0.02 0.00051 59.93 50 4361 Hs.102 1 0.8673 0.02 0.0005 60.94
TABLE-US-00019 TABLE 19 Gene ID Description 9457 gb: AI796120 /FEA = EST /DB_XREF = gi: 5361583 /DB_XREF = est: wh42f03.x1 /CLONE = IMAGE: 2383421 /UG = Hs.128749 alphamethylacyl-CoA racemase /FL = gb: AF047020.1 gb: AF158378.1 gb: NM_014324.1 9458 gb: AA888589 /FEA = EST /DB_XREF = gi: 3004264 /DB_XREF = est: oe68e10.s1 /CLONE = IMAGE: 1416810 /UG = Hs.128749 alphamethylacyl-CoA racemase /FL = gb: AF047020.1 gb: AF158378.1 gb: NM_014324.1 9459 gb: AF047020.1 /DEF = Homo sapiens alpha-methylacyl-CoA racemase mRNA, complete cds. /FEA = mRNA /PROD = alpha-methylacyl-CoA racemase /DB_XREF = gi: 4204096 /UG = Hs.128749 alpha-methylacyl-CoA racemase /FL = gb: AF047020.1 gb: AF158378.1 gb: NM_014324.1
[0196]This gene has been reported in numerous papers including Luo, et al., Molecular Carcinogenesis, 33(1): 25-35 (January 2002); Luo J, et al., Abstract Cancer Res., 62(8): 2220-6 (2002 Apr. 15).
[0197]Table 20 shows the separation with varying number of features for tumor (G3+4) vs. all other tissues.
TABLE-US-00020 TABLE 20 feat. num. 1 2 3 4 5 6 7 8 9 10 16 32 64 128 100 * 92.28 93.33 93.83 94 94.33 94.43 94.1 93.8 93.43 93.53 93.45 93.37 93.18 93.03 AUC 100 * 11.73 10.45 10 9.65 9.63 9.61 10.3 10.54 10.71 10.61 10.75 10.44 11.49 11.93 AUCstd BER 14.05 13.1 12.6 10.25 9.62 9.72 9.75 9.5 9.05 9.05 9.7 9.6 10.12 9.65 (%) BERstd 13.51 12.39 12.17 11.77 9.95 10.06 10.15 10.04 9.85 10.01 10.2 10.3 10.59 10.26 (%)
[0198]Using the same experimental setup, separations were attempted for G4 from non G4, G3 from non G3, Dysplasia from non-dys and Normal from non-Normal. These separations were less successful than the above-described tests, indicating that G3, dysplasia and normal do not have molecular characteristics that distinguish them easily from all other samples. Lists of genes are provided in Tables 21-37.
[0199]Table 21 lists the top 10 genes separating Grade 4 prostate cancer (G4) from all others.
TABLE-US-00021 TABLE 21 Under Gene Expr. In Ave. Rank ID Unigene ID G4 AUC Pval FDR rank 1 5923 Hs.171731 1 0.9204 0.02 0.025 3.25 2 18122 Hs.106747 1 0.9136 0.02 0.012 6.17 3 19573 Hs.232165 1 0.9117 0.02 0.0083 7.92 4 893 Hs.226795 1 0.9099 0.02 0.0062 7.22 5 9889 Hs.137569 1 0.9093 0.02 0.005 8.8 6 19455 Hs.26892 1 0.908 0.02 0.0042 10.54 7 19589 Hs.45140 1 0.9074 0.02 0.0036 10.54 8 18598 Hs.9728 1 0.9062 0.02 0.0031 10.83 9 6519 Hs.243960 1 0.9037 0.02 0.0028 12.79 10 11175 Hs.137569 1 0.9031 0.02 0.0025 13.46
Table 22 below provides the details for the top two genes of this group.
TABLE-US-00022 TABLE 22 Gene ID Description 5923 gb: NM_015865.1 /DEF = Homo sapiens solute carrier family 14 (urea transporter), member 1 (Kidd blood group) (SLC14A1), mRNA. /FEA = mRNA /GEN = SLC14A1 /PROD = RACH1 /DB_XREF = gi: 7706676 /UG = Hs.171731 solute carrier family 14 (urea transporter), member 1 (Kidd blood group) /FL = gb: U35735.1 gb: NM_015865.1 18122 gb: NM_021626.1 /DEF = Homo sapiens serine carboxypeptidase 1 precursor protein (HSCP1), mRNA. /FEA = mRNA /GEN = HSCP1 /PROD = serine carboxypeptidase 1 precursor protein /DB_XREF = gi: 11055991 /UG = Hs.106747 serine carboxypeptidase 1 precursor protein /FL = gb: AF282618.1 gb: NM_021626.1 gb: AF113214.1 gb: AF265441.1
[0200]The following provide the gene descriptions for the top two genes identified in each separation:
[0201]Table 23 lists the top 10 genes separating Normal prostate versus all others.
TABLE-US-00023 TABLE 23 Under Expr. Gene in Ave. Rank ID Unigene ID Normal AUC Pval FDR Rank 1 6519 Hs.243960 -1 0.886 0.02 0.025 1.3 2 3448 Hs.169401 1 0.8629 0.02 0.012 4.93 3 17900 Hs.8185 -1 0.8601 0.02 0.0083 6.17 4 6666 Hs.90911 -1 0.8552 0.02 0.0062 6.59 5 893 Hs.226795 -1 0.8545 0.02 0.005 7.22 6 6837 Hs.159330 -1 0.8545 0.02 0.0042 8.05 7 374 Hs.234642 -1 0.8483 0.02 0.0036 9.69 8 9976 Hs.103665 -1 0.8458 0.02 0.0031 11.62 9 3520 Hs.2794 -1 0.8399 0.02 0.0028 15.29 10 3638 Hs.74120 -1 0.8357 0.02 0.0025 18.17
The top two genes from Table 23 are described in detail in Table 24.
TABLE-US-00024 TABLE 24 Gene ID Description 6519 gb: NM_016250.1 /DEF = Homo sapiens N-myc downstream-regulated gene 2 (NDRG2), mRNA. /FEA = mRNA /GEN = NDRG2 /PROD = KIAA1248 protein /DB_XREF = gi: 10280619 /UG = Hs.243960 N-myc downstream-regulated gene 2 /FL = gb: NM_016250.1 gb: AF159092. 3448 gb: N33009 /FEA = EST /DB_XREF = gi: 1153408 /DB_XREF = est: yy31f09.s1 /CLONE = IMAGE: 272873 /UG = Hs.169401 apolipoprotein E /FL = gb: BC003557.1 gb: M12529.1 gb: K00396.1 gb: NM_000041.1
[0202]Table 25 lists the top 10 genes separating G3 prostate cancer from all others.
TABLE-US-00025 TABLE 25 Under Gene Expr. in Ave. Rank ID Unigene ID G3 AUC Pval FDR rank 1 18446 Hs.283683 -1 0.8481 1 1.5 2.14 2 2778 Hs.230 -1 0.8313 1 1.8 8.14 3 16102 Hs.326526 1 0.8212 1 2.2 10.71 4 12046 Hs.166982 1 0.817 1 2.1 15.14 5 9156 Hs.3416 -1 0.8158 1 1.8 14.71 6 9459 Hs.128749 -1 0.8158 1 1.5 20.43 7 21442 Hs.71819 -1 0.8158 1 1.3 13.86 8 6994 Hs.180248 -1 0.814 1 1.3 11.71 9 17019 Hs.128749 -1 0.8116 1 1.3 23.14 10 9457 Hs.128749 -1 0.8074 1 1.3 34.71
The top two genes listed in Table 25 are described in detail in Table 26.
TABLE-US-00026 TABLE 26 Gene ID Description 18446 gb: NM_020130.1 /DEF = Homo sapiens chromosome 8 open reading frame 4 (C8ORF4), mRNA. /FEA = mRNA /GEN = C8ORF4 /PROD = chromosome 8 open reading frame 4 /DB_XREF = gi: 9910147 /UG = Hs.283683 chromosome 8 open reading frame 4 /FL = gb: AF268037.1 gb: NM_020130.1 2778 gb: NM_002023.2 /DEF = Homo sapiens fibromodulin (FMOD), mRNA. /FEA = mRNA /GEN = FMOD /PROD = fibromodulin precursor /DB_XREF = gi: 5016093 /UG = Hs.230 fibromodulin /FL = gb: NM_002023.2
[0203]Table 27 shows the top 10 genes separating Dysplasia from everything else.
TABLE-US-00027 TABLE 27 Under Gene Expr. in Ave. Rank ID Unigene ID dysplasia AUC Pval FDR rank 1 5509 Hs.178121 -1 0.8336 0.15 0.15 4.53 2 4102 Hs.75426 -1 0.8328 0.15 0.075 4.31 3 10777 Hs.101047 1 0.8319 0.17 0.058 5.6 4 18814 Hs.319088 1 0.8189 0.45 0.11 10.95 5 4450 Hs.154879 1 0.8168 0.5 0.1 11.57 6 14885 Hs.2554 1 0.8164 0.53 0.088 18.04 7 10355 Hs.169832 1 0.8126 0.63 0.089 14.3 8 5072 Hs.122647 -1 0.8063 0.72 0.091 26.77 9 3134 Hs.323469 -1 0.805 0.8 0.089 22.76 10 15345 Hs.95011 1 0.8017 1 0.11 29.3
[0204]Table 28 provides the details for the top two genes listed in Table 27.
TABLE-US-00028 TABLE 28 Gene ID Description 5509 gb: NM_021647.1 /DEF = Homo sapiens KIAA0626 gene product (KIAA0626), mRNA. /FEA = mRNA /GEN = KIAA0626 /PROD = KIAA0626 gene product /DB_XREF = gi: 11067364 /UG = Hs.178121 KIAA0626 gene product /FL = gb: NM_021647.1 gb: AB014526.1 4102 gb: NM_003469.2 /DEF = Homo sapiens secretogranin II (chromogranin C) (SCG2), mRNA. /FEA = mRNA /GEN = SCG2 /PROD = secretogranin II precursor /DB_XREF = gi: 10800415 /UG = Hs.75426 secretogranin II (chromogranin C) /FL = gb: NM_003469.2 gb: M25756.1
[0205]Due to the small sample sizes, poor performance was obtained with 10×10-fold cross-validation. To avoid this problem, leave-one-out cross-validation was used instead. In doing so, the average AUC for all repeats cannot be reported because there is only one test example in each repeat. Instead, the leave-one-out error rate and the pooled AUC are evaluated. However, all such pairwise separations are difficult to achieve with high accuracy and a few features.
[0206]Table 29 lists the top 10 genes separating G3 from G4. Table 30 provides the details for the top two genes listed.
TABLE-US-00029 TABLE 29 (+) Expr. in G4; Gene (-) Expr. Ave. Rank ID Unigene ID in G3 AUC Pval FDR rank 1 19455 Hs.26892 -1 0.9057 0.45 0.45 1.09 2 11175 Hs.137569 -1 0.8687 1 1.8 2.95 3 9156 Hs.3416 -1 0.8653 1 1.4 4 4 18904 Hs.315167 1 0.8653 1 1.1 4.71 5 9671 Hs.98658 1 0.8636 1 0.99 5.45 6 2338 Hs.62661 -1 0.8586 1 0.96 6.64 7 2939 Hs.82906 1 0.8586 1 0.82 7.46 8 450 Hs.27262 1 0.8552 1 0.8 8.44 9 18567 Hs.193602 1 0.8535 1 0.85 9.49 10 5304 Hs.252136 -1 0.8519 1 0.77 10.67
TABLE-US-00030 TABLE 30 Gene ID Description 19455 gb: NM_018456.1 /DEF = Homo sapiens uncharacterized bone marrow protein BM040 (BM040), mRNA. /FEA = mRNA /GEN = BM040 /PROD = uncharacterized bone marrow protein BM040 /DB_XREF = gi: 8922098 /UG = Hs.26892 uncharacterized bone marrow protein BM040 /FL = gb: AF217516.1 gb: NM_018456.1 11175 gb: AB010153.1 /DEF = Homo sapiens mRNA for p73H, complete cds. /FEA = mRNA /GEN = p73H /PROD = p73H /DB_XREF = gi: 3445483 /UG = Hs.137569 tumor protein 63 kDa with strong homology to p53 /FL = gb: AB010153.1
[0207]Table 31 lists the top 10 genes for separating Normal prostate from Dysplasia. Details of the top two genes for performing this separation are provided in Table 32.
TABLE-US-00031 TABLE 31 (-) Expr. in NL; Gene (+) Expr. Ave. Rank ID Unigene ID in Dys AUC Pval FDR rank 1 4450 Hs.154879 -1 0.9037 0.05 0.05 1.09 2 10611 Hs.41682 1 0.8957 0.075 0.037 2.02 3 9048 Hs.177556 -1 0.8743 0.45 0.15 3.17 4 18069 Hs.103147 -1 0.8717 0.57 0.14 4.06 5 7978 Hs.20815 -1 0.8583 1 0.23 5.56 6 6837 Hs.159330 -1 0.8556 1 0.21 6.37 7 7229 Hs.71816 -1 0.8463 1 0.34 8.03 8 21059 Hs.283753 1 0.8449 1 0.3 9.51 9 15345 Hs.95011 -1 0.8436 1 0.29 9.94 10 2463 Hs.91251 -1 0.8369 1 0.38 11.78
TABLE-US-00032 TABLE 32 Gene ID Description 4450 gb: NM_022719.1 /DEF = Homo sapiens DiGeorge syndrome critical region gene DGSI (DGSI), mRNA. /FEA = mRNA /GEN = DGSI /PROD = DiGeorge syndrome critical region gene DGSIprotein /DB_XREF = gi: 13027629 /UG = Hs.154879 DiGeorge syndrome critical region gene DGSI /FL = gb: NM_022719.1 10611 gb: U30610.1 /DEF = Human CD94 protein mRNA, complete cds. /FEA = mRNA /PROD = CD94 protein /DB_XREF = gi: 1098616 /UG = Hs.41682 killer cell lectin- like receptor subfamily D, member 1 /FL = gb: U30610.1 gb: NM_002262.2
[0208]Table 33 lists the top 10 genes for separating peripheral zone G4 prostate cancer from transition zone G4 cancer. Table 34 provides the details for the top two genes in this separation.
TABLE-US-00033 TABLE 33 (-) Expr. in TZ; Gene (+) Expr. Ave. Rank ID Unigene ID In PZ AUC Pval FDR rank 1 4654 Hs.194686 1 0.9444 1 1.2 1.1 2 14953 Hs.306423 1 0.9306 1 1.1 2.45 3 929 Hs.279949 -1 0.9167 1 1.7 4 4 6420 Hs.274981 1 0.9167 1 1.3 4.84 5 7226 Hs.673 1 0.9167 1 1 5.69 6 18530 Hs.103291 1 0.9167 1 0.86 6.68 7 6618 Hs.2563 1 0.9097 1 1.1 7.82 8 16852 Hs.75626 1 0.9097 1 0.93 8.91 9 19242 Hs.12692 1 0.9097 1 0.82 9.78 10 6106 Hs.56294 1 0.9063 1 1 10.75
TABLE-US-00034 TABLE 34 Gene ID Description 4654 gb: NM_003951.2 /DEF = Homo sapiens solute carrier family 25 (mitochondrial carrier, brain), member 14 (SLC25A14), transcript variant long, nuclear gene encoding mitochondrial protein, mRNA. /FEA = mRNA /GEN = SLC25A14 /PROD = solute carrier family 25, member 14, isoformUCP5L /DB_XREF = gi: 6006039 /UG = Hs.194686 solute carrier family 25 (mitochondrial carrier, brain), member 14 /FL = gb: AF155809.1 gb: AF155811.1 gb: NM_022810.1 gb: AF078544.1 gb: NM_003951.2 14953 gb: AK002179.1 /DEF = Homo sapiens cDNA FLJ11317 fis, clone PLACE1010261, moderately similar to SEGREGATION DISTORTER PROTEIN. /FEA = mRNA /DB_XREF = gi: 7023899 /UG = Hs.306423 Homo sapiens cDNA FLJ11317 fis, clone PLACE1010261, moderately similar to SEGREGATION DISTORTER PROTEIN
[0209]As stated in an earlier discussion, PSA is not predictive of tissue malignancy.
[0210]There is very little correlation of PSA and cancer volume (R2=0.316). The R2 was also computed for PSA vs. prostate weight (0.025) and PSA vs. CA/Weight (0.323). PSA does not separate well the samples in malignancy categories. In this data, there did not appear to be any correlation between PSA and prostate weight.
[0211]A test was conducted to identify the genes most correlated with PSA, in BPH samples or in G3/4 samples, which were found to be genes 11541 for BPH and 14523 for G3/4. The details for these genes are listed below in Table 35.
TABLE-US-00035 TABLE 35 Gene ID Description 11541 gb: AB050468.1 /DEF = Homo sapiens mRNA for membrane glycoprotein LIG-1, complete cds. /FEA = mRNA /GEN = lig-1 /PROD = membrane glycoprotein LIG-1 /DB_XREF = gi: 13537354 /FL = gb: AB050468.1 14523 gb: AL046992 /FEA = EST /DB_XREF = gi: 5435048 /DB_XREF = est: DKFZp586L0417_r1 /CLONE = DKFZp586L0417 /UG = Hs.184907 G protein-coupled receptor 1 /FL = gb: NM_005279.1 5626 gb: NM_006200.1 /DEF = Homo sapiens proprotein convertase subtilisinkexin type 5 (PCSK5), mRNA. /FEA = mRNA /GEN = PCSK5 /PROD = proprotein convertase subtilisinkexin type 5 /DB_XREF = gi: 11321618 /UG = Hs.94376 proprotein convertase subtilisinkexin type 5 /FL = gb: NM_006200.1 gb: U56387.2
[0212]Gene 11541 shows no correlation with PSA in G3/4 samples, whereas gene 14523 shows correlation in BPH samples. Thus, 11541 is possibly the result of some overfitting due to the fact that pre-operative PSAs are available for only 7 BPH samples. Gene 14523 appears to be the most correlated gene with PSA in all samples. Gene 5626, also listed in Table 35, has good correlation coefficients (RBPH2=0.44, RG342=0.58).
[0213]Reports are found in the published literature indicating that G Protein-coupled receptors such as gene 14523 are important in characterizing prostate cancer. See, e.g. L. L. Xu, et al. Cancer Research 60, 6568-6572, Dec. 1, 2000.
[0214]For comparison, genes that have "prostate specific antigen" in their description (none had PSA) were considered: [0215]Gene 4649: gb:NM--001648.1/DEF=Homo sapiens kallikrein 3, (prostate specific antigen) (KLK3), mRNA./FEA=mRNA/GEN=KLK3/PROD=kallikrein 3, (prostate specific antigen)/DB_XREF=gi:4502172/UG=Hs. 171995 kallikrein 3, (prostate specific antigen)/FL=gb:BC005307.1 gb:NM--001648.1 gb:U17040.1 gb:M26663.1; and [0216]Gene 4650: gb:U17040.1/DEF=Human prostate specific antigen precursor mRNA, complete cds./FEA=mRNA/PROD=prostate specific antigen precursor /DB_XREF=gi:595945/UG=Hs.171995 kallikrein 3, (prostate specific antigen) /FL=gb:BC005307.1 gb:NM--001648.1 gb:U17040.1 gb:M26663.1. Neither of these genes had activity that correlates with preoperative PSA.
[0217]Another test looked at finding genes whose expression correlate with cancer volume in grade 3 and 4 cancer tissues. However, even the most correlated gene is not found significant with respect to the Bonferroni-corrected pvalue (pval=0.42). Table 36 lists the top nine genes most correlated with cancer volume in G3+4 samples. The details of the top gene are provided in Table 37.
TABLE-US-00036 TABLE 36 Rank Gene ID Unigene ID Sign corr. Pearson Pval FDR 1 8851 Hs.217493 -1 0.6582 0.43 0.43 2 6892 Hs.2868 -1 0.6282 1 0.51 3 21353 Hs.283803 1 0.6266 1 0.36 4 7731 Hs.182507 -1 0.6073 1 0.53 5 4853 Hs.86958 -1 0.6039 1 0.46 6 622 Hs.14449 -1 0.5958 1 0.48 7 8665 Hs.74497 1 0.5955 1 0.41 8 13750 Hs.2014 -1 0.579 1 0.6 9 15413 Hs.177961 -1 0.5775 1 0.56
TABLE-US-00037 TABLE 37 Gene ID Description 8851 gb: M62898.1 /DEF = Human lipocortin (LIP) 2 pseudogene mRNA, complete cdslike region. /FEA = mRNA /DB_XREF = gi: 187147 /UG = Hs.217493 annexin A2 /FL = gb: M62898.1
[0218]A lipocortin has been described in U.S. Pat. No. 6,395,715 entitled "Uteroglobin gene therapy for epithelial cell cancer". Using RT-PCR, under-expression of lipocortin in cancer compared to BPH has been reported by Kang J S et al., Clin Cancer Res. 2002 January; 8(1):117-23.
Example 6
Prostate Cancer Comparative Study of Stamey Data (12-2004)
[0219]In this example sets of genes obtained with two different data sets are compared. Both data sets were generated by Dr. Thomas A. Stamey of Stanford University, the first in 2001 using Affymetrix HuGeneFL probe arrays ("Stamey 2001"), the second in 2003 using Affymetrix U133A chip ("Stamey 2003"). After matching the genes in both arrays, a set of about 2000 common genes was used in the study. Gene selection was performed on the data of both studies independently, then the resulting gene sets were compared. A remarkable agreement was found. In addition, classifiers were trained on one dataset and tested on the other. In the separation tumor (G3/4) vs. all other tissues, classification accuracies comparable to those obtained in previous reports were obtained by cross-validation on the second study: 10% error can be achieved with 10 genes (on the independent test set of the first study); by cross-validation, there was 8% error. In the separation BPH vs. all other tissues, there was also 10% error with 10 genes. The cross-validation results for BPH were overly optimistic (only one error), however this was not unexpected since there were only 10 BPH samples in the second study. Tables of genes were selected by consensus of both studies.
[0220]The Stamey 2001 (first) data set consisted of 67 samples from 26 patients. The Affymetrix HuGeneFL probe arrays used have 7129 probes, representing ˜6500 genes. The composition of the 2001 dataset (number of samples in parenthesis) is summarized in Table 38. Several grades and zones are represented, however, all TZ samples are BPH (no cancer), all CZ samples are normal (no cancer). Only the PZ contains a variety of samples. Also, many samples came from the same tissues.
TABLE-US-00038 TABLE 38 Zone Histological classification CZ (3) NL (3) PZ (46) NL (5) Stroma (1) Dysplasia (3) G3 (10) G4 (27) TZ (18) BPH (18) Total 67
[0221]The Stamey 2003 (second) dataset consisted of a matrix of 87 lines (samples) and 22283 columns (genes) obtained from an Affymetrix U133A chip. The distribution of the samples of the microarray prostate cancer study is given as been provided previously in Table 12.
[0222]Genes that had the same Gene Accession Number (GAN) in the two arrays HuGeneFL and U133A were selected. The selection was further limited to descriptions that matched reasonably well. For that purpose, a list of common words was created. A good match corresponds to a pair of description having at least one common word, excluding these common words, short words (fewer that 3 letters) and numbers. The resulting set included 2346 genes.
[0223]Because the data from both studies had previously been normalized using different methods, it was re-normalized using the routine provided below. Essentially, the data is translated and scaled, the log is taken, the lines and columns are normalized; the outlier values are squashed. This preprocessing was selected based on a visual examination of the data.
[0224]For the 2001 study, a bias of -0.08 was used. For the 2003 study, the bias was 0. Visual examination revealed that these values stabilize the variance of both classes reasonably well.
[0225]The set of 2346 genes was ranked using the data of both studies independently, with the area under the ROC curve (AUC) being used as the ranking criterion. P values were computed with the Bonferroni correction and False discovery rate (FDR) was calculated.
[0226]Both rankings were compared by examining the correlation of the AUC scores. Cross-comparisons were done by selecting the top 50 genes in one study and examining how "enriched" in those genes were the lists of top ranking genes from the other study, varying the number of genes. This can be compared to a random ranking. For a consensus ranking, the genes were ranked according to their smallest score in the two studies.
[0227]Reciprocal tests were run in which the data from one study was used for training of the classifier which was then tested on the data from the other study. Three different classifiers were used: Linear SVM, linear ridge regression, and Golub's classifier (analogous to Naive Bayes). For every test, the features selected with the training set were used. For comparison, the consensus features were also used.
[0228]Separation of all tumor samples (G3 and G4) from all others was performed, with the G3 and G4 samples being grouped into the positive class and all samples grouped into the negative class. The top 200 genes in each study of Tumor G3/4 vs. others are listed in the tables in FIGS. 5a-5o for the 2001 study and the 2003 study. The genes were ranked in two ways, using the data of the first study (2001) and using the data of the second study (2003)
[0229]Most genes ranking high in one study also rank high in the other, with some notable exceptions. These exceptions may correspond to probes that do not match in both arrays even though their gene identification and descriptions match. They may also correspond to probes that "failed" to work in one array.
[0230]Table 39 lists the top 50 genes resulting from the feature ranking by consensus between the 2001 study and the 2003 study Tumor G3/4 vs. others. A listing of the top 200 genes, including the 50 genes in Table 39, is provided in FIGS. 6a-6g. Ranking was performed according to a score that is the minimum of score0 and score1
TABLE-US-00039 TABLE 39 Unigene Over Rk ID Expr Scor Rk0 Score0 Rk1 Score1 Description 1 Hs.195850 -1 0.8811 7 0.8811 2 0.8813 Human keratin type II (58 kD) mRNA 2 Hs.171731 -1 0.8754 1 0.9495 3 0.8754 Human RACH1 (RACH1) mRNA 3 Hs.65029 -1 0.8647 8 0.8802 5 0.8647 Human gas1 gene 4 Hs.771 -1 0.8532 15 0.8532 1 0.8953 Human liver glycogen phosphorylase mRNA 5 Hs.79217 1 0.8532 16 0.8532 7 0.855 Human pyrroline 5-carboxylate reductase mRNA 6 Hs.198760 -1 0.8495 19 0.8495 4 0.869 H. sapiens NF-H gene 7 Hs.174151 -1 0.8448 4 0.8892 10 0.8448 Human aldehyde oxidase (hAOX) mRNA 8 Hs.44 -1 0.841 12 0.8685 14 0.841 Human nerve growth factor (HBNF- 1) mRNA 9 Hs.3128 1 0.841 2 0.9081 15 0.841 Human RNA polymerase II subunit (hsRPB8) mRNA 10 Hs.34853 -1 0.8314 5 0.8892 20 0.8314 Human Id-related helix-loop-helix protein Id4 mRNA 11 Hs.113 -1 0.8217 13 0.8658 24 0.8217 Human cytosolic epoxide hydrolase mRNA 12 Hs.1813 -1 0.8201 31 0.827 25 0.8201 Homo sapiens synaptic vesicle amine transporter (SVAT) mRNA 13 Hs.2006 -1 0.8099 40 0.8099 23 0.8255 Human glutathione transferase M3 (GSTM3) mRNA 14 Hs.76224 -1 0.8083 28 0.836 39 0.8083 Human extracellular protein (S1-5) mRNA 15 Hs.27311 1 0.8056 11 0.8694 42 0.8056 Human transcription factor SIM2 long form mRNA 16 Hs.77546 -1 0.8008 14 0.8649 46 0.8008 Human mRNA for KIAA0172 gene 17 Hs.23838 1 0.7982 50 0.7982 22 0.8287 Human neuronal DHP-sensitive 18 Hs.10755 -1 0.7955 53 0.7955 17 0.8373 Human mRNA for dihydropyrimidinase 19 Hs.2785 -1 0.7911 24 0.8414 51 0.7911 H. sapiens gene for cytokeratin 17 20 Hs.86978 1 0.7748 75 0.7748 70 0.7777 H. sapiens mRNA for prolyl oligopeptidase 21 Hs.2025 -1 0.7744 3 0.9027 73 0.7744 Human transforming growth factor- beta 3 (TGF-beta3) mRNA 22 Hs.30054 1 0.7734 45 0.8054 74 0.7734 Human coagulation factor V mRNA 23 Hs.155591 -1 0.7723 52 0.7973 76 0.7723 Human forkhead protein FREAC-1 mRNA 24 Hs.237356 -1 0.7712 81 0.7712 61 0.7846 Human intercrine-alpha (hIRH) mRNA 25 Hs.211933 -1 0.7707 70 0.7784 80 0.7707 Human (clones HT-[125 26 Hs.75746 1 0.7691 78 0.7721 81 0.7691 Human aldehyde dehydrogenase 6 mRNA 27 Hs.155597 -1 0.7676 85 0.7676 78 0.7712 Human adipsin/complement factor D mRNA 28 Hs.75111 -1 0.7669 21 0.8432 85 0.7669 Human cancellous bone osteoblast mRNA for serin protease with IGF- binding motif 29 Hs.75137 -1 0.7664 37 0.8108 86 0.7664 Human mRNA for KIAA0193 gene 30 Hs.76307 -1 0.7658 86 0.7658 12 0.841 Human mRNA for unknown product 31 Hs.79059 -1 0.7653 44 0.8063 87 0.7653 Human transforming growth factor- beta type III receptor (TGF-beta) mRNA 32 Hs.1440 1 0.7632 36 0.8108 92 0.7632 Human gamma amino butyric acid (GABAA) receptor beta-3 subunit mRNA 33 Hs.66052 -1 0.7626 60 0.7883 93 0.7626 1299-1305 34 Hs.155585 -1 0.7626 6 0.8838 94 0.7626 Human transmembrane receptor (ror2) mRNA 35 Hs.153322 -1 0.7589 35 0.8126 98 0.7589 Human mRNA for phospholipase C 36 Hs.77448 -1 0.7583 87 0.7658 99 0.7583 Human pyrroline-5-carboxylate dehydrogenase (P5CDh) mRNA 37 Hs.190787 -1 0.7568 94 0.7568 69 0.7782 Human tissue inhibitor of metalloproteinase 4 mRNA 38 Hs.172851 -1 0.7567 48 0.8 101 0.7567 Human arginase type II mRNA 39 Hs.85146 -1 0.7562 20 0.8459 103 0.7562 Human erythroblastosis virus oncogene homolog 2 (ets-2) mRNA 40 Hs.10526 -1 0.7556 17 0.8532 105 0.7556 Human smooth muscle LIM protein (h-SmLIM) mRNA 41 Hs.81412 -1 0.7551 61 0.7865 106 0.7551 Human mRNA for KIAA0188 gene 42 Hs.180107 1 0.7541 96 0.7541 44 0.8024 Human mRNA for DNA polymerase beta 43 Hs.245188 -1 0.7519 56 0.7937 113 0.7519 Human tissue inhibitor of metalloproteinases-3 mRNA 44 Hs.56145 1 0.7508 55 0.7946 114 0.7508 Human mRNA for NB thymosin beta 45 Hs.620 -1 0.7497 18 0.8523 115 0.7497 Human bullous pemphigoid antigen (BPAG1) mRNA 46 Hs.83450 -1 0.7495 101 0.7495 67 0.7803 Homo sapiens laminin-related protein (LamA3) mRNA 47 Hs.687 -1 0.7495 102 0.7495 26 0.8195 Human lung cytochrome P450 (IV subfamily) BI protein 48 Hs.75151 1 0.7486 104 0.7486 8 0.8545 Human GTPase activating protein (rap1GAP) mRNA 49 Hs.283749 -1 0.7468 106 0.7468 110 0.7524 Human mRNA for RNase 4 50 Hs.74566 -1 0.7433 26 0.8369 125 0.7433 Human mRNA for dihydro- pyrimidinase related protein-3
[0231]Training of the classifier was done with the data of one study while testing used the data of the other study. The results are similar for the three classifiers that were tried: SVM, linear ridge regression and Golub classifier. Approximately 90% accuracy can be achieved in both cases with about 10 features. Better "cheating" results are obtained with the consensus features. This serves to validate the consensus features, but the performances cannot be used to predict the accuracy of a classifier on new data. An SVM was trained using the two best features of the 2001 study and the sample of the 2001 study as the training data. The samples from the 2003 study were used as test data to achieve an error rate of 16% is achieved. The tumor and non-tumor samples are well separated, but that, in spite of normalization, the distributions of the samples is different between the two studies.
[0232]The definitions of the statistics used in the various rankings are provided in Table 40.
TABLE-US-00040 TABLE 40 Statistic Description AUC Area under the ROC curve of individual genes, using training tissues. The ROC curve (receiver operating characteristic) is a plot of the sensitivity (error rate of the "positive" class) vs. the specificity (error rate of the "negative" class). Insignificant genes have an AUC close to 0.5. Genes with an AUC closer to one are overexpressed in cancer. Genes with an AUC closer to zero are underexpressed. pval Pvalue of the AUC, used as a test statistic to test the equality of the median of the two population (cancer and non-cancer.) The AUC is the Mann-Withney statistic. The test is equivalent to the Wilcoxon rank sum test. Small pvalues shed doubt on the null hypothesis of equality of the medians. Hence smaller values are better. To account to the multiple testing the pvalue may be Bonferroni corrected by multiplying it by the number of genes 7129. FDR False discovery rate of the AUC ranking. An estimate of the fraction of insignificant genes in the genes ranking higher than a given gene. It is equal the pvalue multiplied by the number of genes 7129 and divided by the rank. Fisher Fisher statistic characterizing the multiclass discriminative power for the histological classes (normal, BPH, dysplasia, grade 3, and grade 4.) The Fisher statistic is the ratio of the between-class variance to the within-class variance. Higher values indicate better discriminative power. The Fisher statistic can be interpreted as a signal to noise ratio. It is computed with training data only. Pearson Pearson correlation coefficient characterizing "disease progression", with histological classes coded as 0 = normal, 1 = BPH, 2 = dysplasia, 3 = grade 3, and 4 = grade 4.) A value close to 1 indicates a good correlation with disease progression. FC Fold change computed as the ratio of the average cancer expression values to the avarage of the other expression values. It is computed with training data only. A value near one indicates an insignificant gene. A large value indicates a gene overexpressed in cancer; a small value an underexpressed gene. Mag Gene magnitude. The average of the largest class expression value (cancer or other) relative to that of the ACTB housekeeping gene. It is computed with training data only. tAUC AUC of the genes matched by probe and or description in the test set. It is computed with test data only, hence not all genes have a tAUC.
Example 7
Genes Overexpressed in Prostate Cancer
[0233]Because they may be more readily detected using common analytical techniques, e.g., microarrays, and therefore, make better biomarker candidates for separating tumor from normal, genes that are overexpressed in prostate cancer were the focus of this analysis. RFE-SVM was performed, with training using the Stamey 2003 data (Table 12) and testing using a dataset created by merging five publicly available datasets containing prostate cancer samples processed with an Affymetrix chip (chip U95A). The merged public datasets produced a set of 164 samples (102 tumor and 62 normal), which will be referred to as the "public data" or "public dataset". The probes in the U95A (˜12,000 probes) chip were matched with those of the U133A chip used in the 87 sample, 2003 Stamey study (28 tumor, 49 normal, 22000 probes) to obtain approximately 7,000 common probes.
[0234]To form the public dataset, several datasets were downloaded from the Internet (Table 41 and Table 42). The Oncomine website, on the Worldwide Web at oncomine.org, is a valuable resource to identify datasets, but the original data was downloaded from the author's websites. Table 41 lists prostate cancer datasets and Table 42 is multi-study or normal samples.
TABLE-US-00041 TABLE 41 Name Chip Samples Genes Ref. Comment Febbo U95A v2 52 tumor 50 normal ~12600 [1] Have data. Dhana cDNA Misc ~40 10000 [2] Difficult to understand and read data. LaTulippe U95A 3 NL, 23 localized and 9 ~12600 [3] Have data. metastatic LuoJH Hu35k 15 tumor, 15 normal ~9000 [4] Have data. Some work to understand it. McGee Hu6800 8 primary, 3 metastasic and 4 6800 [5] Not worth it. Ge nonmalignant Welsh U95A 9 normal, 24 localized and 1 ~12000 [6] Looks OK. metastatic, and 21 cell lines LuoJ cDNA 16 tumor 9 BPH ~6500 [7] Probably not worth it.
TABLE-US-00042 TABLE 42 Name Chip Samples Genes Ref. Comment Rama Hu6800 343 primary and 12 ~16000 [8] Looks interesting. Hu35kSubA metastatic; include a few Complex data. prostate Hsiao HuGenFL 59 normal ~10000 [9] Looks good. Same chips as Stamey 2001. Su U95a 175 tumors, of which 24 ~12600 [10] Looks good. prostate
[0235]The datasets of Febbo, LaTulippe, Welsh, and Su are formatted as described below because they correspond to a large gene set from the same Affymetrix chip U95A.
Febbo Dataset
[0236]File used: [0237]Prostate_TN_final0701 allmeanScale.res [0238]A data matrix of 102 lines (52 tumors, 50 normal) and 12600 columns was generated. [0239]All samples are tumor or normal. No clinical data is available.
LaTulippe Dataset--
[0239] [0240]The data was merged from individual text files (e.g. MET1_U95Av2.txt), yielding to a data matrix of 35 lines (3 normal, 23 localized, 9 metastatic) and 12626 columns. Good clinical data is available.
Welsh Dataset
[0240] [0241]The data was read from file: [0242]GNF prostate_data_CR61--5974.xls [0243]A matrix of 55 lines (9 normal, 27 tumor, 19 cell lines) and 12626 lines was generated. Limited clinical data is available. Some inconsistencies in tissue labeling between files.
Su Dataset
[0243] [0244]The data was read from: classification_data.txt [0245]A matrix of 174 lines (174 tumors of which 24 prostate) and 12533 lines was obtained. No clinical data available. [0246]The initial analysis revealed that the Su and Welsh data were identical, so the Su dataset was removed.
TABLE-US-00043 [0246] TABLE 43 Stamey Febbo LaTulippe Welsh Su 2003 Febbo 12600 12600 12600 12533 312 LaTulippe 12600 12626 12626 12533 312 Welsh 12600 12626 12626 12533 312 Su 12533 12533 12533 12533 271 Stamey 312 312 312 271 22283
[0247]From Table 43 it is apparent that the four selected datasets used the same microarray (Affymetrix U95A GeneChip®). The Stamey 2003 data, however, used a different microarray (Affymetrix U133A GeneChip®), so only those genes common to both sets were selected. Affymetrix has published a reference on its web site (Affymetrix.com) that provides the correspondence between probes of different chip sets based upon their sequences.
[0248]Unigene IDs were used to identify 7350 corresponding probes on the two different chips. Using the best match from Affymetrix, 9512 probes were found to correspond, however, a number of these probes did not have Unigene IDs, or had mismatched Unigene IDs. Of the matched probes using both comparisons, 6839 have the same Unigene IDs. This latter set of 6839 probes was used.
[0249]The final characteristics of publicly available data are summarized in Table 44. Each dataset from the public data was preprocessed individually using the script my_normalize, provided below. A bias of zero was used for all normalizations.
function X=my_normalize(X, bias)
[0250]if nargin<2, bias=0; end
[0251]mini=min(min(X));
[0252]maxi=max(max(X));
[0253]X=(X-mini)/(maxi-mini)+bias;
[0254]idx=find(X<=0);
[0255]X(idx)=Inf;
[0256]epsi=min(min(X));
[0257]X(idx)=epsi;
[0258]X=log(X);
[0259]X=med_normalize(X);
[0260]X=med_normalize(X')';
[0261]X=med_normalize(X);
[0262]X=med_normalize(X')';
[0263]X=tan h(0.1*X);
[0264]function X=med_normalize(X)
[0265]mu=mean(X,2);
[0266]One=ones(size(X,2), 1);
[0267]XM=X-mu(:,One);
[0268]S=median(abs(XM),2);
[0269]X=XM./S(:,One);
[0270]The public data was then merged and the feature set was reduced to n. The Stamey data was normalized with my_normalize script (above) after this reduction of feature set. The public data was re-normalized with my_normalize script after this reduction of feature set.
TABLE-US-00044 TABLE 44 Histological Number Data source classification of samples Febbo Normal 50 Tumor 52 LaTulippe Normal 3 Tumor 23 Welsh Normal 9 Tumor 27 Total 164
[0271]The 19 top ranking genes that were identified by RFE-SVM are listed in Tables 45a and 45b. Table 45a provides the analysis results corresponding to the original UniGene number, Affymetrix probe ID, gene symbol and description. Table 45b associates the SEQ ID NO. with the original (archival) UniGene number, the current UniGene number, and the more detailed "target description" obtained from the Affymetric GeneChip® annotation spreadsheet under the column under the same title. (The Affymetrix annotation spreadsheets for the U95 and U133 are publicly available on the World Wide Web at Affymetrix.com, and are incorporated herein by reference.) The analysis revealed that on average any combination of 4 genes or more from the 19 top ranked genes yielded an area under the curve (AUC) of 0.9 on test data. The top ranking combination of three genes as determined by RFE-SVM yielded AUC=0.94. This combination consisted of genes are AgX-1/UAP1 (Hs.21293), DKFZp564 (Hs.7780), and IMPDH2 (Hs.75432). While each of these genes performs well individually, their combination outperforms any individual gene (FIG. 8).
TABLE-US-00045 TABLE 45a UniGene AUC pval FDR Fisher Pearson FC Mag tAUC Affy probe Symbol/Description Hs.7780 0.9135 4.50E-11 2.00E-07 29.91 0.69 2.16 0.077 0.9037 212412_at DKFZp564 (PDLIM5)/ Homo sapiens mRNA; cDNA DKFZp564A072 (from clone DKFZp564A072) Hs.21293 0.8888 6.00E-10 7.40E-07 19.3 0.69 2.31 0.0012 0.877 209340_at UAP1/AGX-1/Homo sapiens AgX-1 antigen mRNA Hs.79037 0.8829 1.10E-09 1.00E-06 14.9 0.64 1.65 0.00059 0.944 200807_s_at HSPD1/Homo sapiens heat shock 60 kD protein 1 (chaperonin) Hs.30054 0.8657 5.80E-09 2.20E-06 9.82 0.59 4.11 0.0029 0.6932 204714_s_at F5/Homo sapiens coagulation factor V (proaccelerin) Hs.75432 0.8641 6.70E-09 2.30E-06 9.79 0.54 2.19 0.00045 0.8803 201892_s_at IMPDH2/Homo sapiens IMP (inosine monophosphate) dehydrogenase 2 Hs.699 0.8593 1.10E-08 3.10E-06 8.5 0.59 1.62 0.37 0.8131 200967_at PPIB/Homo sapiens peptidylprolyl isomerase B (cyclophilin B) Hs.1708 0.855 1.60E-08 3.80E-06 11.07 0.56 1.72 0.14 0.8053 200910_at CCT3/Homo sapiens chaperonin containing TCP1 Hs.69469 0.8485 2.90E-08 6.00E-06 8.47 0.59 1.61 0.12 0.7948 202231_at GA17/Homo sapiens dendritic cell protein Hs.82280 0.848 3.00E-08 6.00E-06 9.05 0.58 2.1 0.089 0.8596 204319_s_at RGS10/Homo sapiens regulator of G-protein signaling 10 Hs.79217 0.8421 5.10E-08 8.70E-06 8.88 0.53 1.85 1.3 0.873 202148_s_at PYCR1/Homo sapiens pyrroline-5-carboxylate reductase 1 Hs.117950 0.8367 8.30E-08 1.20E-05 12.72 0.58 1.98 0.92 0.8066 201013_s_at SAICAR/multifunctional polypeptide similar to SAICAR synthetase and AIR carboxylase Hs.8858 0.833 1.10E-07 1.50E-05 8.54 0.56 1.66 0.11 0.8151 217986_s_at BAZIA/Homo sapiens bromodomain adjacent to zinc finger domain. Hs.75939 0.8287 1.70E-07 2.00E-05 9.15 0.48 1.88 0.019 0.8333 209825_s_at UMPK/Homo sapiens Hs.75061 0.8233 2.60E-07 2.70E-05 7.98 0.46 1.98 0.054 0.8835 200644_at MACMARCKS/Homo sapiens macrophage myristoylated alanine-rich C kinase substrate Hs.162209 0.8217 3.00E-07 3.10E-05 16.32 0.56 2.89 0.014 0.7902 214598_at CLDN8/DKFZp564/ Claudin 8 Homo sapiens mRNA Hs.154672 0.8147 5.40E-07 4.70E-05 8.96 0.53 1.74 0.046 0.8314 201761_at MTHFD1/Homo sapiens methylene tetrahydrofolate dehydrogenase (NAD+ dependent) Hs.18910 0.8115 7.10E-07 5.70E-05 6.91 0.52 1.89 0.037 0.7111 204394_at POV1(SLC43A1)/Homo sapiens prostate cancer overexpressed gene 1 Hs.109059 0.8104 7.70E-07 6.10E-05 7.4 0.52 1.84 0.027 0.8091 203931_s_at MRPL12/Homo sapiens mitochondrial ribosomal protein L12 Hs.98732 0.8104 7.70E-07 6.00E-05 5.45 0.42 6.42 0.01 0.8083 215432_at EIF3S8/Homo sapiens Chromosome 16 BAC clone CIT987SK-A-923A4
TABLE-US-00046 TABLE 45b SEQ ID UniGene Unigene NO (archival) (current) Target Description 1 Hs.7780 Hs.480311 Consensus includes gb: AV715767 /FEA = EST /DB_XREF = gi: 10797284 /DB_XREF = est: AV715767 /CLONE = DCBATH02 /UG = Hs.7780 Homo sapiens mRNA; cDNA DKFZp564A072 (from clone DKFZp564A072) 2 Hs.21293 Hs.492859 gb: S73498.1 /DEF = Homo sapiens AgX-1 antigen mRNA; complete cds. /FEA = mRNA /PROD = AgX-1 antigen /DB_XREF = gi: 688010 /UG = Hs.21293 UDP-N-acteylglucosamine pyrophosphorylase 1 /FL = gb: AB011004.1 gb: NM_003115.1 gb: S73498.1 3 Hs.79037 Hs.632539 gb: NM_002156.1 /DEF = Homo sapiens heat shock 60 kD protein 1 (chaperonin) (HSPD1); mRNA. /FEA = mRNA /GEN = HSPD1 /PROD = heat shock 60 kD protein 1 (chaperonin) /DB_XREF = gi: 4504520 /UG = Hs.79037 heat shock 60 kD protein 1 (chaperonin) /FL = gb: BC002676.1 gb: BC003030.1 gb: M34664.1 gb: M22382.1 gb: NM_002156.1 4 Hs.30054 Hs.30054 gb: NM_000130.2 /DEF = Homo sapiens coagulation factor V (proaccelerin; labile factor) (F5); mRNA. /FEA = mRNA /GEN = F5 /PROD = coagulation factor V precursor /DB_XREF = gi: 10518500 /UG = Hs.30054 coagulation factor V (proaccelerin; labile factor) /FL = gb: NM_000130.2 gb: M16967.1 gb: M14335.1 5 Hs.75432 Hs.654400 gb: NM_000884.1 /DEF = Homo sapiens IMP (inosine monophosphate) dehydrogenase 2 (IMPDH2); mRNA. /FEA = mRNA /GEN = IMPDH2 /PROD = IMP (inosine monophosphate) dehydrogenase 2 /DB_XREF = gi: 4504688 /UG = Hs.75432 IMP (inosine monophosphate) dehydrogenase 2 /FL = gb: J04208.1 gb: NM_000884.1 6 Hs.699 Hs.434937 gb: NM_000942.1 /DEF = Homo sapiens peptidylprolyl isomerase B (cyclophilin B) (PPIB); mRNA. /FEA = mRNA /GEN = PPIB /PROD = peptidylprolyl isomerase B (cyclophilin B) /DB_XREF = gi: 4758949 /UG = Hs.699 peptidylprolyl isomerase B (cyclophilin B) /FL = gb: BC001125.1 gb: M60857.1 gb: M63573.1 gb: NM_000942.1 7 Hs.1708 Hs.491494 gb: NM_005998.1 /DEF = Homo sapiens chaperonin containing TCP1; subunit 3 (gamma) (CCT3); mRNA. /FEA = mRNA /GEN = CCT3 /PROD = chaperonin containing TCP1; subunit 3 (gamma) /DB_XREF = gi: 5174726 /UG = Hs.1708 chaperonin containing TCP1; subunit 3 (gamma) /FL = gb: NM_005998.1 8 Hs.69469 Hs.502244 gb: NM_006360.1 /DEF = Homo sapiens dendritic cell protein (GA17); mRNA. /FEA = mRNA /GEN = GA17 /PROD = dendritic cell protein /DB_XREF = gi: 5453653 /UG = Hs.69469 dendritic cell protein /FL = gb: AF277183.1 gb: AF064603.1 gb: NM_006360.1 9 Hs.82280 Hs.501200 gb: NM_002925.2 /DEF = Homo sapiens regulator of G-protein signaling 10 (RGS10); mRNA. /FEA = mRNA /GEN = RGS10 /PROD = regulator of G- protein signaling 10 /DB_XREF = gi: 11184225 /UG = Hs.82280 regulator of G-protein signaling 10 /FL = gb: NM_002925.2 gb: AF045229.1 10 Hs.79217 Hs.458332 gb: NM_006907.1 /DEF = Homo sapiens pyrroline-5-carboxylate reductase 1 (PYCR1); nuclear gene encoding mitochondrial protein; mRNA. /FEA = mRNA /GEN = PYCR1 /PROD = pyrroline-5-carboxylate reductase 1 /DB_XREF = gi: 5902035 /UG = Hs.79217 pyrroline-5-carboxylate reductase 1 /FL = gb: M77836.1 gb: NM_006907.1 11 Hs.117950 Hs.518774 Consensus includes gb: AA902652 /FEA = EST /DB_XREF = gi: 3037775 /DB_XREF = est: ok71a12.s1 /CLONE = IMAGE: 1519390 /UG = Hs.117950 multifunctional polypeptide similar to SAICAR synthetase and AIR carboxylase /FL = gb: NM_006452.1 12 Hs.8858 Hs.509140 gb: NM_013448.1 /DEF = Homo sapiens bromodomain adjacent to zinc finger domain; 1A (BAZ1A); mRNA. /FEA = mRNA /GEN = BAZ1A /PROD = bromodomain adjacent to zinc finger domain; 1A /DB_XREF = gi: 7304918 /UG = Hs.8858 bromodomain adjacent to zinc finger domain; 1A /FL = gb: AB032252.1 gb: NM_013448.1 Bromodomain adjacent to zinc finger domain protein 1A (ATP-utilizing chromatin assembly and remodeling factor 1) (hACF1) (ATP-dependent chromatin remodelling protein) (Williams syndrome transcription factor- related chromatin remodeling factor 180) (WCRF180) (hWALp1) (CHRAC subunit ACF1) (HSPC317). From SPD 13 Hs.75939 Hs.458360 gb: BC002906.1 /DEF = Homo sapiens; Similar to uridine monophosphate kinase; clone MGC: 10318; mRNA; complete cds. /FEA = mRNA /PROD = Similar to uridine monophosphate kinase /DB_XREF = gi: 12804106 /UG = Hs.75939 uridine monophosphate kinase /FL = gb: BC002906.1 gb: AF236637.1 14 Hs.75061 Hs.75061 gb: NM_023009.1 /DEF = Homo sapiens macrophage myristoylated alanine- rich C kinase substrate (MACMARCKS); mRNA. /FEA = mRNA /GEN = MACMARCKS /PROD = macrophage myristoylated alanine-rich C kinasesubstrate /DB_XREF = gi: 13491173 /UG = Hs.75061 macrophage myristoylated alanine-rich C kinase substrate /FL = gb: NM_023009.1 15 Hs.162209 Hs.162209 Consensus includes gb: AL049977.1 /DEF = Homo sapiens mRNA; cDNA DKFZp564C122 (from clone DKFZp564C122). /FEA = mRNA /DB_XREF = gi: 4884227 /UG = Hs.162209 claudin 8 /FL = gb: NM_012132.1 16 Hs.154672 Hs.469030 gb: NM_006636.2 /DEF = Homo sapiens methylene tetrahydrofolate dehydrogenase (NAD+ dependent); methenyltetrahydrofolate cyclohydrolase (MTHFD2); nuclear gene encoding mitochondrial protein; mRNA. /FEA = mRNA /GEN = MTHFD2 /PROD = methylene tetrahydrofolate dehydrogenase (NAD+dependent); methenyltetrahydrofolate cyclohydrolase; precursor /DB_XREF = gi: 13699869 /UG = Hs.154672 methylene tetrahydrofolate dehydrogenase (NAD+ dependent); methenyltetrahydrofolate cyclohydrolase /FL = gb: NM_006636.2 17 Hs.18910 Hs.591952 gb: NM_003627.1 /DEF = Homo sapiens prostate cancer overexpressed gene 1 (POV1); mRNA. /FEA = mRNA /GEN = POV1 /PROD = prostate cancer overexpressed gene 1 /DB_XREF = gi: 4505970 /UG = Hs.18910 prostate cancer overexpressed gene 1 /FL = gb: BC001639.1 gb: AF045584.1 gb: NM_003627.1 18 Hs.109059 Hs.109059 gb: NM_002949.1 /DEF = Homo sapiens mitochondrial ribosomal protein L12 (MRPL12); mRNA. /FEA = mRNA /GEN = MRPL12 /PROD = mitochondrial ribosomal protein L12 /DB_XREF = gi: 4506672 /UG = Hs.109059 mitochondrial ribosomal protein L12 /FL = gb: BC002344.1 gb: U25041.1 gb: AF105278.1 gb: NM_002949.1 Hs.98732 Hs.306812 Consensus includes gb: AC003034 /DEF = Homo sapiens Chromosome 16 BAC clone CIT987SK-A-923A4 /FEA = mRNA_2 /DB_XREF = gi: 3219338 /UG = Hs.98732 Homo sapiens Chromosome 16 BAC clone CIT987SK-A- 923A4 /FEA = mRNA_2 /DB_XREF = gi: 3219338 /UG = Hs.98732 Homo sapiens Chromosome 16 BAC clone CIT987SK-A-923A4
The following information provides further description of the top 3 ranking genes selected by RFE-SVM based upon public databases and references:
DKFZp564 (Hs.7780 Old Cluster; Hs.480311 New Cluster) (SEQ ID NO. 1)
[0272]Homo sapiens mRNA; cDNA DKFZp564A072 (from clone DKFZp564A072)
[0273]Chromosome location: Chr.4, 527.0 cR
[0274]Summary: LIM domains are cysteine-rich double zinc fingers composed of 50 to 60 amino acids that are involved in protein-protein interactions. LIM domain-containing proteins are scaffolds for the formation of multiprotein complexes. The proteins are involved in cytoskeleton organization, cell lineage specification, organ development, and oncogenesis. Enigma family proteins (see ENIGMA; MIM 605900) possess a 100-amino acid PDZ domain in the N terminus and 1 to 3 LIM domains in the C terminus.[supplied by OMIM]. [0275]Genbank entry (with sequence): AL049969.1 [0276]Protein Product: PDZ and LIM-domain 5 (PDLIM5) (SEQ ID NO. 19) [0277]cDNA SOURCES: Liver and Spleen, bone, brain, breast-normal, colon, heart, kidney, lung, mixed, ovary, pancreas, placenta, pooled, prostate, skin, stomach, testis, uterus, vascular, whole blood.
AgX-1/UAP1 (Hs.21293 old Cluster; Hs.492859 New Cluster) (SEQ ID NO. 2)
[0278]UDP-N-acteylglucosamine pyrophosphorylase 1 [0279]Chromosome location: 1q23.3 [0280]Sequence from GenBank for S73498 [0281]Enzyme EC number: 2.7.7.23
[0282]Enzyme involved in aminosugars metabolism (see Kegg pathway around AgX-1/UAP1/SPAG2, FIG. 9).
[0283]Reported to be an androgen responsive gene in:
[0284]"Transcriptional programs activated by exposure of human prostate cancer cells to androgen", S. E. DePrimo, et al., Genome Biology 2002, 3:research0032.1-032.12
[0285]Reported to be possibly implicated in cancer:
[0286]Other interesting alias: SPAG 2: sperm associated antigen 2. Has been connected to male infertility: [0287]"Expression of the human antigen SPAG2 in the testis and localization to the outer dense fibers in spermatozoa", Diekman, A. B., et al., Mol. Reprod. Dev. 1998 July; 50(3):284-93. [0288]Tissue specificity: Widely expressed. Isoform AGX1 is more abundant in testis than isoform AGX2, while isoform AGX2 is more abundant than isoform AGX1 in somatic tissue. Expressed at low level in placenta, muscle and liver. [0289]Protein product: AgX-1 antigen, accession S73498.1 (SEQ ID NO. 20) [0290]Secreted: May be present in blood and tissue.
[0291]UAP 1 is correlated with genes involved in mitochondrial activity, including AMACR, and HSDP1.
HSPD1 (Hs.79037 old Cluster; Hs.632539 New Cluster) (SEQ ID NO. 3)
Chaperonin
[0292]Chromosome Location: 2q33.1
[0293]Function: This gene encodes a member of the chaperonin family. The encoded mitochondrial protein may function as a signaling molecule in the innate immune system. This protein is essential for the folding and assembly of newly imported proteins in the mitochondria. This gene is adjacent to a related family member and the region between the 2 genes functions as a bidirectional promoter.
[0294]Protein product: chaperonin heat shock 60 kD protein 1 (chaperonin); heat shock protein 65; mitochondrial matrix protein PI; P60 lymphocyte protein; short heat shock protein 60 Hsp60s 1; Accession NP--002147 (SEQ ID NO. 21)
[0295]HSPD1 is correlated with genes involved in mitochondrial activity.
F5 (Hs.30054) (SEQ ID NO. 4)
[0296]F5 coagulation factor V precursor
[0297]Chromosome Location: 1 q23
[0298]Function: This gene encodes coagulation factor V which is an essential factor of the blood coagulation cascade. This factor circulates in plasma, and is converted to the active form by the release of the activation peptide by thrombin during coagulation. This generates a heavy chain and a light chain which are held together by calcium ions. The active factor V is a cofactor that participates with activated coagulation factor X to activate prothrombin to thrombin.
[0299]Protein Product: coagulation factor V precursor [Homo sapiens], Accession NP--000121 (SEQ ID NO. 22)
IMPDH2 (Hs.75432 Old Cluster; Hs.476231 New Cluster) (SEQ ID NO. 5)
[0300]IMP (inosine monophosphate) dehydrogenase 2
[0301]Chromosome location: Location: 3p21.2
[0302]Unigene cluster: Hs.476231
[0303]Enzyme: EC 1.1.1.205
[0304]Function: This gene encodes the rate-limiting enzyme in the de novo guanine nucleotide biosynthesis. It is thus involved in maintaining cellular guanine deoxy- and ribonucleotide pools needed for DNA and RNA synthesis. The encoded protein catalyzes the NAD-dependent oxidation of inosine-5'-monophosphate into xanthine-5'-monophosphate, which is then converted into guanosine-5'-monophosphate. This gene is up-regulated in some neoplasms, suggesting it may play a role in malignant transformation.
[0305]Protein product: inosine monophosphate dehydrogenase 2 [Homo sapiens];
[0306]Accession NP--000875 (SEQ ID NO. 23)
[0307]Sequences: Source sequence J04208:
[0308]Related to apoptosis.
PPIB (Hs.699 Old Cluster; Hs.434937 New Cluster) (SEQ ID NO. 6)
[0309]Peptidylprolyl isomerase B precursor (cyclophilin B)
[0310]Chromosome location: 15q21-q22
[0311]Function: The protein encoded by this gene is a cyclosporine-binding protein and is mainly located within the endoplasmic reticulum. It is associated with the secretory pathway and released in biological fluids. This protein can bind to cells derived from T- and B-lymphocytes, and may regulate cyclosporine A-mediated immunosuppression.
[0312]Protein Product: peptidylprolyl isomerase B precursor; Accession NP--000933 (SEQ ID NO. 24)
[0313]EC_number: 5.2.1.8
[0314]Cyclophilin B; peptidyl-prolyl cis-trans isomerase B; PPlase; cyclophilin-like protein; S-cyclophilin; rotamase
[0315]Related to apoptosis.
CTT3 (Hs.1708 old Cluster; Hs:491-494 New Cluster) (SEQ ID NO. 7)
[0316]Chaperonin containing TCP 1, subunit 3 (gamma)
[0317]Chromosome Location: 1q23
[0318]Function: This gene encodes a molecular chaperone that is member of the chaperonin containing TCP1 complex (CCT), also known as the TCP1 ring complex (TRiC). This complex consists of two identical stacked rings, each containing eight different proteins. Unfolded polypeptides enter the central cavity of the complex and are folded in an ATP-dependent manner. The complex folds various proteins, including actin and tubulin.
[0319]Protein product: chaperonin containing TCP1, subunit 3 isoform a; Accession NP--005989 (SEQ ID NO. 25)
[0320]TCP 1 (t-complex-1) ring complex, polypeptide 5; T-complex protein 1, gamma subunit.
GA17 (Hs.69469 Old Cluster; Hs.502244 New Cluster) (SEQ ID NO. 8)
[0321]Dendritic cell protein (GA17)
[0322]Chromosome location: 11p13
[0323]Function: HFLB5 encodes a broadly expressed protein containing putative membrane fusion domains that act as a receptor or coreceptor for entry of herpes simplex virus (HSV).
[0324]Protein product: Eukaryotic translation initiation factor 3, subunit M ACCESSION NP--006351. (SEQ ID NO. 26)
RGS10 (Hs.82280 Old Cluster; Hs.501200 New Cluster) (SEQ ID NO. 9)
[0325]regulator of G-protein signaling 10 isoform b
[0326]Chromosome Location: 10q25
[0327]Function: Regulator of G protein signaling (RGS) family members are regulatory molecules that act as GTPase activating proteins (GAPs) for G alpha subunits of heterotrimeric G proteins. RGS proteins are able to deactivate G protein subunits of the Gi alpha, Go alpha and Gq alpha subtypes. They drive G proteins into their inactive GDP-bound forms. Regulator of G protein signaling 10 belongs to this family. All RGS proteins share a conserved 120-amino acid sequence termed the RGS domain. This protein associates specifically with the activated forms of the two related G-protein subunits, G-alphai3 and G-alphaz but fails to interact with the structurally and functionally distinct G-alpha subunits. Regulator of G protein signaling 10 protein is localized in the nucleus.
[0328]Protein product: regulator of G-protein signaling 10 isoform b; Accession NP--002916 (SEQ ID NO. 27)
[0329]Related to apoptosis.
PYCR1 (Hs.79217 Old Cluster; Hs.458332 New Cluster) (SEQ ID NO. 10)
[0330]Pyrroline-5-carboxylate reductase 1 isoform 1
[0331]Chromosome location: 17q25.3
[0332]Function: This gene encodes an enzyme that catalyzes the NAD(P)H-dependent conversion of pyrroline-5-carboxylate to proline. This enzyme may also play a physiologic role in the generation of NADP(+) in some cell types. The protein forms a homopolymer and localizes to the mitochondrion.
[0333]Protein product: pyrroline-5-carboxylate reductase 1 isoform 1; Accession NP--008838 (SEQ ID NO. 28)
[0334]Related to mitochrondrial function.
[0335]Additional information about the remaining top 19 genes and their protein products are found in accompanying sequence listings and on the NCBI database.
[0336]Using a subset of 100 genes that were significantly overexpressed in cancer in both the Stamey 2003 data and public data, a number of relevant pathways were identified using a pathway database compiled by MIT. (See, e.g., Subramanian, A., et al., "Gene set enrichment analysis: A knowledge-based approach for interpreting genome-wide expression profiles" (2005) Proc. Natl. Acad. Sci. USA 102, 15545-15550.) This pathway database contains lists of genes from various sources and is highly redundant. The pathways were grouped using a clustering method according to their overlap in number of genes found overexpressed in cancer, then manually verified that the groups were meaningful, to produce a simplified and more robust pathway analysis. Additional information was obtained from the Secreted Protein Database (SPD). (Chen, Y. et al., "SPD--a web-based secreted protein database", (2005) Nucleic Acids Res. 33 Database Issue: D169-173.)
[0337]Four main clusters were identified: (1) mitochrondrial genes (UMPK, SLC25A4, ALDH1A3, LIM, MAOA, GRSF1, MRPS12, MRPL12, PYCR1, COX5A, ARMET, ICT1, EPRS, C2orf3, PCCB, NDUFV2, MRPL3, MTHFD1, LDHA, TXN, HSPD1, UAP 1, AMACR) (clustering of these genes is shown in FIG. 10); (2) genes related to perixosome and cell adhesion (UMPK, FAT, ALDH1A3, GRSF1, HSD17B4, ALCAM, ARMET, ICT1, PCCB, NDUFV2, MRPS12, LDHA, HSPD1)(clustering of these genes is shown in FIG. 11); (3) cell proliferation and growth (TAL1, CDC20, GSPT1, CCNB1, BUB1B, GPNMB, TXN, RFP, EXH2, MTHFD1, HMG20B, HPN, POV1)(clustering of these genes is shown in FIG. 12); and (4) genes related to apoptosis, or the p53/p73 signaling pathways (TRAF4, RAB11A, PPIB, RGS10, IMPDH2, HOXC6, BAZ1A, TMSNB, HSPD1, UAP1, AMACR) (clustering of these genes is shown in FIG. 13). Additional pathways that were less represented, but which may be linked to cancer include coagulation and angiogenesis; cell structure/cyotskeleton/actin; DNA damage/repair; HOX-related genes; and kinases.
[0338]Because many of the genes identified in the study involved mitochondrial activity and/or apoptosis, it is hypothesized that mitochrondrial apoptosis plays a role in prostate cancer.
[0339]P53 has both transcriptional activity that mediates cell cycle arrest and induces mitochondrial apoptosis, possibly via interactions with the Bcl-2 protein family and rendering the membrane of the mitochondrion permeable. Because of the known role of p53 mutations in many cancers, the expression levels of p53 and related genes like p73 were investigated and found to be strongly underexpressed in the cancer tissue in the datasets that were used in the study. Connections are apparent between mitochondrial activity and apoptosis.
[0340]The preceding detailed description of the preferred embodiments disclosed methods for identification of biomarkers for prostate cancer using gene expression data from microarrays. RFE-SVM was used to identify a small number of biomarkers that should lead to the creation of inexpensive, accurate tests that may be used in conjunction with or in place of current diagnostic, prognostic and monitoring tests for prostate cancer by using gene expression or protein expression data. Preferred applications of the present invention will target proteins expressed by the identified genes that are detectable in serum or semen, thus providing non-invasive or minimally invasive screening for prostate cancer and monitoring of treatment.
[0341]Alternative embodiments of the present invention will become apparent to those having ordinary skill in the art to which the present invention pertains. Such alternate embodiments are considered to be encompassed within the spirit and scope of the present invention. Accordingly, the scope of the present invention is described by the appended claims and is supported by the foregoing description.
REFERENCES
Incorporated Herein by Reference
[0342][1] Singh D, et al., Gene expression correlates of clinical prostate cancer behavior Cancer Cell, 2:203-9, Mar. 1, 2002. [0343][2] Febbo P., et al., Use of expression analysis to predict outcome after radical prostatectomy, The Journal of Urology, Vol. 170, pp. S11-S20, December 2003. Delineation of prognostic biomarkers in prostate cancer. Dhanasekaran S M, Barrette T R, Ghosh D, Shah R, Varambally S, Kurachi K, Pienta K J, Rubin M A, Chinnaiyan A M. Nature. 2001 Aug. 23; 412(6849):822-6. [0344][3] Comprehensive gene expression analysis of prostate cancer reveals distinct transcriptional programs associated with metastatic disease. LaTulippe E, Satagopan J, Smith A, Scher H, Scardino P, Reuter V, Gerald W L. Cancer Res. 2002 Aug. 1; 62(15):4499-506. [0345][4] Gene expression analysis of prostate cancers. Luo J H, Yu Y P, Cieply K, Lin F, Deflavia P, Dhir R, Finkelstein S, Michalopoulos G, Becich M. Mol Carcinog. 2002 January; 33(1):25-35 [0346][5] Expression profiling reveals hepsin overexpression in prostate cancer. Magee J A, Araki T, Patil S, Ehrig T, True L, Humphrey P A, Catalona W J, Watson M A, Milbrandt J. Cancer Res. 2001 Aug. 1; 61(15):5692-6. [0347][6] Analysis of gene expression identifies candidate markers and pharmacological targets in prostate cancer. Welsh J B, Sapinoso L M, Su Al, Kern S G, Wang-Rodriguez J, Moskaluk C A, Frierson H F Jr, Hampton G M. Cancer Res. 2001 Aug. 15; 61(16):5974-8. [0348][7] Human prostate cancer and benign prostatic hyperplasia: molecular dissection by gene expression profiling. Luo J, Duggan D J, Chen Y, Sauvageot J, Ewing C M, Bittner M L, Trent J M, Isaacs W B. Cancer Res. 2001 Jun. 15; 61(12):4683-8. [0349][8] A molecular signature of metastasis in primary solid tumors. Ramaswamy S, Ross K N, Lander E S, Golub T R. Nat Genet. 2003 January; v33(1):49-54. Epub 2002 Dec. 9. [0350][9] A compendium of gene expression in normal human tissues. Hsiao L L, Dangond F, Yoshida T, Hong R, Jensen R V, Misra J, Dillon W, Lee K F, Clark K E, Haverty P, Weng Z, Mutter G L, Frosch M P, Macdonald M E, Milford E L, Crum C P, Bueno R, Pratt R E, Mahadevappa M, Warrington J A, Stephanopoulos G, Stephanopoulos G, Gullans S R. Physiol Genomics. 2001 Dec. 21; 7(2):97-104. [0351][10] Molecular classification of human carcinomas by use of gene expression signatures. Su A I, Welsh J B, Sapinoso L M, Kern S G, Dimitrov P, Lapp H, Schultz P G, Powell S M, Moskaluk C A, Frierson H F Jr, Hampton G M. Cancer Res. 2001 Oct. 15; 61(20):7388-93. [0352][11] Gene expression analysis of prostate cancers. Jian-Hua Luo*, Yan Ping Yu, Kathleen Cieply, Fan Lin, Petrina Deflavia, Rajiv Dhir, Sydney Finkelstein, George Michalopoulos, Michael Becich. [0353][12] Transcriptional Programs Activated by Exposure of Human Prostate Cancer Cells to Androgen", Samuel E. DePrimo, Maximilian Diehn, Joel B. Nelson, Robert E. Reiter, John Matese, Mike Fero, Robert Tibshirani, Patrick O. Brown, James D. Brooks. Genome Biology, 3(7) 2002 [0354][13] A statistical method for identifying differential gene-gene co-expression patterns, Yinglei Lai, Baolin Wu, Liang Chen and Hongyu Zhao. Bioinformatics vol. 20 issue 17. [0355][14] Induction of the Cdk inhibitor p21 by LY83583 inhibits tumor cell proliferation in a p53-independent manner [0356]Dimitri Lodygin, Antje Menssen, and Heiko Hermeking, J. Clin. Invest. 110: 1717-1727 (2002). [0357][15] Classification between normal and tumor tissues based on the pair-wise gene expression ratio. YeeLeng Yap, XueWu Zhang, M T Ling, XiangHong Wang, Y C Wong, and Antoine Danchin B M C Cancer. 2004; 4: 72. [0358][16] Kishino H, Waddell P J. Correspondence analysis of genes and tissue types and finding genetic links from microarray data. Genome Inform Ser Workshop Genome Inform 2000; 11: 83-95. [0359][17] Proteomic analysis of cancer-cell mitochondria. Mukesh Verma, Jacob Kagan, David Sidransky & Sudhir Srivastava, Nature Reviews Cancer 3, 789-795 (2003); [0360][18] Changes in collagen metabolism in prostate cancer: a host response that may alter progression. Burns-Cox N, Avery N C, Gingell J C, Bailey A J. J. Urol. 2001 November; 166(5):1698-701. [0361][19] Differentiation of Human Prostate Cancer PC-3 Cells Induced by Inhibitors of Inosine 5'-Monophosphate Dehydrogenase. Daniel Florykl, Sandra L. Tollaksen2, Carol S. Giometti2 and Eliezer Hubermanl Cancer Research 64, 9049-9056, Dec. 15, 2004. [0362][20] Epithelial Na, K-ATPase expression is down-regulated in canine prostate cancer; a possible consequence of metabolic transformation in the process of prostate malignancy Ali Mobasheri, Richard Fox, lain Evans, Fay Cullingham, Pablo Martin-Vasallo and Christopher S Foster Cancer Cell International 2003, 3:8
Sequence CWU
1
331734DNAHomo sapiensgeneUnigene Hs.7780; DCB cDNA clone DCBATH02 5'
cDNA DKFZp564A072 1aacagctcaa atcttcaaaa tattactata gcattatgtt
taaaataatc tacaacaaaa 60atgtaccatt ttcaagcagt actacattag gagccctttt
atagaaaata atttcttctt 120tacccccgtt ccagtgtgaa tctagtattc tgttaacatt
tgtgtggcat ttggagtttg 180tcatccccat tgaagggaga gccttctcag acatgaagca
agggaaacat actgaatagt 240tttacacaaa tttgatctgg cttccatttg tccccctcat
ttcccaaatg tttaaatgta 300ttggatttgg attctcaatg tataagttgc cttatctgtt
aatgtctatc ttctgtctct 360ttaattttgt atatctgctg ttttgctttt ggatacattt
tctaattaga agtcacatga 420taaatataat cagtatagta ataataccat aatgtgcaca
tactcaataa ataaatgact 480gcattgttgt aaatgaaaaa aaaaaaaaaa aanaaaaana
aaacccttgt cggccgcctc 540ggcccagtcg actctagact cgagcaagct tatgcatgcg
gccgcaattc gagctcactg 600ggccaattcg ccctataggg agtcgtatta cattccactg
ccgccgtttt acaacgtcgt 660gactgggaaa accctgccgt tacccaactt aatgcgcttg
aagcacattc cctttcgcca 720gctggcgtaa atgc
73422279DNAHomo sapiensgeneUnigene Hs.21293; Homo sapiens
AgX-1 antigen mRNA, complete cds. 2gaattcgggg tggcgagagg ggcggggtgg
ccggggctgt ctccacttgg ccccgctccc 60ggcccgcccc gccgccgccc cccggatgag
ggtatatatt cggagtgagc gcgggaccga 120tgagtggccg cgccgaagga gctggagacg
gtcgtagctg cggtcgccga gaaaggttta 180caggtacata cattacaccc ctatttctac
aaagcttggc tattagagca ttatgaacat 240taatgacctc aaactcacgt tgtccaaagc
tgggcaagag cacctactac gtttctggaa 300tgagcttgaa gaagcccaac aggtagaact
ttatgcagag ctccaggcca tgaactttga 360ggagctgaac ttctttttcc aaaaggccat
tgaaggtttt aaccagtctt ctcaccaaaa 420gaatgtggat gcacgaatgg aacctgtgcc
tcgagaggta ttaggcagtg ctacaaggga 480tcaagatcag ctccaggcct gggaaagtga
aggacttttc cagatttctc agaataaagt 540agcagttctt cttctagctg gtgggcaggg
gacaagactc ggcgttgcat atcctaaggg 600gatgtatgat gttggtttgc catcccgtaa
gacacttttt cagattcaag cagagcgtat 660cctgaagcta cagcaggttg ctgaaaaata
ttatggcaac aaatgcatta ttccatggta 720tataatgacc agtggcagaa caatggaatc
tacaaaggag ttcttcacca agcacaagta 780ctttggttta aaaaaagaga atgtaatctt
ttttcagcaa ggaatgctcc ccgccatgag 840ttttgatggg aaaattattt tggaagagaa
gaacaaagtt tctatggctc cagatgggaa 900tggtggtctt tatcgggcac ttgcagccca
gaatattgtg gaggatatgg agcaaagagg 960catttggagc attcatgtct attgtgttga
caacatatta gtaaaagtgg cagacccacg 1020gttcattgga ttttgcattc agaaaggagc
agactgtgga gcaaaggtgg tagagaaaac 1080gaaccctaca gaaccagttg gagtggtttg
ccgagtggat ggagtttacc aggtggtaga 1140atatagtgag atttccctgg caacagctca
aaaacgaagc tcagacggac gactgctgtt 1200caatgcgggg aacattgcca accatttctt
cactgtacca tttctgagag atgttgtcaa 1260tgtttatgaa cctcagttgc agcaccatgt
ggctcaaaag aagattcctt atgtggatac 1320ccaaggacag ttaattaagc cagacaaacc
caatggaata aagatggaaa aatttgtctt 1380tgacatcttc cagtttgcaa agaagtttgt
ggtatatgaa gtattgcgag aagatgagtt 1440ttccccacta aagaatgctg atagtcagaa
tgggaaagac aaccctacta ctgcaaggca 1500tgctttgatg tcccttcatc attgctgggt
cctcaatgca gggggccatt tcatagatga 1560aaatagctct cgccttccag caattccccg
cttgaaggat gccaatgatg taccaatcca 1620atgtgaaatc tctcctctta tctcctatgc
tggagaagga ttagaaagtt atgtggcaga 1680taaagaattc catgcacctc taatcatcga
tgagaatgga gttcatgagc tggtgaaaaa 1740tggtatttga accagatacc aagttttgtt
tgccacgata ggaatagctt ttatttttga 1800tagaccaact gtgaacctac aagacgtctt
ggacaactga agtttaaata tccacagggt 1860tttattttgc ttgttgaact cttagagcta
ttgcaaactt cccaagatcc agatgactga 1920atttcagata gcatttttat gattcccaac
tcattgaagg tcttatttat ataatttttt 1980ccaagccaag gagaccattg gccatccagg
aaatttcgta cagctgaaat ataggcagga 2040tgttcaacat cagtttactt gcagctggaa
gcatttgttt ttgaagttgt acatagtaat 2100aatatgtcat tgtacatgtt gaaaggtttc
tatggtacta aaagtttgtt ttattttatc 2160aaacattaag cttttttaag aaaataattg
ggcagtgaaa taaatgtatc ttcttgtctc 2220tggaaaaaaa aaaaaaaaaa aaaaaaaaaa
aaaaaaaaaa aaaaaaaaaa cccgaattc 227932202DNAHomo sapiensgeneUnigene
Hs.79037; Homo sapiens heat shock 60kDa protein 1 (chaperonin)
(HSPD1) 3cacgcttgcc gccgccccgc agaaatgctt cggttaccca cagtctttcg
ccagatgaga 60ccggtgtcca gggtactggc tcctcatctc actcgggctt atgccaaaga
tgtaaaattt 120ggtgcagatg cccgagcctt aatgcttcaa ggtgtagacc ttttagccga
tgctgtggcc 180gttacaatgg ggccaaaggg aagaacagtg attattgagc agggttgggg
aagtcccaaa 240gtaacaaaag atggtgtgac tgttgcaaag tcaattgact taaaagataa
atacaagaac 300attggagcta aacttgttca agatgttgcc aataacacaa atgaagaagc
tggggatggc 360actaccactg ctactgtact ggcacgctct atagccaagg aaggcttcga
gaagattagc 420aaaggtgcta atccagtgga aatcaggaga ggtgtgatgt tagctgttga
tgctgtaatt 480gctgaactta aaaagcagtc taaacctgtg accacccctg aagaaattgc
acaggttgct 540acgatttctg caaacggaga caaagaaatt ggcaatatca tctctgatgc
aatgaaaaaa 600gttggaagaa agggtgtcat cacagtaaag gatggaaaaa cactgaatga
tgaattagaa 660attattgaag gcatgaagtt tgatcgaggc tatatttctc catactttat
taatacatca 720aaaggtcaga aatgtgaatt ccaggatgcc tatgttctgt tgagtgaaaa
gaaaatttct 780agtatccagt ccattgtacc tgctcttgaa attgccaatg ctcaccgtaa
gcctttggtc 840ataatcgctg aagatgttga tggagaagct ctaagtacac tcgtcttgaa
taggctaaag 900gttggtcttc aggttgtggc agtcaaggct ccagggtttg gtgacaatag
aaagaaccag 960cttaaagata tggctattgc tactggtggt gcagtgtttg gagaagaggg
attgaccctg 1020aatcttgaag acgttcagcc tcatgactta ggaaaagttg gagaggtcat
tgtgaccaaa 1080gacgatgcca tgctcttaaa aggaaaaggt gacaaggctc aaattgaaaa
acgtattcaa 1140gaaatcattg agcagttaga tgtcacaact agtgaatatg aaaaggaaaa
actgaatgaa 1200cggcttgcaa aactttcaga tggagtggct gtgctgaagg ttggtgggac
aagtgatgtt 1260gaagtgaatg aaaagaaaga cagagttaca gatgccctta atgctacaag
agctgctgtt 1320gaagaaggca ttgttttggg agggggttgt gccctccttc gatgcattcc
agccttggac 1380tcattgactc cagctaatga agatcaaaaa attggtatag aaattattaa
aagaacactc 1440aaaattccag caatgaccat tgctaagaat gcaggtgttg aaggatcttt
gatagttgag 1500aaaattatgc aaagttcctc agaagttggt tatgatgcta tggctggaga
ttttgtgaat 1560atggtggaaa aaggaatcat tgacccaaca aaggttgtga gaactgcttt
attggatgct 1620gctggtgtgg cctctctgtt aactacagca gaagttgtag tcacagaaat
tcctaaagaa 1680gagaaggacc ctggaatggg tgcaatgggt ggaatgggag gtggtatggg
aggtggcatg 1740ttctaactcc tagactagtg ctttaccttt attaatgaac tgtgacagga
agcccaaggc 1800agtgttcctc accaataact tcagagaagt cagttggaga aaatgaagaa
aaaggctggc 1860tgaaaatcac tataaccatc agttactggt ttcagttgac aaaatatata
atggtttact 1920gctgtcattg tccatgccta cagataattt attttgtatt tttgaataaa
aaacatttgt 1980acattcctga tactgggtac aagagccatg taccagtgta ctgctttcaa
cttaaatcac 2040tgaggcattt ttactactat tctgttaaaa tcaggatttt agtgcttgcc
accaccagat 2100gagaagttaa gcagcctttc tgtggagagt gagaataatt gtgtacaaag
tagagaagta 2160tccaattatg tgacaacctt tgtgtaataa aaatttgttt aa
220246914DNAHomo sapiensgeneUnigene Hs.30054; coagulation factor V
(proaccelerin, labile factor)(F5) 4tcattgcagc tgggacagcc cggagtgtgg
ttagcagctc ggcaagcgct gcccaggtcc 60tggggtggtg gcagccagcg ggagcaggaa
aggaagcatg ttcccaggct gcccacgcct 120ctgggtcctg gtggtcttgg gcaccagctg
ggtaggctgg gggagccaag ggacagaagc 180ggcacagcta aggcagttct acgtggctgc
tcagggcatc agttggagct accgacctga 240gcccacaaac tcaagtttga atctttctgt
aacttccttt aagaaaattg tctacagaga 300gtatgaacca tattttaaga aagaaaaacc
acaatctacc atttcaggac ttcttgggcc 360tactttatat gctgaagtcg gagacatcat
aaaagttcac tttaaaaata aggcagataa 420gcccttgagc atccatcctc aaggaattag
gtacagtaaa ttatcagaag gtgcttctta 480ccttgaccac acattccctg cagagaagat
ggacgacgct gtggctccag gccgagaata 540cacctatgaa tggagtatca gtgaggacag
tggacccacc catgatgacc ctccatgcct 600cacacacatc tattactccc atgaaaatct
gatcgaggat ttcaactctg ggctgattgg 660gcccctgctt atctgtaaaa aagggaccct
aactgagggt gggacacaga agacgtttga 720caagcaaatc gtgctactat ttgctgtgtt
tgatgaaagc aagagctgga gccagtcatc 780atccctaatg tacacagtca atggatatgt
gaatgggaca atgccagata taacagtttg 840tgcccatgac cacatcagct ggcatctgct
gggaatgagc tcggggccag aattattctc 900cattcatttc aacggccagg tcctggagca
gaaccatcat aaggtctcag ccatcaccct 960tgtcagtgct acatccacta ccgcaaatat
gactgtgggc ccagagggaa agtggatcat 1020atcttctctc accccaaaac atttgcaagc
tgggatgcag gcttacattg acattaaaaa 1080ctgcccaaag aaaaccagga atcttaagaa
aataactcgt gagcagaggc ggcacatgaa 1140gaggtgggaa tacttcattg ctgcagagga
agtcatttgg gactatgcac ctgtaatacc 1200agcgaatatg gacaaaaaat acaggtctca
gcatttggat aatttctcaa accaaattgg 1260aaaacattat aagaaagtta tgtacacaca
gtacgaagat gagtccttca ccaaacatac 1320agtgaatccc aatatgaaag aagatgggat
tttgggtcct attatcagag cccaggtcag 1380agacacactc aaaatcgtgt tcaaaaatat
ggccagccgc ccctatagca tttaccctca 1440tggagtgacc ttctcgcctt atgaagatga
agtcaactct tctttcacct caggcaggaa 1500caacaccatg atcagagcag ttcaaccagg
ggaaacctat acttataagt ggaacatctt 1560agagtttgat gaacccacag aaaatgatgc
ccagtgctta acaagaccat actacagtga 1620cgtggacatc atgagagaca tcgcctctgg
gctaatagga ctacttctaa tctgtaagag 1680cagatccctg gacaggcgag gaatacagag
ggcagcagac atcgaacagc aggctgtgtt 1740tgctgtgttt gatgagaaca aaagctggta
ccttgaggac aacatcaaca agttttgtga 1800aaatcctgat gaggtgaaac gtgatgaccc
caagttttat gaatcaaaca tcatgagcac 1860tatcaatggc tatgtgcctg agagcataac
tactcttgga ttctgctttg atgacactgt 1920ccagtggcac ttctgtagtg tggggaccca
gaatgaaatt ttgaccatcc acttcactgg 1980gcactcattc atctatggaa agaggcatga
ggacaccttg accctcttcc ccatgcgtgg 2040agaatctgtg acggtcacaa tggataatgt
tggaacttgg atgttaactt ccatgaattc 2100tagtccaaga agcaaaaagc tgaggctgaa
attcagggat gttaaatgta tcccagatga 2160tgatgaagac tcatatgaga tttttgaacc
tccagaatct acagtcatgg ctacacggaa 2220aatgcatgat cgtttagaac ctgaagatga
agagagtgat gctgactatg attaccagaa 2280cagactggct gcagcattag gaattaggtc
attccgaaac tcatcattga accaggaaga 2340agaagagttc aatcttactg ccctagctct
ggagaatggc actgaattcg tttcttcgaa 2400cacagatata attgttggtt caaattattc
ttccccaagt aatattagta agttcactgt 2460caataacctt gcagaacctc agaaagcccc
ttctcaccaa caagccacca cagctggttc 2520cccactgaga cacctcattg gcaagaactc
agttctcaat tcttccacag cagagcattc 2580cagcccatat tctgaagacc ctatagagga
tcctctacag ccagatgtca cagggatacg 2640tctactttca cttggtgctg gagaattcag
aagtcaagaa catgctaagc gtaagggacc 2700caaggtagaa agagatcaag cagcaaagca
caggttctcc tggatgaaat tactagcaca 2760taaagttggg agacacctaa gccaagacac
tggttctcct tccggaatga ggccctggga 2820ggaccttcct agccaagaca ctggttctcc
ttccagaatg aggccctggg aggaccctcc 2880tagtgatctg ttactcttaa aacaaagtaa
ctcatctaag attttggttg ggagatggca 2940tttggcttct gagaaaggta gctatgaaat
aatccaagat actgatgaag acacagctgt 3000taacaattgg ctgatcagcc cccagaatgc
ctcacgtgct tggggagaaa gcacccctct 3060tgccaacaag cctggaaagc agagtggcca
cccaaagttt cctagagtta gacataaatc 3120tctacaagta agacaggatg gaggaaagag
tagactgaag aaaagccagt ttctcattaa 3180gacacgaaaa aagaaaaaag agaagcacac
acaccatgct cctttatctc cgaggacctt 3240tcaccctcta agaagtgaag cctacaacac
attttcagaa agaagactta agcattcgtt 3300ggtgcttcat aaatccaatg aaacatctct
tcccacagac ctcaatcaga cattgccctc 3360tatggatttt ggctggatag cctcacttcc
tgaccataat cagaattcct caaatgacac 3420tggtcaggca agctgtcctc caggtcttta
tcagacagtg cccccagagg aacactatca 3480aacattcccc attcaagacc ctgatcaaat
gcactctact tcagacccca gtcacagatc 3540ctcttctcca gagctcagtg aaatgcttga
gtatgaccga agtcacaagt ccttccccac 3600agatataagt caaatgtccc cttcctcaga
acatgaagtc tggcagacag tcatctctcc 3660agacctcagc caggtgaccc tctctccaga
actcagccag acaaacctct ctccagacct 3720cagccacacg actctctctc cagaactcat
tcagagaaac ctttccccag ccctcggtca 3780gatgcccatt tctccagacc tcagccatac
aaccctttct ccagacctca gccatacaac 3840cctttcttta gacctcagcc agacaaacct
ctctccagaa ctcagtcaga caaacctttc 3900tccagccctc ggtcagatgc ccctttctcc
agacctcagc catacaacca tttctctaga 3960cttcagccag acaaacctct ctccagaact
cagccatatg actctctctc cagaactcag 4020tcagacaaac ctttccccag ccctcggtca
gatgcccatt tctccagacc tcagccatac 4080aaccctttct ctagacttca gccagacaaa
cctctctcca gaactcagtc aaacaaacct 4140ttccccagcc ctcggtcaga tgcccctttc
tccagacccc agccatacaa ccctttctct 4200agacctcagc cagacaaacc tctctccaga
actcagtcag acaaaccttt ccccagacct 4260cagtgagatg cccctctttg cagatctcag
tcaaattccc cttaccccag acctcgacca 4320gatgacactt tctccagacc ttggtgagac
agatctttcc ccaaactttg gtcagatgtc 4380cctttcccca gacctcagcc aggtgactct
ctctccagac atcagtgaca ccacccttct 4440cccggatctc agccagatat cacctcctcc
agaccttgat cagatattct acccttctga 4500atctagtcag tcattgcttc ttcaagaatt
taatgagtct tttccttatc cagaccttgg 4560tcagatgcca tctccttcat ctcctactct
caatgatact tttctatcaa aggaatttaa 4620tccactggtt atagtgggcc tcagtaaaga
tggtacagat tacattgaga tcattccaaa 4680ggaagaggtc cagagcagtg aagatgacta
tgctgaaatt gattatgtgc cctatgatga 4740cccctacaaa actgatgtta ggacaaacat
caactcctcc agagatcctg acaacattgc 4800agcatggtac ctccgcagca acaatggaaa
cagaagaaat tattacattg ctgctgaaga 4860aatatcctgg gattattcag aatttgtaca
aagggaaaca gatattgaag actctgatga 4920tattccagaa gataccacat ataagaaagt
agtttttcga aagtacctcg acagcacttt 4980taccaaacgt gatcctcgag gggagtatga
agagcatctc ggaattcttg gtcctattat 5040cagagctgaa gtggatgatg ttatccaagt
tcgttttaaa aatttagcat ccagaccgta 5100ttctctacat gcccatggac tttcctatga
aaaatcatca gagggaaaga cttatgaaga 5160tgactctcct gaatggttta aggaagataa
tgctgttcag ccaaatagca gttataccta 5220cgtatggcat gccactgagc gatcagggcc
agaaagtcct ggctctgcct gtcgggcttg 5280ggcctactac tcagctgtga acccagaaaa
agatattcac tcaggcttga taggtcccct 5340cctaatctgc caaaaaggaa tactacataa
ggacagcaac atgcctgtgg acatgagaga 5400atttgtctta ctatttatga cctttgatga
aaagaagagc tggtactatg aaaagaagtc 5460ccgaagttct tggagactca catcctcaga
aatgaaaaaa tcccatgagt ttcacgccat 5520taatgggatg atctacagct tgcctggcct
gaaaatgtat gagcaagagt gggtgaggtt 5580acacctgctg aacataggcg gctcccaaga
cattcacgtg gttcactttc acggccagac 5640cttgctggaa aatggcaata aacagcacca
gttaggggtc tggccccttc tgcctggttc 5700atttaaaact cttgaaatga aggcatcaaa
acctggctgg tggctcctaa acacagaggt 5760tggagaaaac cagagagcag ggatgcaaac
gccatttctt atcatggaca gagactgtag 5820gatgccaatg ggactaagca ctggtatcat
atctgattca cagatcaagg cttcagagtt 5880tctgggttac tgggagccca gattagcaag
attaaacaat ggtggatctt ataatgcttg 5940gagtgtagaa aaacttgcag cagaatttgc
ctctaaacct tggatccagg tggacatgca 6000aaaggaagtc ataatcacag ggatccagac
ccaaggtgcc aaacactacc tgaagtcctg 6060ctataccaca gagttctatg tagcttacag
ttccaaccag atcaactggc agatcttcaa 6120agggaacagc acaaggaatg tgatgtattt
taatggcaat tcagatgcct ctacaataaa 6180agagaatcag tttgacccac ctattgtggc
tagatatatt aggatctctc caactcgagc 6240ctataacaga cctacccttc gattggaact
gcaaggttgt gaggtaaatg gatgttccac 6300acccctgggt atggaaaatg gaaagataga
aaacaagcaa atcacagctt cttcgtttaa 6360gaaatcttgg tggggagatt actgggaacc
cttccgtgcc cgtctgaatg cccagggacg 6420tgtgaatgcc tggcaagcca aggcaaacaa
caataagcag tggctagaaa ttgatctact 6480caagatcaag aagataacgg caattataac
acagggctgc aagtctctgt cctctgaaat 6540gtatgtaaag agctatacca tccactacag
tgagcaggga gtggaatgga aaccatacag 6600gctgaaatcc tccatggtgg acaagatttt
tgaaggaaat actaatacca aaggacatgt 6660gaagaacttt ttcaaccccc caatcatttc
caggtttatc cgtgtcattc ctaaaacatg 6720gaatcaaagt attgcacttc gcctggaact
ctttggctgt gatatttact agaattgaac 6780attcaaaaac ccctggaaga gactctttaa
gacctcaaac catttagaat gggcaatgta 6840ttttacgctg tgttaaatgt taacagtttt
ccactatttc tctttctttt ctattagtga 6900ataaaatttt atac
691451654DNAHomo sapiensgeneUnigene Hs.75432;
IMP (inosine monophosphate) dehydrogenase 2 (IMPDH2) 5gaattcgggc
ggtcctcgga gacacgcggc ggtgtcctgt gttggccatg gccgactacc 60tgattagtgg
gggcacgtcc tacgtgccag acgacggact cacagcacag cagctcttca 120actgcggaga
cggcctcacc tacaatgact ttctcattct ccctgggtac atcgacttca 180ctgcagacca
ggtggacctg acttctgctc tgaccaagaa aatcactctt aagaccccac 240tggtttcctc
tcccatggac acagtcacag aggctgggat ggccatagca atggcgctta 300caggcggtat
tggcttcatc caccacaact gtacacctga attccaggcc aatgaagttc 360ggaaagtgaa
gaaatatgaa cagggattca tcacagaccc tgtggtcctc agccccaagg 420atcgcgtgcg
ggatgttttt gaggccaagg cccggcatgg tttctgcggt atcccaatca 480cagacacagg
ccggatgggg agccgcttgg tgggcatcat ctcctccagg gacattgatt 540ttctcaaaga
ggaggaacat gactgtttct tggaagagat aatgacaaag agggaagact 600tggtggtagc
cccccgcagc atcacactga aggaggcaaa tgaaattctg cagcgcagca 660agaagggaaa
gttgcccatt gtaaatgaag atgatgagct tgtggccatc attgcccgga 720cagacctgaa
gaagaatcgg gactacccac tagcctccaa agatgccaag aaacagctgc 780tgtgtggggc
agccattggc actcatgagg atgacaagta taggctggac ttgctcgccc 840aggctggtgt
ggatgtagtg gttttggact cttcccaggg aaattccatc ttccagatca 900atatgatcaa
gtacatcaaa gacaaatacc ctaatctcca agtcattgga ggcaatgtgg 960tcactgctgc
ccaggccaag aacctcattg atgcaggtgt ggatgccctg cgggtgggca 1020tgggaagtgg
ctccatctgc attacgcagg aagtgctggc ctgtgggcgg ccccaagcaa 1080cagcagtgta
caaggtgtca gagtatgcac ggcgctttgg tgttccggtc attgctgatg 1140gaggaatcca
aaatgtgggt catattgcga aagccttggc ccttggggcc tccacagtca 1200tgatgggctc
tctcctggct gccaccactg aggcccctgg tgaatacttc ttttccgatg 1260ggatccggct
aaagaaatat cgcggtatgg gttctctcga tgccatggac aagcacctca 1320gcagccagaa
cagatatttc agtgaagctg acaaaatcaa agtggcccag ggagtgtctg 1380gtgctgtgca
ggacaaaggg tcaatccaca aatttgtccc ttacctgatt gctggcatcc 1440aacactcatg
ccaggacatt ggtgccaaga gcttgaccca agtccgagcc atgatgtact 1500ctggggagct
taagtttgag aagagaacgt cctcagccca ggtggaaggt ggcgtccata 1560gcctccattc
gtatgagaag cggcttttct gaaaagggat ccagcacacc tcctcggttt 1620ttttttcaat
aaaagtttag aaagacccga attc 16546893DNAHomo
sapiensgeneUnigene Hs.699; peptidylprolyl isomerase B (cyclophilin
B) (PPIB) 6gggtttcgcc tccgcctgtg gatgctgcgc ctctccgaac gcaacatgaa
ggtgctcctt 60gccgccgccc tcatcgcggg gtccgtcttc ttcctgctgc tgccgggacc
ttctgcggcc 120gatgagaaga agaaggggcc caaagtcacc gtcaaggtgt attttgacct
acgaattgga 180gatgaagatg taggccgggt gatctttggt ctcttcggaa agactgttcc
aaaaacagtg 240gataattttg tggccttagc tacaggagag aaaggatttg gctacaaaaa
cagcaaattc 300catcgtgtaa tcaaggactt catgatccag ggcggagact tcaccagggg
agatggcaca 360ggaggaaaga gcatctacgg tgagcgcttc cccgatgaga acttcaaact
gaagcactac 420gggcctggct gggtgagcat ggccaacgca ggcaaagaca ccaacggctc
ccagttcttc 480atcacgacag tcaagacagc ctggctagat ggcaagcatg tggtgtttgg
caaagttcta 540gagggcatgg aggtggtgcg gaaggtggag agcaccaaga cagacagccg
ggataaaccc 600ctgaaggatg tgatcatcgc agactgcggc aagatcgagg tggagaagcc
ctttgccatc 660gccaaggagt agggcacagg gacatctttc tttgagtgac cgtctgtgca
ggccctgtag 720tccgccacag ggctctgagc tgcactggcc ccggtgctgg catctggtgg
agcggaccca 780ctcccctcac attccacagg cccatggact cacttttgta acaaactcct
accaacactg 840accaataaaa aaaaatgtgg gttttttttt tttttaatat aaaaaaaccc
ccc 89371901DNAHomo sapiensgeneUnigene Hs.1708; ; chaperonin
containing TCP1, subunit 3 (gamma) (CCT3) 7atggggcatc ggccggtgct
cgtgctcagc cagaacacaa agcgtgaatc cggaagaaaa 60gttcaatctg gaaacatcaa
tgctgccaag actattgcag atatcatccg aacatgtttg 120ggacccaagt ccatgatgaa
gatgcttttg gacccaatgg gaggcattgt gatgaccaat 180gatggcaatg ccattcttcg
agagattcaa gtccagcatc cagcggccaa gtccatgatc 240gaaattagcc ggacccagga
tgaagaagtt ggagatggga ccacatcagt aattattctt 300gcaggggaaa tgctgtctgt
agctgagcac ttcctggagc agcagatgca cccaacagtg 360gtgatcagtg cttaccgcaa
ggcattggat gatatgatca gcaccctaaa gaaaataagt 420atcccagtcg acatcagtga
cagtgatatg atgctgaaca tcatcaacag ctctattact 480accaaagcca tcagccggtg
gtcatctttg gcttgcaaca ttgccctgga tgctgtcaag 540atggtacagt ttgaggagaa
tggtcggaaa gagattgaca taaaaaaata tgcaagagtg 600gaaaagatac ctggaggcat
cattgaagac tcctgtgtct tgcgtggagt catgattaac 660aaggatgtga cccatccacg
tatgcggcgc tatatcaaga accctcgcat tgtgctgctg 720gattcttctc tggaatacaa
gaaaggagga agccagactg acattgagat tacacgagag 780gaggacttca cccgaattct
ccagatggag gaagagtaca tccagcagct ctgtgaggac 840attatccaac tgaagcccga
tgtggtcatc actgaaaagg gcatctcaga tttagctcag 900cactacctta tgcgggccaa
tatcacagcc atccgcagag tccggaagac agacaataat 960cgcattgcta gagcctgtgg
ggcccggata gtcagccgac cagaggaact gagagaagat 1020gatgttggaa caggagcagg
cctgttggaa atcaagaaaa ttggagatga atactttact 1080ttcatcactg actgcaaaga
ccccaaggcc tgcaccattc tcctccgggg ggctagcaaa 1140gagattctct cggaagtaga
acgcaacctc caggatgcca tgcaagtgtg tcgcaatgtt 1200ctcctggacc ctcagctggt
gccagggggt ggggcctccg agatggctgt cgcccatgcc 1260ttgacagaaa aatccaaggc
catgactggt gtggaacaat ggccatacag ggctgttgcc 1320caggccctag aggtcattcc
tcgtaccctg atccagaact gtggggccag caccatccgt 1380ctacttacct cccttcgggc
caagcacacc caggagaact gtgagacctg gggtgtaaat 1440ggtgagacgg gtactttggt
ggacatgaag gaactgggca tatgggagcc attggctgtg 1500aagctgcaga cttataagac
agcagtggag acggcagttc tgctactgcg aattgatgac 1560atcgtttcag gccacaaaaa
gaaaggcgat gaccagagcc ggcaaggcgg ggctcctgat 1620gctggccagg agtgagtgct
aggcaaggct acttcaatgc acagaaccag cagagtctcc 1680ccttttcctg agccagagtg
ccaggaacac tgtggacgtc tttgttcaga agggatcagg 1740ttggggggca gcccccagtc
cctttctgtc ccagctcagt tttccaaaag acactgacat 1800gtaattcttc tctattgtaa
ggtttccatt tagtttgctt ccgatgatta aatctaagtc 1860atttgaaaaa aaaaaaaaaa
aaaaaaaaaa aaaaaaaaaa a 190181249DNAHomo
sapiensgeneUnigene Hs.69469; dendritic cell protein (GA17)
8gggtcggcgt ggtcttgcga gtggagtgtc cgctgtgccc gggcctgcac catgagcgtc
60ccggccttca tcgacatcag tgaagaagat caggctgctg agcttcgtgc ttatctgaaa
120tctaaaggag ctgagatttc agaagagaac tcggaaggtg gacttcatgt tgatttagct
180caaattattg aagcctgtga tgtgtgtctg aaggaggatg ataaagatgt tgaaagtgtg
240gtgaacagtg tggtatccct actcttgatc ctggaaccag acaagcaaga agctttgatt
300gaaagcctat gtgaaaagct ggtcaaattt cgcgaaggtg aacgcccgtc tctgagactg
360cagttgttaa gcaacctttt ccacgggatg gataagaata ctcctgtaag atacacagtg
420tattgcagcc ttattgaagt ggtagcatct tgtggggcca tccagtacat cccaactgag
480ctggatcaag ttagaaaatg gatttctgac tggaatctca ccactgaaaa aaagcacacc
540cttttaagac tactttatga ggcacttgcg gattgtaaga agagtgatgc tgcttcaaaa
600gtcatggtgg aattgctcgg aagttacaca gaggacaatg cttcccaggc tcgagttgat
660gcccacaggt gtattgtcga accattgaaa gatccaaatg catttctttt tgaccacctt
720cttactttaa aaccagtcaa gtttttggaa ggcgagctta ttcatgatct tttaaccatt
780tttgtgagtg ctaaattggc atcatatgtc aagttttatc agaataataa agacttcatt
840gattcacttg gcctgttaca tgaacagaat atggcaaaaa tgagactact tacttttatg
900ggaatggcaa tagaaaataa ggaaatttct tttgacacaa tgcagcaaga acttcagatt
960ggagctgatg atgttgaagc atttgttatt gacgccgtaa gaactaaaat ggtctactgc
1020aaaattgatc agacccagag aaaagtagtt gtcagtcata gcacacatcg gacatttgga
1080aaacagcggt ggcaacaact gtatgacaca cttaatgcct ggaaacaaaa tctgaacaaa
1140gtgaaaaaca gccttttgag tctttccgat acctgagttt ttatgcttat aatttttgtt
1200ctttgaaaaa aaagccctaa atcatagtaa gacattataa accaaaaaa
12499664DNAHomo sapiensgeneUnigene Hs.82280; regulator of G-protein
signaling 10 (RGS10) 9ggattgttgg tctgcgtgga acttctcagg tggacaccag
agcatggaac acatccacga 60cagcgatggc agttccagca gcagccacca gagcctcaag
agcacagcca aatgggcggc 120atccctggag aatctgctgg aagacccaga aggcgtgaaa
agatttaggg aatttttaaa 180aaaggaattc agtgaagaaa atgttttgtt ttggctagca
tgtgaagatt ttaagaaaat 240gcaagataag acgcagatgc aggaaaaggc aaaggagatc
tacatgacct ttctgtccag 300caaggcctca tcacaggtca acgtggaggg gcagtctcgg
ctcaacgaga agatcctgga 360agaaccgcac cctctgatgt tccagaaact ccaggaccag
atctttaatc tcatgaagta 420cgacagctac agccgctttc ttaagtctga cttgttttta
aaacacaagc gaaccgagga 480agaggaagaa gatttgcctg atgctcaaac tgcagctaaa
agagcttcca gaatttataa 540cacatgagcc cccaaaaagc cgggactggc agctttaaga
agcaaaggaa tttcctctca 600ggacgtgccg ggtttatcat tgctttgtta tttgtaagga
ctgaaatgta caaaaccctt 660caat
664101792DNAHomo sapiensgeneUnigene Hs.79217;
pyrroline-5-carboxylate reductase 1 (PYCR1) 10ctccggacag catgagcgtg
ggcttcatcg gcgctggcca gctggctttt gccctggcca 60agggcttcac agcagcaggc
gtcttggctg cccacaagat aatggctagc tccccagaca 120tggacctggc cacagtttct
gctctcagga agatgggggt gaagttgaca ccccacaaca 180aggagacggt gcagcacagt
gatgtgctct tcctggctgt gaagccacac atcatcccct 240tcatcctgga tgaaataggc
gccgacattg aggacagaca cattgtggtg tcctgcgcgg 300ccggcgtcac catcagctcc
attgagaaga agctgtcagc gtttcggcca gcccccaggg 360tcatccgctg catgaccaac
actccagtcg tggtgcggga gggggccacc gtgtatgcca 420caggcacgca cgcccaggtg
gaggacggga ggctcatgga gcagctgctg agcacggtgg 480gcttctgcac ggaggtggaa
gaggacctga ttgatgccgt cacggggctc agtggcagcg 540gccccgccta cgcattcaca
gccctggatg ccctggctga tgggggtgtg aagatgggac 600ttccaaggcg cctggcagtc
cgcctcgggg cccaggccct cctgggggct gccaagatgc 660tgctgcactc agaacagcac
ccaggccagc tcaaggacaa cgtcagctct cctggtgggg 720ccaccatcca tgccttgcat
gtgctggaga gtgggggctt ccgctccctg ctcatcaacg 780ctgtggaggc ctcctgcatc
cgcacacggg agctgcagtc catggctgac caggagcagg 840tgtcaccagc cgccatcaag
aagaccatcc tggacaaggt gaagctggac tcccctgcag 900ggaccgctct gtcgccttct
ggccacacca agctgctccc ccgcagcctg gccccagcgg 960gcaaggattg acacgtcctg
cctgaccacc atcctgccac caccttctct tctcttgtca 1020ctagggggac tagggggtcc
ccaaagtggc ccactttctg tggctctgat cagcgcaggg 1080gccagccagg gacatagcca
gggaggggcc acatcacttc ccactggaaa tctctgtggt 1140ctgcaagtgc ttcccagccc
agaacagggg tggattcccc aacctcaacc tcctttcttc 1200tctgctccca aaccatgtca
ggaccacctt cctctagagc tcgggagccc ggagggtctt 1260cacccactcc tactccagta
tcagctggca cgggctcctt cctgagagca aaggtcaagg 1320accccctctg tgaaggctca
gcagaggtgg gatcccacgc cccctcccgg cccctccctg 1380ccctccattc agggagaaac
ctctccttcc cgtgtgagaa gggccagagg gtccaggcat 1440cccaagtcca gcgtgaaggg
ccacagcccc tcttggctgc caagcacgca gatcccatgg 1500acatttgggg aaagggctcc
ttgggctgct ggtgaacttc tgtggccacc acctcctgct 1560cctgacctcc ctgggagggt
gctatcagtt ctgtcctggc cctttcagtt ttataagttg 1620gtttccagcc cccagtgtcc
tgacttctgt ctgccacatg aggagggagg ccctgcctgt 1680gtgggagggt ggttactgtg
ggtggaatag tggaggcctt caactgatta gacaaggccc 1740gcccacatct tggagggcat
ctgccttact gattaaaatg tcaatgtaat ct 179211529DNAHomo
sapiensgeneUnigene Hs.117950; cDNA clone IMAGE1519390 3 11aatcttctaa
gtccttttaa ttgttcttat aaactagcat aagatataaa cttaagtagt 60acacatgagt
tttataattt actaatctct gacagatagc taagcatagc acatcagagc 120ataacacagt
gtgagggaaa taaagtgtac aatgacatct tctattctgg acctaataat 180tcaatagaga
aagaactact tgtagtcact gtggttacag aaggtttcat ggacagcgaa 240cataaagctc
tactagctaa caaataggtc ttaatgataa aaacgtgggc cttcagagaa 300ctaaaggtac
caatgtgtgg cagtccaaaa ttacgaggaa aatgagttcc cttcatgggt 360cacatcagca
attttttttt tccccttttg agacagagtc ttgctctgct gcccaggttg 420gagtgcagtg
gcatgatcca ggctcactgc aacctccgcc tcccgggttc aagcaattct 480catgcctcag
cctcccgagt agctgggatt acaggtgcct gtcatcacg 529126031DNAHomo
sapiensgeneUnigene Hs.8858; bromodomain adjacent to zinc finger
domain, 1A (BAZ1A) 12cttttcccat cgtgtagtca agagtctgtg ccagacttga
aggctttact ttgttagcca 60tgtgtttatg aacccccagc gctttcccta gatcttttgg
ctgataatct caaacatgga 120ggatgcttct gaatcttcac gaggggttgc tccattaatt
aataatgtag ttctcccagg 180ctctccgctg tctcttcctg tatcagtgac aggctgtaaa
agtcatcgag tagccaataa 240aaaggtagaa gcgaggagtg aaaagctcct cccaacagct
cttcctcctt cagagccgaa 300agtagatcag aaacttccca ggagctccga gaggcgggga
agtggcggtg ggacgcaatt 360ccccgcgcgg agtcgggcag tggcagcggg agaagcggca
gccaggggcg cggcggggcc 420ggagagaggc ggtcccctgg gaggacgggg tctcccctcg
ttgcctttgt agtggagaag 480gtggacaagt ggcagtcggc gtgatcgcag ggaagcgggg
ccggcgcggg cggccgaggg 540tccaggcgag cccgcgggcg gacgggagat gccgctgcta
caccgaaagc cgtttgtgag 600acagaagccg cccgcggacc tgcggcccga cgaggaagtt
ttctactgta aagtcaccaa 660cgagatcttc cgccactacg atgacttttt tgaacgaacc
attctgtgca acagccttgt 720gtggagttgt gctgtgacgg gtagacctgg actgacgtat
caggaagcac ttgagtcaga 780aaaaaaagca agacagaatc ttcagagttt tccagaacca
ctaattattc cagttttata 840cttgaccagc cttacccatc gttcgcgctt acatgaaatt
tgtgatgata tctttgcata 900tgtcaaggat cgatattttg tcgaagaaac tgtggaagtc
attaggaaca atggtgcaag 960gttgcagtgt aggattttgg aagtcctccc tccatcacat
caaaatggtt ttgctaatgg 1020acatgttaac agtgtggatg gagaaactat tatcatcagt
gatagtgatg attcagaaac 1080acaaagctgt tcttttcaaa atgggaagaa aaaagatgca
attgatccct tactattcaa 1140gtataaagtg caacccacta aaaaagaatt acatgagtct
gctattgtta aagcaacaca 1200aatcagccgg agaaaacacc tattttctcg tgataaacta
aagctttttc tgaagcaaca 1260ctgtgaacca caagatggag tcattaaaat aaaggcatca
tctctttcaa cgtataaaat 1320agcagaacaa gatttttctt atttcttccc tgatgatcca
cccacattta tcttcagtcc 1380tgctaacaga cgaagaggga gacctcccaa acgaatacat
attagtcaag aggacaatgt 1440tgctaataaa cagactcttg caagttatag gagcaaagct
actaaagaaa gagataaact 1500tttgaaacaa gaagaaatga agtcactggc ttttgaaaag
gctaaattaa aaagagaaaa 1560agcagatgcc ctagaagcga agaaaaaaga aaaagaagat
aaagagaaaa agagggaaga 1620attgaaaaaa attgttgaag aagagagact aaagaaaaaa
gaagaaaaag agaggcttaa 1680agtagaaaga gaaaaggaaa gagagaagtt acgtgaagaa
aagcgaaagt atgtggaata 1740cttaaaacag tggagtaaac ctagagaaga tatggaatgt
gatgacctta aggaacttcc 1800agaaccaaca ccagtgaaaa ctagactacc tcctgaaatc
tttggtgatg ctctgatggt 1860tttggagttc cttaatgcat ttggggaact ttttgatctt
caagatgagt ttcctgatgg 1920agtaacccta gaagtattag aggaagctct tgtaggaaat
gacagtgaag gcccactgtg 1980tgaattgctt tttttcttcc tgactgcaat cttccaggca
atagctgaag aagaagagga 2040agtagccaaa gagcaactaa ctgatgctga caccaaagat
ttaacagagg ctttggatga 2100agatgcagac cccacaaaat ctgcactgtc tgcagttgca
tctttggcag ctgcatggcc 2160acagttacac cagggctgca gtttgaaaag tttggatctt
gatagctgca ctctttcaga 2220aatcctcaga ctgcacatct tagcttcagg tgctgatgta
acatcagcaa atgcaaagta 2280tagatatcaa aaacgaggag gatttgatgc tacagatgat
gcttgtatgg agcttcgttt 2340gagcaatccc agtctagtga agaaactgtc aagcacctca
gtgtatgatt tgacaccagg 2400agaaaaaatg aagatactcc atgctctctg tggaaagcta
ctgaccctag tttcaactag 2460ggattttatt gaagattatg ttgatatatt acgacaggca
aagcaggagt tccgggaatt 2520aaaagcagaa caacatcgaa aagagaggga agaagcagct
gccagaattc gtaaaaggaa 2580ggaagaaaaa cttaaggagc aagaacaaaa aatgaaagag
aaacaagaaa aactgaaaga 2640agatgagcaa agaaattcaa cggcagatat atctattggg
gaggaagaaa gggaagattt 2700tgatactagc attgagagca aagacacaga gcaaaaggaa
ttagatcaag atatggtcac 2760tgaagatgaa gatgacccag gatcacataa aagaggcaga
agggggaaaa gaggacaaaa 2820tggatttaaa gaatttacaa ggcaagaaca gatcaactgt
gtaacaagag agcctcttac 2880tgctgatgag gaagaagcat taaaacagga acaccaacga
aaagagaaag agctcttaga 2940aaaaatccaa agtgccatag cctgtaccaa tatctttccc
ttgggtcgcg accgcatgta 3000tagacgatac tggattttcc cttctattcc tggactcttt
attgaagagg attattctgg 3060tcttactgaa gacatgctgt tgcctagacc ttcatcattt
cagaataatg tacagtctca 3120agatcctcag gtatccacta aaactggaga gcctttgatg
tctgaatcta cctccaacat 3180tgaccaaggt ccacgtgacc attctgtgca gctgccaaaa
ccagtgcata agccaaatcg 3240gtggtgcttt tacagttctt gtgaacagct agaccagctt
attgaagctc ttaattctag 3300aggacataga gaaagtgcct taaaagaaac tttgttacaa
gagaaaagca gaatatgtgc 3360acagctagcc cgtttttctg aagagaaatt tcatttttca
gacaaacctc agcctgatag 3420caaaccaaca tatagtcggg gaagatcttc caatgcatat
gatccatctc agatgtgtgc 3480agaaaagcaa cttgaactaa ggctgagaga ttttctttta
gatattgaag atagaatcta 3540ccaaggaaca ttaggagcca tcaaggttac agatcgacat
atctggagat cagcattaga 3600aagtggacgg tatgagctgt taagtgagga aaacaaggaa
aatgggataa ttaaaactgt 3660gaatgaagac gtagaagaga tggaaattga tgaacaaaca
aaggtcatag taaaagacag 3720acttttgggg ataaaaacag aaactccaag tactgtatca
acaaatgcaa gtacaccaca 3780atcagtgagc agtgtggttc attatctggc aatggcactc
tttcaaatag agcagggcat 3840tgagcggcgt tttctgaaag ctccacttga tgccagtgac
agtgggcgtt cttataaaac 3900agttctggac cgttggagag agtctctcct ttcttctgct
agtctatccc aagtttttct 3960tcacctatcc accttggatc gtagcgtgat atggtctaaa
tctatactga atgcgcgttg 4020caagatatgt cgaaagaaag gcgatgctga aaacatggtt
ctttgtgatg gctgtgatag 4080gggtcatcat acctactgtg ttcgaccaaa gctcaagact
gtgcctgaag gagactggtt 4140ttgtccagaa tgtcgaccaa agcaacgttc tagaagactc
tcctctagac agagaccatc 4200cttggaaagt gatgaagatg tggaagacag tatgggaggt
gaggatgatg aagttgatgg 4260cgatgaagaa gaaggtcaaa gtgaggagga agagtatgag
gtagaacaag atgaagatga 4320ctctcaagaa gaggaagaag tcagcctacc caaacgagga
agaccacaag ttagattgcc 4380agttaaaaca agagggaaac ttagctcttc tttctcaagt
cgtggccaac aacaagaacc 4440tggaagatac ccttcaagga gtcagcagag cacacccaaa
acaactgttt cttctaaaac 4500tggtagaagc ctaagaaaga taaactctgc tcctcctaca
gaaacaaaat ctttaagaat 4560tgccagtcgt tctactcgcc acagtcatgg cccactgcaa
gcagatgtat ttgtggaatt 4620gcttagtcct cgtagaaaac gcagaggcag gaaaagtgct
aataatacac cagaaaatag 4680tcccaacttc cctaacttca gagtcattgc cacaaagtca
agtgaacagt caagatctgt 4740aaatattgct tcaaaacttt ctctccaaga gagtgaatcc
aaaagaagat gcagaaaaag 4800acaatctcca gagccatcgc ctgtgacact gggtcgaagg
agttctggcc gacagggagg 4860agttcatgaa ttgtctgctt ttgaacaact tgttgtagaa
ttggtacgac atgatgacag 4920ctggcctttt ttgaaacttg tttctaaaat ccaggtccca
gactactatg acatcatcaa 4980aaagcccatt gccttaaata taattcgtga aaaagtgaat
aagtgtgaat ataaattagc 5040atctgagttt attgatgaca ttgagttaat gttttcgaac
tgctttgaat acaaccctcg 5100taacacaagt gaagcaaaag ctggaactag gcttcaagca
ttttttcata ttcaggctca 5160aaagcttgga ctccacgtca cacccagtaa tgtggaccaa
gttagcacac caccggctgc 5220gaaaaagtca cgaatctgac tttgtccttc taaaggatat
atttgaagaa aaacaaattg 5280ttcatgaaaa tggaacatta aatcatgctg tataaagcaa
taacaattga ttgaccacat 5340gaaagtgtgg cctgcactat attctcaatt ttaatattaa
gcactcagga gaatgtagga 5400aagatatcct ttgctacagt tttgttcagt atctaataag
tttgatagat gtattggata 5460cagtactggt ttacagaggt ttttgtacat ttttgagatc
attcatgtgt ccagagatct 5520tggaaaatat tttttcaccc acgatttatt ttgttattga
tgattttttt ttaaagtggt 5580ggtattaagg gagagttatc tacatggatg agtcttccgc
tatagcacag tttagaaaag 5640gtgtttatgt cttaattaat tgtttgagta cattctttca
acactacaca tgaatgaatc 5700caatcttata accttgaagt gctgtaccag tgctggctgc
aggtattaag tccaagttta 5760ttaactagat atttatttag tattgagagt aatttgtgaa
tttgttttgt atttataaaa 5820tttatacctg aaaaatgttc cttaatgttt taaacctttt
actgtgtttt tattcctcta 5880acttccttaa tgatcaatca aaaaaagtaa caccctccct
ttttcctgac agttctttca 5940gctttacaga actgtattat aagtttctat gtataacttt
ttaactgtac aaataaaata 6000acattttttc aaataaaaaa aaaaaaaaaa a
6031131200DNAHomo sapiensgeneUnigene Hs.75939;
uridine-cytidine kinase 2 cDNA clone MGC10318 IMAGE3940564
13ctccttcggg aaacccagcc ccgtcaccgg gctccgagcg gctcgcaggc gagcgacagc
60ggcctcagcc ccggcagcgc ccagcggcgg ctgcggaaag cggagggagt ccgacgcggg
120cgcgggcggg gagcgtgcgt ccgttcgcac aggcagcggg aggaggggcg gcgcgaacca
180tggccgggga cagcgagcag accctgcaga accaccagca gcccaacggc ggcgagccct
240tccttatagg cgtcagcggg ggaacagcta gcggcaagtc ttccgtgtgt gctaagatcg
300tgcagctcct ggggcagaat gaggtggact atcgccagaa gcaggtggtc atcctgagcc
360aggatagctt ctaccgtgtc cttacctcgg agcagaaggc caaagccctg aagggccagt
420tcaactttga ccacccggat gcctttgaca atgaactcat tctcaaaaca ctcaaagaaa
480tcactgaagg gaaaacagtc cagatccccg tgtatgactt tgtctcccat tcccggaagg
540aggagacagt tactgtctat cccgcagacg tggtgctctt tgaagggatc ctggccttct
600actcccagga ggtacgagac ctgttccaga tgaagctttt tgtggataca gatgcggaca
660cccggctctc acgcagagta ttaagggaca tcagcgagag aggcagggat cttgagcaga
720ttttatctca gtacattacg ttcgtcaagc ctgcctttga ggaattctgc ttgccaacaa
780agaagtatgc tgatgtgatc atccctagag gtgcagataa tctggtggcc atcaacctca
840tcgtgcagca catccaggac atcctgaatg gagggccctc caaacggcag accaatggct
900gtctcaacgg ctacacccct tcacgcaaga ggcaggcatc ggagtccagc agcaggccgc
960attgacccgt ctccatcgga ccccagcccc tatctccaag agacagagga ggggtcagga
1020ggcactgctc atctgtacat actgtttcct atgacattac tgtatttaag aaaacaccat
1080ggagatgaaa tgcctttgat tttttttttc tttttgtact ttggaacgac aaaatgaaac
1140agaacttgac cctgagctta aataacaaaa ctgtgccaac taaaaaaaaa aaaaaaaaaa
1200141562DNAHomo sapiensgeneUnigene Hs.75061; MACMARCKS;MARCKS-like 1
14gcgcggagcg gagcggcggc gggcgcagct agcgggtcgg ccgcggagcg gaggtgcagc
60tcggcttccc ccggcacccc tccccctcgg gcgccagccc cacccctccg ccggccgggc
120cgaccccgcc gtactatccc ctgcggcgcg agcccggggc ggctccaagc gccccccagc
180agacccccat catgggcagc cagagctcca aggctccccg gggcgacgtg accgccgagg
240aggcagcagg cgcttccccc gcgaaggcca acggccagga gaatggccac gtgaaaagca
300atggagactt atcccccaag ggtgaagggg agtcgccccc tgtgaacgga acagatgagg
360cagccggggc cactggcgat gccatcgagc cagcaccccc tagccagggt gctgaggcca
420agggggaggt cccccccaag gagaccccca agaagaagaa gaaattctct ttcaagaagc
480ctttcaaatt gagcggcctg tccttcaaga gaaatcggaa ggagggtggg ggtgattctt
540ctgcctcctc acccacagag gaagagcagg agcaggggga gatcggtgcc tgcagcgacg
600agggcactgc tcaggaaggg aaggccgcag ccacccctga gagccaggaa ccccaggcca
660agggggcaga ggctagtgca gcctcagaag aagaggcagg gccccaggct acagagccat
720ccactccctc ggggccggag agtggcccta caccagccag cgctgagcag aatgagtagc
780taggtagggg caggtgggtg atctctaagc tgcaaaaact gtgctgtcct tgtgaggtca
840ctgcctggac ctggtgccct ggctgccttc ctgtgcccag aaaggaaggg gctattgcct
900cctcccagcc acgttccctt tcctcctctc cctcctgtgg attctcccat cagccatctg
960gttctcctct taaggccagt tgaagatggt cccttacagc ttcccaagtt aggttagtga
1020tgtgaaatgc tcctgtccct ggccctacct ccttccctgt ccccacccct gcataaggca
1080gttgttggtt ttcttcccca attcttttcc aagtaggttt tgtttaccct actccccaaa
1140tccctgagcc agaagtgggg tgcttatact cccaaacctt gagtgtccag ccttcccctg
1200ttgtttttag tctcttgtgc tgtgcctagt ggcacctggg ctggggagga cactgccccg
1260tctaggtttt tataaatgtc ttactcaagt tcaaacctcc agcctgtgaa tcaactgtgt
1320ctcttttttg acttggtaag caagtattag gctttggggt ggggggaggt ctgtaatgtg
1380aaacaacttc ttgtcttttt ttctcccact gttgtaaata acttttaatg gccaaacccc
1440agatttgtac tttttttttt ttctaactgc taaaaccatt ctcttccacc tggttttact
1500gtaacatttg gaaaaggaat aaatgtcgtc cctttttaaa aaaaaaaaaa aaaaaaaaaa
1560aa
1562151090DNAHomo sapiensgeneUnigene Hs.162209; claudin 8 (CLDN8)
15ggggcagaat gagatattaa acccaatgct ttgattgttc tagaaagtat agtaatttgt
60tttctaaggt ggttcaagca tctactcttt ttatcattta cttcaaaatg acattgctaa
120agactgcatt attttactac tgtaatttct ccacgacata gcattatgta catagatgag
180tgtaacattt atatctcaca tagagacatg cttatatggt tttatttaaa atgaaatgcc
240agtccattac actgaataaa tagaactcaa ctattgcttt tcagggaaat catggatagg
300gttgaagaag gttactatta attgttttaa aaacagctta gggattaatg tcctccattt
360ataatgaaga ttaaaatgaa ggctttaatc agcattgtaa aggaaattga atggctttct
420gatatgctgt tttttagcct aggagttaga aatcctaact tctttatcct cttctcccag
480aggctttttt tttcttgtgt attaaattaa catttttaaa aagcagatat tttgtcaagg
540ggctttgcat tcaaactgct tttccagggc tatactcaga agaaagataa aagtgtgatc
600taagaaaaag tgatggtttt aggaaagtga aaatattttt gtttttgtat ttgaagaaga
660atgatgcatt ttgacaagaa atcatatatg tatggatata ttttaataag tatttgagta
720cagactttga ggtttcatca atataaataa aagagcagaa aaatatgtct tggttttcat
780ttgcttacca aaaaaacaac aacaaaaaaa gttgtccttt gagaacttca cctgctccta
840tgtgggtacc tgagtcaaaa ttgtcatttt tgttctgtga aaaataaatt tccttcttgt
900accatttctg tttagtttta ctaaaatctg taaatactgt atttttctgt ttattccaaa
960tttgatgaaa ctgacaatcc aatttgaaag tttgtgtcga cgtctgtcta gcttaaatga
1020atgtgttcta tttgctttat acatttatat taataaattg tacatttttc caaaaaaaaa
1080aaaaaaaaaa
1090162208DNAHomo sapiensgeneUnigene Hs.154672; methylenetetrahydrofolate
dehydrogenase 2 (MTHFD2) 16ggggcctgcc acgaggccgc agtataaccg
cgtggcccgc gcgcgcgctt ccctcccggc 60gcagtcaccg gcgcggtcta tggctgcgac
ttctctaatg tctgctttgg ctgcccggct 120gctgcagccc gcgcacagct gctcccttcg
ccttcgccct ttccacctcg cggcagttcg 180aaatgaagct gttgtcattt ctggaaggaa
actggcccag cagatcaagc aggaagtgcg 240gcaggaggta gaagagtggg tggcctcagg
caacaaacgg ccacacctga gtgtgatcct 300ggttggcgag aatcctgcaa gtcactccta
tgtcctcaac aaaaccaggg cagctgcagt 360tgtgggaatc aacagtgaga caattatgaa
accagcttca atttcagagg aagaattgtt 420gaatttaatc aataaactga ataatgatga
taatgtagat ggcctccttg ttcagttgcc 480tcttccagag catattgatg agagaaggat
ctgcaatgct gtttctccag acaaggatgt 540tgatggcttt catgtaatta atgtaggacg
aatgtgtttg gatcagtatt ccatgttacc 600ggctactcca tggggtgtgt gggaaataat
caagcgaact ggcattccaa ccctagggaa 660gaatgtggtt gtggctggaa ggtcaaaaaa
cgttggaatg cccattgcaa tgttactgca 720cacagatggg gcgcatgaac gtcccggagg
tgatgccact gttacaatat ctcatcgata 780tactcccaaa gagcagttga agaaacatac
aattcttgca gatattgtaa tatctgctgc 840aggtattcca aatctgatca cagcagatat
gatcaaggaa ggagcagcag tcattgatgt 900gggaataaat agagttcacg atcctgtaac
tgccaaaccc aagttggttg gagatgtgga 960ttttgaagga gtcagacaaa aagctgggta
tatcactcca gttcctggag gtgttggccc 1020catgacagtg gcaatgctaa tgaagaatac
cattattgct gcaaaaaagg tgctgaggct 1080tgaagagcga gaagtgctga agtctaaaga
gcttggggta gccactaatt aactactgtg 1140tcttctgtgt cacaaacagc actccaggcc
agctcaagaa gcaaagcagg ccaatagaaa 1200tgcaatattt ttaatttatt ctactgaaat
ggtttaaaat gatgccttgt atttattgaa 1260agcttaaatg ggtgggtgtt tctgcacata
cctctgcagt acctcaccag ggagcattcc 1320agtatcatgc agggtcctgt gatctagcca
ggagcagcca ttaacctagt gattaatatg 1380ggagacatta ccatatggag gatggatgct
tcactttgtc aagcacctca gttacacatt 1440cgccttttct aggattgcat ttcccaagtg
ctattgcaat aacagttgat actcatttta 1500ggtaccaaac cttttgagtt caactgatca
aaccaaagga aaagtgttgc tagagaaaat 1560tagggaaaag gtgaaaaaga aaaaatggta
gtaattgagc agaaaaaaat taatttatat 1620atgtattgat tggcaaccag atttatctaa
gtagaactga attggctagg aaaaaagaaa 1680aactgcatgt taatcatttt cctaagctgt
ccttttgagg cttagtcagt ttattgggaa 1740aatgtttagg attattcctt gctattagta
ctcattttat gtatgttacc cttcagtaag 1800ttctccccat tttagttttc taggactgaa
aggattcttt tctacattat acatgtgtgt 1860tgtcatattt ggcttttgct atatacttta
acttcattgt taaatttttg tattgtatag 1920tttctttggt gtatcttaaa acctattttt
gaaaaacaaa cttggcttga taatcatttg 1980ggcagcttgg gtaagtacgc aacttacttt
tccaccaaag aactgtcagc agctgcctgc 2040ttttctgtga tgtatgtatc ctgttgactt
ttccagaaat tttttaagag tttgagttac 2100tattgaattt aatcagactt tctgattaaa
gggttttctt tcttttttaa taaaacacat 2160ctgtctggta tggtatgaat ttctgaaaaa
aaaaaaaaaa aaaaaaaa 2208172525DNAHomo sapiensgeneUnigene Hs.18910;
solute carrier family 43, member 1 (SLC43A1) 17gcttcgcaga cctctggcgc
ccggcgggtt cccagttccc ccgcttcttc cgaggagaca 60gcggaggcga ggccaccggg
ctgtcaggct gaagctccgt ggcggccggg tcctgcacgc 120agagaagacc ccagcgccgg
cgcggctcag ggctgggccc acgggactcc ggacgcgccg 180cgaaagcgtt gcgctcccgg
aggcgtccgc agctgctggc tgctcatttg ccggtgaccg 240gaggctcggg gccagcatgg
cccccacgct gcaacaggcg taccggaggc gctggtggat 300ggcctgcacg gctgtgctgg
agaacctctt cttctctgct gtactcctgg gctggggctc 360cctgttgatc attctgaaga
acgagggctt ctattccagc acgtgcccag ctgagagcag 420caccaacacc acccaggatg
agcagcgcag gtggccaggc tgtgaccagc aggacgagat 480gctcaacctg ggcttcacca
ttggttcctt cgtgctcagc gccaccaccc tgccactggg 540gatcctcatg gaccgctttg
gcccccgacc cgtgcggctg gttggcagtg cctgcttcac 600tgcgtcctgc accctcatgg
ccctggcctc ccgggacgtg gaagctctgt ctccgttgat 660attcctggcg ctgtccctga
atggctttgg tggcatctgc ctaacgttca cttcactcac 720gctgcccaac atgtttggga
acctgcgctc cacgttaatg gccctcatga ttggctctta 780cgcctcttct gccattacgt
tcccaggaat caagctgatc tacgatgccg gtgtggcctt 840cgtggtcatc atgttcacct
ggtctggcct ggcctgcctt atctttctga actgcaccct 900caactggccc atcgaagcct
ttcctgcccc tgaggaagtc aattacacga agaagatcaa 960gctgagtggg ctggccctgg
accacaaggt gacaggtgac ctcttctaca cccatgtgac 1020caccatgggc cagaggctca
gccagaaggc ccccagcctg gaggacggtt cggatgcctt 1080catgtcaccc caggatgttc
ggggcacctc agaaaacctt cctgagaggt ctgtcccctt 1140acgcaagagc ctctgctccc
ccactttcct gtggagcctc ctcaccatgg gcatgaccca 1200gctgcggatc atcttctaca
tggctgctgt gaacaagatg ctggagtacc ttgtgactgg 1260tggccaggag catgagacaa
atgaacagca acaaaaggtg gcagagacag ttgggttcta 1320ctcctccgtc ttcggggcca
tgcagctgtt gtgccttctc acctgccccc tcattggcta 1380catcatggac tggcggatca
aggactgcgt ggacgcccca actcagggca ctgtcctcgg 1440agatgccagg gacggggttg
ctaccaaatc catcagacca cgctactgca agatccaaaa 1500gctcaccaat gccatcagtg
ccttcaccct gaccaacctg ctgcttgtgg gttttggcat 1560cacctgtctc atcaacaact
tacacctcca gtttgtgacc tttgtcctgc acaccattgt 1620tcgaggtttc ttccactcag
cctgtgggag tctctatgct gcagtgttcc catccaacca 1680ctttgggacg ctgacaggcc
tgcagtccct catcagtgct gtgttcgcct tgcttcagca 1740gccacttttc atggcgatgg
tgggacccct gaaaggagag cccttctggg tgaatctggg 1800cctcctgcta ttctcactcc
tgggattcct gttgccttcc tacctcttct attaccgtgc 1860ccggctccag caggagtacg
ccgccaatgg gatgggccca ctgaaggtgc ttagcggctc 1920tgaggtgacc gcatagactt
ctcagaccaa gggacctgga tgacaggcaa tcaaggcctg 1980agcaaccaaa aggagtgccc
catatggctt ttctacctgt aacatgcaca tagagccatg 2040gccgtagatt tataaatacc
aagagaagtt ctatttttgt aaagactgca aaaaggagga 2100aaaaaaacct tcaaaaacgc
cccctaagtc aacgctccat tgactgaaga cagtccctat 2160cctagagggg ttgagctttc
ttcctccttg ggttggagga gaccagggtg cctcttatct 2220ccttctagcg gtctgcctcc
tggtacctct tggggggatc ggcaaacagg ctacccctga 2280ggtcccatgt gccatgagtg
tgcacacatg catgtgtctg tgtatgtgtg aatgtgagag 2340agacacagcc ctcctttcag
aaggaaaggg gcctgaggtg ccagctgtgt cctgggttag 2400gggttggggg tcggcccctt
ccagggccag gagggcaggt tccctctctg gtgctgctgc 2460ttgcaagtct tagaggaaat
aaaaagggaa gtgagagaaa aaaaaaaaaa aaaaaaaaaa 2520aaaaa
2525181052DNAHomo sapiensgeneUnigene
Hs.109059; mitochondrial ribosomal protein L12 (MRPL12) 18gctcgaatgc
ccggcagccg tggcggctag agcgttcctc cccagctcga atgcccggcg 60gccgaggcgg
ctagagcgtc gcctcctccc ggggaaccgc gtgtgacctt ccagcccgcg 120gaccgatgct
gccggcggcc gctcgccccc tgtgggggcc ttgccttggg cttcgggccg 180ctgcgttccg
ccttgccagg cgacaggtgc catgtgtctg tgccgtgcga catatgagga 240gcagcggcca
tcagaggtgt gaggccctcg ctggtgcacc cctggataac gcccccaagg 300agtacccccc
caagatacag cagctggtcc aggacatcgc cagcctcact ctcttggaaa 360tctcagacct
caacgagctc ctgaagaaaa cgttgaagat ccaggatgtc gggcttgtgc 420cgatgggtgg
tgtgatgtct ggggctgtcc ctgctgcagc agcccaggag gcggtggaag 480aagatatccc
catagcgaaa gaacggacac atttcaccgt ccgcctgacc gaggcgaagc 540ccgtggacaa
agtgaagctg atcaaggaaa tcaagaacta catccaaggc atcaacctcg 600tccaggcaaa
gaagctggtg gagtccctgc cccaggaaat caaagccaat gtcgccaaag 660ctgaggcgga
gaagatcaag gcggccctgg aggcggtggg cggcaccgtg gttctggagt 720agcctccagc
tcggaggact tgtgttcagg ggtcctgggc cccgggcgag gtcccgccct 780cccgtggtca
ctggctccgc ccccagcacc aggcgcccag tggagccgtt tgggagaatt 840gcctgcgcca
cgcagcgggg ccggacaggc cgcacagacc tactgtggcg ggagggaggg 900gcggctgctg
cctggtgacg gcacccggag gcccaccagg acgcgccacc ggtgaatgtg 960cctctggtgg
ctgctgagaa aaatacactg tgcagctcag aaaaaaaaaa aaaaaaaaaa 1020aaaaaaaaaa
aaaaaaaaaa aaaaaaaaaa aa 105219596PRTHomo sapiensPDZ &
LIM domain 5 (PDLIM5), transcript variant 1 DKFZp564A072 19Met Ser
Asn Tyr Ser Val Ser Leu Val Gly Pro Ala Pro Trp Gly Phe1 5
10 15Arg Leu Gln Gly Gly Lys Asp Phe
Asn Met Pro Leu Thr Ile Ser Ser 20 25
30Leu Lys Asp Gly Gly Lys Ala Ala Gln Ala Asn Val Arg Ile Gly
Asp 35 40 45Val Val Leu Ser Ile
Asp Gly Ile Asn Ala Gln Gly Met Thr His Leu 50 55
60Glu Ala Gln Asn Lys Ile Lys Gly Cys Thr Gly Ser Leu Asn
Met Thr65 70 75 80Leu
Gln Arg Ala Ser Ala Ala Pro Lys Pro Glu Pro Val Pro Val Gln
85 90 95Lys Gly Glu Pro Lys Glu Val
Val Lys Pro Val Pro Ile Thr Ser Pro 100 105
110Ala Val Ser Lys Val Thr Ser Thr Asn Asn Met Ala Tyr Asn
Lys Ala 115 120 125Pro Arg Pro Phe
Gly Ser Val Ser Ser Pro Lys Val Thr Ser Ile Pro 130
135 140Ser Pro Ser Ser Ala Phe Thr Pro Ala His Ala Thr
Thr Ser Ser His145 150 155
160Ala Ser Pro Ser Pro Val Ala Ala Val Thr Pro Pro Leu Phe Ala Ala
165 170 175Ser Gly Leu His Ala
Asn Ala Asn Leu Ser Ala Asp Gln Ser Pro Ser 180
185 190Ala Leu Ser Ala Gly Lys Thr Ala Val Asn Val Pro
Arg Gln Pro Thr 195 200 205Val Thr
Ser Val Cys Ser Glu Thr Ser Gln Glu Leu Ala Glu Gly Gln 210
215 220Arg Arg Gly Ser Gln Gly Asp Ser Lys Gln Gln
Asn Gly Pro Pro Arg225 230 235
240Lys His Ile Val Glu Arg Tyr Thr Glu Phe Tyr His Val Pro Thr His
245 250 255Ser Asp Ala Ser
Lys Lys Arg Leu Ile Glu Asp Thr Glu Asp Trp Arg 260
265 270Pro Arg Thr Gly Thr Thr Gln Ser Arg Ser Phe
Arg Ile Leu Ala Gln 275 280 285Ile
Thr Gly Thr Glu His Leu Lys Glu Ser Glu Ala Asp Asn Thr Lys 290
295 300Lys Ala Asn Asn Ser Gln Glu Pro Ser Pro
Gln Leu Ala Ser Ser Val305 310 315
320Ala Ser Thr Arg Ser Met Pro Glu Ser Leu Asp Ser Pro Thr Ser
Gly 325 330 335Arg Pro Gly
Val Thr Ser Leu Thr Thr Ala Ala Ala Phe Lys Pro Val 340
345 350Gly Ser Thr Gly Val Ile Lys Ser Pro Ser
Trp Gln Arg Pro Asn Gln 355 360
365Gly Val Pro Ser Thr Gly Arg Ile Ser Asn Ser Ala Thr Tyr Ser Gly 370
375 380Ser Val Ala Pro Ala Asn Ser Ala
Leu Gly Gln Thr Gln Pro Ser Asp385 390
395 400Gln Asp Thr Leu Val Gln Arg Ala Glu His Ile Pro
Ala Gly Lys Arg 405 410
415Thr Pro Met Cys Ala His Cys Asn Gln Val Ile Arg Gly Pro Phe Leu
420 425 430Val Ala Leu Gly Lys Ser
Trp His Pro Glu Glu Phe Asn Cys Ala His 435 440
445Cys Lys Asn Thr Met Ala Tyr Ile Gly Phe Val Glu Glu Lys
Gly Ala 450 455 460Leu Tyr Cys Glu Leu
Cys Tyr Glu Lys Phe Phe Ala Pro Glu Cys Gly465 470
475 480Arg Cys Gln Arg Lys Ile Leu Gly Glu Val
Ile Asn Ala Leu Lys Gln 485 490
495Thr Trp His Val Ser Cys Phe Val Cys Val Ala Cys Gly Lys Pro Ile
500 505 510Arg Asn Asn Val Phe
His Leu Glu Asp Gly Glu Pro Tyr Cys Glu Thr 515
520 525Asp Tyr Tyr Ala Leu Phe Gly Thr Ile Cys His Gly
Cys Glu Phe Pro 530 535 540Ile Glu Ala
Gly Asp Met Phe Leu Glu Ala Leu Gly Tyr Thr Trp His545
550 555 560Asp Thr Cys Phe Val Cys Ser
Val Cys Cys Glu Ser Leu Glu Gly Gln 565
570 575Thr Phe Phe Ser Lys Lys Asp Lys Pro Leu Cys Lys
Lys His Ala His 580 585 590Ser
Val Asn Phe 59520505PRTHomo sapiensAgX-1 antigen [Homo sapiens]
20Met Asn Ile Asn Asp Leu Lys Leu Thr Leu Ser Lys Ala Gly Gln Glu1
5 10 15His Leu Leu Arg Phe Trp
Asn Glu Leu Glu Glu Ala Gln Gln Val Glu 20 25
30Leu Tyr Ala Glu Leu Gln Ala Met Asn Phe Glu Glu Leu
Asn Phe Phe 35 40 45Phe Gln Lys
Ala Ile Glu Gly Phe Asn Gln Ser Ser His Gln Lys Asn 50
55 60Val Asp Ala Arg Met Glu Pro Val Pro Arg Glu Val
Leu Gly Ser Ala65 70 75
80Thr Arg Asp Gln Asp Gln Leu Gln Ala Trp Glu Ser Glu Gly Leu Phe
85 90 95Gln Ile Ser Gln Asn Lys
Val Ala Val Leu Leu Leu Ala Gly Gly Gln 100
105 110Gly Thr Arg Leu Gly Val Ala Tyr Pro Lys Gly Met
Tyr Asp Val Gly 115 120 125Leu Pro
Ser Arg Lys Thr Leu Phe Gln Ile Gln Ala Glu Arg Ile Leu 130
135 140Lys Leu Gln Gln Val Ala Glu Lys Tyr Tyr Gly
Asn Lys Cys Ile Ile145 150 155
160Pro Trp Tyr Ile Met Thr Ser Gly Arg Thr Met Glu Ser Thr Lys Glu
165 170 175Phe Phe Thr Lys
His Lys Tyr Phe Gly Leu Lys Lys Glu Asn Val Ile 180
185 190Phe Phe Gln Gln Gly Met Leu Pro Ala Met Ser
Phe Asp Gly Lys Ile 195 200 205Ile
Leu Glu Glu Lys Asn Lys Val Ser Met Ala Pro Asp Gly Asn Gly 210
215 220Gly Leu Tyr Arg Ala Leu Ala Ala Gln Asn
Ile Val Glu Asp Met Glu225 230 235
240Gln Arg Gly Ile Trp Ser Ile His Val Tyr Cys Val Asp Asn Ile
Leu 245 250 255Val Lys Val
Ala Asp Pro Arg Phe Ile Gly Phe Cys Ile Gln Lys Gly 260
265 270Ala Asp Cys Gly Ala Lys Val Val Glu Lys
Thr Asn Pro Thr Glu Pro 275 280
285Val Gly Val Val Cys Arg Val Asp Gly Val Tyr Gln Val Val Glu Tyr 290
295 300Ser Glu Ile Ser Leu Ala Thr Ala
Gln Lys Arg Ser Ser Asp Gly Arg305 310
315 320Leu Leu Phe Asn Ala Gly Asn Ile Ala Asn His Phe
Phe Thr Val Pro 325 330
335Phe Leu Arg Asp Val Val Asn Val Tyr Glu Pro Gln Leu Gln His His
340 345 350Val Ala Gln Lys Lys Ile
Pro Tyr Val Asp Thr Gln Gly Gln Leu Ile 355 360
365Lys Pro Asp Lys Pro Asn Gly Ile Lys Met Glu Lys Phe Val
Phe Asp 370 375 380Ile Phe Gln Phe Ala
Lys Lys Phe Val Val Tyr Glu Val Leu Arg Glu385 390
395 400Asp Glu Phe Ser Pro Leu Lys Asn Ala Asp
Ser Gln Asn Gly Lys Asp 405 410
415Asn Pro Thr Thr Ala Arg His Ala Leu Met Ser Leu His His Cys Trp
420 425 430Val Leu Asn Ala Gly
Gly His Phe Ile Asp Glu Asn Ser Ser Arg Leu 435
440 445Pro Ala Ile Pro Arg Leu Lys Asp Ala Asn Asp Val
Pro Ile Gln Cys 450 455 460Glu Ile Ser
Pro Leu Ile Ser Tyr Ala Gly Glu Gly Leu Glu Ser Tyr465
470 475 480Val Ala Asp Lys Glu Phe His
Ala Pro Leu Ile Ile Asp Glu Asn Gly 485
490 495Val His Glu Leu Val Lys Asn Gly Ile 500
50521573PRTHomo sapienschaperonin [Homo sapiens] 21Met
Leu Arg Leu Pro Thr Val Phe Arg Gln Met Arg Pro Val Ser Arg1
5 10 15Val Leu Ala Pro His Leu Thr
Arg Ala Tyr Ala Lys Asp Val Lys Phe 20 25
30Gly Ala Asp Ala Arg Ala Leu Met Leu Gln Gly Val Asp Leu
Leu Ala 35 40 45Asp Ala Val Ala
Val Thr Met Gly Pro Lys Gly Arg Thr Val Ile Ile 50 55
60Glu Gln Ser Trp Gly Ser Pro Lys Val Thr Lys Asp Gly
Val Thr Val65 70 75
80Ala Lys Ser Ile Asp Leu Lys Asp Lys Tyr Lys Asn Ile Gly Ala Lys
85 90 95Leu Val Gln Asp Val Ala
Asn Asn Thr Asn Glu Glu Ala Gly Asp Gly 100
105 110Thr Thr Thr Ala Thr Val Leu Ala Arg Ser Ile Ala
Lys Glu Gly Phe 115 120 125Glu Lys
Ile Ser Lys Gly Ala Asn Pro Val Glu Ile Arg Arg Gly Val 130
135 140Met Leu Ala Val Asp Ala Val Ile Ala Glu Leu
Lys Lys Gln Ser Lys145 150 155
160Pro Val Thr Thr Pro Glu Glu Ile Ala Gln Val Ala Thr Ile Ser Ala
165 170 175Asn Gly Asp Lys
Glu Ile Gly Asn Ile Ile Ser Asp Ala Met Lys Lys 180
185 190Val Gly Arg Lys Gly Val Ile Thr Val Lys Asp
Gly Lys Thr Leu Asn 195 200 205Asp
Glu Leu Glu Ile Ile Glu Gly Met Lys Phe Asp Arg Gly Tyr Ile 210
215 220Ser Pro Tyr Phe Ile Asn Thr Ser Lys Gly
Gln Lys Cys Glu Phe Gln225 230 235
240Asp Ala Tyr Val Leu Leu Ser Glu Lys Lys Ile Ser Ser Ile Gln
Ser 245 250 255Ile Val Pro
Ala Leu Glu Ile Ala Asn Ala His Arg Lys Pro Leu Val 260
265 270Ile Ile Ala Glu Asp Val Asp Gly Glu Ala
Leu Ser Thr Leu Val Leu 275 280
285Asn Arg Leu Lys Val Gly Leu Gln Val Val Ala Val Lys Ala Pro Gly 290
295 300Phe Gly Asp Asn Arg Lys Asn Gln
Leu Lys Asp Met Ala Ile Ala Thr305 310
315 320Gly Gly Ala Val Phe Gly Glu Glu Gly Leu Thr Leu
Asn Leu Glu Asp 325 330
335Val Gln Pro His Asp Leu Gly Lys Val Gly Glu Val Ile Val Thr Lys
340 345 350Asp Asp Ala Met Leu Leu
Lys Gly Lys Gly Asp Lys Ala Gln Ile Glu 355 360
365Lys Arg Ile Gln Glu Ile Ile Glu Gln Leu Asp Val Thr Thr
Ser Glu 370 375 380Tyr Glu Lys Glu Lys
Leu Asn Glu Arg Leu Ala Lys Leu Ser Asp Gly385 390
395 400Val Ala Val Leu Lys Val Gly Gly Thr Ser
Asp Val Glu Val Asn Glu 405 410
415Lys Lys Asp Arg Val Thr Asp Ala Leu Asn Ala Thr Arg Ala Ala Val
420 425 430Glu Glu Gly Ile Val
Leu Gly Gly Gly Cys Ala Leu Leu Arg Cys Ile 435
440 445Pro Ala Leu Asp Ser Leu Thr Pro Ala Asn Glu Asp
Gln Lys Ile Gly 450 455 460Ile Glu Ile
Ile Lys Arg Thr Leu Lys Ile Pro Ala Met Thr Ile Ala465
470 475 480Lys Asn Ala Gly Val Glu Gly
Ser Leu Ile Val Glu Lys Ile Met Gln 485
490 495Ser Ser Ser Glu Val Gly Tyr Asp Ala Met Ala Gly
Asp Phe Val Asn 500 505 510Met
Val Glu Lys Gly Ile Ile Asp Pro Thr Lys Val Val Arg Thr Ala 515
520 525Leu Leu Asp Ala Ala Gly Val Ala Ser
Leu Leu Thr Thr Ala Glu Val 530 535
540Val Val Thr Glu Ile Pro Lys Glu Glu Lys Asp Pro Gly Met Gly Ala545
550 555 560Met Gly Gly Met
Gly Gly Gly Met Gly Gly Gly Met Phe 565
570222224PRTHomo sapienscoagulation factor V precursor [Homo sapiens]
22Met Phe Pro Gly Cys Pro Arg Leu Trp Val Leu Val Val Leu Gly Thr1
5 10 15Ser Trp Val Gly Trp Gly
Ser Gln Gly Thr Glu Ala Ala Gln Leu Arg 20 25
30Gln Phe Tyr Val Ala Ala Gln Gly Ile Ser Trp Ser Tyr
Arg Pro Glu 35 40 45Pro Thr Asn
Ser Ser Leu Asn Leu Ser Val Thr Ser Phe Lys Lys Ile 50
55 60Val Tyr Arg Glu Tyr Glu Pro Tyr Phe Lys Lys Glu
Lys Pro Gln Ser65 70 75
80Thr Ile Ser Gly Leu Leu Gly Pro Thr Leu Tyr Ala Glu Val Gly Asp
85 90 95Ile Ile Lys Val His Phe
Lys Asn Lys Ala Asp Lys Pro Leu Ser Ile 100
105 110His Pro Gln Gly Ile Arg Tyr Ser Lys Leu Ser Glu
Gly Ala Ser Tyr 115 120 125Leu Asp
His Thr Phe Pro Ala Glu Lys Met Asp Asp Ala Val Ala Pro 130
135 140Gly Arg Glu Tyr Thr Tyr Glu Trp Ser Ile Ser
Glu Asp Ser Gly Pro145 150 155
160Thr His Asp Asp Pro Pro Cys Leu Thr His Ile Tyr Tyr Ser His Glu
165 170 175Asn Leu Ile Glu
Asp Phe Asn Ser Gly Leu Ile Gly Pro Leu Leu Ile 180
185 190Cys Lys Lys Gly Thr Leu Thr Glu Gly Gly Thr
Gln Lys Thr Phe Asp 195 200 205Lys
Gln Ile Val Leu Leu Phe Ala Val Phe Asp Glu Ser Lys Ser Trp 210
215 220Ser Gln Ser Ser Ser Leu Met Tyr Thr Val
Asn Gly Tyr Val Asn Gly225 230 235
240Thr Met Pro Asp Ile Thr Val Cys Ala His Asp His Ile Ser Trp
His 245 250 255Leu Leu Gly
Met Ser Ser Gly Pro Glu Leu Phe Ser Ile His Phe Asn 260
265 270Gly Gln Val Leu Glu Gln Asn His His Lys
Val Ser Ala Ile Thr Leu 275 280
285Val Ser Ala Thr Ser Thr Thr Ala Asn Met Thr Val Gly Pro Glu Gly 290
295 300Lys Trp Ile Ile Ser Ser Leu Thr
Pro Lys His Leu Gln Ala Gly Met305 310
315 320Gln Ala Tyr Ile Asp Ile Lys Asn Cys Pro Lys Lys
Thr Arg Asn Leu 325 330
335Lys Lys Ile Thr Arg Glu Gln Arg Arg His Met Lys Arg Trp Glu Tyr
340 345 350Phe Ile Ala Ala Glu Glu
Val Ile Trp Asp Tyr Ala Pro Val Ile Pro 355 360
365Ala Asn Met Asp Lys Lys Tyr Arg Ser Gln His Leu Asp Asn
Phe Ser 370 375 380Asn Gln Ile Gly Lys
His Tyr Lys Lys Val Met Tyr Thr Gln Tyr Glu385 390
395 400Asp Glu Ser Phe Thr Lys His Thr Val Asn
Pro Asn Met Lys Glu Asp 405 410
415Gly Ile Leu Gly Pro Ile Ile Arg Ala Gln Val Arg Asp Thr Leu Lys
420 425 430Ile Val Phe Lys Asn
Met Ala Ser Arg Pro Tyr Ser Ile Tyr Pro His 435
440 445Gly Val Thr Phe Ser Pro Tyr Glu Asp Glu Val Asn
Ser Ser Phe Thr 450 455 460Ser Gly Arg
Asn Asn Thr Met Ile Arg Ala Val Gln Pro Gly Glu Thr465
470 475 480Tyr Thr Tyr Lys Trp Asn Ile
Leu Glu Phe Asp Glu Pro Thr Glu Asn 485
490 495Asp Ala Gln Cys Leu Thr Arg Pro Tyr Tyr Ser Asp
Val Asp Ile Met 500 505 510Arg
Asp Ile Ala Ser Gly Leu Ile Gly Leu Leu Leu Ile Cys Lys Ser 515
520 525Arg Ser Leu Asp Arg Arg Gly Ile Gln
Arg Ala Ala Asp Ile Glu Gln 530 535
540Gln Ala Val Phe Ala Val Phe Asp Glu Asn Lys Ser Trp Tyr Leu Glu545
550 555 560Asp Asn Ile Asn
Lys Phe Cys Glu Asn Pro Asp Glu Val Lys Arg Asp 565
570 575Asp Pro Lys Phe Tyr Glu Ser Asn Ile Met
Ser Thr Ile Asn Gly Tyr 580 585
590Val Pro Glu Ser Ile Thr Thr Leu Gly Phe Cys Phe Asp Asp Thr Val
595 600 605Gln Trp His Phe Cys Ser Val
Gly Thr Gln Asn Glu Ile Leu Thr Ile 610 615
620His Phe Thr Gly His Ser Phe Ile Tyr Gly Lys Arg His Glu Asp
Thr625 630 635 640Leu Thr
Leu Phe Pro Met Arg Gly Glu Ser Val Thr Val Thr Met Asp
645 650 655Asn Val Gly Thr Trp Met Leu
Thr Ser Met Asn Ser Ser Pro Arg Ser 660 665
670Lys Lys Leu Arg Leu Lys Phe Arg Asp Val Lys Cys Ile Pro
Asp Asp 675 680 685Asp Glu Asp Ser
Tyr Glu Ile Phe Glu Pro Pro Glu Ser Thr Val Met 690
695 700Ala Thr Arg Lys Met His Asp Arg Leu Glu Pro Glu
Asp Glu Glu Ser705 710 715
720Asp Ala Asp Tyr Asp Tyr Gln Asn Arg Leu Ala Ala Ala Leu Gly Ile
725 730 735Arg Ser Phe Arg Asn
Ser Ser Leu Asn Gln Glu Glu Glu Glu Phe Asn 740
745 750Leu Thr Ala Leu Ala Leu Glu Asn Gly Thr Glu Phe
Val Ser Ser Asn 755 760 765Thr Asp
Ile Ile Val Gly Ser Asn Tyr Ser Ser Pro Ser Asn Ile Ser 770
775 780Lys Phe Thr Val Asn Asn Leu Ala Glu Pro Gln
Lys Ala Pro Ser His785 790 795
800Gln Gln Ala Thr Thr Ala Gly Ser Pro Leu Arg His Leu Ile Gly Lys
805 810 815Asn Ser Val Leu
Asn Ser Ser Thr Ala Glu His Ser Ser Pro Tyr Ser 820
825 830Glu Asp Pro Ile Glu Asp Pro Leu Gln Pro Asp
Val Thr Gly Ile Arg 835 840 845Leu
Leu Ser Leu Gly Ala Gly Glu Phe Lys Ser Gln Glu His Ala Lys 850
855 860His Lys Gly Pro Lys Val Glu Arg Asp Gln
Ala Ala Lys His Arg Phe865 870 875
880Ser Trp Met Lys Leu Leu Ala His Lys Val Gly Arg His Leu Ser
Gln 885 890 895Asp Thr Gly
Ser Pro Ser Gly Met Arg Pro Trp Glu Asp Leu Pro Ser 900
905 910Gln Asp Thr Gly Ser Pro Ser Arg Met Arg
Pro Trp Lys Asp Pro Pro 915 920
925Ser Asp Leu Leu Leu Leu Lys Gln Ser Asn Ser Ser Lys Ile Leu Val 930
935 940Gly Arg Trp His Leu Ala Ser Glu
Lys Gly Ser Tyr Glu Ile Ile Gln945 950
955 960Asp Thr Asp Glu Asp Thr Ala Val Asn Asn Trp Leu
Ile Ser Pro Gln 965 970
975Asn Ala Ser Arg Ala Trp Gly Glu Ser Thr Pro Leu Ala Asn Lys Pro
980 985 990Gly Lys Gln Ser Gly His
Pro Lys Phe Pro Arg Val Arg His Lys Ser 995 1000
1005Leu Gln Val Arg Gln Asp Gly Gly Lys Ser Arg Leu
Lys Lys Ser 1010 1015 1020Gln Phe Leu
Ile Lys Thr Arg Lys Lys Lys Lys Glu Lys His Thr 1025
1030 1035His His Ala Pro Leu Ser Pro Arg Thr Phe His
Pro Leu Arg Ser 1040 1045 1050Glu Ala
Tyr Asn Thr Phe Ser Glu Arg Arg Leu Lys His Ser Leu 1055
1060 1065Val Leu His Lys Ser Asn Glu Thr Ser Leu
Pro Thr Asp Leu Asn 1070 1075 1080Gln
Thr Leu Pro Ser Met Asp Phe Gly Trp Ile Ala Ser Leu Pro 1085
1090 1095Asp His Asn Gln Asn Ser Ser Asn Asp
Thr Gly Gln Ala Ser Cys 1100 1105
1110Pro Pro Gly Leu Tyr Gln Thr Val Pro Pro Glu Glu His Tyr Gln
1115 1120 1125Thr Phe Pro Ile Gln Asp
Pro Asp Gln Met His Ser Thr Ser Asp 1130 1135
1140Pro Ser His Arg Ser Ser Ser Pro Glu Leu Ser Glu Met Leu
Glu 1145 1150 1155Tyr Asp Arg Ser His
Lys Ser Phe Pro Thr Asp Ile Ser Gln Met 1160 1165
1170Ser Pro Ser Ser Glu His Glu Val Trp Gln Thr Val Ile
Ser Pro 1175 1180 1185Asp Leu Ser Gln
Val Thr Leu Ser Pro Glu Leu Ser Gln Thr Asn 1190
1195 1200Leu Ser Pro Asp Leu Ser His Thr Thr Leu Ser
Pro Glu Leu Ile 1205 1210 1215Gln Arg
Asn Leu Ser Pro Ala Leu Gly Gln Met Pro Ile Ser Pro 1220
1225 1230Asp Leu Ser His Thr Thr Leu Ser Pro Asp
Leu Ser His Thr Thr 1235 1240 1245Leu
Ser Leu Asp Leu Ser Gln Thr Asn Leu Ser Pro Glu Leu Ser 1250
1255 1260Gln Thr Asn Leu Ser Pro Ala Leu Gly
Gln Met Pro Leu Ser Pro 1265 1270
1275Asp Leu Ser His Thr Thr Leu Ser Leu Asp Phe Ser Gln Thr Asn
1280 1285 1290Leu Ser Pro Glu Leu Ser
His Met Thr Leu Ser Pro Glu Leu Ser 1295 1300
1305Gln Thr Asn Leu Ser Pro Ala Leu Gly Gln Met Pro Ile Ser
Pro 1310 1315 1320Asp Leu Ser His Thr
Thr Leu Ser Leu Asp Phe Ser Gln Thr Asn 1325 1330
1335Leu Ser Pro Glu Leu Ser Gln Thr Asn Leu Ser Pro Ala
Leu Gly 1340 1345 1350Gln Met Pro Leu
Ser Pro Asp Pro Ser His Thr Thr Leu Ser Leu 1355
1360 1365Asp Leu Ser Gln Thr Asn Leu Ser Pro Glu Leu
Ser Gln Thr Asn 1370 1375 1380Leu Ser
Pro Asp Leu Ser Glu Met Pro Leu Phe Ala Asp Leu Ser 1385
1390 1395Gln Ile Pro Leu Thr Pro Asp Leu Asp Gln
Met Thr Leu Ser Pro 1400 1405 1410Asp
Leu Gly Glu Thr Asp Leu Ser Pro Asn Phe Gly Gln Met Ser 1415
1420 1425Leu Ser Pro Asp Leu Ser Gln Val Thr
Leu Ser Pro Asp Ile Ser 1430 1435
1440Asp Thr Thr Leu Leu Pro Asp Leu Ser Gln Ile Ser Pro Pro Pro
1445 1450 1455Asp Leu Asp Gln Ile Phe
Tyr Pro Ser Glu Ser Ser Gln Ser Leu 1460 1465
1470Leu Leu Gln Glu Phe Asn Glu Ser Phe Pro Tyr Pro Asp Leu
Gly 1475 1480 1485Gln Met Pro Ser Pro
Ser Ser Pro Thr Leu Asn Asp Thr Phe Leu 1490 1495
1500Ser Lys Glu Phe Asn Pro Leu Val Ile Val Gly Leu Ser
Lys Asp 1505 1510 1515Gly Thr Asp Tyr
Ile Glu Ile Ile Pro Lys Glu Glu Val Gln Ser 1520
1525 1530Ser Glu Asp Asp Tyr Ala Glu Ile Asp Tyr Val
Pro Tyr Asp Asp 1535 1540 1545Pro Tyr
Lys Thr Asp Val Arg Thr Asn Ile Asn Ser Ser Arg Asp 1550
1555 1560Pro Asp Asn Ile Ala Ala Trp Tyr Leu Arg
Ser Asn Asn Gly Asn 1565 1570 1575Arg
Arg Asn Tyr Tyr Ile Ala Ala Glu Glu Ile Ser Trp Asp Tyr 1580
1585 1590Ser Glu Phe Val Gln Arg Glu Thr Asp
Ile Glu Asp Ser Asp Asp 1595 1600
1605Ile Pro Glu Asp Thr Thr Tyr Lys Lys Val Val Phe Arg Lys Tyr
1610 1615 1620Leu Asp Ser Thr Phe Thr
Lys Arg Asp Pro Arg Gly Glu Tyr Glu 1625 1630
1635Glu His Leu Gly Ile Leu Gly Pro Ile Ile Arg Ala Glu Val
Asp 1640 1645 1650Asp Val Ile Gln Val
Arg Phe Lys Asn Leu Ala Ser Arg Pro Tyr 1655 1660
1665Ser Leu His Ala His Gly Leu Ser Tyr Glu Lys Ser Ser
Glu Gly 1670 1675 1680Lys Thr Tyr Glu
Asp Asp Ser Pro Glu Trp Phe Lys Glu Asp Asn 1685
1690 1695Ala Val Gln Pro Asn Ser Ser Tyr Thr Tyr Val
Trp His Ala Thr 1700 1705 1710Glu Arg
Ser Gly Pro Glu Ser Pro Gly Ser Ala Cys Arg Ala Trp 1715
1720 1725Ala Tyr Tyr Ser Ala Val Asn Pro Glu Lys
Asp Ile His Ser Gly 1730 1735 1740Leu
Ile Gly Pro Leu Leu Ile Cys Gln Lys Gly Ile Leu His Lys 1745
1750 1755Asp Ser Asn Met Pro Met Asp Met Arg
Glu Phe Val Leu Leu Phe 1760 1765
1770Met Thr Phe Asp Glu Lys Lys Ser Trp Tyr Tyr Glu Lys Lys Ser
1775 1780 1785Arg Ser Ser Trp Arg Leu
Thr Ser Ser Glu Met Lys Lys Ser His 1790 1795
1800Glu Phe His Ala Ile Asn Gly Met Ile Tyr Ser Leu Pro Gly
Leu 1805 1810 1815Lys Met Tyr Glu Gln
Glu Trp Val Arg Leu His Leu Leu Asn Ile 1820 1825
1830Gly Gly Ser Gln Asp Ile His Val Val His Phe His Gly
Gln Thr 1835 1840 1845Leu Leu Glu Asn
Gly Asn Lys Gln His Gln Leu Gly Val Trp Pro 1850
1855 1860Leu Leu Pro Gly Ser Phe Lys Thr Leu Glu Met
Lys Ala Ser Lys 1865 1870 1875Pro Gly
Trp Trp Leu Leu Asn Thr Glu Val Gly Glu Asn Gln Arg 1880
1885 1890Ala Gly Met Gln Thr Pro Phe Leu Ile Met
Asp Arg Asp Cys Arg 1895 1900 1905Met
Pro Met Gly Leu Ser Thr Gly Ile Ile Ser Asp Ser Gln Ile 1910
1915 1920Lys Ala Ser Glu Phe Leu Gly Tyr Trp
Glu Pro Arg Leu Ala Arg 1925 1930
1935Leu Asn Asn Gly Gly Ser Tyr Asn Ala Trp Ser Val Glu Lys Leu
1940 1945 1950Ala Ala Glu Phe Ala Ser
Lys Pro Trp Ile Gln Val Asp Met Gln 1955 1960
1965Lys Glu Val Ile Ile Thr Gly Ile Gln Thr Gln Gly Ala Lys
His 1970 1975 1980Tyr Leu Lys Ser Cys
Tyr Thr Thr Glu Phe Tyr Val Ala Tyr Ser 1985 1990
1995Ser Asn Gln Ile Asn Trp Gln Ile Phe Lys Gly Asn Ser
Thr Arg 2000 2005 2010Asn Val Met Tyr
Phe Asn Gly Asn Ser Asp Ala Ser Thr Ile Lys 2015
2020 2025Glu Asn Gln Phe Asp Pro Pro Ile Val Ala Arg
Tyr Ile Arg Ile 2030 2035 2040Ser Pro
Thr Arg Ala Tyr Asn Arg Pro Thr Leu Arg Leu Glu Leu 2045
2050 2055Gln Gly Cys Glu Val Asn Gly Cys Ser Thr
Pro Leu Gly Met Glu 2060 2065 2070Asn
Gly Lys Ile Glu Asn Lys Gln Ile Thr Ala Ser Ser Phe Lys 2075
2080 2085Lys Ser Trp Trp Gly Asp Tyr Trp Glu
Pro Phe Arg Ala Arg Leu 2090 2095
2100Asn Ala Gln Gly Arg Val Asn Ala Trp Gln Ala Lys Ala Asn Asn
2105 2110 2115Asn Lys Gln Trp Leu Glu
Ile Asp Leu Leu Lys Ile Lys Lys Ile 2120 2125
2130Thr Ala Ile Ile Thr Gln Gly Cys Lys Ser Leu Ser Ser Glu
Met 2135 2140 2145Tyr Val Lys Ser Tyr
Thr Ile His Tyr Ser Glu Gln Gly Val Glu 2150 2155
2160Trp Lys Pro Tyr Arg Leu Lys Ser Ser Met Val Asp Lys
Ile Phe 2165 2170 2175Glu Gly Asn Thr
Asn Thr Lys Gly His Val Lys Asn Phe Phe Asn 2180
2185 2190Pro Pro Ile Ile Ser Arg Phe Ile Arg Val Ile
Pro Lys Thr Trp 2195 2200 2205Asn Gln
Ser Ile Ala Leu Arg Leu Glu Leu Phe Gly Cys Asp Ile 2210
2215 2220Tyr23514PRTHomo sapiensinosine
monophosphate dehydrogenase 2 [Homo sapiens] 23Met Ala Asp Tyr Leu
Ile Ser Gly Gly Thr Ser Tyr Val Pro Asp Asp1 5
10 15Gly Leu Thr Ala Gln Gln Leu Phe Asn Cys Gly
Asp Gly Leu Thr Tyr 20 25
30Asn Asp Phe Leu Ile Leu Pro Gly Tyr Ile Asp Phe Thr Ala Asp Gln
35 40 45Val Asp Leu Thr Ser Ala Leu Thr
Lys Lys Ile Thr Leu Lys Thr Pro 50 55
60Leu Val Ser Ser Pro Met Asp Thr Val Thr Glu Ala Gly Met Ala Ile65
70 75 80Ala Met Ala Leu Thr
Gly Gly Ile Gly Phe Ile His His Asn Cys Thr 85
90 95Pro Glu Phe Gln Ala Asn Glu Val Arg Lys Val
Lys Lys Tyr Glu Gln 100 105
110Gly Phe Ile Thr Asp Pro Val Val Leu Ser Pro Lys Asp Arg Val Arg
115 120 125Asp Val Phe Glu Ala Lys Ala
Arg His Gly Phe Cys Gly Ile Pro Ile 130 135
140Thr Asp Thr Gly Arg Met Gly Ser Arg Leu Val Gly Ile Ile Ser
Ser145 150 155 160Arg Asp
Ile Asp Phe Leu Lys Glu Glu Glu His Asp Cys Phe Leu Glu
165 170 175Glu Ile Met Thr Lys Arg Glu
Asp Leu Val Val Ala Pro Ala Gly Ile 180 185
190Thr Leu Lys Glu Ala Asn Glu Ile Leu Gln Arg Ser Lys Lys
Gly Lys 195 200 205Leu Pro Ile Val
Asn Glu Asp Asp Glu Leu Val Ala Ile Ile Ala Arg 210
215 220Thr Asp Leu Lys Lys Asn Arg Asp Tyr Pro Leu Ala
Ser Lys Asp Ala225 230 235
240Lys Lys Gln Leu Leu Cys Gly Ala Ala Ile Gly Thr His Glu Asp Asp
245 250 255Lys Tyr Arg Leu Asp
Leu Leu Ala Gln Ala Gly Val Asp Val Val Val 260
265 270Leu Asp Ser Ser Gln Gly Asn Ser Ile Phe Gln Ile
Asn Met Ile Lys 275 280 285Tyr Ile
Lys Asp Lys Tyr Pro Asn Leu Gln Val Ile Gly Gly Asn Val 290
295 300Val Thr Ala Ala Gln Ala Lys Asn Leu Ile Asp
Ala Gly Val Asp Ala305 310 315
320Leu Arg Val Gly Met Gly Ser Gly Ser Ile Cys Ile Thr Gln Glu Val
325 330 335Leu Ala Cys Gly
Arg Pro Gln Ala Thr Ala Val Tyr Lys Val Ser Glu 340
345 350Tyr Ala Arg Arg Phe Gly Val Pro Val Ile Ala
Asp Gly Gly Ile Gln 355 360 365Asn
Val Gly His Ile Ala Lys Ala Leu Ala Leu Gly Ala Ser Thr Val 370
375 380Met Met Gly Ser Leu Leu Ala Ala Thr Thr
Glu Ala Pro Gly Glu Tyr385 390 395
400Phe Phe Ser Asp Gly Ile Arg Leu Lys Lys Tyr Arg Gly Met Gly
Ser 405 410 415Leu Asp Ala
Met Asp Lys His Leu Ser Ser Gln Asn Arg Tyr Phe Ser 420
425 430Glu Ala Asp Lys Ile Lys Val Ala Gln Gly
Val Ser Gly Ala Val Gln 435 440
445Asp Lys Gly Ser Ile His Lys Phe Val Pro Tyr Leu Ile Ala Gly Ile 450
455 460Gln His Ser Cys Gln Asp Ile Gly
Ala Lys Ser Leu Thr Gln Val Arg465 470
475 480Ala Met Met Tyr Ser Gly Glu Leu Lys Phe Glu Lys
Arg Thr Ser Ser 485 490
495Ala Gln Val Glu Gly Gly Val His Ser Leu His Ser Tyr Glu Lys Arg
500 505 510Leu Phe 24216PRTHomo
sapienspeptidylprolyl isomerase B precursor [Homo sapiens] 24Met Leu
Arg Leu Ser Glu Arg Asn Met Lys Val Leu Leu Ala Ala Ala1 5
10 15Leu Ile Ala Gly Ser Val Phe Phe
Leu Leu Leu Pro Gly Pro Ser Ala 20 25
30Ala Asp Glu Lys Lys Lys Gly Pro Lys Val Thr Val Lys Val Tyr
Phe 35 40 45Asp Leu Arg Ile Gly
Asp Glu Asp Val Gly Arg Val Ile Phe Gly Leu 50 55
60Phe Gly Lys Thr Val Pro Lys Thr Val Asp Asn Phe Val Ala
Leu Ala65 70 75 80Thr
Gly Glu Lys Gly Phe Gly Tyr Lys Asn Ser Lys Phe His Arg Val
85 90 95Ile Lys Asp Phe Met Ile Gln
Gly Gly Asp Phe Thr Arg Gly Asp Gly 100 105
110Thr Gly Gly Lys Ser Ile Tyr Gly Glu Arg Phe Pro Asp Glu
Asn Phe 115 120 125Lys Leu Lys His
Tyr Gly Pro Gly Trp Val Ser Met Ala Asn Ala Gly 130
135 140Lys Asp Thr Asn Gly Ser Gln Phe Phe Ile Thr Thr
Val Lys Thr Ala145 150 155
160Trp Leu Asp Gly Lys His Val Val Phe Gly Lys Val Leu Glu Gly Met
165 170 175Glu Val Val Arg Lys
Val Glu Ser Thr Lys Thr Asp Ser Arg Asp Lys 180
185 190Pro Leu Lys Asp Val Ile Ile Ala Asp Cys Gly Lys
Ile Glu Val Glu 195 200 205Lys Pro
Phe Ala Ile Ala Lys Glu 210 21525545PRTHomo
sapienschaperonin containing TCP1, subunit 3 isoform a 25Met Met Gly His
Arg Pro Val Leu Val Leu Ser Gln Asn Thr Lys Arg1 5
10 15Glu Ser Gly Arg Lys Val Gln Ser Gly Asn
Ile Asn Ala Ala Lys Thr 20 25
30Ile Ala Asp Ile Ile Arg Thr Cys Leu Gly Pro Lys Ser Met Met Lys
35 40 45Met Leu Leu Asp Pro Met Gly Gly
Ile Val Met Thr Asn Asp Gly Asn 50 55
60Ala Ile Leu Arg Glu Ile Gln Val Gln His Pro Ala Ala Lys Ser Met65
70 75 80Ile Glu Ile Ser Arg
Thr Gln Asp Glu Glu Val Gly Asp Gly Thr Thr 85
90 95Ser Val Ile Ile Leu Ala Gly Glu Met Leu Ser
Val Ala Glu His Phe 100 105
110Leu Glu Gln Gln Met His Pro Thr Val Val Ile Ser Ala Tyr Arg Lys
115 120 125Ala Leu Asp Asp Met Ile Ser
Thr Leu Lys Lys Ile Ser Ile Pro Val 130 135
140Asp Ile Ser Asp Ser Asp Met Met Leu Asn Ile Ile Asn Ser Ser
Ile145 150 155 160Thr Thr
Lys Ala Ile Ser Arg Trp Ser Ser Leu Ala Cys Asn Ile Ala
165 170 175Leu Asp Ala Val Lys Met Val
Gln Phe Glu Glu Asn Gly Arg Lys Glu 180 185
190Ile Asp Ile Lys Lys Tyr Ala Arg Val Glu Lys Ile Pro Gly
Gly Ile 195 200 205Ile Glu Asp Ser
Cys Val Leu Arg Gly Val Met Ile Asn Lys Asp Val 210
215 220Thr His Pro Arg Met Arg Arg Tyr Ile Lys Asn Pro
Arg Ile Val Leu225 230 235
240Leu Asp Ser Ser Leu Glu Tyr Lys Lys Gly Glu Ser Gln Thr Asp Ile
245 250 255Glu Ile Thr Arg Glu
Glu Asp Phe Thr Arg Ile Leu Gln Met Glu Glu 260
265 270Glu Tyr Ile Gln Gln Leu Cys Glu Asp Ile Ile Gln
Leu Lys Pro Asp 275 280 285Val Val
Ile Thr Glu Lys Gly Ile Ser Asp Leu Ala Gln His Tyr Leu 290
295 300Met Arg Ala Asn Ile Thr Ala Ile Arg Arg Val
Arg Lys Thr Asp Asn305 310 315
320Asn Arg Ile Ala Arg Ala Cys Gly Ala Arg Ile Val Ser Arg Pro Glu
325 330 335Glu Leu Arg Glu
Asp Asp Val Gly Thr Gly Ala Gly Leu Leu Glu Ile 340
345 350Lys Lys Ile Gly Asp Glu Tyr Phe Thr Phe Ile
Thr Asp Cys Lys Asp 355 360 365Pro
Lys Ala Cys Thr Ile Leu Leu Arg Gly Ala Ser Lys Glu Ile Leu 370
375 380Ser Glu Val Glu Arg Asn Leu Gln Asp Ala
Met Gln Val Cys Arg Asn385 390 395
400Val Leu Leu Asp Pro Gln Leu Val Pro Gly Gly Gly Ala Ser Glu
Met 405 410 415Ala Val Ala
His Ala Leu Thr Glu Lys Ser Lys Ala Met Thr Gly Val 420
425 430Glu Gln Trp Pro Tyr Arg Ala Val Ala Gln
Ala Leu Glu Val Ile Pro 435 440
445Arg Thr Leu Ile Gln Asn Cys Gly Ala Ser Thr Ile Arg Leu Leu Thr 450
455 460Ser Leu Arg Ala Lys His Thr Gln
Glu Asn Cys Glu Thr Trp Gly Val465 470
475 480Asn Gly Glu Thr Gly Thr Leu Val Asp Met Lys Glu
Leu Gly Ile Trp 485 490
495Glu Pro Leu Ala Val Lys Leu Gln Thr Tyr Lys Thr Ala Val Glu Thr
500 505 510Ala Val Leu Leu Leu Arg
Ile Asp Asp Ile Val Ser Gly His Lys Lys 515 520
525Lys Gly Asp Asp Gln Ser Arg Gln Gly Gly Ala Pro Asp Ala
Gly Gln 530 535 540Glu54526374PRTHomo
sapienseukaryotic translation initiation factor 3, subunit M 26Met
Ser Val Pro Ala Phe Ile Asp Ile Ser Glu Glu Asp Gln Ala Ala1
5 10 15Glu Leu Arg Ala Tyr Leu Lys
Ser Lys Gly Ala Glu Ile Ser Glu Glu 20 25
30Asn Ser Glu Gly Gly Leu His Val Asp Leu Ala Gln Ile Ile
Glu Ala 35 40 45Cys Asp Val Cys
Leu Lys Glu Asp Asp Lys Asp Val Glu Ser Val Met 50 55
60Asn Ser Val Val Ser Leu Leu Leu Ile Leu Glu Pro Asp
Lys Gln Glu65 70 75
80Ala Leu Ile Glu Ser Leu Cys Glu Lys Leu Val Lys Phe Arg Glu Gly
85 90 95Glu Arg Pro Ser Leu Arg
Leu Gln Leu Leu Ser Asn Leu Phe His Gly 100
105 110Met Asp Lys Asn Thr Pro Val Arg Tyr Thr Val Tyr
Cys Ser Leu Ile 115 120 125Lys Val
Ala Ala Ser Cys Gly Ala Ile Gln Tyr Ile Pro Thr Glu Leu 130
135 140Asp Gln Val Arg Lys Trp Ile Ser Asp Trp Asn
Leu Thr Thr Glu Lys145 150 155
160Lys His Thr Leu Leu Arg Leu Leu Tyr Glu Ala Leu Val Asp Cys Lys
165 170 175Lys Ser Asp Ala
Ala Ser Lys Val Met Val Glu Leu Leu Gly Ser Tyr 180
185 190Thr Glu Asp Asn Ala Ser Gln Ala Arg Val Asp
Ala His Arg Cys Ile 195 200 205Val
Arg Ala Leu Lys Asp Pro Asn Ala Phe Leu Phe Asp His Leu Leu 210
215 220Thr Leu Lys Pro Val Lys Phe Leu Glu Gly
Glu Leu Ile His Asp Leu225 230 235
240Leu Thr Ile Phe Val Ser Ala Lys Leu Ala Ser Tyr Val Lys Phe
Tyr 245 250 255Gln Asn Asn
Lys Asp Phe Ile Asp Ser Leu Gly Leu Leu His Glu Gln 260
265 270Asn Met Ala Lys Met Arg Leu Leu Thr Phe
Met Gly Met Ala Val Glu 275 280
285Asn Lys Glu Ile Ser Phe Asp Thr Met Gln Gln Glu Leu Gln Ile Gly 290
295 300Ala Asp Asp Val Glu Ala Phe Val
Ile Asp Ala Val Arg Thr Lys Met305 310
315 320Val Tyr Cys Lys Ile Asp Gln Thr Gln Arg Lys Val
Val Val Ser His 325 330
335Ser Thr His Arg Thr Phe Gly Lys Gln Gln Trp Gln Gln Leu Tyr Asp
340 345 350Thr Leu Asn Ala Trp Lys
Gln Asn Leu Asn Lys Val Lys Asn Ser Leu 355 360
365Leu Ser Leu Ser Asp Thr 37027167PRTHomo
sapiensregulator of G-protein signaling 10 isoform b 27Met Glu His Ile
His Asp Ser Asp Gly Ser Ser Ser Ser Ser His Gln1 5
10 15Ser Leu Lys Ser Thr Ala Lys Trp Ala Ala
Ser Leu Glu Asn Leu Leu 20 25
30Glu Asp Pro Glu Gly Val Lys Arg Phe Arg Glu Phe Leu Lys Lys Glu
35 40 45Phe Ser Glu Glu Asn Val Leu Phe
Trp Leu Ala Cys Glu Asp Phe Lys 50 55
60Lys Met Gln Asp Lys Thr Gln Met Gln Glu Lys Ala Lys Glu Ile Tyr65
70 75 80Met Thr Phe Leu Ser
Ser Lys Ala Ser Ser Gln Val Asn Val Glu Gly 85
90 95Gln Ser Arg Leu Asn Glu Lys Ile Leu Glu Glu
Pro His Pro Leu Met 100 105
110Phe Gln Lys Leu Gln Asp Gln Ile Phe Asn Leu Met Lys Tyr Asp Ser
115 120 125Tyr Ser Arg Phe Leu Lys Ser
Asp Leu Phe Leu Lys His Lys Arg Thr 130 135
140Glu Glu Glu Glu Glu Asp Leu Pro Asp Ala Gln Thr Ala Ala Lys
Arg145 150 155 160Ala Ser
Arg Ile Tyr Asn Thr 16528319PRTHomo
sapienspyrroline-5-carboxylate reductase 1 isoform 1 28Met Ser Val Gly
Phe Ile Gly Ala Gly Gln Leu Ala Phe Ala Leu Ala1 5
10 15Lys Gly Phe Thr Ala Ala Gly Val Leu Ala
Ala His Lys Ile Met Ala 20 25
30Ser Ser Pro Asp Met Asp Leu Ala Thr Val Ser Ala Leu Arg Lys Met
35 40 45Gly Val Lys Leu Thr Pro His Asn
Lys Glu Thr Val Gln His Ser Asp 50 55
60Val Leu Phe Leu Ala Val Lys Pro His Ile Ile Pro Phe Ile Leu Asp65
70 75 80Glu Ile Gly Ala Asp
Ile Glu Asp Arg His Ile Val Val Ser Cys Ala 85
90 95Ala Gly Val Thr Ile Ser Ser Ile Glu Lys Lys
Leu Ser Ala Phe Arg 100 105
110Pro Ala Pro Arg Val Ile Arg Cys Met Thr Asn Thr Pro Val Val Val
115 120 125Arg Glu Gly Ala Thr Val Tyr
Ala Thr Gly Thr His Ala Gln Val Glu 130 135
140Asp Gly Arg Leu Met Glu Gln Leu Leu Ser Ser Val Gly Phe Cys
Thr145 150 155 160Glu Val
Glu Glu Asp Leu Ile Asp Ala Val Thr Gly Leu Ser Gly Ser
165 170 175Gly Pro Ala Tyr Ala Phe Thr
Ala Leu Asp Ala Leu Ala Asp Gly Gly 180 185
190Val Lys Met Gly Leu Pro Arg Arg Leu Ala Val Arg Leu Gly
Ala Gln 195 200 205Ala Leu Leu Gly
Ala Ala Lys Met Leu Leu His Ser Glu Gln His Pro 210
215 220Gly Gln Leu Lys Asp Asn Val Ser Ser Pro Gly Gly
Ala Thr Ile His225 230 235
240Ala Leu His Val Leu Glu Ser Gly Gly Phe Arg Ser Leu Leu Ile Asn
245 250 255Ala Val Glu Ala Ser
Cys Ile Arg Thr Arg Glu Leu Gln Ser Met Ala 260
265 270Asp Gln Glu Gln Val Ser Pro Ala Ala Ile Lys Lys
Thr Ile Leu Asp 275 280 285Lys Val
Lys Leu Asp Ser Pro Ala Gly Thr Ala Leu Ser Pro Ser Gly 290
295 300His Thr Lys Leu Leu Pro Arg Ser Leu Ala Pro
Ala Gly Lys Asp305 310 315291556PRTHomo
sapiensbromodomain adjacent to zinc finger domain, 1A isoform a
29Met Pro Leu Leu His Arg Lys Pro Phe Val Arg Gln Lys Pro Pro Ala1
5 10 15Asp Leu Arg Pro Asp Glu
Glu Val Phe Tyr Cys Lys Val Thr Asn Glu 20 25
30Ile Phe Arg His Tyr Asp Asp Phe Phe Glu Arg Thr Ile
Leu Cys Asn 35 40 45Ser Leu Val
Trp Ser Cys Ala Val Thr Gly Arg Pro Gly Leu Thr Tyr 50
55 60Gln Glu Ala Leu Glu Ser Glu Lys Lys Ala Arg Gln
Asn Leu Gln Ser65 70 75
80Phe Pro Glu Pro Leu Ile Ile Pro Val Leu Tyr Leu Thr Ser Leu Thr
85 90 95His Arg Ser Arg Leu His
Glu Ile Cys Asp Asp Ile Phe Ala Tyr Val 100
105 110Lys Asp Arg Tyr Phe Val Glu Glu Thr Val Glu Val
Ile Arg Asn Asn 115 120 125Gly Ala
Arg Leu Gln Cys Arg Ile Leu Glu Val Leu Pro Pro Ser His 130
135 140Gln Asn Gly Phe Ala Asn Gly His Val Asn Ser
Val Asp Gly Glu Thr145 150 155
160Ile Ile Ile Ser Asp Ser Asp Asp Ser Glu Thr Gln Ser Cys Ser Phe
165 170 175Gln Asn Gly Lys
Lys Lys Asp Ala Ile Asp Pro Leu Leu Phe Lys Tyr 180
185 190Lys Val Gln Pro Thr Lys Lys Glu Leu His Glu
Ser Ala Ile Val Lys 195 200 205Ala
Thr Gln Ile Ser Arg Arg Lys His Leu Phe Ser Arg Asp Lys Leu 210
215 220Lys Leu Phe Leu Lys Gln His Cys Glu Pro
Gln Asp Gly Val Ile Lys225 230 235
240Ile Lys Ala Ser Ser Leu Ser Thr Tyr Lys Ile Ala Glu Gln Asp
Phe 245 250 255Ser Tyr Phe
Phe Pro Asp Asp Pro Pro Thr Phe Ile Phe Ser Pro Ala 260
265 270Asn Arg Arg Arg Gly Arg Pro Pro Lys Arg
Ile His Ile Ser Gln Glu 275 280
285Asp Asn Val Ala Asn Lys Gln Thr Leu Ala Ser Tyr Arg Ser Lys Ala 290
295 300Thr Lys Glu Arg Asp Lys Leu Leu
Lys Gln Glu Glu Met Lys Ser Leu305 310
315 320Ala Phe Glu Lys Ala Lys Leu Lys Arg Glu Lys Ala
Asp Ala Leu Glu 325 330
335Ala Lys Lys Lys Glu Lys Glu Asp Lys Glu Lys Lys Arg Glu Glu Leu
340 345 350Lys Lys Ile Val Glu Glu
Glu Arg Leu Lys Lys Lys Glu Glu Lys Glu 355 360
365Arg Leu Lys Val Glu Arg Glu Lys Glu Arg Glu Lys Leu Arg
Glu Glu 370 375 380Lys Arg Lys Tyr Val
Glu Tyr Leu Lys Gln Trp Ser Lys Pro Arg Glu385 390
395 400Asp Met Glu Cys Asp Asp Leu Lys Glu Leu
Pro Glu Pro Thr Pro Val 405 410
415Lys Thr Arg Leu Pro Pro Glu Ile Phe Gly Asp Ala Leu Met Val Leu
420 425 430Glu Phe Leu Asn Ala
Phe Gly Glu Leu Phe Asp Leu Gln Asp Glu Phe 435
440 445Pro Asp Gly Val Thr Leu Glu Val Leu Glu Glu Ala
Leu Val Gly Asn 450 455 460Asp Ser Glu
Gly Pro Leu Cys Glu Leu Leu Phe Phe Phe Leu Thr Ala465
470 475 480Ile Phe Gln Ala Ile Ala Glu
Glu Glu Glu Glu Val Ala Lys Glu Gln 485
490 495Leu Thr Asp Ala Asp Thr Lys Asp Leu Thr Glu Ala
Leu Asp Glu Asp 500 505 510Ala
Asp Pro Thr Lys Ser Ala Leu Ser Ala Val Ala Ser Leu Ala Ala 515
520 525Ala Trp Pro Gln Leu His Gln Gly Cys
Ser Leu Lys Ser Leu Asp Leu 530 535
540Asp Ser Cys Thr Leu Ser Glu Ile Leu Arg Leu His Ile Leu Ala Ser545
550 555 560Gly Ala Asp Val
Thr Ser Ala Asn Ala Lys Tyr Arg Tyr Gln Lys Arg 565
570 575Gly Gly Phe Asp Ala Thr Asp Asp Ala Cys
Met Glu Leu Arg Leu Ser 580 585
590Asn Pro Ser Leu Val Lys Lys Leu Ser Ser Thr Ser Val Tyr Asp Leu
595 600 605Thr Pro Gly Glu Lys Met Lys
Ile Leu His Ala Leu Cys Gly Lys Leu 610 615
620Leu Thr Leu Val Ser Thr Arg Asp Phe Ile Glu Asp Tyr Val Asp
Ile625 630 635 640Leu Arg
Gln Ala Lys Gln Glu Phe Arg Glu Leu Lys Ala Glu Gln His
645 650 655Arg Lys Glu Arg Glu Glu Ala
Ala Ala Arg Ile Arg Lys Arg Lys Glu 660 665
670Glu Lys Leu Lys Glu Gln Glu Gln Lys Met Lys Glu Lys Gln
Glu Lys 675 680 685Leu Lys Glu Asp
Glu Gln Arg Asn Ser Thr Ala Asp Ile Ser Ile Gly 690
695 700Glu Glu Glu Arg Glu Asp Phe Asp Thr Ser Ile Glu
Ser Lys Asp Thr705 710 715
720Glu Gln Lys Glu Leu Asp Gln Asp Met Val Thr Glu Asp Glu Asp Asp
725 730 735Pro Gly Ser His Lys
Arg Gly Arg Arg Gly Lys Arg Gly Gln Asn Gly 740
745 750Phe Lys Glu Phe Thr Arg Gln Glu Gln Ile Asn Cys
Val Thr Arg Glu 755 760 765Pro Leu
Thr Ala Asp Glu Glu Glu Ala Leu Lys Gln Glu His Gln Arg 770
775 780Lys Glu Lys Glu Leu Leu Glu Lys Ile Gln Ser
Ala Ile Ala Cys Thr785 790 795
800Asn Ile Phe Pro Leu Gly Arg Asp Arg Met Tyr Arg Arg Tyr Trp Ile
805 810 815Phe Pro Ser Ile
Pro Gly Leu Phe Ile Glu Glu Asp Tyr Ser Gly Leu 820
825 830Thr Glu Asp Met Leu Leu Pro Arg Pro Ser Ser
Phe Gln Asn Asn Val 835 840 845Gln
Ser Gln Asp Pro Gln Val Ser Thr Lys Thr Gly Glu Pro Leu Met 850
855 860Ser Glu Ser Thr Ser Asn Ile Asp Gln Gly
Pro Arg Asp His Ser Val865 870 875
880Gln Leu Pro Lys Pro Val His Lys Pro Asn Arg Trp Cys Phe Tyr
Ser 885 890 895Ser Cys Glu
Gln Leu Asp Gln Leu Ile Glu Ala Leu Asn Ser Arg Gly 900
905 910His Arg Glu Ser Ala Leu Lys Glu Thr Leu
Leu Gln Glu Lys Ser Arg 915 920
925Ile Cys Ala Gln Leu Ala Arg Phe Ser Glu Glu Lys Phe His Phe Ser 930
935 940Asp Lys Pro Gln Pro Asp Ser Lys
Pro Thr Tyr Ser Arg Gly Arg Ser945 950
955 960Ser Asn Ala Tyr Asp Pro Ser Gln Met Cys Ala Glu
Lys Gln Leu Glu 965 970
975Leu Arg Leu Arg Asp Phe Leu Leu Asp Ile Glu Asp Arg Ile Tyr Gln
980 985 990Gly Thr Leu Gly Ala Ile
Lys Val Thr Asp Arg His Ile Trp Arg Ser 995 1000
1005Ala Leu Glu Ser Gly Arg Tyr Glu Leu Leu Ser Glu
Glu Asn Lys 1010 1015 1020Glu Asn Gly
Ile Ile Lys Thr Val Asn Glu Asp Val Glu Glu Met 1025
1030 1035Glu Ile Asp Glu Gln Thr Lys Val Ile Val Lys
Asp Arg Leu Leu 1040 1045 1050Gly Ile
Lys Thr Glu Thr Pro Ser Thr Val Ser Thr Asn Ala Ser 1055
1060 1065Thr Pro Gln Ser Val Ser Ser Val Val His
Tyr Leu Ala Met Ala 1070 1075 1080Leu
Phe Gln Ile Glu Gln Gly Ile Glu Arg Arg Phe Leu Lys Ala 1085
1090 1095Pro Leu Asp Ala Ser Asp Ser Gly Arg
Ser Tyr Lys Thr Val Leu 1100 1105
1110Asp Arg Trp Arg Glu Ser Leu Leu Ser Ser Ala Ser Leu Ser Gln
1115 1120 1125Val Phe Leu His Leu Ser
Thr Leu Asp Arg Ser Val Ile Trp Ser 1130 1135
1140Lys Ser Ile Leu Asn Ala Arg Cys Lys Ile Cys Arg Lys Lys
Gly 1145 1150 1155Asp Ala Glu Asn Met
Val Leu Cys Asp Gly Cys Asp Arg Gly His 1160 1165
1170His Thr Tyr Cys Val Arg Pro Lys Leu Lys Thr Val Pro
Glu Gly 1175 1180 1185Asp Trp Phe Cys
Pro Glu Cys Arg Pro Lys Gln Arg Ser Arg Arg 1190
1195 1200Leu Ser Ser Arg Gln Arg Pro Ser Leu Glu Ser
Asp Glu Asp Val 1205 1210 1215Glu Asp
Ser Met Gly Gly Glu Asp Asp Glu Val Asp Gly Asp Glu 1220
1225 1230Glu Glu Gly Gln Ser Glu Glu Glu Glu Tyr
Glu Val Glu Gln Asp 1235 1240 1245Glu
Asp Asp Ser Gln Glu Glu Glu Glu Val Ser Leu Pro Lys Arg 1250
1255 1260Gly Arg Pro Gln Val Arg Leu Pro Val
Lys Thr Arg Gly Lys Leu 1265 1270
1275Ser Ser Ser Phe Ser Ser Arg Gly Gln Gln Gln Glu Pro Gly Arg
1280 1285 1290Tyr Pro Ser Arg Ser Gln
Gln Ser Thr Pro Lys Thr Thr Val Ser 1295 1300
1305Ser Lys Thr Gly Arg Ser Leu Arg Lys Ile Asn Ser Ala Pro
Pro 1310 1315 1320Thr Glu Thr Lys Ser
Leu Arg Ile Ala Ser Arg Ser Thr Arg His 1325 1330
1335Ser His Gly Pro Leu Gln Ala Asp Val Phe Val Glu Leu
Leu Ser 1340 1345 1350Pro Arg Arg Lys
Arg Arg Gly Arg Lys Ser Ala Asn Asn Thr Pro 1355
1360 1365Glu Asn Ser Pro Asn Phe Pro Asn Phe Arg Val
Ile Ala Thr Lys 1370 1375 1380Ser Ser
Glu Gln Ser Arg Ser Val Asn Ile Ala Ser Lys Leu Ser 1385
1390 1395Leu Gln Glu Ser Glu Ser Lys Arg Arg Cys
Arg Lys Arg Gln Ser 1400 1405 1410Pro
Glu Pro Ser Pro Val Thr Leu Gly Arg Arg Ser Ser Gly Arg 1415
1420 1425Gln Gly Gly Val His Glu Leu Ser Ala
Phe Glu Gln Leu Val Val 1430 1435
1440Glu Leu Val Arg His Asp Asp Ser Trp Pro Phe Leu Lys Leu Val
1445 1450 1455Ser Lys Ile Gln Val Pro
Asp Tyr Tyr Asp Ile Ile Lys Lys Pro 1460 1465
1470Ile Ala Leu Asn Ile Ile Arg Glu Lys Val Asn Lys Cys Glu
Tyr 1475 1480 1485Lys Leu Ala Ser Glu
Phe Ile Asp Asp Ile Glu Leu Met Phe Ser 1490 1495
1500Asn Cys Phe Glu Tyr Asn Pro Arg Asn Thr Ser Glu Ala
Lys Ala 1505 1510 1515Gly Thr Arg Leu
Gln Ala Phe Phe His Ile Gln Ala Gln Lys Leu 1520
1525 1530Gly Leu His Val Thr Pro Ser Asn Val Asp Gln
Val Ser Thr Pro 1535 1540 1545Pro Ala
Ala Lys Lys Ser Arg Ile 1550 155530195PRTHomo
sapiensMARCKS-like 1 30Met Gly Ser Gln Ser Ser Lys Ala Pro Arg Gly Asp
Val Thr Ala Glu1 5 10
15Glu Ala Ala Gly Ala Ser Pro Ala Lys Ala Asn Gly Gln Glu Asn Gly
20 25 30His Val Lys Ser Asn Gly Asp
Leu Ser Pro Lys Gly Glu Gly Glu Ser 35 40
45Pro Pro Val Asn Gly Thr Asp Glu Ala Ala Gly Ala Thr Gly Asp
Ala 50 55 60Ile Glu Pro Ala Pro Pro
Ser Gln Gly Ala Glu Ala Lys Gly Glu Val65 70
75 80Pro Pro Lys Glu Thr Pro Lys Lys Lys Lys Lys
Phe Ser Phe Lys Lys 85 90
95Pro Phe Lys Leu Ser Gly Leu Ser Phe Lys Arg Asn Arg Lys Glu Gly
100 105 110Gly Gly Asp Ser Ser Ala
Ser Ser Pro Thr Glu Glu Glu Gln Glu Gln 115 120
125Gly Glu Ile Gly Ala Cys Ser Asp Glu Gly Thr Ala Gln Glu
Gly Lys 130 135 140Ala Ala Ala Thr Pro
Glu Ser Gln Glu Pro Gln Ala Lys Gly Ala Glu145 150
155 160Ala Ser Ala Ala Ser Glu Glu Glu Ala Gly
Pro Gln Ala Thr Glu Pro 165 170
175Ser Thr Pro Ser Gly Pro Glu Ser Gly Pro Thr Pro Ala Ser Ala Glu
180 185 190Gln Asn Glu
19531350PRTHomo sapiensmethylene tetrahydrofolate dehydrogenase 2
isoform A precursor 31Met Ala Ala Thr Ser Leu Met Ser Ala Leu Ala Ala Arg
Leu Leu Gln1 5 10 15Pro
Ala His Ser Cys Ser Leu Arg Leu Arg Pro Phe His Leu Ala Ala 20
25 30Val Arg Asn Glu Ala Val Val Ile
Ser Gly Arg Lys Leu Ala Gln Gln 35 40
45Ile Lys Gln Glu Val Arg Gln Glu Val Glu Glu Trp Val Ala Ser Gly
50 55 60Asn Lys Arg Pro His Leu Ser Val
Ile Leu Val Gly Glu Asn Pro Ala65 70 75
80Ser His Ser Tyr Val Leu Asn Lys Thr Arg Ala Ala Ala
Val Val Gly 85 90 95Ile
Asn Ser Glu Thr Ile Met Lys Pro Ala Ser Ile Ser Glu Glu Glu
100 105 110Leu Leu Asn Leu Ile Asn Lys
Leu Asn Asn Asp Asp Asn Val Asp Gly 115 120
125Leu Leu Val Gln Leu Pro Leu Pro Glu His Ile Asp Glu Arg Arg
Ile 130 135 140Cys Asn Ala Val Ser Pro
Asp Lys Asp Val Asp Gly Phe His Val Ile145 150
155 160Asn Val Gly Arg Met Cys Leu Asp Gln Tyr Ser
Met Leu Pro Ala Thr 165 170
175Pro Trp Gly Val Trp Glu Ile Ile Lys Arg Thr Gly Ile Pro Thr Leu
180 185 190Gly Lys Asn Val Val Val
Ala Gly Arg Ser Lys Asn Val Gly Met Pro 195 200
205Ile Ala Met Leu Leu His Thr Asp Gly Ala His Glu Arg Pro
Gly Gly 210 215 220Asp Ala Thr Val Thr
Ile Ser His Arg Tyr Thr Pro Lys Glu Gln Leu225 230
235 240Lys Lys His Thr Ile Leu Ala Asp Ile Val
Ile Ser Ala Ala Gly Ile 245 250
255Pro Asn Leu Ile Thr Ala Asp Met Ile Lys Glu Gly Ala Ala Val Ile
260 265 270Asp Val Gly Ile Asn
Arg Val His Asp Pro Val Thr Ala Lys Pro Lys 275
280 285Leu Val Gly Asp Val Asp Phe Glu Gly Val Arg Gln
Lys Ala Gly Tyr 290 295 300Ile Thr Pro
Val Pro Gly Gly Val Gly Pro Met Thr Val Ala Met Leu305
310 315 320Met Lys Asn Thr Ile Ile Ala
Ala Lys Lys Val Leu Arg Leu Glu Glu 325
330 335Arg Glu Val Leu Lys Ser Lys Glu Leu Gly Val Ala
Thr Asn 340 345
35032559PRTHomo sapienssolute carrier family 43, member 1 32Met Ala Pro
Thr Leu Gln Gln Ala Tyr Arg Arg Arg Trp Trp Met Ala1 5
10 15Cys Thr Ala Val Leu Glu Asn Leu Phe
Phe Ser Ala Val Leu Leu Gly 20 25
30Trp Gly Ser Leu Leu Ile Ile Leu Lys Asn Glu Gly Phe Tyr Ser Ser
35 40 45Thr Cys Pro Ala Glu Ser Ser
Thr Asn Thr Thr Gln Asp Glu Gln Arg 50 55
60Arg Trp Pro Gly Cys Asp Gln Gln Asp Glu Met Leu Asn Leu Gly Phe65
70 75 80Thr Ile Gly Ser
Phe Val Leu Ser Ala Thr Thr Leu Pro Leu Gly Ile 85
90 95Leu Met Asp Arg Phe Gly Pro Arg Pro Val
Arg Leu Val Gly Ser Ala 100 105
110Cys Phe Thr Ala Ser Cys Thr Leu Met Ala Leu Ala Ser Arg Asp Val
115 120 125Glu Ala Leu Ser Pro Leu Ile
Phe Leu Ala Leu Ser Leu Asn Gly Phe 130 135
140Gly Gly Ile Cys Leu Thr Phe Thr Ser Leu Thr Leu Pro Asn Met
Phe145 150 155 160Gly Asn
Leu Arg Ser Thr Leu Met Ala Leu Met Ile Gly Ser Tyr Ala
165 170 175Ser Ser Ala Ile Thr Phe Pro
Gly Ile Lys Leu Ile Tyr Asp Ala Gly 180 185
190Val Ala Phe Val Val Ile Met Phe Thr Trp Ser Gly Leu Ala
Cys Leu 195 200 205Ile Phe Leu Asn
Cys Thr Leu Asn Trp Pro Ile Glu Ala Phe Pro Ala 210
215 220Pro Glu Glu Val Asn Tyr Thr Lys Lys Ile Lys Leu
Ser Gly Leu Ala225 230 235
240Leu Asp His Lys Val Thr Gly Asp Leu Phe Tyr Thr His Val Thr Thr
245 250 255Met Gly Gln Arg Leu
Ser Gln Lys Ala Pro Ser Leu Glu Asp Gly Ser 260
265 270Asp Ala Phe Met Ser Pro Gln Asp Val Arg Gly Thr
Ser Glu Asn Leu 275 280 285Pro Glu
Arg Ser Val Pro Leu Arg Lys Ser Leu Cys Ser Pro Thr Phe 290
295 300Leu Trp Ser Leu Leu Thr Met Gly Met Thr Gln
Leu Arg Ile Ile Phe305 310 315
320Tyr Met Ala Ala Val Asn Lys Met Leu Glu Tyr Leu Val Thr Gly Gly
325 330 335Gln Glu His Glu
Thr Asn Glu Gln Gln Gln Lys Val Ala Glu Thr Val 340
345 350Gly Phe Tyr Ser Ser Val Phe Gly Ala Met Gln
Leu Leu Cys Leu Leu 355 360 365Thr
Cys Pro Leu Ile Gly Tyr Ile Met Asp Trp Arg Ile Lys Asp Cys 370
375 380Val Asp Ala Pro Thr Gln Gly Thr Val Leu
Gly Asp Ala Arg Asp Gly385 390 395
400Val Ala Thr Lys Ser Ile Arg Pro Arg Tyr Cys Lys Ile Gln Lys
Leu 405 410 415Thr Asn Ala
Ile Ser Ala Phe Thr Leu Thr Asn Leu Leu Leu Val Gly 420
425 430Phe Gly Ile Thr Cys Leu Ile Asn Asn Leu
His Leu Gln Phe Val Thr 435 440
445Phe Val Leu His Thr Ile Val Arg Gly Phe Phe His Ser Ala Cys Gly 450
455 460Ser Leu Tyr Ala Ala Val Phe Pro
Ser Asn His Phe Gly Thr Leu Thr465 470
475 480Gly Leu Gln Ser Leu Ile Ser Ala Val Phe Ala Leu
Leu Gln Gln Pro 485 490
495Leu Phe Met Ala Met Val Gly Pro Leu Lys Gly Glu Pro Phe Trp Val
500 505 510Asn Leu Gly Leu Leu Leu
Phe Ser Leu Leu Gly Phe Leu Leu Pro Ser 515 520
525Tyr Leu Phe Tyr Tyr Arg Ala Arg Leu Gln Gln Glu Tyr Ala
Ala Asn 530 535 540Gly Met Gly Pro Leu
Lys Val Leu Ser Gly Ser Glu Val Thr Ala545 550
55533198PRTHomo sapiensmitochondrial ribosomal protein L12 33Met Leu
Pro Ala Ala Ala Arg Pro Leu Trp Gly Pro Cys Leu Gly Leu1 5
10 15Arg Ala Ala Ala Phe Arg Leu Ala
Arg Arg Gln Val Pro Cys Val Cys 20 25
30Ala Val Arg His Met Arg Ser Ser Gly His Gln Arg Cys Glu Ala
Leu 35 40 45Ala Gly Ala Pro Leu
Asp Asn Ala Pro Lys Glu Tyr Pro Pro Lys Ile 50 55
60Gln Gln Leu Val Gln Asp Ile Ala Ser Leu Thr Leu Leu Glu
Ile Ser65 70 75 80Asp
Leu Asn Glu Leu Leu Lys Lys Thr Leu Lys Ile Gln Asp Val Gly
85 90 95Leu Val Pro Met Gly Gly Val
Met Ser Gly Ala Val Pro Ala Ala Ala 100 105
110Ala Gln Glu Ala Val Glu Glu Asp Ile Pro Ile Ala Lys Glu
Arg Thr 115 120 125His Phe Thr Val
Arg Leu Thr Glu Ala Lys Pro Val Asp Lys Val Lys 130
135 140Leu Ile Lys Glu Ile Lys Asn Tyr Ile Gln Gly Ile
Asn Leu Val Gln145 150 155
160Ala Lys Lys Leu Val Glu Ser Leu Pro Gln Glu Ile Lys Ala Asn Val
165 170 175Ala Lys Ala Glu Ala
Glu Lys Ile Lys Ala Ala Leu Glu Ala Val Gly 180
185 190Gly Thr Val Val Leu Glu 195
User Contributions:
comments("1"); ?> comment_form("1"); ?>Inventors list |
Agents list |
Assignees list |
List by place |
Classification tree browser |
Top 100 Inventors |
Top 100 Agents |
Top 100 Assignees |
Usenet FAQ Index |
Documents |
Other FAQs |
User Contributions:
Comment about this patent or add new information about this topic:
 |  |
 |  |
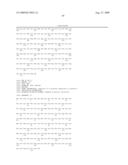 | 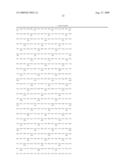 |
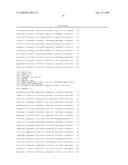 | 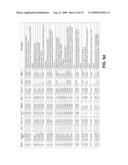 |
 |  |
 |  |
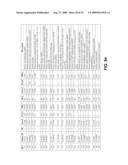 |  |
 | 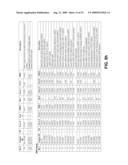 |
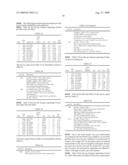 | 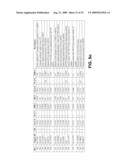 |
 |  |
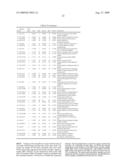 |  |
 | 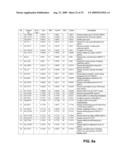 |
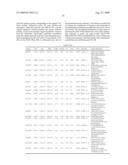 |  |
 |  |
 | 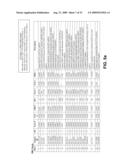 |
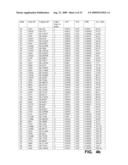 | 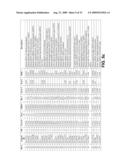 |
 |  |
 |  |
 | 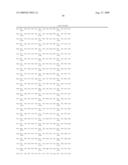 |
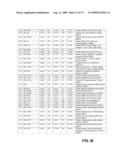 | 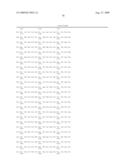 |
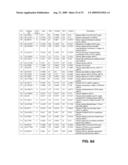 | 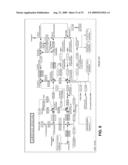 |
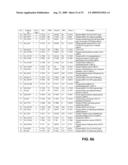 |  |
 |  |
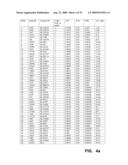 | 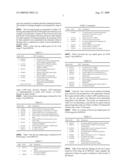 |
 |  |
 |  |
 | 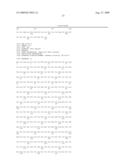 |
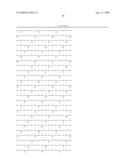 | 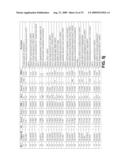 |
 |  |
 |  |
 | 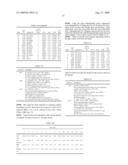 |
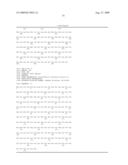 | 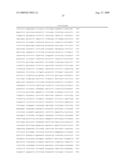 |
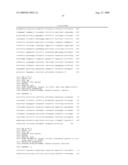 |  |
 |  |
 |  |
 | 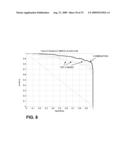 |
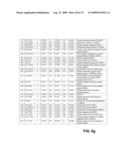 | 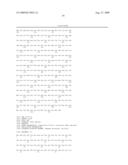 |
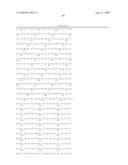 | 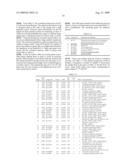 |
 | 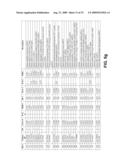 |
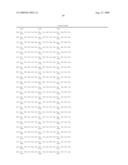 | 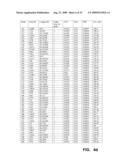 |
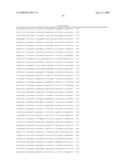 |  |
 |  |
 | 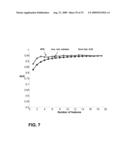 |
 |  |
 |  |
 |  |
| Similar patent applications: | |
| Date | Title |
|---|---|
| 2009-12-10 | Biomarkers downregulated in prostate cancer |
| 2009-11-19 | Biomarkers overexpressed in prostate cancer |
| 2010-10-07 | Biomarkers for prostate cancer |
| 2010-12-02 | Biomarkers for prenatal diagnosis of congenital cytomegalovirus |
| 2010-10-07 | Novel gene upregulated in cancers of the prostate |
| New patent applications in this class: | |
| Date | Title |
|---|---|
| 2017-08-17 | Systems and methods for authenticating working fluids |
| 2016-12-29 | Schiff-base conjugate of n, n-dibutyl-p-phenylenediamine with pyridoxal 5'-phosphate for improved homocysteine assays using pyridoxal 5'-phosphate-dependent enzymes |
| 2016-07-07 | Predicting coronary artery disease and risk of cardiovascular events |
| 2016-06-16 | Sensor labels that log events against time |
| 2016-06-16 | Colorimetric assay for l-glutamine and related assay kit |
| New patent applications from these inventors: | |
| Date | Title |
|---|---|
| 2015-11-26 | Methods for screening, predicting and monitoring prostate cancer |
| 2014-01-16 | Biomarkers for screening, predicting, and monitoring benign prostate hyperplasia |
| 2013-11-07 | Identification of pattern similarities by unsupervised cluster analysis |
| 2012-01-12 | System and method for remote melanoma screening |
| 2011-12-22 | Biomarkers downregulated in prostate cancer |
| Top Inventors for class "Chemistry: molecular biology and microbiology" | |
| Rank | Inventor's name |
|---|---|
| 1 | Marshall Medoff |
| 2 | Anthony P. Burgard |
| 3 | Mark J. Burk |
| 4 | Robin E. Osterhout |
| 5 | Rangarajan Sampath |