Patent application title: METHOD FOR DETERMINATION OF PRESENCE OF CANCER CELL, AND METHOD FOR DETERMINATION OF PROGNOSIS OF CANCER PATIENT
Inventors:
Ayako Sakai (Kobe-Shi, JP)
Ayako Sakai (Kobe-Shi, JP)
Atsushi Kaneda (Bunkyo-Ku, JP)
Kouichi Yagi (Bunkyo-Ku, JP)
Hiroyuki Aburatani (Bunkyo-Ku, JP)
Assignees:
SYSMEX CORPORATION
THE UNIVERSITY OF TOKYO
IPC8 Class: AC12Q168FI
USPC Class:
506 2
Class name: Combinatorial chemistry technology: method, library, apparatus method specially adapted for identifying a library member
Publication date: 2012-07-12
Patent application number: 20120178634
Abstract:
The present invention relates to a method for determination of the
presence or absence of cancer cells in a biological sample or a method
for determination of the progonsis of a colorectal cancer patient based
on a result obtained by extracting DNA from a biological sample and
analyzing methylation status of a marker gene in the DNA.Claims:
1. A method for determination of the presence or absence of cancer cells
in a biological sample obtained from a subject comprising the steps of:
extracting DNA from the biological sample; analyzing methylation status
of a CpG site in at least one gene selected from a group consisting of
COL4A2, AOX1, DUSP26, EDIL3, EFHD1, ELMO1, STOX2 and ZNF447 contained in
the DNA obtained from the step of extracting; and determining the
presence or absence of cancer cells in the biological sample based on a
result obtained from the step of analyzing.
2. The method according to claim 1, wherein in the step of analyzing, the presence or absence of methylation in at least one CpG site is analyzed.
3. The method according to claim 2, wherein in the step of determining, it is determined that cancer cells are present in the biological sample when the result shows the presence of a methylated CpG site.
4. The method according to claim 1, wherein in the step of analyzing, methylation rate of the gene is analyzed.
5. The method according to claim 4, wherein in the step of determining, it is determined that cancer cells are present in the biological sample when the methylation rate obtained in the step of analyzing is higher than a pre-determined cut-off value.
6. A method for determination of the progonsis of a colorectal cancer patient comprising the steps of: extracting DNA from a biological sample obtained from the patient; analyzing methylation status of a CpG site in at least one gene selected from the group consisting of ID4, LOX and MYOCD contained in the DNA obtained from the step of extracting; and determining the progonsis of the patient based on a result obtained from the step of analyzing.
7. The method according to claim 6, wherein in the step of analyzing, the presence or absence of methylation in at least one CpG site is analyzed.
8. The method according to claim 7, wherein in the step of determining, it is determined that the colorectal cancer patient has a favorable prognosis when the result shows the presence of a methylated CpG site.
9. The method according to claim 6, wherein in the step of analyzing, methylation rate of the gene is analyzed.
10. The method according to claim 9, wherein in the step of determining, it is determined that the colorectal cancer patient has a favorable prognosis when the methylation rate obtained in the step of analyzing is higher than a pre-determined cut-off value.
11. A marker gene for determination of the presence or absence of cancer cells by methylation analysis, selected from the group consisting of COL4A2, AOX1, DUSP26, EDIL3, EFHD1, ELMO1, STOX2 and ZNF447.
12. A marker gene for determination of the progonsis of a colorectal cancer patient by methylation analysis, selected from the group consisting of ID4, LOX and MYOCD.
Description:
CROSS-REFERENCE TO RELATED APPLICATION
[0001] This is a continuation of Application of PCT/JP2010/061164, filed on Jun. 30, 2010, now abandoned.
BACKGROUND OF THE INVENTION
[0002] 1. Field of the Invention
[0003] The present invention relates to a method for determination of the presence of cancer cells in a biological sample, to a method for determination of the prognosis of a patient having cancer, specifically colorectal cancer, and to marker genes used for these methods.
[0004] 2. Description of the Related Art
[0005] Genomic DNAs of higher eukaryotes may sometimes undergo methylation in the 5-position of C (cytosine) among other bases constituting DNAs. Such DNA methylation in higher eukaryotes functions as a mechanism for suppression of expression of genetic information. For example, when a region containing many CpGs (CpG islands), which is often found in promoter regions of certain genes, is methylated, transcription of these genes may be suppressed. On the other hand, when a CpG island is not methylated, a transcription factor can bind to the promoter region and the gene can be transcribed.
[0006] Accordingly, DNA methylation is one of control mechanisms of gene expression. DNA methylation plays important roles in various physiological and pathological phenomena such as early embryonic development, expression of tissue specific genes, genomic imprinting and X chromosome inactivation which are characteristic to mammals, stabilization of chromosomes, synchronization of DNA replication and the like.
[0007] It has been recently revealed that gene silencing due to DNA methylation is involved in cancer development and progression (see Feinberg A P. and Tycko B., Nat Rev Cancer, Vol. 4, 143-153 (2004); and Jones P A. and Baylin S B., Cell, Vol. 128, 683-692 (2007)).
[0008] In the medical field, in order to decide therapeutic strategy for cancer, not only early detection of cancer but also prediction on possibilities of post-operative cancer recurrence or metastasis or on post-operative survival rate of patients for a predetermined period is important; thus it is important to establish a method for determination of prognosis. Prognosis has been conventionally determined based on the evaluation on differentiation states of tumor tissues obtained by operations or biopsies, although it has been unknown whether or not differentiation states is an independent prognosis factor. In addition, histological determination of differentiation states relies on subjective decisions by observers, making the prognosis determination inaccurate.
[0009] Especially in the case of colorectal cancer which is mainly represented by well-differentiated adenocarcinoma rather than moderately- or poorly-differentiated adenocarcinoma, prognosis determination may take little account of histology itself. Prognosis determination of colorectal cancer has been difficult because differentiation states of some cases are difficult to be evaluated, making histological diagnosis ambiguous (see Japanese Unexamined Patent Publication Nos. 2001-165933 and 2005-69846).
SUMMARY OF THE INVENTION
[0010] In view of foregoing, an object of the present invention is to provide a method for convenient determination of the presence or absence of cancer cells and a method for determination of the progonsis of a cancer patient by analyzing methylation status of a DNA in a biological sample.
[0011] The present inventors have investigated for genes whose methylation status is specific for genomic DNA of cancer patients by comparing methylation status of CpG sites of genomic DNAs of cancer patients and non-cancer subjects, and saw the opportunity to use identified genes for genetic markers of cancer.
[0012] The present inventors have first identified genes whose promoter region is methylated from genomic DNAs obtained from cell lines.
[0013] The present inventors then selected, among the identified genes whose promoter region is methylated, the genes whose expression is low or absent in the cell lines as silencing genes.
[0014] The present inventors have further analyzed methylation status of the silencing genes in cancer tissues and normal tissues, identified the genes whose extent of methylation is different between these tissues and found that these genes can be used as marker genes for determination of the presence of cancer cells in biological samples, thereby completing the present invention.
[0015] In addition, the present inventors have found that colorectal cancer patients having certain methylated genes among the silencing genes correspond to the cases of high microsatellite instability (hereinafter also referred to as "MSI"). It is generally known that colorectal cancer patients with high MSI have a favorable prognosis (see Popat S. et al., J Clin Oncol, vol. 23, 609-613 (2005)). The present inventors have found that these genes can be used as marker genes for determination of the progonsis of colorectal cancer patients, thereby completing the present invention.
[0016] Accordingly, the present invention provides a method for determination of the presence or absence of cancer cells in a biological sample obtained from a subject comprising the steps of:
[0017] extracting DNA from the biological sample;
[0018] analyzing methylation status of a CpG site in at least one gene selected from a group consisting of collagen, type IV, alpha 2 (COL4A2); aldehyde oxidase 1 (AOX1); dual specificity phosphatase 26 (DUSP26); EGF-like repeats and discoidin 1-like domains 3 (EDIL3); EF-hand domain family, member D1 (EFHD1); engulfment and cell motility 1 (ELMO1); storkhead box 2 (STOX2); and zinc finger protein 447 (ZNF447) contained in the DNA obtained from the step of extracting; and
[0019] determining the presence or absence of cancer cells in the biological sample based on a result obtained from the step of analyzing.
[0020] The present invention also provides a method for determination of the progonsis of a colorectal cancer patient comprising the steps of:
[0021] extracting DNA from a biological sample obtained from the patient;
[0022] analyzing methylation status of a CpG site in at least one gene selected from the group consisting of inhibitor of DNA binding 4, dominant negative helix-loop-helix protein (1D4); lysyl oxidase (LOX); and myocardin (MYOCD) contained in the DNA obtained from the step of extracting; and
[0023] determining the progonsis of the patient based on a result obtained from the step of analyzing.
[0024] The present invention further provides a marker gene for determination of the presence or absence of cancer cells by methylation analysis, selected from the group consisting of AOX1, COL4A2, DUSP26, EDIL3, EFHD 1, ELMO 1, STOX2 and ZNF447.
[0025] The present invention also provides a marker gene for determination of the progonsis of a colorectal cancer patient by methylation analysis, selected from the group consisting of ID4, LOX and MYOCD.
[0026] According to the method for determination of the presence or absence of cancer cells in a biological sample (hereinafter also referred to as "the present method 1") and the method for determination of the progonsis of a colorectal cancer patient (hereinafter also referred to as "the present method 2") of the present invention, the presence or absence of cancer cells and the progonsis of colorectal cancer patients can be conveniently determined by analyzing methylation status of the marker gene for determination of the presence or absence of cancer cells and the marker gene for determination of the progonsis of the present invention.
BRIEF DESCRIPTION OF THE DRAWINGS
[0027] FIG. 1 is schematic representations showing principle of MassARRAY® analysis;
[0028] FIG. 2 is a representation showing results of agarose gel electrophoresis after methylation specific PCR (MSP) using the primer set for COL4A2 in Example 4;
[0029] FIG. 3 is graphs showing band intensities of agarose gel electrophoresis after MSP using the primer set for COL4A2 in Example 4;
[0030] FIG. 4 is a representation showing results of agarose gel electrophoresis after MSP using the primer set for AOX1 in Example 4;
[0031] FIG. 5 is graphs showing band intensities of agarose gel electrophoresis after MSP using the primer set for AOX1 in Example 4;
[0032] FIG. 6 is a representation showing results of agarose gel electrophoresis after MSP using the primer set for DUSP26 in Example 4;
[0033] FIG. 7 is graphs showing band intensities of agarose gel electrophoresis after MSP using the primer set for DUSP26 in Example 4;
[0034] FIG. 8 is a representation showing results of agarose gel electrophoresis after MSP using the primer set for ELMO1 in Example 4;
[0035] FIG. 9 is graphs showing band intensities of agarose gel electrophoresis after MSP using the primer set for ELMO1 in Example 4;
[0036] FIG. 10 is a representation showing results of agarose gel electrophoresis after MSP using the primer set for STOX2 in Example 4;
[0037] FIG. 11 is graphs showing band intensities of agarose gel electrophoresis after MSP using the primer set for STOX2 in Example 4;
[0038] FIG. 12 is a representation showing results of agarose gel electrophoresis after MSP using the primer set for EDIL3 in Example 4;
[0039] FIG. 13 is graphs showing band intensities of agarose gel electrophoresis after MSP using the primer set for EDIL3 in Example 4;
[0040] FIG. 14 is a representation showing results of agarose gel electrophoresis after MSP using the primer set for ZNF447 in Example 4;
[0041] FIG. 15 is graphs showing band intensities of agarose gel electrophoresis after MSP using the primer set for ZNF447 in Example 4;
[0042] FIG. 16 is a representation showing results of agarose gel electrophoresis after MSP using the primer set for EFHD1 in Example 4;
[0043] FIG. 17 is graphs showing band intensities of agarose gel electrophoresis after MSP using the primer set for EFHD1 in Example 4;
[0044] FIG. 18 is a representation showing results of agarose gel electrophoresis after MSP using the primer set for COL4A2 in Example 5;
[0045] FIG. 19 is graphs showing band intensities of agarose gel electrophoresis after MSP using the primer set for COL4A2 in Example 5;
[0046] FIG. 20 is a representation showing results of agarose gel electrophoresis after MSP using the primer set for AOX1 in Example 5;
[0047] FIG. 21 is graphs showing band intensities of agarose gel electrophoresis after MSP using the primer set for AOX1 in Example 5;
[0048] FIG. 22 is a representation showing results of agarose gel electrophoresis after MSP using the primer set for STOX2 in Example 5; and
[0049] FIG. 23 is graphs showing band intensities of agarose gel electrophoresis after MSP using the primer set for STOX2 in Example 5.
DETAILED DESCRIPTION OF THE EMBODIMENTS
[0050] As used herein, "CpG site" means a site in a base sequence where cytosine (C) and guanine (G) are adjacent in this order from 5'-3' direction. A letter "p" in "CpG" represents a phosphodiester bond between cytosine and guanine.
[0051] It is known that mammalian genomic DNA undergoes methylation modification in CpG sites. It is also known that CpG sites are mainly found in promoter regions of genes. As used herein, "CpG site" is intended to include all CpG sites present in all regions involved in expression of a gene in question including the base sequence of the gene and the promoter region of the gene.
[0052] As used herein, "analyze methylation status" is intended to mean analysis of presence or absence of methylation in at least one CpG site in a marker gene, or analysis of rate of methylated CpG sites relative to all CpG sites or certain CpG sites in the marker gene, i.e. analysis of methylation rate.
[0053] Methylation rate also means a value obtained from calculation of an area ratio between a peak derived from a methylated DNA fragment and a peak derived from a non-methylated DNA fragment of a marker gene resulting from analysis of methylation status of DNA by MassARRAY® which is described hereinafter. According to MassARRAY® analysis, a plurality of CpG sites in the DNA fragment is collectively analyzed as a "CpG unit" and methylation rate is calculated from an area ratio between the respective resulting peaks.
[0054] As used herein, "determine the prognosis of a colorectal cancer patient" intends to determine the vital prognosis of the colorectal cancer patient. When a colorectal cancer patient "has a favorable prognosis", the colorectal cancer patient has a favorable vital prognosis, and preferably a favorable survival rate or event-free survival for a predetermined period (preferably 5 to 10 years) after the definitive diagnosis or operation.
[0055] The term "microsatellite" means a repetitive sequence, particularly a repetitive sequence consisting of a unit of a few bases, located on a genome of a nucleus or organelles of a cell.
[0056] In tumor cells, control mechanisms of DNA replication, particularly a mismatch correction pathway is damaged and therefore the number of microsatellites increases or decreased with high frequency upon mitoses of tumor cells. This instability of the number of microsatellites is referred to as "microsatellite instability (MSI)".
[0057] MSI can be determined by analyzing base sequences of five MSI markers (BAT25, BAT26, D5S346, D2S123 and D17S250) recommended by NCI (National Cancer Institute) Workshop (see Boland C. R. et al., Cancer Res, vol. 58, 5248-5257 (1998)).
[0058] MSI-High (MSI-H) is assigned when MSI is detected in two or more markers among above five markers, MSI-Low (MSI-L) when MSI is detected in one of the markers and microsatellite stable (MSS) when no MSI is detected in any of these markers.
[0059] The marker genes for determination of the presence or absence of cancer cells used in the present method 1 are COL4A2, AOX1, DUSP26, EDIL3, EFHD1, ELMO1, STOX2 and ZNF447.
[0060] The above marker genes have been identified from biological samples derived from colorectal cancer. Esteller M. reports that many of the genes which are methylated in one type of malignant tumor are found to have abnormal methylation also in other types of malignant tumors (see Nature Review Genetics, Vol. 8, 286-298 (2007)).
[0061] Accordingly, the above marker genes may be methylated in various carcinomas. Thus, the present method 1 utilizing these marker genes is predicted to allow determination of the presence or absence of cancer cells derived from not only colorectal cancer but also gastric cancer, lung cancer, breast cancer, oral cancer, prostate cancer, renal cancer, bladder cancer, uterine cancer, ovarian cancer, leukemia and the like.
[0062] In the step of extraction of the present method 1, DNA is extracted from a biological sample obtained from a subject.
[0063] The biological sample includes any sample containing DNA of a subject without limitation and is preferably a sample containing genomic DNA, e.g. a clinical specimen. The clinical specimen specifically includes blood, serum, lymphocytes, urine, nipple discharge, tissues obtained from operations or biopsies.
[0064] DNA can be extracted from a biological sample by well-known extraction methods including, for example, a method comprising mixing the biological sample with a treatment solution containing a surfactant for solubilizing cells or tissues (sodium cholate, sodium dodecyl sulfate etc.), physically treating (agitation, homogenization, ultrasonication etc.) the mixture to release DNA contained in the biological sample into the solution, centrifuging the solution and obtaining the supernatant, and extracting the supernatant with phenol/chloroform. The obtained DNA may be further purified according to well-known methods. The extraction and purification of DNA from a biological sample can also be carried out with commercially available kits.
[0065] It is preferred that the step of extracting further comprises the step of fragmenting the extracted DNA. Fragmentation of DNA contained in a biological sample into an appropriate length may facilitate the procedures of MeDIP and bisulfite treatment described hereinafter in the next step of analyzing methylation status.
[0066] Fragmentation of DNA can be carried out by ultrasonication, alkaline treatment, restriction enzyme treatment and the like. For example, DNA can be fragmented by alkaline treatment with sodium hydroxide by adding a solution of sodium hydroxide to the final concentration of 0.1 to 1.0N to a DNA solution and incubating the mixture at 10 to 40° C. for 5 to 15 min. Restriction enzyme treatment nay be carried out with a restriction enzyme appropriately selected according to the base sequence of DNA, e.g. MseI or BamHI.
[0067] In the step of analyzing of the present method 1, methylation status of a CpG site in at least one gene selected from the group consisting of COL4A2, AOX1, DUSP26, EDIL3, EFHD1, ELMO1, STOX2 and ZNF447, among genes comprised in the extracted DNA.
[0068] In this step of analyzing, presence or absence of methylation in at least one CpG site in the above marker gene may be analyzed. In this case, more than one CpG site is preferably analyzed for methylation in order to improve the determination accuracy in the subsequent step of determining.
[0069] In this step of analyzing, methylation rate of the above marker gene may be analyzed.
[0070] The marker gene to be analyzed may be any one of the above nine genes. However, in order to improve the determination accuracy in the subsequent step of determining, more than one marker gene is preferably analyzed.
[0071] The base sequences of the above marker genes are well-known. The base sequences are available from well-known databases such as those provided by Unigene (National Center for Biotechnology Information (NCBI)). Unigene codes, NCBI codes and Sequence ID Numbers of the above marker genes are shown in Table 1.
TABLE-US-00001 TABLE 1 Gene Unigene NCBI symbol code code SEQ ID NO: COL4A2 Hs.508716 NM_001846.2 84 AOX1 Hs.406238 NM_001159.3 85 DUSP26 Hs.8719 NM_024025.1 86 EDIL3 Hs.482730 NM_005711.3 87 EFHD1 Hs.516769 NM_025202.3 88 ELMO1 Hs.656638 NM_014800.9 89 STOX2 Hs.696657 NM_020225.1 90 ZNF447 Hs.235390 NM_001145542.1 91 ID4 Hs.519601 NM_001546.2 92 LOX Hs.102267 NM_002317.4 93 MYOCD Hs.567641 NM_001146313.1 94
[0072] Many methods are well-known for analyzing methylation status of CpG sites in genes. Any analyzing methods may be used in the step of analyzing without limitation, however, the step preferably comprises the step of distinguishing between methylated DNA and non-methylated DNA, the step of amplifying DNA and the step of separately detecting methylated DNA and non-methylated DNA.
[0073] The step of distinguishing between methylated DNA and non-methylated DNA may include methylation sensitive restriction enzyme treatment, MeDIP, bisulfite treatment and the like.
[0074] The step of amplifying DNA may include PCR amplification, quantitative PCR amplification, IVT (in vitro transcription) amplification, SPIA® amplification and the like.
[0075] The step of separately detecting methylated DNA and non-methylated DNA may include electrophoresis, sequencing, microarray analysis, mass spectrometry and the like.
[0076] The above "MeDIP" is a method for concentrating methylated DNA in samples by immunoprecipitation using anti-methylated cytosine antibody, anti-methylated cytidine antibody or an antibody that specifically recognizes a methylated DNA-binding protein. The concentrated methylated DNA is subjected to amplification by PCR amplification or IVT amplification and then analyzed for DNA methylation using microarray; these procedures are called as MeDIP-chip method.
[0077] The above "bisulfite treatment" is a treatment for converting non-methylated cytosine (C) in DNA to uracil by deamination after addition of a solution of a bisulfite such as sodium, potassium, calcium or magnesium bisulfite in a solvent to a DNA solution.
[0078] Bisulfites do not affect methylated cytosines, resulting in the absence of base conversion as described above. Thus, difference in methylation status in DNA can be converted into difference in base sequences (C to U) after the bisulfite treatment.
[0079] Non-methylated cytosine in DNA can be converted to uracil by the bisulfite treatment followed by sequencing of the DNA and detection of difference in base sequences to analyze methylation status of the DNA. These procedures are called as bisulfite sequencing.
[0080] Methylation status of DNA can also be analyzed based on presence or absence of PCR products after PCR amplification using specific primers for a base sequence which is different in methylated DNA and non-methylated DNA. This method is called as methylation specific PCR (MSP).
[0081] Methylated DNA can be analyzed by utilizing the bisulfite treatment in other known methods than the above such as COBRA (Combined Bisulfite Restriction Analysis), Methylation-sensitive Single-Nucleotide Primer Extension, quantitative MSP, pyrosequencing and the like.
[0082] The DNA in which non-methylated cytosine is converted to uracil by the above bisulfite treatment is then used as a template in PCR amplification using primers specific for a base sequence of a target gene and the resulting PCR product is further subjected to IVT amplification, thereby converting methylated cytosine and uracil to guanine (G) and adenine (A), respectively. The resulting IVT product is then cleaved with RNase A and the difference in mass between G and A (16 kDa) of the obtained nucleic acid fragments is detected in a MALDI-TOF (matrix assisted laser desorption/ionization-time-of-flight) mass spectrometer, thereby allowing analysis of methylation status of DNA. This method is called as MassARRAY® analysis (see FIGS. 1A and 1B).
[0083] When, for example, one CpG site in a DNA fragment in a sample is methylated, a peak obtained in MassARRAY® shifts 16 kDa toward the higher mass side (right hand side) (see the left panel in FIG. 1C). When two CpG sites are methylated in the analysis of a DNA fragment having more than one CpG site, for example, the shift is 32 kDa (see the right panel in FIG. 1C) and when three CpG sites are methylated, the shift is 48 kDa.
[0084] In MassARRAY® analysis, more than one CpG site in a DNA fragment to be analyzed are collectively analyzed as a "CpG unit", therefore it is not possible to specify which CpG sites are methylated.
[0085] When the analysis employs PCR amplification, primers for the amplification may be appropriately designed by a person skilled in the art according to the base sequence of a gene to be analyzed. However, in order to carry out quantitative methylation analysis, the primers preferably contain no CpG site or one CpG site in their 5' side. The primers for amplification may be optionally added with a tag sequence, a T7 promoter sequence and the like.
[0086] When methylation of the marker gene is analyzed with microarray, the microarray to be used may be prepared by immobilizing one or more nucleic acid probes complementary to the base sequence of the marker gene on a substrate using a well-known method in the art. Commercially available microarrays may also be used.
[0087] In the analysis using microarray, DNA contained in a biological sample is preferably labeled with a labeling substance well-known in the art. Thus, the present method 1 preferably comprises the additional step of labeling the extracted DNA. The step of labeling is preferably carried out after the step of amplification of DNA because all DNA contained in the biological sample may be labeled.
[0088] The labeling substance may include fluorescent substances, haptens such as biotin, radioactive substances and the like. The fluorescent substances include Cy3, Cy5, Alexa Fluor®, FITC and the like. The labeling of DNA to be analyzed facilitates measurement of signal obtained from the probes on microarray. The method for labeling DNA with the labeling substance is well-known in the art.
[0089] Signal may be any signal that is appropriate according to the type of microarrays. Signal may be, for example, electric signal generated upon hybridization of a DNA fragment with a probe on a microarray, or fluorescence or luminescence generated from the labeling substance when DNA to be analyzed is labeled as described above.
[0090] The above signals may be detected with a scanner equipped with conventional microarray instruments. The scanner may include, for example, GeneChip® Scanner 3000 7G (Affymetrix, Inc.).
[0091] In the step of determining of the present method 1, presence or absence of cancer cells in the biological sample is determined based on a result obtained from the step of analyzing. In the step of determining, it may be determined that cancer cells are present in the biological sample obtained from a subject when the result showing that a CpG site is methylated in the marker gene is obtained. The determination may be made based on the result of one CpG site located in the marker gene. However, in order to improve the determination accuracy, the determination is preferably made based on the result of more than one CpG site.
[0092] In the step of determining, it may be determined that cancer cells are present in the biological sample obtained from a subject when methylation rate of the marker gene obtained in the step of analyzing is higher than a pre-determined cut-off value. The cut-off value may be appropriately determined without limitation and is preferably in the range of 1 to 40%.
[0093] In the step of extracting of the present method 2, DNA is extracted from a biological sample obtained from a colorectal cancer patient. The colorectal cancer patient may be pre-operative or post-operative and may be receiving or have received chemotherapy.
[0094] The biological sample includes any sample containing DNA of a colorectal cancer patient without limitation and is preferably a sample containing genomic DNA, e.g. a clinical specimen. The clinical specimen specifically includes blood, serum, lymphocytes, urine, nipple discharge, tissues obtained from operations or biopsies.
[0095] When the biological sample obtained is a tissue, the tissue preferably contains cancer cells.
[0096] In the step of extracting, DNA can be extracted from the biological sample in the same manner as the step of extracting of the present method 1.
[0097] The step of extracting preferably comprises, as similar to the step of extracting of the present method 1, the additional step of fragmenting DNA by ultrasonication, alkaline treatment, restriction enzyme treatment and the like.
[0098] In the step of analyzing of the present method 2, methylation status of a CpG site in at least one gene selected from the group consisting of ID4, LOX and MYOCD comprised in DNA obtained from the step of extracting is analyzed.
[0099] In this step of analyzing, presence or absence of methylation in at least one CpG site in the above marker gene may be analyzed. In this case, more than one CpG site is preferably analyzed for methylation in order to improve the determination accuracy in the subsequent step of determining.
[0100] In this step of analyzing, methylation rate of the above marker gene may be analyzed.
[0101] The marker gene to be analyzed may be any one of the above three genes. However, in order to improve the determination accuracy in the subsequent step of determining, more than one marker gene is preferably analyzed.
[0102] The base sequences of the above three marker genes are well-known and are available from well-known databases such as Unigene described above. Unigene codes of these three marker genes are shown in Table 1.
[0103] The step of analyzing of the present method 2 can be carried out in the similar manner as described for the step of analyzing of the present method 1. Any analysis methods may be used in the step of analyzing without limitation, however, the step preferably comprises the step of distinguishing between methylated DNA and non-methylated DNA, the step of amplifying DNA and the step of separately detecting methylated DNA and non-methylated DNA.
[0104] In the step of determining of the present method 2, the progonsis of the cancer patient is determined based on a result obtained from the step of analyzing.
[0105] In the step of determining, it may be determined that the colorectal cancer patient has a favorable prognosis when the result showing that a CpG site is methylated in the marker gene is obtained. The determination may be made based on the result of one CpG site located in the marker gene. However, in order to improve the determination accuracy, the determination is preferably made based on the result of more than one CpG site.
[0106] In the step of determining, it may be determined that the colorectal cancer patient has a favorable prognosis when methylation rate of the marker gene obtained in the step of analyzing is higher than a predetermined cut-off value. The cut-off value may be appropriately determined without limitation and is preferably in the range of 1 to 40%.
[0107] The present invention is further described in detail referring to the following Examples, which do not limit the present invention.
EXAMPLE 1
Investigation for Marker Gene Candidates by MeDIP-Chip
[0108] The present inventors thought that methylated CpG sites located within 1 kb upstream and downstream of a transcription initiation site of genes are important for gene expression and that genes having a candidate methylation site (CMS) in such region may be possible markers. Thus, they investigated for such genes from a colorectal cancer cell line HCT116 by MeDIP-chip technique.
[0109] The specific procedures in Example 1 followed the instructions attached to the kits and reagents and the description by Hayashi H. et al., Hum Genet., vol. 120, 701-711 (2007).
[0110] (1) MeDIP Procedure
[0111] Genomic DNA was extracted from the colorectal cancer cell line HCT116 by using QIAamp DNA Micro kit (QIAGEN) according to the attached instruction. The obtained genomic DNA (6 μg) was processed in an ultrasonicator UD-201 (Tomy Seiko Co., Ltd.) for 20 seconds to fragment the genomic DNA to the size of 200 to 800 bp. The DNA fragments were denatured by heating them at 95° C. for 10 minutes followed by rapid cooling to 4° C. to obtain single-stranded genomic DNA.
[0112] The resulting denatured DNA (1 μg) was diluted with 300 μl immunoprecipitation buffer (20 mM Tris-HCl, pH 8.0; 2 mM EDTA, pH 8.0; 150 mM NaCl; and 1% Triton X-100), and added with 103 μl of a suspension of Protein A Sepharose beads (GE Healthcare) before rotation at 4° C. for 30 minutes for pre-clear treatment. The supernatant was collected after centrifugation.
[0113] The above suspension of beads had the following composition.
[0114] Immunoprecipitation buffer: 50 μl
[0115] 50% Protein A Sepharose beads: 50 μl
[0116] BSA solution (Sigma): 1 μl
[0117] tRNA solution (Sigma): 1 μl
[0118] Protease inhibitor (Sigma): 1 μl
[0119] To the collected supernatant was added a solution of anti-methylated cytosine antibody BI-MECY-0500 (Eurogentec) previously subjected to rotation at 4° C. for 30 minutes and the mixture was subjected to rotation at 4° C. for 3 hours.
[0120] The solution of the antibody had the following composition.
[0121] Immunoprecipitation buffer: 450 μl
[0122] 50% Protein A Sepharose beads: 50 μl
[0123] Anti-methylated cytosine antibody: 10 μg
[0124] BSA solution: 1 μl
[0125] tRNA solution: 1 μl
[0126] Protease inhibitor: 1 μl
[0127] Beads were collected by centrifugation, washed twice with the immunoprecipitation buffer and three times with a TE buffer (10 mM Tris-HCl, pH 8.0 and 1 mM EDTA, pH 8.0) followed by elution with an elution buffer (25 mM Tris-HCl, pH 8.0; 10 mM EDTA, pH 8.0; and 0.5% SDS) to obtain methylated genomic DNA precipitated as a complex with the anti-methylated cytosine antibody and beads.
[0128] To the resulting solution of methylated genomic DNA was added DTT to the final concentration of 250 nM and the mixture was subjected to rotation at room temperature for 30 minutes before incubation at 65° C. for 30 minutes. The solution was subjected to phenol/chloroform and ethanol precipitation to purify methylated genomic DNA derived from HCT116 cells.
[0129] (2) IVT Amplification
[0130] The methylated genomic DNA obtained in the above (1) was subjected to dephosphorylation of DNA terminal with CIP (Calf intestine phosphatase; New England Biolab) before attachment of dTTP to the 3' terminal of the DNA using TdT (Terminal transfer; ROCHE).
[0131] A T7-polyA primer was annealed to the obtained DNA and double-stranded DNA was synthesized with DNA polymerase I (Invitrogen). The sequence of the T7-polyA primer is shown below.
TABLE-US-00002 (SEQ ID NO: 83) 5'-GCATTAGCGGCCGCGAAATTAATACGACTCACTATAGGGA G(A)18B-3'
[0132] The resulting double-stranded DNA to which the T7 promoter sequence was added was used as a template in linear amplification using T7RNA polymerase (MEGAscript® T7 kit; Ambion) before purification with RNeasy Mini kit (QIAGEN) to obtain cRNA.
[0133] The cRNA was used as a template in order to obtain cDNA with SuperScript® II RT (Invitrogen) and random primers (Invitrogen).
[0134] The T7-polyA primer was annealed to the cDNA and subjected to reactions with DNA polymerase I and then with T4 DNA polymerase (NEB) to synthesize double-stranded DNA.
[0135] The double-stranded DNA to which the T7 promoter sequence was added was used as a template in linear amplification using T7RNA polymerase (MEGAscript® T7 kit) before purification with RNeasy Mini kit to obtain cRNA.
[0136] The cRNA was used as a template in order to obtain cDNA with SuperScript® II RT (Invitrogen) and random primers (Invitrogen).
[0137] The cDNA was subjected to reactions with DNA polymerase I, E. coli DNA ligase (Invitrogen) and then RNase H (Ambion) to synthesize double-stranded DNA.
[0138] The double-stranded DNA was treated with RNase H and RNase cocktail (Ambion) to degrade RNA before purification of the double-stranded DNA with QIAquick Purification kit (QIAGEN).
[0139] (3) Microarray Analysis
[0140] The double-stranded DNA amplified from methylated genomic DNA derived from HCT116 cells according to the above (2) was fragmented with DNase I (Invitrogen) to the size of 50 to 100 by before biotin-labeling with Biotin-N11-ddATP (Perkin Elmer).
[0141] The DNA fragments labeled with biotin were brought into contact with GeneChip® Human Promoter 1.0R Array (Affymetrix, Inc.) for hybridization with probes on the microarray. The subsequent staining, washing and scanning (measurement of signal) were carried out according to the instructions provided by Affymetrix, Inc.
[0142] The values obtained by signal measurement were analyzed by Wilcoxon rank-sum test in the window of 550 bp. The regions having less than 0.01 of significance probability (p<0.01) were considered as candidate methylation sites (CMS) where probes on the microarray specifically bound to the methylated DNA fragments.
[0143] As a result, 3814 genes were obtained as the genes having CMS within 1 kb upstream and downstream from a transcription initiation site of genes in HCT116 cells.
[0144] (4) Microarray Expression Analysis
[0145] In order to investigate genes whose expression in HCT116 cells is low or absent among the above 3814 genes, microarray analysis was carried out. The microarray used was GeneChip® Human Genome U133 Plus 2.0 Array (Affymetrix, Inc.) onto which probes against 38500 genes including the above 3814 genes were deposited.
[0146] From HCT116 cells, mRNA was extracted with TRIzol (Invitrogen) and subjected to expression analysis. The genes which had a GeneChip® score of less than 70 in the analysis were regarded as silencing genes of HCT116 cells.
[0147] As a result, 2410 genes corresponded to silencing genes.
EXAMPLE 2
Investigation for Marker Gene Candidates by MassARRAY® Analysis
[0148] The present inventors randomly selected 41 genes from 2410 genes obtained in Example 1 as marker gene candidates. Methylation status of the marker gene candidates in colorectal cancer tissues and normal colonic mucosa tissues was analyzed by MassARRAY® analysis (hereinafter also referred to as "mass spectrometry").
[0149] The 41 marker gene candidates are shown in Table 2.
[0150] The specific procedures in Example 2 followed the instructions attached to the kits and reagents and the description by Ehrich M. et al., Proc Natl Acad Sci USA, vol. 102, 15785-15790 (2005) and Coolen M W. et al., Nucleic Acids Res, vol. 35, 119 (2007).
TABLE-US-00003 TABLE 2 Gene No symbol Gene title 1 ABTB2 ankyrin repeat and BTB(POZ) domain containing 2 2 ADAMTS1 ADAM metallopeptidase with thrombospondin type 1 motif, 1 3 AOX1 aldehyde oxidase 1 4 CDO1 cysteine dioxygenese, type1 5 CHFR checkpoint with forkhead and ring finger domains 6 CIDEB cell death-inducing DEFA-like effector b 7 CLDN23 claudin 23 8 COL4A2 collagen, typeIV, alpha 2 9 DUSP26 dual specificity phosphatase 26 10 EDIL3 EGF-like repeats and discoidin 1-like domains 3 11 EFEMP1 EGF-containing fibulin-like extracellular matrix protein 1 12 EFHD1 EF-hand domain family, member D1 13 ELMO1 engulfment and cell motility 1 14 EPHB1 EPH receptor B1 15 FBN2 fibrillin 2 16 FLJ23191 chromosome4 open reading frame 31 17 HAND1 hand and neural crest derivatives expressed 1 18 ID4 inhibitor of DNA binding 4, dominant negative helix-loop-helix protein 19 IGFBP7 insulin-like growth factor binding protein 7 20 IRF8 interferon reguratory factor 8 21 KCNC2 potassium voltage-gated channel, Shaw-related subfamily, member 2 22 KIAA0495 KIAA0495 23 LOX lysyl oxidase 24 MYOCD myocardin 25 PCSK6 proprotein convertase subtilisin/kexin type 6 26 PENK proenkephalin 27 PPP1R14A protein phosphatase 1, regulatory (inhibitor) subunit 14A 28 PPP1R3C protein phosphatase 1, regulatory (inhibitor) subunit 3C 29 SCAM1 sorbin and SH3 domain containing 3 30 SFRP1 secreted frissled-related protein 1 31 SLC30A10 solute carrier family 30, member 8 32 SLC35B3 solute carrier family 35, member B3 33 SPON1 spondin 1, extracellular matrix protein 34 STOX2 storkhead box 2 35 THBD thrombomodulin 36 TLE4 transducin-like enhancer of spilit 4(E(sp1)homolog, Drosophila) 37 TMEFF2 transmembrane protein with EGF-like and two follistatin-like domains 2 38 SPG20 spastic paraplegia 20 39 TSPYL5 TSPY-like 5 40 UCHL1 ubiquitin carboxvl-terminal esterase L1 41 ZNF447 zinc finger protein 447
[0151] (1) Preparation of Test Samples and Control Samples
[0152] As described below, CRC (colorectal cancer) specimen samples and Normal specimen samples were prepared from genomic DNA derived from colorectal cancer tissues and normal colonic mucosa tissues, respectively. In order to prepare a calibration curve for mass spectrometry, 0%, 25%, 50%, 75% and 100% methylated control samples were prepared from control genomic DNA, i.e. peripheral blood lymphocyte genomic DNA.
[0153] (i) DNA Extraction from Colorectal Cancer Tissues and Normal Colonic Mucosa Tissues
[0154] From colorectal cancer tissues obtained from colorectal cancer patients (112 specimens) and normal colonic mucosa tissues (9 specimens), genomic DNA was respectively extracted using QIAamp DNA Micro kit (QIAGEN) and cleaved by ultrasonication in Bioruptor (COSMO BIO Co., Ltd.). The colorectal cancer specimens contained 40% or more cancer cells as determined by histopathological observations of the sections.
[0155] (ii) Preparation of 0%, 25%, 50%, 75% and 100% Methylated DNA
[0156] Human peripheral blood lymphocyte genomic DNA was amplified by using GenomiPhi v2 DNA amplification kit (GE Healthcare Life Science). The amplified product is non-methylated DNA. The amplified product was then cleaved by ultrasonication in Bioruptor (COSMO BIO Co., Ltd.) to obtain DNA fragments (0% methylated DNA). A portion of the DNA fragments was reacted with SssI methylase (New England Biolab) and all cytosines were methylated to obtain methylated DNA fragments (100% methylated DNA). The 0% methylated DNA and the 100% methylated DNA were mixed in certain proportions to prepare 25%, 50% and 75% methylated DNAs.
[0157] (iii) Bisulfite Treatment
[0158] The DNAs (1 μg) obtained in the above (i) and (ii) were diluted in 19 μl water, 1 μl of a 6N aqueous solution of sodium hydroxide was added to the final concentration of 0.3 N and the mixture was incubated at 37° C. for 15 minutes in order to denature DNA.
[0159] To the above DNA solutions was added 120 μl of a 3.6 M sodium bisulfite/0.6 M hydroquinone solution, and the mixtures were subjected to bisulfite treatment by performing 15 cycles of 95° C. for 30 seconds and 50° C. for 15 minutes. The reaction solutions were subjected to desalting on Wizard® DNA Clean-up System (Promega) and eluted with 50 μl of TE buffer to obtain the solutions of DNA in which non-methylated cytosine(s) was(were) converted to uracil(s).
[0160] To the DNA solutions was added 5 μl of a 3 N aqueous solution of sodium hydroxide, and the mixture was incubated at room temperature for 5 minutes before DNA purification by ethanol precipitation. Finally, DNAs were dissolved in 80 μl water to obtain CRC specimen samples and Normal specimen samples as well as 0%, 25%, 50%, 75% and 100% methylated control samples.
[0161] (2) PCR and IVT Amplifications
[0162] In this step, methylated cytosine(s) and uracil(s) in the DNAs obtained after conversion of non-methylated cytosine(s) to uracil(s) by bisulfite treatment as described above were converted to guanine(s) and adenine(s), respectively, by PCR amplification and IVT amplification.
[0163] It was confirmed that the primer sets used in PCR amplification could universally amplify both methylated DNA and non-methylated DNA, by MassARRAY® analysis described hereinafter using the control samples obtained above. The sequences of the primer sets (SEQ ID NOs: 1 to 82) for the marker gene candidates are shown in Table 3.
TABLE-US-00004 TABLE 3 Sequence of primer set Gene SEQ SEQ symbol Forward primer ID NO: Reverse primer ID NO: ABTB2 GAATAGTYGTTATAATAGTTGGGATA 1 ACACCTCAAAACRAATACACTTAAC 2 ADAMTS1 GTTTTTTGGGGTTTTAATGT 3 CTCCRACACCACTAACTCCTC 4 AOX1 AGAYGTAAGAGGGTGTGATATAGA 5 AAAAAATAACRAACACCTAAAACC 6 CDO1 TTTGGAGTTATTAGGAATGTATTA 7 TCCTCCRACCCTTTTTATCTA 8 CHFR GGTTATTTTTGATTTTGATTAGG 9 CAAAATCCTTAAAACTTCCAAT 10 CIDEB GGTTGAYGTTAGAATTGAAGAAG 11 CCCACCTAAACCTAAAAACTC 12 CLDN23 GGTTATTTTATTTGGATGGTGT 13 AACTACCTAAACAACTACCTCCTAC 14 COL4A2 TAGYGTAGGATGAGGGAGGT 15 CRCCTTATACAAACTAAAACTACAC 16 DUSP26 TTTTGTAATTGGTGTAGTTTTGA 17 ACTATTTTTAAACCATAACACACAC 18 EDIL3 ATAAAGYGTTGAGGAAAGAGAA 19 CTCTACTCAAACTTTACAAACACT 20 EFEMP1 TAGGAGTTGGTTAGAAGTTGG 21 ACRACTAATTCTCTTTTATCTTATCA 22 EFHD1 GGYGGAGTGTTGTAGAGTTT 23 CCAACTCCTCACTAACCATAAC 24 ELMO1 AATGTGTTTTTGGTTAGTAGGAG 25 AAATAACTCTACCTCTATCCTATACC 26 EPHB1 GGAGTAGTAGTAGATAATTTAGGG 27 TAACTAACAATATAACACCAAAAC 28 FBN2 GGATATTGGAAAGTTGTAAAAG 29 CCRCCCTCTCTCTTACTAAC 30 FLJ23191 GTAGAGGATAAATGAGGAGTTAGAG 31 TCCCTTTCCAAATTCATACC 32 HAND1 GGGAAAGTTTATAGTGGAGAGAG 33 CAAATCATCACTCCTTAAAAATC 34 ID4 GGGTTTGGAGTGGTTAGTTA 35 CRCTCCCTCAACAACCTAAT 36 IGFBP7 GAGAAGGTTATTATTTAGGTTAGTAA 37 ACTACCAACTCTTTCCCTCC 38 IRF8 GTTAGYGGTTTTAGAAGAGGTT 39 CRCCCACTATACCTACCTACC 40 KCNC2 GAGGAGGAGTTGGTTTTTTG 41 AATCTCTTCTACCCCCCATAC 42 KIAA0495 GGYGGGAAAAAGAAGGTTTTATA 43 ACCCRAAAACAAATATTCCAAAATAC 44 LOX TGGTATTGTTTGGTGGAGAT 45 AAACTCAACAAACTAAACACCTA 46 MYOCD GAGGAAAGAAGGAAGGGTTG 47 AATACAAAATCRTCTCTACCAATACC 48 PCSK6 GGTTTTAGGGAGAAGAAGTT 49 RACCTACCTCCCAACATAAA 50 PENK TYGTAGGAATGTTTTTTTTG 51 CTCTTTCCCTTCACATTTCA 52 PPP1R14 AATGGATGAGTGAATGAATGAA 53 ACRAAAACCTAAAACAAACAC 54 PPP1R3C GYGATGTTTAGATAGTTTTTTG 55 ACCACAACTCCAAACCTTAC 56 SCAM1 ATYGTTTTTGTTTTTGTTTTG 57 AACACTAATAACCCCCTACC 58 SFRP1 GTTTTGTTTTTTAAGGGGTGTTGAG 59 ACACTAACTCCRAAAACTACAAAAC 60 SLC30A10 GGTATTYGTTTTTTAGATTGTT 61 AAATAAATCCCACCTCTACAT 62 SLC35B3 GAGGAGGAAGAGGAGGTGAT 63 AAAATCTAAATCCCAAACACAA 64 SPON1 TGTTAGGTATAGAGTAGGTGGT 65 CAACRCTATTTTATTTCCTCC 66 STOX2 GGTTTTAGGTTGGGGTAGTT 67 CCTACACATACATACTCCTACTTACT 68 THBD TAGTTTTTTTTATTAGGATTTTTTT 69 CCCAAACATATTACCCAAAC 70 TLE4 ATGTTTAGTTATTTTTGATTGGTT 71 RCTCAACACAACTCTAACAACAC 72 TMEFF2 TATTTAGGGATTGGGTTTAGTTT 73 CCTCCTTACATCCTTACACCTC 74 SPG20 GGGTAGAATTTAGTTTGAGTAGGT 75 AACTCOCACTCCCTTACACTA 76 TSPYL5 GGAAGAGATGAAATGGTAGTAT 77 TCAAAAACACRCTATAACCCTA 78 UCHL1 YGGTAGAAATAGTTTAGGGAAG 79 TACTCCATACACTCAAAAAACAC 80 ZNF447 TTTATTTYGTTGTTATGGTGTTTA 81 CCTAACCCCTTTCCCTAAC 82
[0164] In the following PCR reactions, the primer sets containing the following tag sequence and T7 promoter sequence at the 5' terminal of forward primers and reverse primers of the above primer sets were used in order to facilitate the subsequent IVT reactions.
TABLE-US-00005 Tag sequence: 5'-AGGAAGAGAG-3' T7 promoter sequence: 5'-CAGTAATACGACTCACTATAGGGAGAAGGCT-3'
[0165] The following reagents were mixed and used for PCR reactions.
TABLE-US-00006 10 × Hot Star buffer (QIAGEN) 0.5 μl 25 mM dNTP mix 0.04 μl Hot Star Taq (5 U/μl) (QIAGEN) 0.04 μl Primer mix 2 μl DNA solution 1 μl Water 1.42 μl Total 5 μl
[0166] With the above reaction solution, PCR reactions were carried out under the following conditions.
[0167] 94° C. for 15minutes;
[0168] 45 cycles of 94° C. for 20 seconds, 52° C. for 30 seconds and 72° C. for 1 minute; and
[0169] 72° C. for 3minutes.
[0170] The PCR products obtained as above were subjected to dephosphorylation reaction using SAP (Shrimp Alkaline Phosphatase) included in MassCLEAVE® Reagent kit (SEQUENOM). The following reaction solution prepared according to the above kit was added and incubated at 37° C. for 3 hours to carry out IVT reaction and specific cleavage at uracil (U) or thymine (T). The obtained cleavage products were purified with Clean Resin (SEQUENOM) and the samples for mass spectrometry were obtained.
TABLE-US-00007 5 × T7 R&DNA polymerase buffer 0.89 μl T Cleavage mix 0.24 μl 100 mM DTT 0.22 μl T7 R&DNA polymerase 0.44 μl RNase A 0.06 μl RNase-free water 3.15 μl Total 5 μl
[0171] As shown in FIG. 1A, it has been known that IVT products are cleaved by RNase A at a position between a base and uracil (U) or thymine (T) adjacent to the base. Base sequences and mass of the cleavage products obtained as above can be predicted from the base sequences of the marker gene candidates. Based on this information, the peaks obtained by the subsequent mass spectrometry can be assigned to the portions of the marker gene candidates having certain base sequences.
[0172] (3) Analysis by Mass Spectrometer MassARRAY® (SEQUENOM)
[0173] (i) Generation of Calibration Curve
[0174] Mass spectrometry analysis was carried out twice independently for each sample for mass spectrometry obtained as the above (2) derived from the specimen samples. Calibration curves were generated for respective primer sets from the analysis results and correlation coefficients were calculated. The calibration curves obtained from control samples amplified with the above primer sets were linear, confirming that the respective primer sets could universally amplify both methylated DNA and non-methylated DNA.
[0175] (ii) Analysis of Samples Derived from Specimen Samples
[0176] The samples for mass spectrometry derived from the specimen samples obtained as the above (2) were analyzed by mass spectrometry and peaks of respective cleavage products were obtained. Each peak obtained was assigned to the portions of the base sequences of the marker gene candidates. For cleavage products derived from the same base sequence, methylation rate was calculated from a ratio between the area of the peak of the cleavage product containing methylated CpG site(s) and the area of the peak of the cleavage product containing no methylated CpG site. This calculation is illustrated by referring to the left panel of FIG. 1C. When the area ratio between the peak of non-methylated cleavage product (left peak) and the peak of methylated cleavage product (right peak) is 1:3, methylation rate of the DNA fragment having the indicated sequence is calculated as 75% (3/(1+3)=0.75). Such calculation of methylation rate was carried out for all cleavage products. In theory, methylation rate is 100% when all CpG sites in a cleavage product are methylated and 0% when all CpG sites are non-methylated.
[0177] The cleavage products having the correlation coefficient of more than 0.9 as calculated in the above (i) for methylation rate obtained as above were used for the subsequent data analysis. The cleavage products were excluded whose methylation rate was calculated in less than 102 specimens (90%) among 112 colorectal cancer tissues.
[0178] In order to take account of the number of CpG sites in each of the marker gene candidates and the number of CpG sites in the cleavage products of the each gene, methylation rate for each marker gene candidate was calculated as a weighted average of the methylation rates of the cleavage products which were not excluded.
[0179] (iii) Setting of Cut-Off Value and Calculation of Methylation Frequency
[0180] According to the methylation rates obtained as above, a cut-off value was set as 35% in order to determine whether or not the marker gene candidate contained in the specimens is methylated. Thus, when methylation rate of a gene is higher than 35%, it is determined that the gene is methylated. This value was set by taking account of the fact that the colorectal cancer specimens had 40% cancer cell content.
[0181] For the colorectal cancer specimens (112 specimens) and normal colonic mucosa specimens (9 specimens), methylation of the above 41 marker gene candidates were determined based on the cut-off value (35%) and methylation rates thereof calculated as above. For each gene, the number of specimens in which the gene is methylated was count among the population of colorectal cancer specimens and the population of normal colonic mucosa specimens, and proportion of methylation-positive specimens relative to the total number of specimens was calculated according to the following equation. The results are shown in Table 4.
(Proportion of methylation-positive specimens) (%)=((Number of methylation-positive specimens in the population)/(Total number of specimens in the population))×100
TABLE-US-00008 TABLE 4 Normal (n = 9) CRC (n = 112) Difference Proportion Proportion Number in of of of methylation methyl- methyl- methyl- frequency ation- ation- ation- between positive positive positive CRC and Gene specimens specimens speci- Normal Group symbol (%) (%) mens (%) A * TSPYL 0% 95% 106 95% * COL4A2 0% 95% 106 95% * ADAMTS1 0% 84% 92 84% * SPG20 0% 80% 90 80% * TMEFF2 0% 73% 81 73% * CIDEB 0% 71% 80 71% * EDIL3 0% 68% 76 68% * EFEMP1 0% 65% 73 65% * PPP1R14A 0% 61% 68 61% * UCHL1 0% 61% 68 61% * HAND1 0% 60% 67 60% * STOX2 0% 59% 64 59% * THBD 0% 57% 64 57% * ELMO1 0% 55% 62 55% * IGFBP7 0% 52% 58 52% * PPP1R3C 0% 51% 57 51% AOX1 0% 48% 54 48% CHFR 0% 38% 43 38% EFHD1 0% 36% 40 36% DUSP26 0% 36% 40 36% SLC30A10 0% 24% 27 24% FLJ23191 0% 22% 24 22% ID4 0% 18% 20 18% EPHB1 0% 15% 17 15% LOX 0% 14% 16 14% MYOCD 0% 14% 16 14% B * SFRP1 22% 100% 112 78% * CDO1 11% 88% 98 77% * FBN2 13% 69% 77 56% * ZNF447 22% 63% 71 41% PENK 56% 100% 112 44% KCNC2 56% 91% 100 35% C TLE4 0% 3% 3 3% PCSK6 100% 98% 108 -2% CLDN23 100% 99% 109 -1% ABTB2 0% 1% 1 1% SCAM1 0% 1% 1 1% SPON1 11% 12% 13 1% KIAA0495 100% 100% 112 0% IRF8F2 0% 0% 0 0% SLC35B3 0% 0% 0 0%
[0182] In Table 4, the 41 genes were classified into three groups A, B and C based on the calculated proportions of methylation-positive specimens. The group A is a group of genes having 0% of the proportion of methylation-positive specimens in the population of normal colonic mucosa specimens (Normal) and 10% or more of the proportion in the population of colorectal cancer specimens (CRC); the group B is a group of genes having more than 0% of the proportion in the population Normal and 30% or more of the difference in the proportions of methylation-positive specimens between CRC and Normal; and the group C is a group of genes having more than 0% of the proportion in the population Normal and less than 30% of the difference in the proportions of methylation-positive specimens between CRC and Normal.
[0183] Among 41 genes shown in Table 4, the genes having 50% or more of the difference in the proportions of methylation-positive specimens between CRC and Normal were selected as possible markers, which are marked with * in Table 4.
[0184] The selected genes are TSPYL, COL4A2, ADAMTS1, SPG20, TMEFF2, CIDEB, EDIL3, EFEMP1, PPP1R14A, UCHL1, HAND 1, STOX2, THBD, ELMO1, IGFBP7, PPP1R3C, SFRP1, CDO1, FBN2 and ZNF447.
[0185] The proportion of methylation-positive specimens was also calculated for each gene when the cut-off value for determination of methylation was set at 10%. The results are shown in Table 5. Again, the genes having 50% or more of the difference in the proportions of methylation-positive specimens between CRC and Normal were selected, which are marked with * in Table 5. The definition for the groups A to C is the same as described above.
[0186] The selected genes are EFHD1, STOX2, ELMO1, CHFR, DUSP26, MYOCD, FLJ23191, LOX, EPHB1, TLE4, TMEFF2, SPG20, EDIL3, PPP1R3C, FBN2, AOX1 and ZNF447.
TABLE-US-00009 TABLE 5 Normal (n = 9) CRC (n = 112) Difference Proportion Proportion Number in of of of methylation methyl- methyl- methyl- frequency ation- ation- ation- between positive positive positive CRC and Gene specimens specimens speci- Normal Group symbol (%) (%) mens (%) A * EFHD1 0% 80% 89 80% * STOX2 0% 80% 86 80% * ELMO1 0% 68% 76 68% * CHFR 0% 62% 69 62% * DUSP26 0% 59% 65 59% * MYOCD 0% 29% 32 29% * FLJ23191 0% 27% 30 27% * LOX 0% 26% 29 26% * EPHB1 0% 23% 26 23% * TLE4 0% 10% 11 10% B * TMEFF2 11% 99% 110 88% * SPG20 11% 92% 103 81% * EDIL3 11% 88% 98 77% * PPP1R3C 11% 80% 89 69% * FBN2 25% 90% 101 65% * AOX1 11% 68% 76 57% * ZNF447 22% 78% 87 56% EFEMP1 44% 92% 103 48% PPP1R14A 50% 87% 97 37% UCHL1 56% 91% 102 35% THBD 56% 90% 101 34% CDO1 67% 99% 110 32% COL4A2 67% 99% 111 32% C CIDEB 67% 94% 105 27% SLC30A10 22% 41% 46 19% ID4 63% 48% 54 -15% PENK 89% 100% 112 11% HAND1 78% 89% 99 11% TSPYL 89% 99% 110 10% ADAMTS1 89% 99% 109 10% SPON1 44% 35% 39 -9% IRF8F2 11% 3% 3 -8% ABTB2 0% 4% 4 4% IGFBP7 89% 92% 102 3% KCNC2 100% 99% 109 -1% SCAM1 0% 1% 1 1% KIAA0495 100% 100% 112 0% SFRP1 100% 100% 112 0% PCSK6 100% 100% 110 0% CLDN23 100% 100% 110 0% SLC35B3 0% 0% 0 0%
[0187] Thus, possible markers selected from these two cut-off values of methylation rate are ADAMTS1, AOX1, CDO1, CHFR, CIDEB, COL4A2, DUSP26, EDIL3, EFEMP1, EFHD 1, ELMO 1, EPHB 1, FBN2, FLJ23191, HAND 1, IGFBP7, LOX, MYOCD, PPP1R14A, PPP1 R3C, SFRP1, STOX2, THBD, TLE4, TMEFF2, SPG20, TSPYL, UCHL1 and ZNF447.
[0188] Among those genes, the genes whose methylation in a certain cancer cells has already been reported are shown in the following Table 6.
TABLE-US-00010 TABLE 6 Gene Related documents suggesting methylation of the gene in cancer symbol Carcinoma Related documents TSPYL {circle around (1)} Glioma {circle around (1)} Cancer Research vol. 66, 7490-7501 (2006) {circle around (2)} Gastric carcinoma {circle around (2)} Laboratory Investigation vol. 88, 153-160 (2008) ADAMTS1 Colorectal cancer, lung cancer and Mol Cancer. vol. 7, 94 (2008) ovarian cancer TMEFF2 Esophageal cancer Oncology Reports, Vol. 21, 1067-1073 (2009) CIDEB Hepatocarcinoma, culture cells Biochem. J. vol. 393, 779-788 (2006) EFEMP1 Breast carcinoma International Journal of Cancer, Vol. 124, Issue 7, 1727-1735 (2009) PPP1R14A Colorectal cancer US2008-221056 (Publication of US patent application) UCHL1 Pancreatic cancer, gastric carcinoma International Journal of Cancer, Vol. 124, Issue 4, 827-833 (2009) HAND1 Gastric carcinoma Cancer Epidemiology Biomarkers & Prevention Vol. 15, 2317-2321 (2006) THBD Gastric carcinoma Clinical Cancer Research Vol. 12, 989-995 (2006) IGFBP7 Colorectal cancer The Journal of Pathology, Vo. 212, Issue 1, 83-90 (2007) PPP1R3C Melanoma Genes, Chromosomes and Cancer, Vol. 48, Issue 1, 10-21 (2009) CHFR Lung cancer Anticancer Research vol. 29, 363-369 (2009) SFRP1 Colorectal cancer Int J Biol Markers. Vol. 24, 57-62 (2009) CDO1 Lung cancer US2007-264659 (Publication of US patent application) FBN2 Esophageal cancer, lung cancer Oncology Reports, Volume 21, 1067-1073 (2009) SPG20 Colorectal cancer, prostate cancer WO2008102002 (Intl. publication), WO2009065511 (Intl. publication)
[0189] Thus, the present inventors excluded the genes shown in Table 6 and identified for the first time COL4A2, AOX1, DUSP26, EDIL3, EFHD1, ELMO1, STOX2 and ZNF447 as marker genes which can be used for determination of the presence or absence of cancer cells.
EXAMPLE 3
Analysis of Correlation Between Methylation of Marker Genes and MSI
[0190] There are many published documents which report on the correlation between MSI and the progonsis of colorectal cancer patients. Generally, it is believed that the cases having high MSI correlate to a favorable prognosis. According to the report by Popat S. et al. (J Clin Oncol, Vol. 23, 609-613 (2005)) who summarized the previously reported data from 32 reports (total 7642 cases among which MSI cases were 1277), it has been understood that the colorectal cancer patients having high MSI have a statistically significant favorable prognosis.
[0191] Accordingly, the present inventors investigated a possible correlation between the proportion of methylation-positive specimens for a marker gene among the above 41 marker genes and MSI.
[0192] (1) Determination for MSI
[0193] In order to analyze MSI of genomic DNA of colorectal cancer tissues (112 specimens) obtained in Example 2 (1) (i), sequencing analysis was carried out for five MSI markers (BAT25, BAT26, D5S346, D2S123 and D17S250) recommended by the NCI Workshop described above.
[0194] The base sequences of these five markers in genomic DNA from each specimen were analyzed with ALF express DNA sequencer (Pharmacia Biotech) and Allele Links software (Pharmacia Biotech).
[0195] MSI-H was assigned to the specimens in which MSI was detected in two or more markers among five, MSI-L to the specimens in which MSI was detected in one marker and MSS to the specimens in which no MSI was detected in any marker. Analysis was repeated at least twice for the markers in which MSI was detected.
[0196] (2) Analysis on Correlation Between Methylation of Marker Genes and MSI
[0197] In order to analyze whether there is a correlation between the population in which a marker gene is methylation-positive and the population having MSI-H, Fisher's exact test was used.
[0198] As shown in below, the analysis showed that the population in which the marker genes ID4, LOX and MYOCD were methylated had a strong correlation with the population of MSI-H. P is the significance probability calculated from the above test. The results are shown in Table 7.
TABLE-US-00011 TABLE 7 Non- Methylated methylated ID4 MSI-H 15 3 Fisher's exact test Other than 5 89 P = 6.9 × 10⁻¹² MSI-H LOX MSI-H 15 3 Fisher's exact test Other than 1 93 P = 8.1 × 10⁻¹⁵ MSI-H MYOCD MSI-H 14 4 Fisher's exact test Other than 2 92 P = 1.4 × 10⁻¹² MSI-H Numbers in the tables correspond to the number of specimens.
[0199] For ID4, among 20 methylated specimens, 15 were MSI-H and among 92 non-methylated specimens, 3 were MSI-H (P=6.9×10⁻¹²).
[0200] For LOX, among 16 methylated specimens, 15 were MSI-H and among 96 non-methylated specimens, 3 were MSI-H (P=8.1×10⁻¹⁵).
[0201] For MYOCD, among 16 methylated specimens, 14 were MSI-H and among 96 non-methylated specimens, 4 were MSI-H (P=1.4×10⁻¹²).
[0202] From the above results, it is suggested that the colorectal cancer patients in which any one of ID4, LOX and MYOCD is methylated may tend to be high in MSI, namely have a favorable prognosis. Thus, it is expected that the progonsis of colorectal cancer patients may be predicted by analyzing methylation status of these three marker genes.
EXAMPLE 4
Detection of Colorectal Cancer Cells by Methylation Specific PCR (MSP)
[0203] (1) Preparation of Specimen Samples
[0204] As described below, a HCT116 sample, a DLD-1 sample, CRC specimen samples 1 to 7 and a Normal specimen sample were prepared from genomic DNAs derived from colorectal cancer cell lines HCT116 and DLD-1, colorectal cancer tissues 1 to 7 taken from colorectal cancer patients, and normal colonic mucosa tissue, respectively.
[0205] (i) Extraction of DNA from Colorectal Cancer Cell Lines, Colorectal Cancer Tissues and Normal Colonic Mucosa Tissue
[0206] DNAs were extracted from each of HCT116, DLD-1, colorectal cancer tissues 1 to 7 and a normal colonic mucosa tissue by using QIAmp DNA Micro kit (QIAGEN) according to the attached instruction. Genomic DNAs extracted from colorectal cancer cell lines, colorectal cancer tissues and the normal colonic mucosa tissue were cleaved by ultrasonication in Bioruptor (COSMO BIO Co., Ltd.).
[0207] (ii) Bisulfite Treatment
[0208] The DNAs (1 μg) obtained in the above (i) were diluted in 19 μl water, 1 μl of a 6N aqueous solution of sodium hydroxide was added to the final concentration of 0.3 N and the mixture was incubated at 37° C. for 15 minutes in order to denature DNA. To the above DNA solutions was added 120 μl of a 3.6 M sodium bisulfite/0.6 M hydroquinone solution, and the mixtures were subjected to bisulfite treatment by performing 15 cycles of 95° C. for 30 seconds and 50° C. for 15 minutes. The reaction solutions were subjected to desalting on Wizard® DNA Clean-up System (Promega) and eluted with 50 μl of TE buffer to obtain the solutions of DNA in which non-methylated cytosine(s) was(were) converted to uracil(s).
[0209] To the DNA solutions was added 5 μl of a 3 N aqueous solution of sodium hydroxide, and the mixture was incubated at room temperature for 5 minutes before DNA purification by ethanol precipitation. Finally, DNAs were dissolved in 80 μl water to obtain the HCT116 sample, the DLD-1 sample, CRC specimen samples 1 to 7 and the Normal specimen sample.
[0210] (2) Preparation of Control Samples
[0211] (i) Preparation of 0% and 100% Methylated DNAs
[0212] Human peripheral blood lymphocyte genomic DNA was amplified by using GenomiPhi v2 DNA amplification kit (GE Healthcare Life Science). The amplified product is non-methylated DNA. The amplified product was then cleaved by ultrasonication in Bioruptor (COSMO BIO Co., Ltd.) to obtain DNA fragments (0% methylated DNA). A portion of the DNA fragments was reacted with SssI methylase (New England Biolab) and all cytosines were methylated to obtain methylated DNA fragments (100% methylated DNA).
[0213] (ii) Bisulfite Treatment
[0214] In the same manner as the bisulfite treatment for preparation of specimen samples described above, 0% methylated DNA and 100% methylated DNA were treated to obtain 0% methylated control sample and 100% methylated control sample.
[0215] (3) Methylation Specific PCR (MSP)
[0216] The specimen samples and control samples obtained as described in the above (1) and (2) (DNAs after bisulfite treatment) were used for MSP. Composition of a PCR reagent, primer sets and PCR conditions are shown below.
[0217] <PCR Reagent>
TABLE-US-00012 DDW (Sterilized water) 15.25 μl 10 × PCR buffer with MgCl2 (Roche) 2.5 μl 1.25 mM dNTP mix 4 μl 10 μM sense primer 1 μl 10 μM antisense primer 1 μl Faststart Taq polymerase (Roche) 0.25 μl Specimen sample 1 μl Total 25 μl
[0218] <Primer Sets>
[0219] Primer sets used in MSP are shown in Table 8. In the third column of Table 3, "M" denotes primers for detection of methylation and "U" denotes primers for detection of non-methylation.
TABLE-US-00013 TABLE 8 SEQ Size of Annealing No. of Gene ID PCR product temperature (° C.) cycles No. symbol Primer NO: Base sequence of primer (bp) (X ° C.) (Y) 1 COL4A2 M COL4A2_MF 95 GGTTCGTTTATTTTGGGTTTC 162 bp 64° C. 34 COL4A2_MR 96 TCCGATCACCCCTACATACG U COL4A2_UF 97 GAGGGAGGTAGTTTATTTTTATTGTT 173 bp 62° C. 34 COL4A2_UR 98 AAAAACCAAACTCCTCAACCA 2 AOX1 M AOX1_MF 99 AAGGGGTCGTTTTTATTTTCGTC 88 bp 63° C. 34 AOX1_MR 100 TCTTCCCGAAACACCAACACG U AOX1_UF 101 AAGAGGGTGTGATATAGATGTTAAGT 131 bp 61° C. 36 AOX1_UR 102 CTTCCCAAAACACCAACACA 3 DUSP26 M DUSP26_MF 103 TCGTGTTTGGTTTGTAAGGC 90 bp 63° C. 34 DUSP26_MR 104 GATCTCACATTCGATAACCCG U DUSP26_UF 105 TGTGTTTGGTTTGTAAGGTGTGT 135 bp 58° C. 34 DUSP26_UR 106 AAACAAAATTCAAATCAACATATACA 4 ELMO1 M ELMO1_MF 107 TGAGAGTAGCGGTAGTCGGC 150 bp 63° C. 34 ELMO1_MR 108 AAAAACTCTATCGCCCAACG U ELMO1_UF 109 AGAGGAAGTGAGAGTAGTGGTAGTT 144 bp 63° C. 34 ELMO1_UR 110 CCAACATAAAACCACAACAACA 5 STOX2 M STOX2_MF 111 TGAGAAGTTTGATGGGAATCGC 128 bp 62° C. 34 STOX2_MR 112 ACGACAACGCTACTCCGACG U STOX2_UF 113 TGAGAAGTTTGATGGGAATTGT 115 bp 61° C. 34 STOX2_UR 114 TCCAACACAAACACACAAAACA 6 EDIL3 M EDIL3_MF 115 GTTATTTCGGTTATATTGTTTTTCGC 106 bp 62° C. 34 EDIL3_MR 116 ACCCGACCAAAAACCAAACG U EDIL3_UF 117 TGTTGTTGTTTTGTGTTGTTATTTT 89 bp 62° C. 36 EDIL3_UR 118 CATAATCCCATCTCCCAAACA 7 ZN F447 M ZNF447_MF 119 TTCGTTGTTATGGTGTTTAAAATGAC 161 bp 63° C. 36 ZNF447_MR 120 GAACTACGACTCCCACAATACCG U ZNF447_UF 121 GGATGTTGGGAGGTTATATTTGT 139 bp 62° C. 34 ZNF447_UR 122 ACCTACACACTAAACCTCACCACA 8 EFHD 1 M EFHD1_MF 123 TGTTGTAGAGTTTCGAGTTTGC 111 bp 60° C. 34 EFHD1_MR 124 TCCTCACTAACCATAACGACG U EFHD1_UF 125 GAGTGTGTTGTTTGTTAGTTTTTTGT 128 bp 60° C. 34 EFHD1_UR 126 ACCTCCTCACACCACAACCA
[0220] <PCR Reaction Conditions>
[0221] 95° C. for 6 minutes;
[0222] Y cycles of 95° C. for 30 seconds, X° C. for 30 seconds and 72° C. for 30seconds;
[0223] 72° C. for 7minutes; and
[0224] leave at 16° C.
[0225] In the above conditions, "X" and "Y" denote the annealing temperature and the number of cycles, respectively, specified in Table 8.
[0226] (3) Analysis of Methylation Specific PCR (MSP) Results
[0227] Amplification products obtained by the above MSP were verified on 2% agarose gel electrophoresis. The images obtained by the agarose gel electrophoresis were analyzed with an image processing software (ImageJ) to determine the intensity of the bands. The intensity of each band was calculated by subtracting from the intensity of the band in question the intensity of the background in the same lane. The followings describe the symbols used in the figures showing the results of agarose gel electrophoresis and the figures of the graphs of band intensities as described below.
[0228] M: Primers for detection of methylation
[0229] U: Primers for detection of non-methylation
[0230] 0%: 0% methylation control sample
[0231] 100%: 100% methylation control sample
[0232] HCT116: HCT116 sample
[0233] DLD 1: DLD-1 sample
[0234] N: Normal specimen sample
[0235] 1: CRC specimen sample 1
[0236] 2: CRC specimen sample 2
[0237] 3: CRC specimen sample 3
[0238] 4: CRC specimen sample 4
[0239] 5: CRC specimen sample 5
[0240] 6: CRC specimen sample 6
[0241] 7: CRC specimen sample 7
[0242] <COL4A2>
[0243] FIG. 2 shows the results of agarose gel electrophoresis of MSP using the primer set for COL4A2. FIG. 3 shows the graphs of band intensities of agarose gel electrophoresis of methylation specific PCR using the primer set for COL4A2.
[0244] FIGS. 2 and 3 show that 100% methylation control sample, HCT116 sample, DLD-1 sample, CRC specimen samples 1 to 4 resulted in stronger band intensities in PCR when the primers for detection of methylation were used than the primers for detection of non-methylation were used, while 0% methylation control sample and Normal specimen sample resulted in stronger band intensities in PCR when the primers for detection of non-methylation were used than the primers for detection of methylation were used. These results revealed that colorectal cancer cells can be detected by analyzing methylation status of COL4A2 gene in biological samples by MSP.
[0245] <AOX1>
[0246] FIG. 4 shows the results of agarose gel electrophoresis of MSP using the primer set for AOX1. FIG. 5 shows the graphs of band intensities of agarose gel electrophoresis of methylation specific PCR using the primer set for AOX1.
[0247] FIGS. 4 and 5 show that 100% methylation control sample, HCT116 sample, DLD-1 sample, and CRC specimen samples 2 to 4 and 7 resulted in stronger band intensities in PCR when the primers for detection of methylation were used than the primers for detection of non-methylation were used, while 0% methylation control sample and Normal specimen sample resulted in stronger band intensities in PCR when the primers for detection of non-methylation were used than the primers for detection of methylation were used. These results revealed that colorectal cancer cells can be detected by analyzing methylation status of AOX1 gene in biological samples by MSP.
[0248] <DUSP26>
[0249] FIG. 6 shows the results of agarose gel electrophoresis of MSP using the primer set for DUSP26. FIG. 7 shows the graphs of band intensities of agarose gel electrophoresis of methylation specific PCR using the primer set for DUSP26.
[0250] FIGS. 6 and 7 show that 100% methylation control sample, HCT116 sample, DLD-1 sample, and CRC specimen samples 1, 3, 5 and 6 resulted in stronger band intensities in PCR when the primers for detection of methylation were used than the primers for detection of non-methylation were used, while 0% methylation control sample and Normal specimen sample resulted in stronger band intensities in PCR when the primers for detection of non-methylation were used than the primers for detection of methylation were used. These results revealed that colorectal cancer cells can be detected by analyzing methylation status of DUSP26 gene in biological samples by MSP.
[0251] <ELMO1>
[0252] FIG. 8 shows the results of agarose gel electrophoresis of MSP using the primer set for ELMO1. FIG. 9 shows the graphs of band intensities of agarose gel electrophoresis of methylation specific PCR using the primer set for ELMO1.
[0253] FIGS. 8 and 9 show that 100% methylation control sample, HCT116 sample, DLD-1 sample, and CRC specimen samples 1, 3, 5 and 6 resulted in stronger band intensities in PCR when the primers for detection of methylation were used than the primers for detection of non-methylation were used, while 0% methylation control sample and Normal specimen sample resulted in stronger band intensities in PCR when the primers for detection of non-methylation were used than the primers for detection of methylation were used. These results revealed that colorectal cancer cells can be detected by analyzing methylation status of ELMO1 gene in biological samples by MSP.
[0254] <STOX2>
[0255] FIG. 10 shows the results of agarose gel electrophoresis of MSP using the primer set for STOX2. FIG. 11 shows the graphs of band intensities of agarose gel electrophoresis of methylation specific PCR using the primer set for STOX2.
[0256] FIGS. 10 and 11 show that 100% methylation control sample, HCT116 sample, DLD-1 sample, and CRC specimen samples 1, 2, 5 and 6 resulted in stronger band intensities in PCR when the primers for detection of methylation were used than the primers for detection of non-methylation were used, while 0% methylation control sample and Normal specimen sample resulted in stronger band intensities in PCR when the primers for detection of non-methylation were used than the primers for detection of methylation were used. These results revealed that colorectal cancer cells can be detected by analyzing methylation status of STOX2 gene in biological samples by MSP.
[0257] <EDIL3>
[0258] FIG. 12 shows the results of agarose gel electrophoresis of MSP using the primer set for EDIL3. FIG. 13 shows the graphs of band intensities of agarose gel electrophoresis of methylation specific PCR using the primer set for EDIL3.
[0259] FIGS. 12 and 13 show that 100% methylation control sample, HCT116 sample, DLD-1 sample, and CRC specimen samples 1, 2, 5 and 6 resulted in stronger band intensities in PCR when the primers for detection of methylation were used than the primers for detection of non-methylation were used, while 0% methylation control sample and Normal specimen sample resulted in stronger band intensities in PCR when the primers for detection of non-methylation were used than the primers for detection of methylation were used. These results revealed that colorectal cancer cells can be detected by analyzing methylation status of EDIL3 gene in biological samples by MSP.
[0260] <ZNF447>
[0261] FIG. 14 shows the results of agarose gel electrophoresis of MSP using the primer set for ZNF447. FIG. 15 shows the graphs of band intensities of agarose gel electrophoresis of methylation specific PCR using the primer set for ZNF447.
[0262] FIGS. 14 and 15 show that 100% methylation control sample, HCT116 sample, DLD-1 sample, and CRC specimen samples 1, 2, 3 and 5 resulted in stronger band intensities in PCR when the primers for detection of methylation were used than the primers for detection of non-methylation were used, while 0% methylation control sample and Normal specimen sample resulted in stronger band intensities in PCR when the primers for detection of non-methylation were used than the primers for detection of methylation were used. These results revealed that colorectal cancer cells can be detected by analyzing methylation status of ZNF447 gene in biological samples by MSP.
[0263] <EFHD1>
[0264] FIG. 16 shows the results of agarose gel electrophoresis of MSP using the primer set for EFHD1. FIG. 17 shows the graphs of band intensities of agarose gel electrophoresis of methylation specific PCR using the primer set for EFHD1.
[0265] FIGS. 16 and 17 show that 100% methylation control sample, HCT116 sample, DLD-1 sample and CRC specimen sample 7 resulted in stronger band intensities in PCR when the primers for detection of methylation were used than the primers for detection of non-methylation were used, while 0% methylation control sample and Normal specimen sample resulted in stronger band intensities in PCR when the primers for detection of non-methylation were used than the primers for detection of methylation were used. These results revealed that colorectal cancer cells can be detected by analyzing methylation status of EFHD1 gene in biological samples by MSP.
EXAMPLE 5
Detection of Breast Cancer Cells by Methylation Specific PCR (MSP)
[0266] (1) Preparation of Specimen Samples
[0267] Two kinds of commercially available genomic DNAs derived from human normal mammary epithelial tissues were subjected to ultrasonication in Bioruptor (COSMO BIO Co., Ltd.). The ultrasonicated genomic DNAs derived from human normal mammary epithelial tissues were subjected to the bisulfite treatment in the similar manner as described in Example 4 to prepare normal mammary epithelial tissue specimen samples A and B. A commercially available genomic DNA derived from human breast cancer tissue was treated in the same manner to prepare a breast cancer specimen sample C.
[0268] (2) Preparation of Control Samples
[0269] In the similar manner of the preparation of control samples described in Example 4, 0% methylation control sample and 100% methylation control sample were prepared.
[0270] (3) Methylation Specific PCR (MSP)
[0271] The specimen samples and control samples obtained as described in the above (1) and (2) were used for MSP. Composition of a PCR reagent and PCR conditions for MSP are the same as those described in Example 4. The primers for COL4A2, AOX1 and STOX2 shown in Table 8 were used as primers.
[0272] (4) Analysis of Methylation Specific PCR (MSP) Results
[0273] As described in Example 4, amplified products were analyzed by using agarose gel electrophoresis and intensities of bands. The followings describe the symbols used in the figures showing the results of agarose gel electrophoresis and the figures of the graphs of band intensities as described below.
[0274] M: Primer for detection of methylation
[0275] U: Primer for detection of non-methylation
[0276] 0%: 0% methylation control sample
[0277] 100%: 100% methylation control sample
[0278] A: Normal mammary epithelial tissue specimen sample A
[0279] B: Normal mammary epithelial tissue specimen sample B
[0280] C: Breast cancer specimen sample C
[0281] <COL4A2>
[0282] FIG. 18 shows the results of agarose gel electrophoresis of MSP using the primer set for COL4A2. FIG. 19 shows the graphs of band intensities of agarose gel electrophoresis of methylation specific PCR using the primer set for COL4A2.
[0283] FIGS. 18 and 19 show that 100% methylation control sample and breast cancer specimen sample C resulted in stronger band intensities in PCR when the primers for detection of methylation were used than the primers for detection of non-methylation were used, while 0% methylation control sample, and normal mammary epithelial tissue specimen samples A and B resulted in stronger band intensities in PCR when the primers for detection of non-methylation were used than the primers for detection of methylation were used. These results revealed that breast cancer cells can be detected by analyzing methylation status of COL4A2 gene in biological samples by MSP.
[0284] <AOX1>
[0285] FIG. 20 shows the results of agarose gel electrophoresis of MSP using the primer set for AOX1. FIG. 21 shows the graphs of band intensities of agarose gel electrophoresis of methylation specific PCR using the primer set for AOX1.
[0286] FIGS. 20 and 21 show that 100% methylation control sample and breast cancer specimen sample C resulted in stronger band intensities in PCR when the primers for detection of methylation were used than the primers for detection of non-methylation were used, while 0% methylation control sample, and normal mammary epithelial tissue specimen samples A and B resulted in stronger band intensities in PCR when the primers for detection of non-methylation were used than the primers for detection of methylation were used. These results revealed that breast cancer cells can be detected by analyzing methylation status of AOX1 gene in biological samples by MSP.
[0287] <STOX2>
[0288] FIG. 22 shows the results of agarose gel electrophoresis of MSP using the primer set for STOX2. FIG. 23 shows the graphs of band intensities of agarose gel electrophoresis of methylation specific PCR using the primer set for STOX2.
[0289] FIGS. 22 and 23 show that 100% methylation control sample and breast cancer specimen sample C resulted in stronger band intensities in PCR when the primers for detection of methylation were used than the primers for detection of non-methylation were used, while 0% methylation control sample, and normal mammary epithelial specimen samples A and B resulted in stronger band intensities in PCR when the primers for detection of non-methylation were used than the primers for detection of methylation were used. These results revealed that breast cancer cells can be detected by analyzing methylation status of STOX2 gene in biological samples by MSP.
Sequence CWU
1
126126DNAArtificial Sequenceprimer 1gaatagtygt tataatagtt gggata
26225DNAArtificial Sequenceprimer
2acacctcaaa acraatacac ttaac
25320DNAArtificial Sequenceprimer 3gttttttggg gttttaatgt
20421DNAArtificial Sequenceprimer
4ctccracacc actaactcct c
21524DNAArtificial Sequenceprimer 5agaygtaaga gggtgtgata taga
24624DNAArtificial Sequenceprimer
6aaaaaataac raacacctaa aacc
24724DNAArtificial Sequenceprimer 7tttggagtta ttaggaatgt atta
24821DNAArtificial Sequenceprimer
8tcctccracc ctttttatct a
21923DNAArtificial Sequenceprimer 9ggttattttt gattttgatt agg
231022DNAArtificial Sequenceprimer
10caaaatcctt aaaacttcca at
221123DNAArtificial Sequenceprimer 11ggttgaygtt agaattgaag aag
231221DNAArtificial Sequenceprimer
12cccacctaaa cctaaaaact c
211322DNAArtificial Sequenceprimer 13ggttatttta tttggatggt gt
221425DNAArtificial Sequenceprimer
14aactacctaa acaactacct cctac
251520DNAArtificial Sequenceprimer 15tagygtagga tgagggaggt
201625DNAArtificial Sequenceprimer
16crccttatac aaactaaaac tacac
251723DNAArtificial Sequenceprimer 17ttttgtaatt ggtgtagttt tga
231825DNAArtificial Sequenceprimer
18actattttta aaccataaca cacac
251922DNAArtificial Sequenceprimer 19ataaagygtt gaggaaagag aa
222024DNAArtificial Sequenceprimer
20ctctactcaa actttacaaa cact
242121DNAArtificial Sequenceprimer 21taggagttgg ttagaagttg g
212226DNAArtificial Sequenceprimer
22acractaatt ctcttttatc ttatca
262320DNAArtificial Sequenceprimer 23ggyggagtgt tgtagagttt
202422DNAArtificial Sequenceprimer
24ccaactcctc actaaccata ac
222523DNAArtificial Sequenceprimer 25aatgtgtttt tggttagtag gag
232626DNAArtificial Sequenceprimer
26aaataactct acctctatcc tatacc
262724DNAArtificial Sequenceprimer 27ggagtagtag tagataattt aggg
242824DNAArtificial Sequenceprimer
28taactaacaa tataacacca aaac
242922DNAArtificial Sequenceprimer 29ggatattgga aagttgtaaa ag
223020DNAArtificial Sequenceprimer
30ccrccctctc tcttactaac
203125DNAArtificial Sequenceprimer 31gtagaggata aatgaggagt tagag
253220DNAArtificial Sequenceprimer
32tccctttcca aattcatacc
203323DNAArtificial Sequenceprimer 33gggaaagttt atagtggaga gag
233423DNAArtificial Sequenceprimer
34caaatcatca ctccttaaaa atc
233520DNAArtificial Sequenceprimer 35gggtttggag tggttagtta
203620DNAArtificial Sequenceprimer
36crctccctca acaacctaat
203726DNAArtificial Sequenceprimer 37gagaaggtta ttatttaggt tagtaa
263820DNAArtificial Sequenceprimer
38actaccaact ctttccctcc
203922DNAArtificial Sequenceprimer 39gttagyggtt ttagaagagg tt
224021DNAArtificial Sequenceprimer
40crcccactat acctacctac c
214120DNAArtificial Sequenceprimer 41gaggaggagt tggttttttg
204221DNAArtificial Sequenceprimer
42aatctcttct accccccata c
214323DNAArtificial Sequenceprimer 43ggygggaaaa agaaggtttt ata
234426DNAArtificial Sequenceprimer
44acccraaaac aaatattcca aaatac
264520DNAArtificial Sequenceprimer 45tggtattgtt tggtggagat
204623DNAArtificial Sequenceprimer
46aaactcaaca aactaaacac cta
234720DNAArtificial Sequenceprimer 47gaggaaagaa ggaagggttg
204826DNAArtificial Sequenceprimer
48aatacaaaat crtctctacc aatacc
264920DNAArtificial Sequenceprimer 49ggttttaggg agaagaagtt
205020DNAArtificial Sequenceprimer
50racctacctc ccaacataaa
205121DNAArtificial Sequenceprimer 51tygtaggaat gttttttttt g
215220DNAArtificial Sequenceprimer
52ctctttccct tcacatttca
205321DNAArtificial Sequenceprimer 53atggatgagt gaatgaatga a
215421DNAArtificial Sequenceprimer
54acraaaacct aaaacaaaca c
215522DNAArtificial Sequenceprimer 55gygatgttta gatagttttt tg
225620DNAArtificial Sequenceprimer
56accacaactc caaaccttac
205721DNAArtificial Sequenceprimer 57atygtttttg tttttgtttt g
215820DNAArtificial Sequenceprimer
58aacactaata accccctacc
205925DNAArtificial Sequenceprimer 59gttttgtttt ttaaggggtg ttgag
256025DNAArtificial Sequenceprimer
60acactaactc craaaactac aaaac
256122DNAArtificial Sequenceprimer 61ggtattygtt ttttagattg tt
226221DNAArtificial Sequenceprimer
62aaataaatcc cacctctaca t
216320DNAArtificial Sequenceprimer 63gaggaggaag aggaggtgat
206422DNAArtificial Sequenceprimer
64aaaatctaaa tcccaaacac aa
226522DNAArtificial Sequenceprimer 65tgttaggtat agagtaggtg gt
226621DNAArtificial Sequenceprimer
66caacrctatt ttatttcctc c
216720DNAArtificial Sequenceprimer 67ggttttaggt tggggtagtt
206826DNAArtificial Sequenceprimer
68cctacacata catactccta cttact
266925DNAArtificial Sequenceprimer 69tagttttttt tattaggatt ttttt
257020DNAArtificial Sequenceprimer
70cccaaacata ttacccaaac
207124DNAArtificial Sequenceprimer 71atgtttagtt atttttgatt ggtt
247223DNAArtificial Sequenceprimer
72rctcaacaca actctaacaa cac
237323DNAArtificial Sequenceprimer 73tatttaggga ttgggtttag ttt
237422DNAArtificial Sequenceprimer
74cctccttaca tccttacacc tc
227524DNAArtificial Sequenceprimer 75gggtagaatt tagtttgagt aggt
247621DNAArtificial Sequenceprimer
76aactcccact cccttacact a
217722DNAArtificial Sequenceprimer 77ggaagagatg aaatggtagt at
227822DNAArtificial Sequenceprimer
78tcaaaaacac rctataaccc ta
227922DNAArtificial Sequenceprimer 79yggtagaaat agtttaggga ag
228023DNAArtificial Sequenceprimer
80tactccatac actcaaaaaa cac
238124DNAArtificial Sequenceprimer 81tttatttygt tgttatggtg ttta
248219DNAArtificial Sequenceprimer
82cctaacccct ttccctaac
198360DNAArtificial Sequenceprimer 83gcattagcgg ccgcgaaatt aatacgactc
actataggga gaaaaaaaaa aaaaaaaaab 60844949DNAHomo sapiens 84cgccccactc
ggcgggtcgg tgccgccggg tcccaggtgc ccgctacttc ccagaacctc 60cgcctcccgc
tccgggccct cgaaccagcg cggacaccac aatggaccgg gcgtccgagc 120tgctcttcta
cgtgaacggc cgcaaggtga tagaaaaaaa tgtcgatcct gaaacaatgc 180tgttgcctta
tttgaggaag aagcttcgac tcacaggaac taagtatggc tgtggaggag 240gaggctgtgg
tgcttgtaca gtgatgatat cacgatacaa ccccatcacc aagaggataa 300ggcatcaccc
agccaatgcc tgtctgattc ccatctgttc tctgtatggt gctgccgtca 360ccacagtaga
aggcatagga agcacccaca ccagaattca tcctgttcag gagaggattg 420ccaagtgtca
tggcacccag tgtggcttct gcacacctgg gatggtgatg tccatctaca 480cgctgctcag
gaaccaccca gagcccactc tggatcagtt aactgatgcc cttggtggta 540acctgtgccg
ttgcactgga tacaggccca taattgatgc atgcaagact ttctgtaaaa 600cttcgggctg
ctgtcaaagt aaagaaaatg gggtttgctg tttggatcaa ggaatcaatg 660gattgccaga
atttgaggaa ggaagtaaga caagtccaaa actcttcgca gaagaggagt 720ttctgccatt
ggatccaacc caggaactga tatttcctcc tgagctaatg ataatggctg 780agaaacagtc
gcaaaggacc agggtgtttg gcagtgagag aatgatgtgg ttttcccccg 840tgaccctgaa
ggaactgctg gaatttaaat tcaagtatcc ccaggctcct gttatcatgg 900gaaacacctc
tgtggggcct gaagtgaaat ttaaaggcgt ctttcaccca gttataattt 960ctcctgatag
aattgaagaa ctgagtgttg taaaccatgc atataatgga ctcacccttg 1020gtgctggtct
cagcctagcc caggtgaagg acattttggc tgatgtagtc cagaagcttc 1080cagaggagaa
gacacagatg taccatgctc tcctgaagca tttgggaact ctggctgggt 1140cccagatcag
gaacatggct tctttagggg gacacatcat tagcaggcat ccagattcag 1200atctgaatcc
catcctggct gtgggtaact gtaccctcaa cttgctatca aaagaaggaa 1260aacgacagat
tcctttaaat gagcaattcc tcagcaagtg ccctaatgca gatcttaagc 1320ctcaagaaat
cttggtctca gtgaacatcc cctactcaag gaagtgggaa tttgtgtcag 1380ccttccgaca
agcccagcga caggagaatg cgctagcgat agtcaattca ggaatgagag 1440tcttttttgg
agaaggggat ggcattatta gagagttatg catctcatat ggaggcgttg 1500gtccagccac
catctgtgcc aagaattcct gccagaaact cattggaagg cactggaacg 1560aacagatgct
ggatatagcc tgcaggctta ttctgaatga agtctccctt ttgggctcgg 1620cgccaggtgg
gaaagtggag ttcaagagga ctctcatcat cagcttcctc ttcaagttct 1680acctggaagt
gtcacagatt ttgaaaaaga tggatccagt tcactatcct agccttgcag 1740acaagtatga
aagtgcttta gaagatcttc attccaaaca tcactgcagt acattaaagt 1800accagaatat
aggcccaaag cagcatcctg aagacccaat tggccacccc atcatgcatc 1860tgtctggtgt
gaagcatgcc acgggggagg ccatctactg tgatgacatg cctctggtgg 1920accaggaact
tttcttgact tttgtgacta gttcaagagc tcatgctaag attgtgtcta 1980ttgatctgtc
agaagctctc agcatgcccg gtgtggtgga catcatgaca gcagaacatc 2040ttagtgacgt
caactccttc tgctttttta ctgaagctga gaaatttctg gcgacagata 2100aggtgttctg
tgtgggtcag cttgtctgtg ctgtgcttgc cgattctgag gttcaggcaa 2160agcgagctgc
taagcgagtg aagattgtct atcaagactt ggagccgctg atactaacaa 2220ttgaggaaag
tatacaacac aactcctcct tcaagccaga aaggaaactg gaatatggaa 2280atgttgacga
agcatttaaa gtggttgatc aaattcttga aggtgaaata catatgggag 2340gtcaagaaca
tttttatatg gaaacccaaa gcatgcttgt cgttcccaag ggagaggatc 2400aagaaatgga
tgtctacgtg tccacacagt ttcccaaata tatacaggac attgttgcct 2460caaccttgaa
gctcccagct aacaaggtca tgtgccatgt aaggcgtgtt ggtggagcgt 2520ttggagggaa
ggtgttaaaa accggaatca ttgcagccgt cactgcattt gccgcaaaca 2580aacatggccg
tgcagttcgc tgtgttctgg aacgaggaga agacatgtta ataactggag 2640gccgccatcc
ttaccttgga aagtacaaag ctggattcat gaacgatggc agaatcttgg 2700ccctggacat
ggagcattac agcaatgcag gcgcctcctt ggatgaatca ttattcgtga 2760tagaaatggg
acttctgaaa atggacaatg cttacaagtt tcccaatctc cgctgccggg 2820gttgggcatg
cagaaccaac cttccatcca acacagcttt tcgtgggttt ggctttcctc 2880aggcagcgct
gatcaccgaa tcttgtatca cggaagttgc agccaaatgt ggactatccc 2940ctgagaaggt
gcgaatcata aacatgtaca aggaaattga tcaaacaccc tacaaacaag 3000agatcaatgc
caagaaccta atccagtgtt ggagagaatg tatggccatg tcttcctact 3060ccttgaggaa
agttgctgtg gaaaagttca atgcagagaa ttattggaag aagaaaggac 3120tggccatggt
ccccctgaag tttcctgttg gccttggctc acgtgctgct ggtcaggctg 3180ctgccttggt
tcacatttat cttgatggct ctgtgctggt cactcacggt ggaattgaaa 3240tggggcaggg
ggtccacact aaaatgattc aggtggtcag ccgtgaatta agaatgccaa 3300tgtcgaatgt
ccacctgcgt ggaacaagca cagaaactgt ccctaatgca aatatctctg 3360gaggttctgt
ggtggcagat ctcaacggtt tggcagtaaa ggatgcctgt caaactcttc 3420taaaacgcct
cgaacccatc atcagcaaga atcctaaagg aacttggaaa gactgggcac 3480agactgcttt
tgatgaaagc attaaccttt cagctgttgg atacttcaga ggttatgagt 3540cagacatgaa
ctgggagaaa ggcgaaggcc agcccttcga atactttgtt tatggagctg 3600cctgttccga
ggttgaaata gactgcctga cgggggatca taagaacatc agaacagaca 3660ttgtcatgga
tgttggctgc agtataaatc cagccattga cataggccag attgaaggtg 3720catttattca
aggcatggga ctttatacaa tagaggaact gaattattct ccccagggca 3780ttctgcacac
tcgtggtcca gaccaatata aaatccctgc catctgtgac atgcccacgg 3840agttgcacat
tgctttgttg cctccttctc aaaactcaaa tactctttat tcatctaagg 3900gtctgggaga
gtcgggggtg ttcctggggt gttccgtgtt tttcgctatc catgacgcag 3960tgagtgcagc
acgacaggag agaggcctgc atggaccctt gacccttaat agtccactga 4020ccccggagaa
gattaggatg gcctgtgaag acaagttcac aaaaatgatt ccgagagatg 4080aacctggatc
ctacgttcct tggaatgtac ccatctgaat caaatgcaaa cttctggaga 4140aaacagagtg
cctcttccca gatggcaatc tgtcctatct ctgtgctgga agatgctaga 4200tctgaaagac
agagtttcca cagttcagaa atcatcccac agtgttgctt ttctatggag 4260ctgatttaaa
gtattccatt tagatttgat agatatgctt aagcaatcta taaatcattt 4320tcaatgttat
aaacactaat tggtttcctc tagggtgata ttcgtcatta ctctgtctct 4380tcaatccatc
cagctaaatg gaataggtga tgacttgcat gtgactccta cttggcttct 4440atccaccaac
agaaattata ccatatagtg aaaggcaatt ttctaaataa tttcattact 4500aatatgaact
gtgaagttgt cattttttca tttgtccttt tctgctatca ccttcctctt 4560gtcagaatga
atatagacac tgtatctaag tgggaccaaa gaaaaaatag cgaactttca 4620ccaaagtttt
catgaaaacc caaaagcttt aaaagttact atcaagaaat tgaaaggaaa 4680cccacagaat
aggataaaat atttgtaaat catatatttg ataaaagtct tgtaaccaga 4740tacataaaga
gctcttacaa ctcaataaaa ggcaagtaat ttaaaaatag gcaaaagaat 4800tgctggatgg
tatggtagtt ctatttttag tttttaccct aactactctg acttgatcat 4860ttaacattct
gtgtatgtaa caaaatatca catgcataaa tattatgtat caataaaatt 4920ttttaatggg
caaaaaaaaa aaaaaaaaa
4949856264DNAHomo sapiens 85gagtgtggct gcagtgcgcc gggacaccag ggctccgcgc
tccgcactca agaggctccc 60gcgtcccaac ccctcgcgcc cgcgcgttcg cggatccagg
ccgaggaccg aaaggggccg 120cccgagcccc cggggccggc gcccagagag cccagcaagg
ccggccgccc tgccggtgtg 180ccgccggcgg gtgcttctgg aagggccaat gcgttcgggc
agcagcccct gaagccgagc 240ccgaggctaa gtgggactga ccggggccca gagtggacga
accgccagca tggggagaga 300ccagcgcgcg gtggccggcc ctgccctacg gcggtggctg
ctgctgggga cagtgaccgt 360ggggttcctc gcccagagcg tcttggcggg tgtgaagaag
tttgatgtgc cgtgtggagg 420aagagattgc agtgggggct gccagtgcta ccctgagaaa
ggtggacgtg gtcagcctgg 480gccagtgggc ccccaggggt acaatgggcc accaggatta
caaggattcc cgggactgca 540gggacgtaaa ggagacaagg gtgaaagggg agcccccgga
gtaacgggac ccaagggcga 600cgtgggagca agaggcgttt ctggattccc tggtgccgat
ggaattcctg gacacccggg 660gcaaggtggg cccaggggaa ggccgggcta cgatggctgc
aacggaaccc agggagactc 720aggtccacag gggccccccg gctctgaggg gttcaccggg
cctcccgggc cccaaggacc 780aaaagggcag aaaggtgagc cttatgcact gcctaaagag
gagcgcgaca gatatcgggg 840tgaacctgga gagcctggat tggtcggttt ccagggacct
cccggccgcc ctgggcatgt 900gggacagatg ggtccagttg gagctccagg gagaccagga
ccacctggac cccctggacc 960aaaaggacag caaggcaaca gaggacttgg tttctacgga
gttaagggtg aaaagggtga 1020cgtagggcag ccgggaccca acgggattcc atcagacacc
ctccacccca tcatcgcgcc 1080cacaggagtc accttccacc cagatcagta caagggtgaa
aaaggcagtg agggggaacc 1140aggaataaga ggcatttcct tgaagggaga agaaggaatc
atgggctttc ctggactgag 1200gggttaccct ggcttgagtg gtgaaaaagg atcaccagga
cagaagggaa gccgaggcct 1260ggatggctat caagggcctg atggaccccg gggacccaag
ggagaagccg gagacccagg 1320gccccctgga ctacctgcct actcccctca cccttcccta
gcaaaaggtg ccagaggtga 1380cccgggattc ccaggggccc aaggggagcc aggaagccag
ggtgagccag gagacccggg 1440cctcccaggt ccccctggcc tctccatcgg agatggagat
cagaggagag gcctgccggg 1500tgagatggga cccaagggct tcatcggaga ccccggcatc
cctgcgctct acgggggccc 1560acctggacct gatggaaagc gagggcctcc aggacccccc
gggctccctg gaccacctgg 1620acctgatggc ttcctgtttg ggctgaaagg agcaaaagga
agagcaggct tccctgggct 1680tcccggctcc cctggagccc gcggaccaaa ggggtggaaa
ggtgacgctg gggaatgcag 1740atgtacagaa ggcgacgaag ctatcaaagg tcttccggga
ctgccaggac ccaagggctt 1800cgcaggcatc aacggggagc cggggaggaa aggggacaga
ggagaccccg gccaacacgg 1860cctccctggg ttcccagggc tcaagggagt gcctggcaac
attggtgctc ccggacccaa 1920aggagcaaaa ggagattcca gaacaatcac aaccaaaggt
gagcggggac agcccggcgt 1980cccaggtgtg cccgggatga aaggtgacga tggcagccca
ggccgcgatg ggctcgatgg 2040attccccggc ctcccaggcc ctcccggtga tggcatcaag
ggccctccag gggacccagg 2100ctatccagga atacctggaa cgaagggtac tccaggagaa
atgggccccc caggactggg 2160ccttcccggc ctcaaaggcc aacgtggttt ccctggagac
gccggcttac ctggaccacc 2220aggcttcctg ggccctcctg gccccgcagg gaccccagga
caaatagatt gtgacacaga 2280tgtgaaaagg gccgttggag gtgacagaca ggaggccatc
cagccaggtt gcataggagg 2340gcccaaggga ttgccaggcc tgccaggacc cccaggcccc
acaggtgcca aaggcctccg 2400aggaatccca ggcttcgcag gagctgatgg aggaccaggg
cccaggggct tgccaggaga 2460cgcaggtcgt gaagggttcc caggaccccc agggttcata
ggaccccgag gatccaaagg 2520tgcagtgggc ctccctggcc cagatggatc cccaggtccc
atcggcctgc cagggccaga 2580tgggccccct ggggaaaggg gcctccctgg agaagtcctg
ggagctcagc ccgggccacg 2640gggagatgct ggtgtgcctg gacagcctgg gcttaaaggc
cttcccggag acagaggccc 2700ccctggattc agaggaagcc aagggatgcc tgggatgcca
gggctgaagg gccagccagg 2760cctcccagga ccttccggcc agccaggcct gtatgggcct
ccaggactgc atggattccc 2820aggagctcct ggccaagagg ggcccttggg gctgccagga
atcccaggcc gtgaaggtct 2880gcctggtgat agaggggacc ctggggacac aggcgctcct
ggccctgtgg gcatgaaagg 2940tctctctggt gacagaggag atgctggctt cacaggggag
caaggccatc caggaagccc 3000tggatttaaa ggaattgatg gaatgcctgg gacccccggg
ctaaaaggag atagaggctc 3060acctgggatg gatggtttcc aaggcatgcc tggactcaaa
gggagacccg ggtttccagg 3120gagcaaaggc gaggctggat ttttcggaat acccggtctg
aagggtctgg ctggtgagcc 3180aggttttaaa ggcagccgag gggaccctgg gcccccagga
ccacctcctg tcatcctgcc 3240aggaatgaaa gacattaaag gagagaaagg agatgaaggg
cctatggggc tgaaaggata 3300cctgggcgca aaaggtatcc aaggaatgcc aggcatccca
gggctgtcag gaatccctgg 3360gctgcctggg aggcccggcc acatcaaagg agtcaaggga
gacatcggag tccccggcat 3420ccccggtttg ccaggattcc ctggggtggc tggcccccct
ggaattacgg gattcccagg 3480attcatagga agccggggtg acaaaggtgc cccagggaga
gcaggcctgt atggcgagat 3540tggcgcgact ggtgatttcg gtgacatcgg ggacactata
aatttaccag gaagaccagg 3600cctgaagggg gagcggggca ccactggaat accaggtctg
aagggattct ttggagagaa 3660gggaacagaa ggtgacatcg gcttccctgg gataacaggc
gtgactggag tccaaggccc 3720tcctggactt aaaggacaaa caggctttcc agggctgact
gggcctccag ggtcgcaggg 3780agagctgggg cggattggac tgcctggtgg caaaggagat
gatggctggc cgggagctcc 3840gggcttacca ggttttccgg gactccgtgg gatccgcggc
ttacacggct tgccaggcac 3900caagggcttt ccaggatccc caggttctga catccacgga
gacccaggct tcccaggccc 3960tcctggggaa agaggtgacc caggagaggc caacaccctt
ccaggccctg tgggagtccc 4020aggacagaaa ggagaccaag gagctccagg ggaacgaggc
ccacctggga gcccaggact 4080tcaggggttc ccaggcatca cacccccttc caacatctct
ggggcacctg gtgacaaagg 4140ggcgccaggg atatttggcc tgaaaggtta tcggggccca
ccagggccac caggttctgc 4200tgctcttcct ggaagcaaag gtgacacagg gaacccagga
gctccaggaa ccccagggac 4260caaaggatgg gccggggact ccgggcccca gggcaggcct
ggtgtgtttg gtctcccagg 4320agaaaaaggg cccaggggtg aacaaggctt catggggaac
actggaccca ccggggcggt 4380gggcgacaga ggccccaagg gacccaaggg agacccagga
ttccctggtg cccccgggac 4440tgtgggagcc cccgggattg caggaatccc ccagaagatt
gccgtccaac cagggacagt 4500gggtccccag gggaggcgag gcccccctgg ggcaccgggg
gagatggggc cccagggccc 4560ccccggagaa ccaggttttc gtggggctcc agggaaagct
gggccccaag gaagaggtgg 4620tgtgtctgct gttcccggct tccggggaga tgaaggaccc
ataggccacc aggggccgat 4680tggccaagaa ggtgcaccag gccgtccagg gagcccgggc
ctgccgggta tgccaggccg 4740cagcgtcagc atcggctacc tcctggtgaa gcacagccag
acggaccagg agcccatgtg 4800cccagtgggc atgaacaaac tctggagtgg atacagcctg
ctgtacttcg agggccagga 4860gaaggcgcac aaccaggacc tggggctggc gggctcctgc
ctggcgcggt tcagcaccat 4920gcccttcctg tactgcaacc ctggtgatgt ctgctactat
gccagccgga acgacaagtc 4980ctactggctc tctaccactg cgccgctgcc catgatgccc
gtggccgagg acgagatcaa 5040gccctacatc agccgctgtt ctgtgtgtga ggccccggcc
atcgccatcg cggtccacag 5100tcaggatgtc tccatcccac actgcccagc tgggtggcgg
agtttgtgga tcggatattc 5160cttcctcatg cacacggcgg cgggagacga aggcggtggc
caatcactgg tgtcaccggg 5220cagctgtcta gaggacttcc gcgccacacc attcatcgaa
tgcaatggag gccgcggcac 5280ctgccactac tacgccaaca agtacagctt ctggctgacc
accattcccg agcagagctt 5340ccagggctcg ccctccgccg acacgctcaa ggccggcctc
atccgcacac acatcagccg 5400ctgccaggtg tgcatgaaga acctgtgagc cggcgcgtgc
caggaagggc cattttggtg 5460cttattctta acttattacc tcaggtgcca acccaaaaat
tggttttatt tttttcttaa 5520aaaaaaaaaa gtctaccaaa ggaatttgca tccagcagca
gcacttagac ctgccagcca 5580ctgtcaccga gcgggtgcaa gcactcgggg tccctggagg
gcaagccctg cccacagaaa 5640gccaggagca gccctggccc ccatcagccc tgctagacgc
accgcctgaa ggcacagcta 5700accacttcgc acacacccat gtaaccactg cactttccaa
tgccacagac aactcacatt 5760gttcaactcc cttctcgggg tgggacagac gagacaacag
cacacaggca gccagccgtg 5820gccagaggct cgaggggctc agggcctcag gcacccgtcc
ccacacgagg gccccgtggg 5880tgggcctggc cctgctttct acgccaatgt tatgccagct
ccatgttctc ccaaataccg 5940ttgatgtgaa ttattttaaa ggcaaaaccg tgctctttat
tttaaaaaac actgataatc 6000acactgcggt aggtcattct tttgccacat ccctatagac
cactgggttt ggcaaaactc 6060aggcagaagt ggagaccttt ctagacatca ttgtcagcct
tgctacttga aggtacaccc 6120catagggtcg gaggtgctgt ccccactgcc ccacgttgtc
cctgagattt aacccctcca 6180ctgctggggg tgagctgtac tcttctgact gccccctcct
gtgtaacgac tacaaaataa 6240aacttggttc tgaatatttt taaa
6264861665DNAHomo sapiens 86gttggctggg gagcccacgc
tgcctggcga ctcgggccac cgaatgtgag accgagtccc 60tttatgtcac cagcgcacac
gctgatttga accctgcttc gacgtgtgtg tcatggctta 120aaaatagctg ctaatctgtc
aacctgtctt gggcagaaac agcggcggcg acagcagcag 180gagcgtcatg gccgtggcgc
tgtctgcgcc ggcgatccgc ctttcggact gaggcccagc 240gcagcgcttg caaagagcag
cagctacctg gcaactgaac ccatcatcac cacagccact 300cctgcagctg ccacggtttc
tgccacctct aagatgtgcc ctggtaactg gctttgggct 360tctatgactt ttatggcccg
cttctcccgg agtagctcaa ggtctcctgt tcgaactcga 420gggaccctgg aggagatgcc
aaccgttcaa catcctttcc tcaatgtctt cgagttggag 480cggctcctct acacaggcaa
gacagcctgt aaccatgccg acgaggtctg gccaggcctc 540tatctcggag accaggacat
ggctaacaac cgccgggagc ttcgccgcct gggcatcacg 600cacgtcctca atgcctcaca
cagccggtgg cgaggcacgc ccgaggccta tgaggggctg 660ggcatccgct acctgggtgt
tgaggcccac gactcgccag cctttgacat gagcatccac 720ttccagacgg ctgccgactt
catccaccgg gcgctgagcc agccaggagg gaagatcctg 780gtgcattgtg ctgtgggcgt
gagccgatcc gccaccctgg tactggccta cctcatgctg 840taccaccacc ttaccctcgt
ggaggccatc aagaaagtca aagaccaccg aggcatcatc 900cccaaccggg gcttcctgag
gcagctcctg gccctggacc gcaggctgcg gcagggtctg 960gaagcatgag gggaggggga
gagaggtcag gccaggcccg tgggtaggtc cctggctccc 1020agctggagat aggaggccca
ggtggcaggt agcaggaggc ccagatcacc catcctcccc 1080tggggtcagg agaggccgag
ccccaggcca ctgtcactct ttgtgggagg ggacggggag 1140tgaggttggg cagtgtggtg
gatgggcacc caggaagggt tgaccaggga aggaggcagc 1200taggctgtag atggaagatg
gtcctgggat tcgaacaccg ctgggatctg gccagggtgc 1260tccctgggat tcacagtccc
ttcccctctt tgtgcccaag tgtttccctc tctccctcac 1320caaaacaaaa gggccatctc
tgccctgcac ttgtgcagaa agtcagggat acggcaagca 1380tgaatgcaat ggtgtagagt
tgtgtgaaac ccctagcata gagacagaca gcgaagagat 1440ggtgtgaaaa gcttgcagaa
ccagacagag aaccccacag actttccact ccaagcacag 1500gaggaggtag ctagcgtgtg
agggttggca ctaggcccac ggctgctgct tgggccaaaa 1560acatacagag gtgcatggct
ggcagtcttg aaattgtcac tcgcttactg gatccaagcg 1620tctcgaggat aaataaagat
catgaaaaaa aaaaaaaaaa aaaaa 1665872974DNAHomo sapiens
87agaagccccg cagccgccgc gcggagaaca gcgacagccg agcgcccggt ccgcctgtct
60gccggtgggt ctgcctgccc gcgcagcaga cccggggcgg ccgcgggagc ccgcgccccg
120cccgccgcgc ctctgccggg acccacccgc agcggagggc tgagcccgcc ggcggctccc
180cggagctcac ccacctccgc gcgccggagc gcaggcaaaa ggggaggaaa ggctcctctc
240tttagtcacc actctcgccc tctccaagaa tttgtttaac aaagcgctga ggaaagagaa
300cgtcttcttg aattctttag taggggcgga gtctgctgct gccctgcgct gccacctcgg
360ctacactgcc ctccgcgacg acccctgacc agccggggtc acgtccggga gacgggatca
420tgaagcgctc ggtagccgtc tggctcttgg tcgggctcag cctcggtgtc ccccagttcg
480gcaaaggtga tatttgtgat cccaatccat gtgaaaatgg aggtatctgt ttgccaggat
540tggctgatgg ttccttttcc tgtgagtgtc cagatggctt cacagacccc aactgttcta
600gtgttgtgga ggttgcatca gatgaagaag aaccaacttc agcaggtccc tgcactccta
660atccatgcca taatggagga acctgtgaaa taagtgaagc ataccgaggg gatacattca
720taggctatgt ttgtaaatgt ccccgaggat ttaatgggat tcactgtcag cacaacataa
780atgaatgcga agttgagcct tgcaaaaatg gtggaatatg tacagatctt gttgctaact
840attcctgtga gtgcccaggc gaatttatgg gaagaaattg tcaatacaaa tgctcaggcc
900cactgggaat tgaaggtgga attatatcaa accagcaaat cacagcttcc tctactcacc
960gagctctttt tggactccaa aaatggtatc cctactatgc acgtcttaat aagaaggggc
1020ttataaatgc gtggacagct gcagaaaatg acagatggcc gtggattcag ataaatttgc
1080aaaggaaaat gagagttact ggtgtgatta cccaaggagc caagaggatt ggaagcccag
1140agtatataaa atcctacaaa attgcctaca gtaatgatgg aaagacttgg gcaatgtaca
1200aagtgaaagg caccaatgaa gacatggtgt ttcgtggaaa cattgataac aacactccat
1260atgctaactc tttcacaccc cccataaaag ctcagtatgt aagactctat ccccaagttt
1320gtcgaagaca ttgcactttg cgaatggaac ttcttggctg tgaactgtcg ggttgttctg
1380agcctctggg tatgaaatca ggacatatac aagactatca gatcactgcc tccagcatct
1440tcagaacgct caacatggac atgttcactt gggaaccaag gaaagctcgg ctggacaagc
1500aaggcaaagt gaatgcctgg acctctggcc acaatgacca gtcacaatgg ttacaggtgg
1560atcttcttgt tccaaccaaa gtgactggca tcattacaca aggagctaaa gattttggtc
1620atgtacagtt tgttggctcc tacaaactgg cttacagcaa tgatggagaa cactggactg
1680tataccagga tgaaaagcaa agaaaagata aggttttcca gggaaatttt gacaatgaca
1740ctcacagaaa aaatgtcatc gaccctccca tctatgcacg acacataaga atccttcctt
1800ggtcctggta cgggaggatc acattgcggt cagagctgct gggctgcaca gaggaggaat
1860gaggggaggc tacatttcac aaccctcttc cctatttccc taaaagtatc tccatggaat
1920gaactgtgca aaatctgtag gaaactgaat ggtttttttt tttttttcat gaaaaagtgc
1980tcaaattatg gtaggcaact aacggtgttt ttaagggggt ctaagcctgc cttttcaatg
2040atttaatttg attttatttt atccgtcaaa tctcttaagt aacaacacat taagtgtgaa
2100ttacttttct ctcattgttt cctgaattat tcgcattggt agaaatatat tagggaaaga
2160aagtagcctt ctttttatag caagagtaaa aaagtctcaa agtcatcaaa taagagcaag
2220agttgataga gcttttacaa tcaatactca cctaattctg ataaaaggaa tactgcaatg
2280ttagcaataa gtttttttct tctgtaatga ctctacgtta tcctgtttcc ctgtgcctac
2340caaacactgt caatgtttat tacaaaattt taaagaagaa tatgtaacat gcagtactga
2400tattataatt ctcattttac tttcattatt tctaataaga gattatgtga cttctttttc
2460ttttagttct attctacatt cttaatattg tatattacct gaataattca atttttttct
2520aattgaattt cctattagtt gactaaaaga agtgtcatgt ttactcatat atgtagaaca
2580tgactgccta tcagtagatt gatctgtatt taatattcgt taattaaatc tgcagtttta
2640tttttgaagg aagccataac tatttaattt ccaaataatt gcttcataaa gaatcccata
2700ctctcagttt gcacaaaaga acaaaaaata tatatgtctc tttaaattta aatcttcatt
2760tagatggtaa ttacatatcc ttatatttac tttaaaaaat cggcttattt gtttatttta
2820taaaaaattt agcaaagaaa tattaatata gtgctgcata gtttggccaa gcatactcat
2880catttctttg ttcagctcca catttcctgt gaaactaaca tcttattgag atttgaaact
2940ggtggtagtt tcccaggaag gcacaggtgg agtt
2974882000DNAHomo sapiens 88agtcgctgag ccctggcgcc tccttaaagc cgcagctccg
ccccgaccgc cccgcccgcc 60agtccgtcct cagaccctcc caaccgccgg gtccccgccg
cctcggcgga gtgttgtaga 120gcctcgagcc tgcgaggagc gcgccgcccg ccagctccct
gcgtcccgtc ccgcgtcccc 180gcgttcccgc gtcctgcgat ccgccgccat ggccagtgag
gagctggcgt gcaagctgga 240gcgccggctg cggcgcgagg aggccgagga gagtggcccc
cagctggctc ccctcggcgc 300cccagccccg gagcccaagc ccgagcccga gcctcccgcc
cgtgcgccca cggccagcgc 360cgacgcggag ctgagcgccc agctgagccg gcggctggac
atcaacgagg gcgctgcgcg 420gccccggcgc tgcagggtct tcaaccccta cacggagttc
ccggagttca gccgccgcct 480catcaaggac ctggagagca tgttcaaact gtatgacgct
gggcgggatg gcttcatcga 540cctgatggag ctgaagctga tgatggagaa gctgggggcc
ccccagaccc acctgggcct 600gaagagcatg atcaaggagg tggatgagga cttcgatggc
aagctcagct tccgggagtt 660cctgctcatt ttccacaagg ccgcggcagg ggagctgcag
gaggacagtg ggctgatggc 720gctggcaaag ctttctgaga tcgatgtggc cctggagggt
gtcaaaggtg ccaagaactt 780ctttgaagcc aaggtccaag ccttgtcatc ggccagtaag
tttgaagcag agttgaaagc 840tgagcaagat gagcggaagc gggaggagga ggagaggcgg
ctccgccagg cagccttcca 900gaaactcaag gccaacttca atacatagtc ctgctgacct
tgccctctgc ccacagctgt 960gcctcacaga tgccccgaga agagatgact aggcatcttc
atcactgctg tcggtcccct 1020ccctgagcca gcatctccat ccaccacccc gtgccagctc
ccgtgccagc cttcattcct 1080cccagtgtcc aagcccctcc aggagggtcc tggggtgggc
cagatgcctg cccacctctg 1140tctcctgcct ctgctcctct gcccttctta tagccagaac
ttgtatcttc tcagcaacct 1200tcactttgtc cttgtccctt taccattccc catcaaagag
tagtctgcta tatcaatttg 1260tgtagatatg tctgtctttt tgggtcctca gagaaaatgc
ccattttctc ggagaattct 1320ctgcactcct ctctgcttca cattcaactt ccctgttctc
atctttggta ggattctgcc 1380agttgctttt gcatcttctg ttcctgggta atggtgggtc
ttaatggagg ctgggtggac 1440cactgcccgt ccactcttca acaggaggaa cagcatgcca
ccatagtaac acacattaga 1500gaaaggacag aggtctgctc cttcctgcca cctttctcct
ggccccttag cattccccca 1560gtccctccct cttcaccttg ctccgtctat gtcttcccag
ctcagccttt tccccactct 1620taaatactgt actacttcac tgtaagaacg aaagaatagt
taggatacca atgagtaaaa 1680gggttcctgt tcactctgac tctgtgcaaa ttgtattaca
gtagaccgct gacgttccca 1740agtgacagat ccagggcctt tcaaacatcc ccaaagtcat
ggccatactc accattagcc 1800agtttctaac atctgtttca gggtatccag ctgtagatgt
tcttatcccc catacttgtg 1860agttcttggg gttgctcaca aatactaggg gtttttgttg
tatttttaac aaatatatcc 1920taatgtcata tttattctct tttgtaactg ctgtctttac
aataaagaaa tcatctgcct 1980ttctatctta aaaaaaaaaa
2000893727DNAHomo sapiens 89aagtgagagc agcggcagcc
ggcggtgcag cagccggccg acccagagtg taagtgcgtg 60tgctggggcg agcgggagcg
ggcgaggatg ggcacaggat agaggcagag ccacccacgc 120cgccgcggcc ccacgctggg
cgacagagcc tccagttccc cttcaatggt ggcgggtcgc 180cggagctctg atcgccggga
acccttgccg ctgctgtcct gcgaccccaa gcaggtatag 240acacgtgtgg ccgtttacgc
tgtaggatcc tcattcccac tggctttgaa cattttgggg 300acttacaatg ccgccacccg
cggacatcgt caaggtggcc atagaatggc cgggcgccta 360ccccaaactc atggaaattg
atcagaaaaa accactgtct gcaataataa aggaagtctg 420tgatgggtgg tctcttgcca
accatgaata ttttgcactc cagcatgccg atagttcaaa 480cttctatatc acagaaaaga
accgcaatga gataaaaaat ggcactatcc ttcgattaac 540cacatctcca gctcagaacg
cccagcagct ccatgaacga atccagtcct cgagtatgga 600tgccaagctg gaagccctga
aggacttggc cagcctctcc cgggatgtca cgtttgccca 660ggagtttata aacctggacg
gtatctctct cctcacgcag atggtggaga gcggcactga 720gcgataccag aaattgcaga
agatcatgaa gccttgcttt ggagacatgc tgtccttcac 780cctgacggcc ttcgttgagc
tgatggacca tggcatagtg tcctgggata cattttcggt 840ggcgttcatt aagaagatag
caagttttgt gaacaagtca gccatagaca tctcgatcct 900gcagcggtcc ttggccattt
tggagtcgat ggtgctcaat agccatgacc tctaccagaa 960agtggcgcag gagatcacca
tcggccagct cattccacac ctgcaagggt cagatcaaga 1020aatccaaacc tatactattg
cagtgattaa tgcgcttttc ctgaaggctc ctgatgagag 1080gaggcaggag atggcgaata
ttttggctca gaagcaactg cgttccatca ttttaacaca 1140tgtcatccga gcccagcggg
ccatcaacaa tgagatggcg caccagctgt atgttctaca 1200agtgctcacc tttaacctcc
tggaagacag gatgatgacc aaaatggacc cccaggacca 1260ggctcagagg gacatcatat
ttgaacttcg aagaattgct tttgatgctg agtctgaacc 1320taacaacagc agtggcagca
tggagaaacg caagtccatg tacacgcgag attataagaa 1380gcttgggttc attaatcatg
tcaaccctgc catggacttc acgcagactc cacctgggat 1440gttggctctg gacaacatgc
tgtactttgc caagcaccac caagatgcct acatccggat 1500tgtgcttgag aacagtagtc
gagaagacaa gcatgaatgt ccctttggcc gcagtagtat 1560agagctgacc aagatgctat
gtgagatctt gaaagtgggc gagttgccta gtgagacctg 1620caacgacttc cacccgatgt
tcttcaccca cgacagatcc tttgaggagt ttttctgcat 1680ctgtatccag ctcctgaaca
agacatggaa ggaaatgagg gcaacttctg aagacttcaa 1740caaggtaatg caggtggtga
aggagcaggt tatgagagca cttacaacca agcctagctc 1800cctggaccag ttcaagagca
aactgcagaa cctgagctac actgagatcc tgaaaatccg 1860ccagtccgag aggatgaacc
aggaagattt ccagtcccgc ccgattttgg aactaaagga 1920gaagattcag ccagaaatct
tagagctgat caaacagcaa cgcctgaacc gccttgtgga 1980agggacctgc tttaggaaac
tcaatgcccg gcggaggcaa gacaagtttt ggtattgtcg 2040gctttcgcca aatcacaaag
tcctgcatta cggagactta gaagagagtc ctcagggaga 2100agtgccccac gattccttgc
aggacaaact gccggtggca gatatcaaag ccgtggtgac 2160gggaaaggac tgccctcata
tgaaagagaa aggtgccctt aaacaaaaca aggaggtgct 2220tgaactcgct ttctccatct
tgtatgactc aaactgccaa ctgaacttca tcgctcctga 2280caagcatgag tactgtatct
ggacggatgg actgaatgcg ctactcggga aggacatgat 2340gagcgacctg acgcggaatg
acctggacac cctgctcagc atggaaatca agctccgcct 2400cctggacctg gaaaacatcc
agatccctga cgcacctccg ccgattccca aggagcccag 2460caactatgac ttcgtctatg
actgtaactg aagtggccgg gcccagacat gccccttcca 2520aaactggaac acctagctaa
caggagagag gaatgaaaac acacccacgc cttggaaccg 2580tcctttggta aagggaagct
gtgggtccac attcccttca gcatcacctc tagccctggc 2640aactttcagc ccctagctgg
catcttgctc accgccctga ttctgttcct cggctccact 2700gcttcaggtc acttcccatg
gctgcagtcc actggtggga caagagcaaa gcccactgcc 2760agtaagaagg ccaaagggcc
cttccatcct agccctctgc aggcatgccc ttccttccct 2820tgggcaggaa agccagcagc
cccagactgc ccaaaaactt gcccaccaga ccaagggcag 2880tgccccaagg cccctgtctg
gaggaaatgg cctagctatt tgatgagaag accaaacccc 2940acatcctcct ttcccctctc
tctagaatca tctcgcacca ccagttacac ttgaattaag 3000atctgcgctc aaatctcctc
ccacctctct ccctgctttt gccttgctct gttcctcttt 3060ggtcccaaga gcagcagccg
cagcctcctc gtgatcctcc ctagcataaa tttcccaaac 3120agtccacagg tcccatgccc
actttgcgtc tgcactgtga tcgtgacaaa tcttccctcc 3180tcaccagcta gtctggggtt
tcctctccct gccccaggcc agaactgcct tcttcatttc 3240cacccacgct cccagcctct
tagctgaaag cacaaatggt gaaatcagta gtctcgctcc 3300atctctaata gactaaacct
aaatgcctct aggacggact gttgctatcc aagcgtttgg 3360tgttaccttc tcctgggagg
tcctgctgca actcaagttc cacaggatgg tcaagctgtc 3420agacatccaa gtttacatca
ttgtaattat tactggtatt tacaatttgc aagagttttg 3480ggttagtttt tttttttttt
tttgctttgt ttttgtacaa aagagtctaa cattttttgc 3540caaacagata tatatttaat
gaaaagaaga gatacataaa tgtgtgaatt tccagttttt 3600ttttaattat tttaatccca
aacatcttcc tgaaaataac attcccttaa acatgctgtg 3660gaataaaatg gattgtgatg
atttggaaaa aaaaaaaaaa aaaaaaaaaa aaaaaaaaaa 3720aaaaaaa
3727904654DNAHomo sapiens
90gcagcgtagc gggctggcgg tgacttacac cgggactcca gagggagaga ggaagcgctg
60caggccactt gcattgcgtc ttccaggctg cgtggacccg gcgccccggc gtgtgcggtt
120gtgggggagc tcgccgtggc ctcccctccc tctggcttta gcttcctttg gggttggcgc
180aggtgggcca ggcagcgcac cgcagatctc cccgttccca cgaaggctgg ctcgctgtct
240ctctccgagc gggagggacc atcctaaaaa tatgtaaata tccaagcgct ggctccaggc
300tggggcagct gccaaggtcc ccgcgccgcc gccgggtgtt ttacatgaaa atgagaagcc
360tgatgggaac cgcgttctaa cttaaggcag cctggtgatt agcatgagac tgggcggctg
420tcctgcttcc tgcccttcaa tagccgttcc gcgcgctcgc gccggagcag cgctgccgcc
480gcgcgggggt cgatcgcagg ctcggcgtcc ttggcagcca tggctccggc gccgcctcgg
540ccagtaagta ggagcatgca tgtgtagggg gcacatgcgt gtcggcgcac ccacccagcc
600atccacccgc gcgcacgcac agcgcccgga gcctcggcaa ggggaagatt gacgaggcgc
660tgcagtcgcg gggacgacgc gggctcttcc tggattccgc aggagcccgc ccgccgcagc
720tgctgtctgc agagcctgct cggatcctgt gcacacgcgc cccccgctcg agcctctgtg
780atgaagactg tctcccgggg actgcagcgg aggcagagcc agccagcgcc ggggactgcg
840ggccgtgcgg ctgataggcc cgcggggaca cgactcggac actgtcatcc ccacgcctcg
900cgctgagctg cccggcgcgg agggtctgcc gccgcccctc cggcctcccg cacgcccgat
960cccgggtcag ccccggaggc ctcggctgcc tcatttgttt gggtcttttg tgccgtggct
1020cccagttggc caagcactcc tgcgctgaat cgggccattg tctgcgctcc cattgccttc
1080acgctgcaag tctcggcgcc cccaccccgc ccgccccctc cccgcctcct cccggccggg
1140gagcctccta acgtgccttt ccccccagga atctggaagc tataagccgg gcggattgca
1200aatgaagtgt aatgcattgt gggacgtgtg taaaatcgga gccttcgccg tgggggtgtg
1260ggggggcgtg gggagggccg gacccgccgc tggcggtgta gacgccgacg aggaggggct
1320gggaaaatgt gcgcagagtc cgcccgggtc gtgcccgccg tagacggatg aaggagcgcg
1380ctgcgccccg gcgctgaggc cccgaggatc ggggcggcag gtcgccctcc ccaccatgaa
1440gaagacccgg agcacaacct tgcggcgagc ctggcctagc tcggatttct cggaccgggc
1500ctcggaccgc atgaggtccc gcagcgagaa ggactaccgc ctgcacaagc gtttccccgc
1560ggccttcgcg ccccaggctt cgcggggcta catgacatca ggtgatgtat cacccatcag
1620tatgtctccc atcagtcagt ctcagtttat tccactcggg gagatcctct gcttggccat
1680ctcagcaatg aactcggcaa gaaagcctgt cacccaagaa gcactgatgg agcacctgac
1740cacgtgcttc ccaggtgttc caacgccaag ccaagaaatt ctgcggcaca cgctgaacac
1800gctggtacgg gagaggaaga tctacccaac tccagatggc tacttcatcg tgaccccaca
1860gacttatttc ataactcctt ccctcataag aactaacagt aaatggtacc atttggacga
1920gaggatacct gaccggtctc agtgcacctc tccgcaaccc gggaccatca cgccctctgc
1980ctcaggctgt gtcagggaaa ggacattgcc ccgaaaccac tgcgactctt gccactgctg
2040cagagaagac gtgcacagca cgcatgcacc caccctgcaa aggaagtctg ccaaggactg
2100caaagaccct tactgtcccc cttctctgtg ccaggtgcca cccactgaaa agagcaaaag
2160tactgtaaat ttttcctata agacagaaac tctctcaaaa cctaaagata gtgaaaagca
2220gtcaaaaaaa ttcgggctaa agttattccg gttaagtttt aaaaaagaca agaccaaaca
2280gctggccaat ttttctgccc agtttcctcc tgaagagtgg cccctgcgag acgaggacac
2340gccagctacg atccctcggg aagtagagat ggaaatcatt aggcgcatta acccagacct
2400gaccgtggaa aatgtcatgc ggcacaccgc gctcatgaag aaactggaag aagaaaaggc
2460ccagaggagt aaagccgggt cctctgccca tcacagcgga aggagtaaaa agagtaggac
2520tcatcggaag tcccatggaa agtctcggtc tcacagcaag acacgggtgt ctaaaggaga
2580cccttccgac ggttcacatc tggatatccc agctgaaaga gagtatgact tttgtgatcc
2640tcttaccagg gtgcccaggg agggctgctt catcattgaa cacaaaggag ataacttcat
2700catgcacagc aacacaaacg tgctcgagtc ccacttcccc atgacaccag aatgggatgt
2760gtctggtgaa ttggctaaaa ggagaactga gatgcctttt cctgaacctt ctaggggaag
2820ctcccactca aaagtgcacc gaagccacag ccatacacag gaccggaggt ccaggaatga
2880gagatccaac aaagccaagg agagatccag gtcgatggat aactccaaag gccctctggg
2940tgcttcttct ctagggacgc cggaagacct tgctgaaggc tgcagccaag acgaccagac
3000ccccagccaa tcctacattg acgacagtac tttaaggcct gcacagaccg ttagtctcca
3060aagggctcac atttcgtcca caagctataa agaggtgtgt attccagaga tagtcagtgg
3120cagcaaggaa ccgtccagcg cttgcagcct tttggagcca ggaaaaccac ccgagagttt
3180gccatcctat ggcgaactca actcttgtcc aacaaaaaca gccacagatg actatttcca
3240gtgcaacacc tctagtgaga cggtgctcac ggcaccatca cctctgggaa agaataagga
3300ggaccatgac actctgactt tggcagaagg ggtgaaaaag ctctcccctt ctgataggca
3360ggtcccccac tcctccaggg agcctgtggg gcacaaggag gagtcaccaa aagggccggg
3420tgggggcccc gctgcttcgg gaggagtggc tgaagggatc gccaacggac gcctcgtcca
3480gcaccatggt gccgagccca gcagcttgga caagaggaaa gagatattta gcaaagacac
3540actgttcaaa cctcttcaca gcaccttgtc tgtaaacagc tatcacaagt cgagcctgtc
3600cctcctcaaa tctcacccga agacacctgc tgacacattg ccaggccgat gtgagaaact
3660ggaaccgtcc ctggggacct cggcggcaca agccatgcct gcttcccagc gtcagcagga
3720gtcaggaggg aaccaggaag cctcttttga ctattacaac gtctctgatg atgacgactc
3780tgaggaaggg gcaaacaaga acacagagga ggagaaaaat agagaggacg taggcaccat
3840gcagtggctc ctcgagcggg agaaggaaag agacttgcag aggaaatttg aaaagaacct
3900cacccttctt gctccaaaag aaaccgacag cagcagcaac cagagagcca cccattcagc
3960ccggctcgac agcatggaca gcagcagcat cacagtggac agtggattca actccccacg
4020tactcgggag agcctggctt ccaacacatc aagcattgtt gaaagtaacc gtcgtcagaa
4080ccccgctttg agcccggccc atggtggagc tggtccagcc ttcaacttcc gagcgagcgc
4140ggagcccccg acaaatgaag ctgagaagct acagaaacct tccaactgct tgcaagcttc
4200tgttactagc gtgtgattgt ccttctgcct cagatcttct gtctcattcg atacagcaaa
4260gtttacgaca ctgggactga tgtttacatc tttggaaaga caagcatctc aaccacagtt
4320tttgtgttta cttaaactgt gctgctaagt agggctaggg caaaaaaaca aaaaatcttt
4380atttcagagt attgcttttc acatttatgg ctctgtagca actgagtaac agtaggggtg
4440atatgtatac ttttgcttca ctaattgtat ctgagcacac ataggaaagt ctagacactg
4500taagtgtaat acgcattttc aatgtcatgc agttgccaat tccattttaa aatgccacag
4560atgcgtgttg ctcccagtct gtggttaaac ggtgccacag aactgatcct tgacacttcc
4620aaaaaaaaaa aaacaaaaca aaacaaaaaa aatt
4654912605DNAHomo sapiens 91gaatatcgca tccgggaact ctgcgcgccc atgcggagag
tcggagggcg agctgacgag 60gacgctacgg cggcgggaag tctgtgggtt ctggcaccac
ctgagcccac tgggcatctg 120gtcatccctg gcacctctcc tttggagcca ccttgtccct
ggctagacag tcacattttc 180cagtgccgtt ttggaaagat gttgcctttg gagaaggcgt
ttgcctcccc caggagctcc 240ccagccccgc cggatctgcc cacgccgggg tcagcagccg
gagtccagca ggaagaaccc 300gagaccatcc ctgagaggac ccctgctgac ctggagttct
cccgcctgcg tttccgggaa 360tttgtctacc aggaggctgc cgggccccac cagaccctgg
cccggctgca tgagctgtgc 420cgccagtggc tgatgcctga ggcgcgctcc aaggagcaga
tgctggagct gctggtgctg 480gagcagttcc tgggcatcct gcctgataag gtccggccct
gggtggtggc acagtaccct 540gagagctgca agaaggcagc ctccctggtg gagggcctcg
ctgatgtcct ggaagagcca 600gggatgctgc tgggctcccc tgcgggctca tcctcaattc
ttagcgatgg agtgtacgag 660aggcacatgg accctctgct gctaccaggc gagctcgcga
gccccagcca ggcccttgga 720gctggggaga tcccggcacc ttctgagaca ccctggcttt
ctccggaccc cctgtttctg 780gaacagagga gggtcagaga agcaaagacc gaagaggacg
gccctgccaa caccgagcag 840aagctgaagt cctttccaga ggaccctcag cacctggggg
agtggggcca cctggaccct 900gccgaggaga acctgaagag ctaccggaag ctgctcctgt
gggggtatca gctttcccag 960cctgacgctg cctccaggct ggacactgag gaactccggt
tggtggaaag agatccacaa 1020ggaagcagcc tcccagaagg cgggaggcgg caggagagcg
ctgggtgcgc ctgcgaggag 1080gccgcccccg cgggggtgct gcctgagctg cctacggagg
cgccccctgg ggacgccctt 1140gccgatcccc cgtcgggcac cactgaggag gaggaagagc
agcctgggaa ggccccggac 1200ccgcaggacc cccaggacgc ggagtccgac tctgccaccg
gatcgcagag gcagtccgtc 1260atccagcagc ctgccccgga caggggcacg gcgaaactgg
gaaccaagag gccgcacccc 1320gaggatgggg acgggcagag cctcgagggc gtctctagct
ccggcgacag cgcagggctg 1380gaggccgggc agggccctgg ggctgacgag ccgggcttgt
cccgcgggaa gccctatgcc 1440tgcggcgagt gcggggaggc cttcgcgtgg ctctcgcacc
tgatggagca ccacagcagc 1500catggcggcc ggaagcgcta cgcctgtcag ggctgctgga
agaccttcca cttcagcctg 1560gccctagccg agcaccagaa gacccacgag aaggagaaaa
gctacgcgct ggggggcgcc 1620cggggccccc aaccgtccac ccgcgaagcc caggcggggg
ctagggcggg cggtccccca 1680gagagcgtgg agggcgaggc tccccccgca cccccagagg
cgcagaggtg agccgctgtg 1740ctgtcccgtt ccggaggggc cgctttgccg gccgtgaatc
ccagacgagg cattgggcct 1800ttccacgccc ctgggtggcg gcttcctgtg gtgtttgtgg
acgtcctctg cctgtgccct 1860gaatccgctc ctgaggctaa gcgctcccaa cgagaagggt
ccacgggaag ccctcacctc 1920tgtaaacaca ccctgggcca gcgctcgcat ccgaggggag
ccgccggatg tggaagaaga 1980ctcggctttc ctgcagccat ttagtgccgc cccatgctag
gttatttgac attgtgcagt 2040gtagagttgc cttaaagtgc gtgatctgcc agtgctttct
tcaagtcacc cttgccccga 2100ttcctcctgt ttgcgctccc cagggttgct caagtggaaa
ttttgtcagc tgtttagcct 2160tttcgtactt ggcgtgatgt caacttcact tctaatctgc
aaaagcagaa gctgtttcct 2220agtttacctc gcgtgtgttt acctatatgg agtagctcgc
agagatcaca gaaatgcttg 2280cagcctaagg cagggttttc agaccgtggg tcccagccca
tttagtaaaa tgggaaatca 2340attagcaagt ggtcaccagc attacacagc aatgaagcag
aataaagtag gccagaatgc 2400atcatgtagt aaaggcaaat actgttttgt gaaacttttc
acccatacat ctaaatgtga 2460gaactggttg caatgtaaga catttcttgc tgggaagttg
tgagcaaaat aagttgaaaa 2520cactaataaa gatctgtctg tctgagcaaa ggagactaaa
ctccttgggc tacaaaaaaa 2580aaaaaaaaaa aaaaaaaaaa aaaaa
2605922389DNAHomo sapiens 92aggcgcggtt gtgagtagta
ccgggagtgg ggtgatcccg ggctagggga gcgcggcggc 60cgcgatcggg cttagtcgga
gctccgaagg gagtgactag gacacccggg tgggctactt 120ttcttccggt gcttttgctt
tttttttcct ttgggctcgg gctgagtgtc gcccactgag 180caaagattcc ctcgtaaaac
ccagagcgac cctcccgtca attgttgggc tcgggagtgt 240cgcggtgccc cgagcgcgcc
gggcgcggag gcaaagggag cggagccggc cgcggacggg 300gcccggagct tgcctgcctc
cctcgctcgc cccagcgggt tcgctcgcgt agagcgcagg 360gcgcgcgcga tgaaggcggt
gagcccggtg cgcccctcgg gccgcaaggc gccgtcgggc 420tgcggcggcg gggagctggc
gctgcgctgc ctggccgagc acggccacag cctgggtggc 480tccgcagccg cggcggcggc
ggcggcggca gcgcgctgta aggcggccga ggcggcggcc 540gacgagccgg cgctgtgcct
gcagtgcgat atgaacgact gctatagccg cctgcggagg 600ctggtgccca ccatcccgcc
caacaagaaa gtcagcaaag tggagatcct gcagcacgtt 660atcgactaca tcctggacct
gcagctggcg ctggagacgc acccggccct gctgaggcag 720ccaccaccgc ccgcgccgcc
acaccacccg gccgggacct gtccagccgc gccgccgcgg 780accccgctca ctgcgctcaa
caccgacccg gccggcgcgg tgaacaagca gggcgacagc 840attctgtgcc gctgagccgc
gctgtccagg tgtgcggccg cctgagcccg agccaggagc 900actagagagg gagggggaag
agcagaagtt agagaaaaaa agccaccgga ggaaaggaaa 960aaacatcggc caacctagaa
acgttttcat tcgtcattcc aagagagaga gaggaaagaa 1020aaatacaact ttcattcttt
ctttgcacgt tcataaacat tctacatacg tattctcttt 1080tgtctcttca tttataactg
ctgtgaattg tacatttctg tgttttttgg aggtgcagtt 1140aaacttttaa gcttaagtgt
gacaggactg ataaatagaa gatcaagagt agatccgact 1200ttagaagcct actttgtgac
caaggagctc aatttttgtt ttgaagcttt actaatctac 1260cagagcattg tagatatttt
ttttttacat ctattgttta aaatagatga ttataacggg 1320gcagagaact ttcttttctc
tgcaagaatg ttacatattg tatagataaa tgagtgacat 1380ttcataccat gtatatatag
agatgttcta taagtgtgag aaagtatatg ctttaataga 1440tactgtaatt ataagatatt
tttaattaaa tatttttttg taaatattat gtgtgtgttt 1500ttttttaatc tatgggaata
tttcttttgg aaaatcattt ttcagctcaa ttacagagct 1560cttgatatct tgaatgtctt
ttctgtttgg cctggctctt aatttgcttt tgttttgccc 1620agtatagact cggaagtaac
agttatagct agtggtcttg catgattgca tgagatgttt 1680aatcacaaat taaacttgtt
ctgagtccat tcaaatgtgt ttttttaaat gtagattgaa 1740atctttgtat ttgaagcata
catgttgaaa atacacctta tcagttttta agtacagggt 1800tttatagtgt aatatataca
gagtaagtgt ttgtttttgt ttttcaactg aggtcaaaat 1860ggattctgaa tgattttgca
tatgggatga ggaaatgctt ggatccttaa ggagtttacg 1920aaatctgctg ttttatcaaa
gtgaaaaaaa attgcttatt actcttcatt ttacactaaa 1980gcttaatgtc actaagtttc
atgtctgtac agattattta aatcatggaa atgaaaaaaa 2040tgttctctgc ttgctaccaa
aggacaaact cttggaaatg aacactttct gctttccttc 2100ctccaaagaa ttaataggca
acagtgggag aaaaaaaagg cataatggca aatccttcaa 2160gcagggataa aagtcgatct
tcaaacatta acttaagcag accaaaaatt ctgatgaccg 2220catctagatt atttttttat
aaaaatgatt ttcactatag ctatgttacg ctaagctact 2280gtcccatctc ttgtgatgtg
taacttttac atgtgaatat taaagtagat ttctctgtct 2340tgtaaaaaaa aaaaaaaaaa
aaaaaaaaaa aaaaaaaaaa aaaaaaaaa 2389933925DNAHomo sapiens
93attacgtgaa caaatagctg aggggcggcc gggccagaac ggcttgtgta actttgcaaa
60cgtgccagaa agtttaaaat ctctcctcct tccttcactc cagacactgc ccgctctccg
120ggactgccgc gccgctcccc gttgccttcc aggactgaga aaggggaaag ggaagggtgc
180cacgtccgag cagccgcctt gactggggaa gggtctgaat cccacccttg gcattgcttg
240gtggagactg agatacccgt gctccgctcg cctccttggt tgaagatttc tccttccctc
300acgtgatttg agccccgttt ttattttctg tgagccacgt cctcctcgag cggggtcaat
360ctggcaaaag gagtgatgcg cttcgcctgg accgtgctcc tgctcgggcc tttgcagctc
420tgcgcgctag tgcactgcgc ccctcccgcc gccggccaac agcagccccc gcgcgagccg
480ccggcggctc cgggcgcctg gcgccagcag atccaatggg agaacaacgg gcaggtgttc
540agcttgctga gcctgggctc acagtaccag cctcagcgcc gccgggaccc gggcgccgcc
600gtccctggtg cagccaacgc ctccgcccag cagccccgca ctccgatcct gctgatccgc
660gacaaccgca ccgccgcggc gcgaacgcgg acggccggct catctggagt caccgctggc
720cgccccaggc ccaccgcccg tcactggttc caagctggct actcgacatc tagagcccgc
780gaagctggcg cctcgcgcgc ggagaaccag acagcgccgg gagaagttcc tgcgctcagt
840aacctgcggc cgcccagccg cgtggacggc atggtgggcg acgaccctta caacccctac
900aagtactctg acgacaaccc ttattacaac tactacgata cttatgaaag gcccagacct
960gggggcaggt accggcccgg atacggcact ggctacttcc agtacggtct cccagacctg
1020gtggccgacc cctactacat ccaggcgtcc acgtacgtgc agaagatgtc catgtacaac
1080ctgagatgcg cggcggagga aaactgtctg gccagtacag catacagggc agatgtcaga
1140gattatgatc acagggtgct gctcagattt ccccaaagag tgaaaaacca agggacatca
1200gatttcttac ccagccgacc aagatattcc tgggaatggc acagttgtca tcaacattac
1260cacagtatgg atgagtttag ccactatgac ctgcttgatg ccaacaccca gaggagagtg
1320gctgaaggcc acaaagcaag tttctgtctt gaagacacat cctgtgacta tggctaccac
1380aggcgatttg catgtactgc acacacacag ggattgagtc ctggctgtta tgatacctat
1440ggtgcagaca tagactgcca gtggattgat attacagatg taaaacctgg aaactatatc
1500ctaaaggtca gtgtaaaccc cagctacctg gttcctgaat ctgactatac caacaatgtt
1560gtgcgctgtg acattcgcta cacaggacat catgcgtatg cctcaggctg cacaatttca
1620ccgtattaga aggcaaagca aaactcccaa tggataaatc agtgcctggt gttctgaagt
1680gggaaaaaat agactaactt cagtaggatt tatgtatttt gaaaaagaga acagaaaaca
1740acaaaagaat ttttgtttgg actgttttca ataacaaagc acataactgg attttgaacg
1800cttaagtcat cattacttgg gaaattttta atgtttatta tttacatcac tttgtgaatt
1860aacacagtgt ttcaattctg taattacata tttgactctt tcaaagaaat ccaaatttct
1920catgttcctt ttgaaattgt agtgcaaaat ggtcagtatt atctaaatga atgagccaaa
1980atgactttga actgaaactt ttctaaagtg ctggaacttt agtgaaacat aataataatg
2040ggtttatata tgtcatagca tagatgaatt tagaaacaat gctcctactg tttaaataca
2100tatggacaca tctggtgctg agaaagaaac aaacacatta ccattggtgt caagaaatat
2160tactatatag cagagaaatg gcaatacatg tactcagata gttacatccc tatataaaaa
2220gtatgtttac atttaaaaaa ttagtagata acttcctttc tttcaagtgc acaatttcat
2280tttgacttga gtcaactttt gttttggaac aaattaagta agggagctgc ccaatcctgt
2340ctgatatttc ttgaggctgc cctctatcat tttatctttc ccatgggcag agatgttgta
2400agtgggattc ttaatatcac cattcttggg actggtatac ataaggcagc cgtgaaactg
2460gaaagtcatt ttgatgactg atgtgataca tccagaggta aaatgcattt aaacatatta
2520aagtatttgc caaagataca attttcttgc tgacataaaa atcacacaaa caagtccccc
2580ccaaaccaca actgtctctc aaatagctta aaaaaattga aaaacatttt aggatttttc
2640aagttttcta gattttaaaa agatgttcag ctattagagg aatgttaaaa attttatatt
2700atctagaaca caggaacatc atcctgggtt attcaggaat cagtcacaca tgtgtgtgtg
2760tctgagatat agtctaaatt agcaaagcac atagtattac atacttgagg ggttggtgaa
2820caaaggaaaa atatactttc tgcaaaacca aggactgtgc tgcgtaatga gacagctgtg
2880atttcatttg aaactgtgaa accatgtgcc ataatagaat tttgagaatt ttgcttttac
2940ctaaattcaa gaaaatgaaa ttacactttt aagttagtgg tgcttaagca taatttttcc
3000tatattaacc agtattaaaa tctcaagtaa gattttccag tgccagaaca tgttaggtgg
3060aattttaaaa gtgcctcggc atcctgtatt acatgtcata gaattgtaaa gtcaacatca
3120attactagta atcattctgc actcactggg tgcatagcat ggttagaggg gctagagatg
3180gacagtcatc aactggcgga tatagcggta catatgatcc ttagccacca gggcacaagc
3240ttaccagtag acaatacaga cagagctttt gttgagctgt aactgagcta tggaatagct
3300tctttgatgt acctctttgc cttaaattgc tttttagttc taagattgta gaatgatcct
3360ttcaaattgt aatcttttct aacagagata ttttaatata cttgctttct taaaaaacaa
3420aaaaactact gtcagtatta atactgagcc agactggcat ctacagattt cagatctatc
3480attttattga ttcttaagct tgtattaaaa actaggcaat atcatcatgg atacatagga
3540gaagacacat ttacaatcat tcattgggcc ttttatctgt ctatccatcc atcatcattt
3600gaaggcctaa tatatgccaa gtactcacat ggtatgcatt gagacataaa aaagactgtc
3660tataacctca ataagtatta aaaatcccat tattacccat aaggttcatc ttatttcatt
3720tttagggaat aaaattacat gtctatgaaa tttcaatttt aagcactatt gtttttcatg
3780accataattt atttttaaaa ataaattaaa ggttaattat atgcatgtat gtatttctaa
3840taattaaaaa tgtgttcaat ccctgaaatg tctgcctttt aaatataaca cctactattt
3900ggttaaaaaa aaaaaaaaaa aaaaa
3925942344DNAHomo sapiens 94aaaatcgatt gctctctgcc acaaaccgga gacccttctt
gggcgatccg ctttctcagc 60atgtggaagg tttttctctc tctcttcttt ttctactaaa
ccttccgctc ctaaacccat 120tcctcgtgtg tatccctgtc ctgaattctt tctcgaccat
gacaaagaac cagcttccac 180tgcagagagg tccattccaa ctgctcagat gaagctgaaa
agagcccgac tcgccgatga 240tctcaatgaa aaaattgctc tacgaccagg gccactggag
ctggtggaaa aaaacattct 300tcctgtggat tctgctgtga aagaggccat aaaaggtaac
caggtgagtt tctccaaatc 360cacggatgct tttgcctttg aagaggacag cagcagcgat
gggctttctc cggatcagac 420tcgaagtgaa gacccccaaa actcagcggg atccccgcca
gacgctaaag cctcagatac 480cccttcgaca ggttctctgg ggacaaacca ggatcttgct
tctggctcag aaaatgacag 540aaatgactca gcctcacagc ccagccacca gtcagatgcg
gggaagcagg ggcttggccc 600ccccagcacc cccatagccg tgcatgctgc tgtaaagtcc
aaatccttgg gtgacagtaa 660gaaccgccac aaaaagccca aggaccccaa gccaaaggtg
aagaagctta aatatcacca 720gtacattccc ccagaccaga aggcagagaa gtcccctcca
cctatggact cagcctacgc 780tcggctgctc cagcaacagc agctgttcct gcagctccaa
atcctcagcc agcagcagca 840gcagcagcaa caccgattca gctacctagg gatgcaccaa
gctcagctta aggaaccaaa 900tgaacagatg gtcagaaatc caaactcttc ttcaacgcca
ctgagcaata cccccttgtc 960tcctgtcaaa aacagttttt ctggacaaac tggtgtctct
tctttcaaac caggcccact 1020cccacctaac ctggatgatc tgaaggtctc tgaattaaga
caacagcttc gaattcgggg 1080cttgcctgtg tcaggcacca aaacggctct catggaccgg
cttcgaccct tccaggactg 1140ctctggcaac ccagtgccga actttgggga tataacgact
gtcacttttc ctgtcacacc 1200caacacgctg cccaattacc agtcttcctc ttctaccagt
gccctgtcca acggcttcta 1260ccactttggc agcaccagct ccagcccccc gatctcccca
gcctcctctg acctgtcagt 1320cgctgggtcc ctgccggaca ccttcaatga tgcctccccc
tccttcggcc tgcacccgtc 1380cccagtccac gtgtgcacgg aggaaagtct catgagcagc
ctgaatgggg gctctgttcc 1440ttctgagctg gatgggctgg actccgagaa ggacaagatg
ctggtggaga agcagaaggt 1500gatcaatgaa ctcacctgga aactccagca agagcagagg
caggtggagg agctgaggat 1560gcagcttcag aagcagaaaa ggaataactg ttcagagaag
aagccgctgc ctttcctggc 1620tgcctccatc aagcaggaag aggctgtctc cagctgtcct
tttgcatccc aagtacctgt 1680gaaaagacaa agcagcagct cagagtgtca cccaccggct
tgtgaagctg ctcaactcca 1740gcctcttgga aatgctcatt gtgtggagtc ctcagatcaa
accaatgtac tttcttccac 1800atttctcagc ccccagtgtt cccctcagca ttcaccgctg
ggggctgtga aaagcccaca 1860gcacatcagt ttgcccccat cacccaacaa ccctcacttt
ctgccctcat cctccggggc 1920ccagggagaa gggcacaggg tctcctcgcc catcagcagc
caggtgtgca ctgcacagaa 1980ctcaggagca cacgatggcc atcctccaag cttctctccc
cattcttcca gcctccaccc 2040gcccttctct ggagcccaag cagacagcag tcatggtgcc
gggggaaacc cttgtcccaa 2100aagcccatgt gtacagcaaa agatggctgg tttacactct
tctgataagg tggggccaaa 2160gttttcaatt ccatccccaa ctttttctaa gtcaagttca
gcaatttcag aggtaacaca 2220gcctccatcc tatgaagatg ccgtaaagca ggtaaccatg
tgatttgttc tttatggaag 2280aatagactga ctcaatgaac agacattgtt tgatatgatt
aaacttcacg cagtttgtaa 2340attc
23449521DNAArtificial Sequenceprimer 95ggttcgttta
ttttgggttt c
219620DNAArtificial Sequenceprimer 96tccgatcacc cctacatacg
209726DNAArtificial Sequenceprimer
97gagggaggta gtttattttt attgtt
269821DNAArtificial Sequenceprimer 98aaaaaccaaa ctcctcaacc a
219923DNAArtificial Sequenceprimer
99aaggggtcgt ttttattttc gtc
2310021DNAArtificial Sequenceprimer 100tcttcccgaa acaccaacac g
2110126DNAArtificial Sequenceprimer
101aagagggtgt gatatagatg ttaagt
2610220DNAArtificial Sequenceprimer 102cttcccaaaa caccaacaca
2010320DNAArtificial Sequenceprimer
103tcgtgtttgg tttgtaaggc
2010421DNAArtificial Sequenceprimer 104gatctcacat tcgataaccc g
2110523DNAArtificial Sequenceprimer
105tgtgtttggt ttgtaaggtg tgt
2310626DNAArtificial Sequenceprimer 106aaacaaaatt caaatcaaca tataca
2610720DNAArtificial Sequenceprimer
107tgagagtagc ggtagtcggc
2010820DNAArtificial Sequenceprimer 108aaaaactcta tcgcccaacg
2010925DNAArtificial Sequenceprimer
109agaggaagtg agagtagtgg tagtt
2511022DNAArtificial Sequenceprimer 110ccaacataaa accacaacaa ca
2211122DNAArtificial Sequenceprimer
111tgagaagttt gatgggaatc gc
2211220DNAArtificial Sequenceprimer 112acgacaacgc tactccgacg
2011322DNAArtificial Sequenceprimer
113tgagaagttt gatgggaatt gt
2211422DNAArtificial Sequenceprimer 114tccaacacaa acacacaaaa ca
2211526DNAArtificial Sequenceprimer
115gttatttcgg ttatattgtt tttcgc
2611620DNAArtificial Sequenceprimer 116acccgaccaa aaaccaaacg
2011725DNAArtificial Sequenceprimer
117tgttgttgtt ttgtgttgtt atttt
2511821DNAArtificial Sequenceprimer 118cataatccca tctcccaaac a
2111926DNAArtificial Sequenceprimer
119ttcgttgtta tggtgtttaa aatgac
2612023DNAArtificial Sequenceprimer 120gaactacgac tcccacaata ccg
2312123DNAArtificial Sequenceprimer
121ggatgttggg aggttatatt tgt
2312224DNAArtificial Sequenceprimer 122acctacacac taaacctcac caca
2412322DNAArtificial Sequenceprimer
123tgttgtagag tttcgagttt gc
2212421DNAArtificial Sequenceprimer 124tcctcactaa ccataacgac g
2112526DNAArtificial Sequenceprimer
125gagtgtgttg tttgttagtt ttttgt
2612620DNAArtificial Sequenceprimer 126acctcctcac accacaacca
20
User Contributions:
Comment about this patent or add new information about this topic:
 |  |
 |  |
 |  |
 |  |
 | 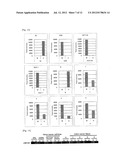 |
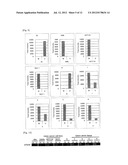 | 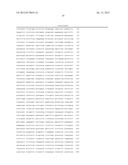 |
 | 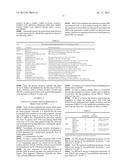 |
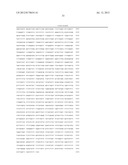 | 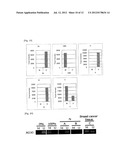 |
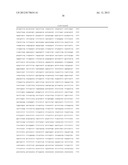 |  |
 | 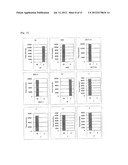 |
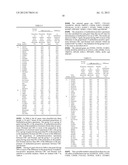 |  |
 |  |
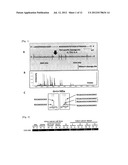 | 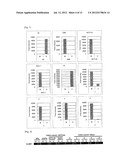 |
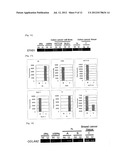 | 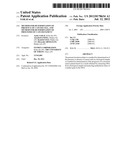 |
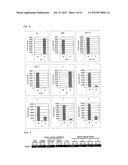 |  |
 |  |
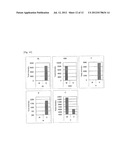 |  |
 |  |
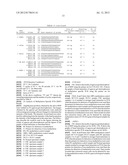 |  |
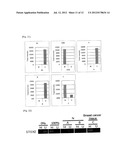 |  |
 |  |
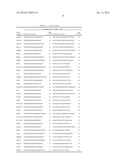 | 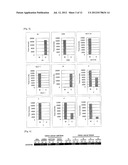 |
 |  |
 |  |
 |  |
 |  |
 |  |
 | 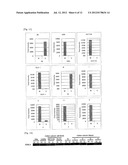 |
 |
| Similar patent applications: | |
| Date | Title |
|---|---|
| 2012-07-12 | Identifying circulating tumor cells (ctcs) using cd146 in breast cancer patients |
| 2011-12-15 | Method and tools for prognosis of cancer in her2+partients |
| 2012-08-30 | Determination of 17q gain in neuroblastoma patients by analysis of circulating dna |
| 2011-06-23 | Method and system for determination of molecular interaction parameters |
| 2011-12-08 | Diagnosis and prognosis of breast cancer patients |
| New patent applications in this class: | |
| Date | Title |
|---|---|
| 2019-05-16 | Methods for genome assembly and haplotype phasing |
| 2019-05-16 | Molecular tag attachment and transfer |
| 2018-01-25 | Monitoring health and disease status using clonotype profiles |
| 2018-01-25 | Sequence based genotyping based on oligonucleotide ligation assays |
| 2018-01-25 | Systems and methods for epigenetic sequencing |
| Top Inventors for class "Combinatorial chemistry technology: method, library, apparatus" | |
| Rank | Inventor's name |
|---|---|
| 1 | Mehdi Azimi |
| 2 | Kia Silverbrook |
| 3 | Geoffrey Richard Facer |
| 4 | Alireza Moini |
| 5 | William Marshall |